 Lingling Wan1
 Di Liang
 Yongdong Guo
 Baoen Shan
- 1Cancer Institute, The Fourth Hospital of Hebei Medical University/The Tumor Hospital of Hebei Province, Shijiazhuang, China
- 2Department of Thoracic Surgery, The Fourth Hospital of Hebei Medical University/The Tumor Hospital of Hebei Province, Shijiazhuang, China
Background: Lung cancer is a malignant tumor that has the highest morbidity and mortality rate among all cancers. Early diagnosis of lung cancer is a key factor in reducing mortality and improving prognosis.
Methods: In this study, we performed CTC next-generation sequencing (NGS) in early-stage lung cancer patients to identify lung cancer-related gene mutations. Meanwhile, a serum liquid chromatography-tandem mass spectrometry (LC-MS) untargeted metabolomics analysis was performed in the CTC-positive patients. To screen potential diagnostic markers for early lung cancer.
Results: 62.5% (30/48) of lung cancer patients had ≥1 CTC. By CTC NGS, we found that > 50% of patients had 4 commonly mutated genes, namely, NOTCH1, IGF2, EGFR, and PTCH1. 47.37% (9/19) patients had ARIDH1 mutations. Additionally, 30 CTC-positive patients and 30 healthy volunteers were subjected to LC-MS untargeted metabolomics analysis. We found 100 different metabolites, and 10 different metabolites were identified through analysis, which may have potential clinical application value in the diagnosis of CTC-positive early-stage lung cancer (AUC >0.9).
Conclusions: Our results indicate that NGS of CTC and metabolomics may provide new tumor markers for the early diagnosis of lung cancer.
Introduction
According to statistics provided by the International Agency for Research on Cancer (IARC) of the World Health Organization, there were approximately 2.09 million new cases of lung cancer and approximately 1.76 million deaths from lung cancer worldwide in 2018 (1). Both the morbidity and mortality rank first among cancers, and the 5-year survival rate of lung cancer at stage IV is only 6% (2). The main reason for this high mortality is that early-stage lung cancer lacks typical clinical symptoms, and when it is diagnosed, it is often already in the advanced stage, or even has metastases. Therefore, early diagnosis of lung cancer is a key factor in reducing cancer-related death and improving prognosis. At present, the commonly used diagnostic strategies for lung cancer include imaging, such as computed tomography, sputum exfoliation cytology, serum tumor markers and bronchoscopy, which can easily result missed diagnoses and misdiagnosis. Therefore, it is urgently important to identify new biomarkers for the early diagnosis of lung cancer.
Circulating tumor cell (CTC) refers to tumor cells derived from tumor tissue that enter the peripheral blood circulation. Even in the early stage of tumor, tumor cells may flow into the circulatory system. Therefore, CTC is an important marker for liquid biopsy and can be used as a non-invasive and real-time monitoring tool for tumors to detect micrometastases (3, 4). A French study showed that CTC could be employed to detect early-stage lung cancer 4-5 years earlier than Low-Dose Computed Tomography (LDCT) in chronic obstructive pulmonary disease (COPD) patients (5). In the past 10 years, the clinical application of CTC has primarily focused on the number of CTCs (6, 7). In recent years, single-cell sequencing of CTC was performed by next-generation sequencing (NGS) technology, which provided a novel and precise tool for CTC research (8, 9). Our previous research (10) showed that LDCT combined with CTC may be a more effective method for early-stage lung cancer screening. Through NGS analysis of CTC, we identified three cancer-related genes KIT, SMARCB1 and TP53 in five CTC positive patients.
During the development of tumors, metabolites in the body change. More recently, researchers have turned to metabolomics to analyse specific metabolic markers for the early diagnosis of lung cancer (11). Untargeted metabolomics can qualitatively indentify differential metabolites between different groups, thereby screening potential disease markers. A clinical study on the early diagnosis of lung cancer, including 65 non-smoking female non-small cell lung cancer (NSCLC) patients, 6 benign lung tumors patients, and 65 healthy controls, determine that cysteine, serine and 1-monooleoylglycerol, as a biomarker panel, can be used to diagnose non-smoking female NSCLC (12). Musharraf et al. analysed the plasma of lung cancer patients, COPD patients, healthy smokers and healthy non-smokers using GC-MS technology and observed that the fatty acid and glucose levels of lung cancer patients were higher than those of patients in other groups (13). Research by Ding et al. suggests that glucose metabolism disorders may be closely related to lung cancer, as indicated by the presence of such metabolites as glycerol phosphate, lactic acid, acetyl-CoA, and 3-phosphoglycerate (14). However, the accuracy and reliability of the identification of metabolites are low, and no efficient diagnostic markers for lung cancer have been found.
Recent studies have verified that changes in cancer cell metabolites regulate the tumor microenvironment (15, 16), which is very important in the occurrence and development of tumors, because it has the role of connecting genotype and phenotype (17). As early as 1889, Paget proposed that the organ microenvironment (“soil”) can affect the planting, invasion, survival, and growth of specific tumor cells (“seeds”). In addition, CTC can survive in the peripheral blood through the immune escape mechanism and as latent tumor-initiating seeds that eventually break out to replace the host tissue (18). CTC exists in the early stages of cancer and can be detected earlier than imaging (19), and can be used for early diagnosis of cancer (20). Guo et al.’s study explored the role of CTC detection and metabolomics profiles in the prediction of early recurrence of lung cancer (21). In addition, CTC is a complete tumor cell, carrying all the information of the tumor, such as RNA, DNA, proteins, sugars, lipids and so on. The CTC of patients with gastric cancer or colorectal cancer has different single-cell metabolism profiles and is a potential biomarker for identifying specific cancer types (22). Certain lipid metabolites can be used to distinguish patients with lung cancer from patients with benign lung diseases (23). But so far, there is no relevant research to explore the correlation between CTC and metabolomics in cancer diagnosis. In this study, we performed CTC NGS and LC-MS untargeted metabolomics analyses in early-stage lung cancer patients, to identify lung cancer-related gene mutations and metabolites in CTC-positive patients, and analyze the value of early diagnosis of lung cancer.
Materials and Methods
Patients
A total of 48 pathologically diagnosed as lung cancer patients were enrolled in this study from the Fourth Hospital of Hebei Medical University from Dec 2018 to Jan 2019. All these patients and healthy controls were volunteers from LDCT lung cancer screening from HeBei Province (10, 24). None of the patients received preoperative radiotherapy or chemotherapy. Among the diagnosed lung cancer patients, 21 were male, and 27 were female. The age range was 38-75 years with an average age of 59.1 years. Postoperative pathology showed that all lung cancer patients were NSCLC, and 3 squamous cell carcinomas, 45 adenocarcinomas. According to the eighth edition of the TNM staging criteria, 41 cases were stage I, and 7 cases were stage IIa. And in this study, combined with clinical experience, we defined these I/IIa patients as early-stage lung cancer. All patients underwent CTC in vivo before surgery, and peripheral blood was taken for metabolomic detection. Meanwhile, 30 healthy controls were enrolled in the group, and their personal characteristics, such as gender, age, and smoking history, matched those of the lung cancer group, there was no significance. Approval was obtained from the Forth Hospital of Hebei Medical University ethics committee (Shijiazhuang, Hebei, China), and written informed consent was obtained from all the patients.
Circulating Tumor Cell Analysis
CTC Capture and CTC PD-L1 Identifcation
The CellCollector® (GILUPI GmbH, Potsdam, Germany) is a medical stainless-steel wire with a 2 cm functional area coated with EpCAM antibodies and hydrogel coatings. CellCollector® was punctured into the peripheral blood of the cubital vein through a 20G indwelling needle and was held in the body for 30 minutes to capture tumor cells. After the collection of CTC was completed, the CellCollector® with captured CTC is stained and identified according to the instructions of the staining kit, and a negative control (NK92 cells, Culture Collection of the Chinese Academy of Sciences, Shanghai, China) and positive control (SK-BR-3 cells, Culture Collection of the Chinese Academy of Sciences, Shanghai, China) were also provided. CD45 (Exbio, Clone Mem-28-Alexa647) antibody, cytokeratin 7/19/pan-CK antibody (Exbio Praha, Clone A53-B/A2-Alexa488) and PD-L1 (Clone PD-L1, Abcam) antibody staining analysis was performed, and nuclear staining was subsequently performed by Hoechst 33342 (Sigma) to identify tumor cells and analyse the expression of PD-L1 in CTC.
Whole Genomic Amplification and Next Generation Sequencing of CTC
After identifying CTCs by immunofluorescence staining, the CTC area under the microscope was located and sheared. A small portion of the CTCs contained in the sampling needle was collected into a PCR tube, and the MALBAC method was employed to perform whole-genome amplification. Qubit 3.0 and Nanodrop 2000 (Thermo Fisher) were used for quantitative analysis. The eligibility criteria were as follows: Qubit 3.0>10 ng/μl, ND 2000>40 ng/μl. Quantitative PCR (ABI7500) was employed to detect the coverage of some tumor driver gene fragments. Each amplified sample was tested for coverage of 8 different segments, and 5 or more coverages were qualified. If both the output and the coverage were observed to meet the requirements, the amplification product was determined to pass the inspection.
In total, 50 ng of genomic DNA (Nanodrop concentration as the standard) was used to construct sequencing libraries using the Ion Ampliseq Library Kit 2.0 (Thermo Fisher) and Ion Ampliseq Cancer Hotspot Panel v2 in keeping with the manufacturer’s instructions. Then, quality inspection and next-generation sequencing (NGS) were performed. NGS was performed with HiSeq X Ten (Illumina) following the manufacturer’s protocols using a paired-end 150-bp (PE150) sequencing strategy with a 127-gene panel.
Metabolomics Analysis
Sample Preparation for Metabolomics
Thirty CTC-positive lung cancer patients were selected for fasting blood sampling. 5mL whole blood was collected into a sterile coagulation BD vacuum blood collection tube, immediately mix upside down for 5-8 times, place at 4°C for 30-120min, and centrifuge at 4°C 1300g for 10min, and transfer 0.2-1mL serum to 1.5mL EP tubes, saved at -80°C. Meanwhile, the 30 healthy volunteers were also took for fasting blood sampling, and serum preparation same as lung cancer group.
A 100-μL serum sample was collected, and the metabolite was extracted with 400 μL methanol:acetonitrile (1:1, v/v) solution. The mixture was vortexed for 30 seconds and sonicated on ice for 10 min, and this step was repeated 3 times. The sample was placed at -20°C for 30 min. After centrifugation at 13000 g at 4°C for 15 min, the supernatant was carefully transferred to a sample bottle for LC-MS/MS analysis.
Metabolite Detection
Metabolites were analyzed using the UPLC-Triple-TOF-MS-based platform (AB SCIEX, USA). The chromatographic separation of metabolites was performed using an ExionLCTMAD system (AB Sciex, USA) equipped with ACQUITY UPLC BEH C18 column (100 mm × 2.1 mm i.d., 1.7 μm; Waters, Milford, USA). Mobile phase A is water (containing 0.1% formic acid), mobile phase B is acetonitrile/isopropanol (1/1) (containing 0.1% formic acid); the flow rate is 0.40 mL/min, the injection volume is 20 μL, and the column temperature is 40 °C.
As part of the system adjustment and quality control process, a combined quality control sample (QC) was prepared by mixing all samples of equal volume. QC samples were injected at regular intervals (every 9 samples) to monitor the stability of the analysis. QC samples were treated and tested in the same way as analytical samples. It was preferable to represent the entire sample set, and to monitor the stability of the analysis.
Data Preprocessing and Annotation
After UPLC-TOF/MS analysis, the raw data were imported into Progenesis QI 2.3 (Waters Corporation, Milford, USA) for peak detection and comparison. The preprocessing result generated a data matrix consisting of retention time (RT), mass-to-charge ratio (m/z) values and peak intensity. At least 50% of the metabolic characteristics detected in all samples were retained. After filtering, half of the lowest metabolite value of a specific metabolite was estimated. In these specific samples, the metabolite level fell below the lower limit of quantification, and each metabolite characteristic was normalized by the sum (25). QC samples were used for data quality control, and delete the variables with the relative standard deviation (RSD) of quality control sample > 30% to obtain the final data matrix for subsequent analysis.
By matching with the database (http://www.hmdb.ca/, https://metlin.scripps.edu/), the metabolite list and data matrix were finally obtained. Differential metabolites were analyzed by Principal component analysis (PCA) and Orthogonal partial least squares discriminate analysis (OPLS-DA). The model validity was evaluated from model parameters R2 and Q2, which provide information for the interpretability and predictability, respectively, of the model and avoid the risk of over-fitting. Variable importance in the projection (VIP) were calculated in OPLS-DA model. P- values were estimated with paired Student’s t-test on Single dimensional statistical analysis. T-test combined with multivariate analysis OPLS-DA method was used to screen out the differential metabolites between groups (while meeting VIP >1, P-value <0.05).
Moreover, the classification information of differential metabolites was further obtained by comparing with HMDB 4.0 database (http://www.hmdb.ca/). And mapped into their biochemical pathways through metabolic enrichment and pathway analysis based on database search (KEGG, http://www.genome.jp/kegg/), so as to evaluate its influence on the biological metabolism process.
Statistical Analysis
The data were analyzed by SPSS 22.0 software. The measurement data followed the normal distribution using the mean ± standard deviation, those not following the normal distribution used the median (quartile), and the counting data used frequency or rate. A t-test was used for the comparison of measurement data in a normal distribution, and a rank sum test was used for the comparison of measurement data in a non-normal distribution. The chi-square test was used to compare counting data. ROC curves were used to analyze the diagnostic effect of different indexes on lung cancer. P-values < 0.05 were considered to be significant.
Results
CellCollector®In Vivo CTC Detection
A total of 30 of 48 patients had ≥1 CTC detected with the CellCollector® in vivo strategy, and the detection rate was 62.5% (range, 0-17, median, 1). Figure 1A is a representative diagram of CTC capture. No CTC was detected in healthy controls (Figure 1B). The detection rates of CTC were 64% (16/25) and 60.86% (14/23) in the <60-year-old patients and ≥ 60-year-old patients, respectively. The detection rates among male and female patients were 66.67% (14/21) and 59.26% (16/27), respectively. Regardless of whether the patients smoked, the detection rate was equivalent, 63.33% and 61.11%, respectively. In addition, we also found that the detection rate of stage I lung cancer patients was 65.85% (27/41), and the detection rate of stage II patients was 42.86% (3/7) (Figure 1D). Figure 1E is the distribution of the number of CTCs in I/II patients, there was no correlation between the number of CTC and stage (Figure 1E). There was no correlation between CTC and clinical characteristics (Table 1). Meanwhile, PD-L1 protein was detected and 52.08% (25/48) of patients had PD-L1 expression on CTC (Figure 1C).
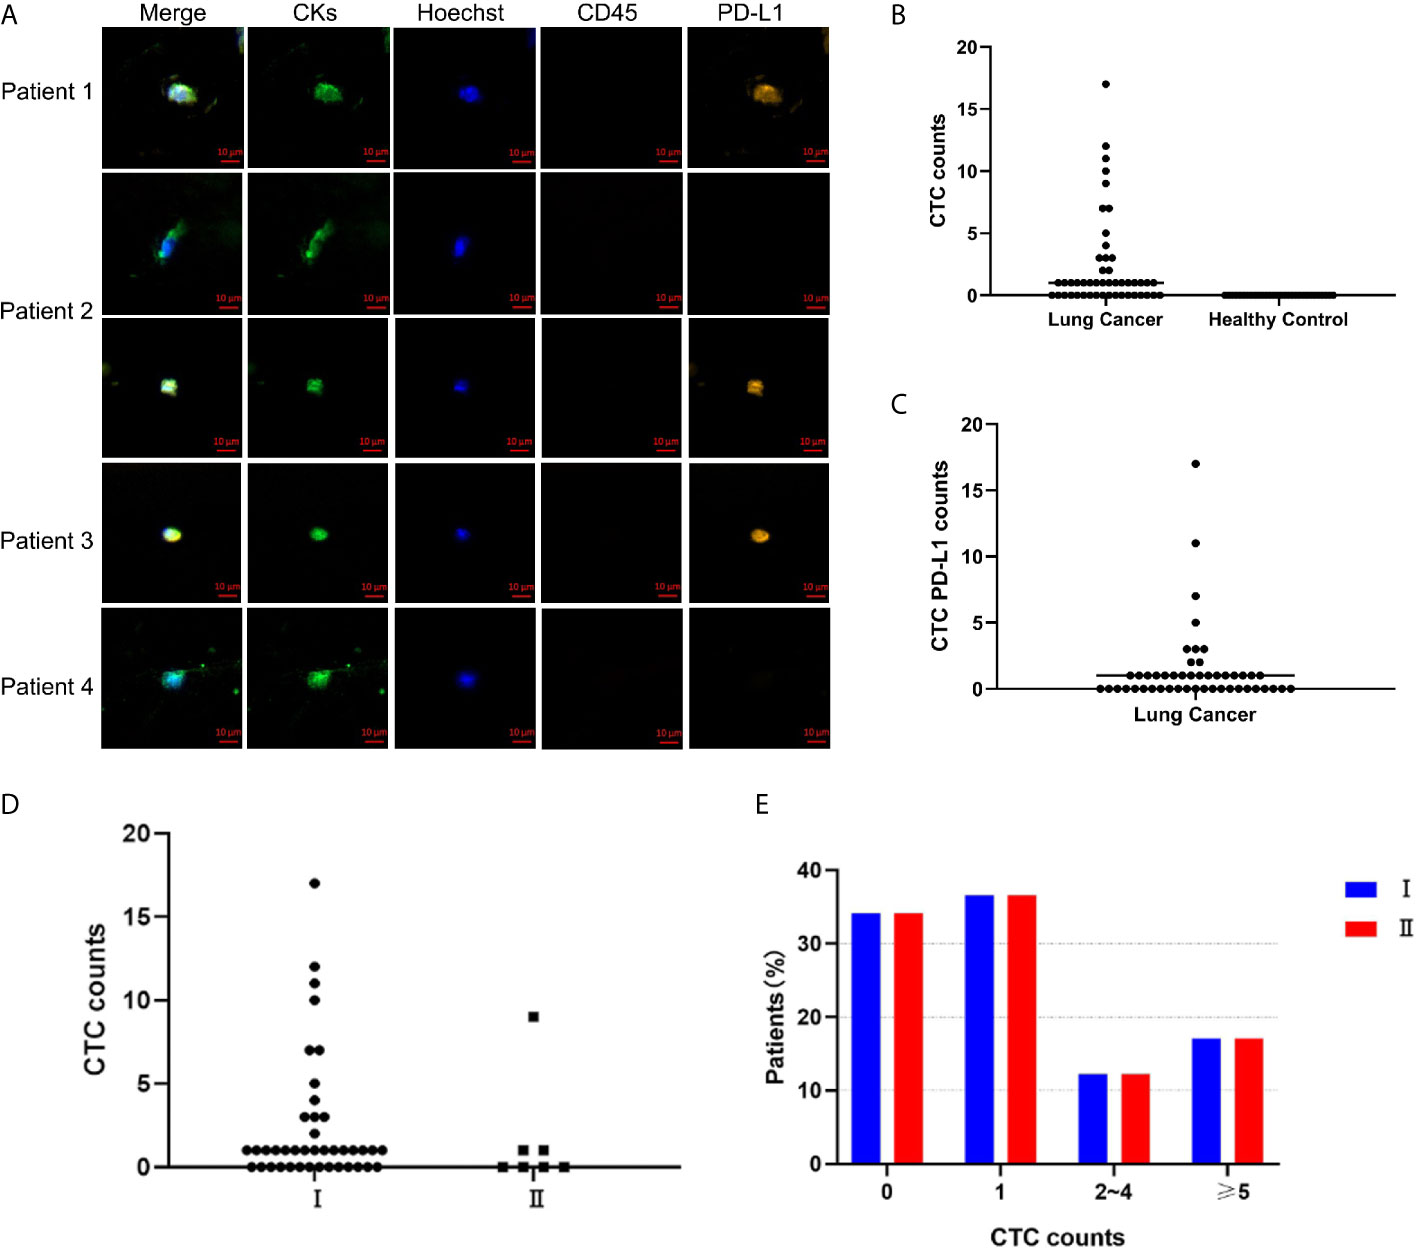
Figure 1 CellCollector captures representative CTC graphs and CTC and CTC PD-L1 detection. (A) CellCollector captures CTC identification charts. Patient 1 captures 7 CTCs, patient 2 captures 3 CTCs, patients 3 and 4 capture 1 CTC. (B) Detection rate and number of CTC in lung cancer patients and healthy controls. (C) Detection rate of PD-L1+ CTC in patients with lung cancer. (D) Detection rate and number of CTC in stage I and stage II lung cancer patients. (E) Distribution of detected CTCs in stage I and stage II patients.
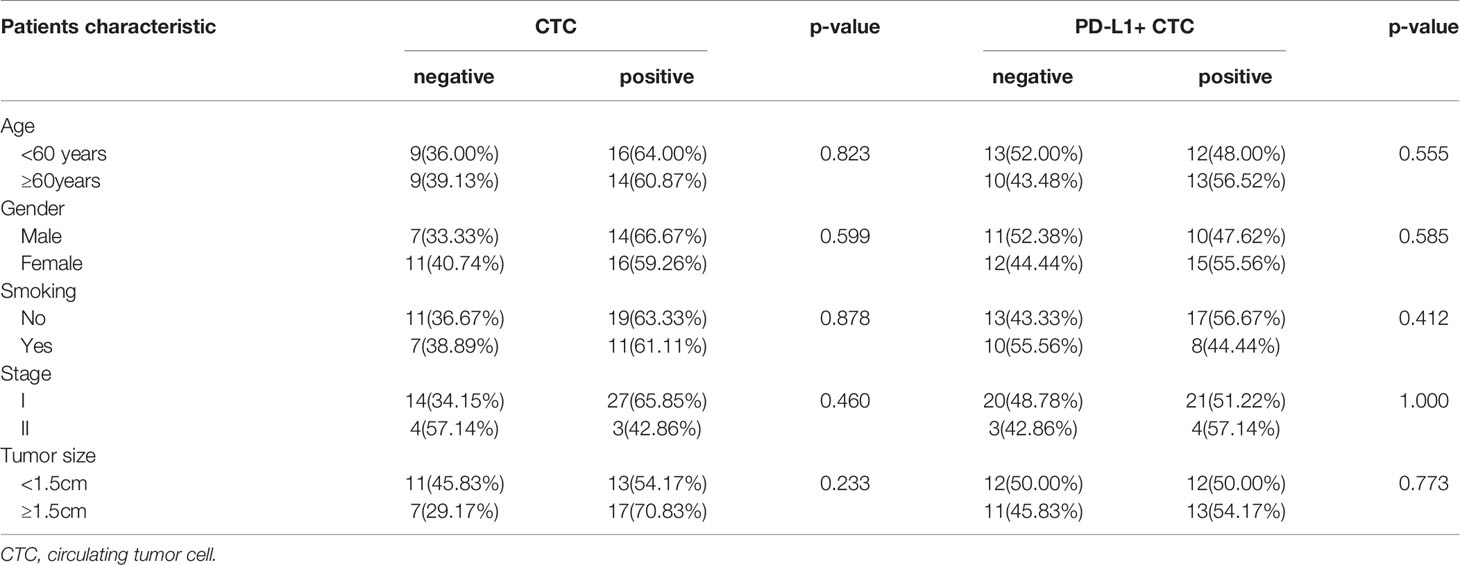
Table 1 Clinical characteristics of patients.
Next Generation Sequencing of CTC
Preamplification and quality inspection were performed on 30 patients with CTC. 19 randomly selected samples were qualified for quality inspection. NGS was performed to analyze 127 cancer-related mutated genes (Figure S1). The gene mutation rate of 19 patients was 48.2% to 74.8%, among which 4 patients had a gene mutation rate of >70%, 12 patients had a gene mutation rate between 60% and 70%, 2 patients had a gene mutation rate between 50% and 60%, and 1 patient had a gene mutation rate below 50% (Figure 2A). To explore whether the lung cancer-related mutant genes could be screened early by CTC gene detection, we conducted a common mutation analysis on 19 CTC sequencing samples. According to the proportion of patients with common genetic mutations, we are divided into 3 groups, which are >10%, >30% and >50% (Figure 2B and Table 2). Among these groups, >50% of patients had 4 common mutation genes, namely, NOTCH1, IGF2, EGFR and PTCH1. 47.37% (9/19) of patients had mutated ARID1A. Gene information and mutation sites are shown in Table 2. Based on analysis of the COSMIC database, NOTCH1 and ARID1A are reported to be associated with lung cancer.
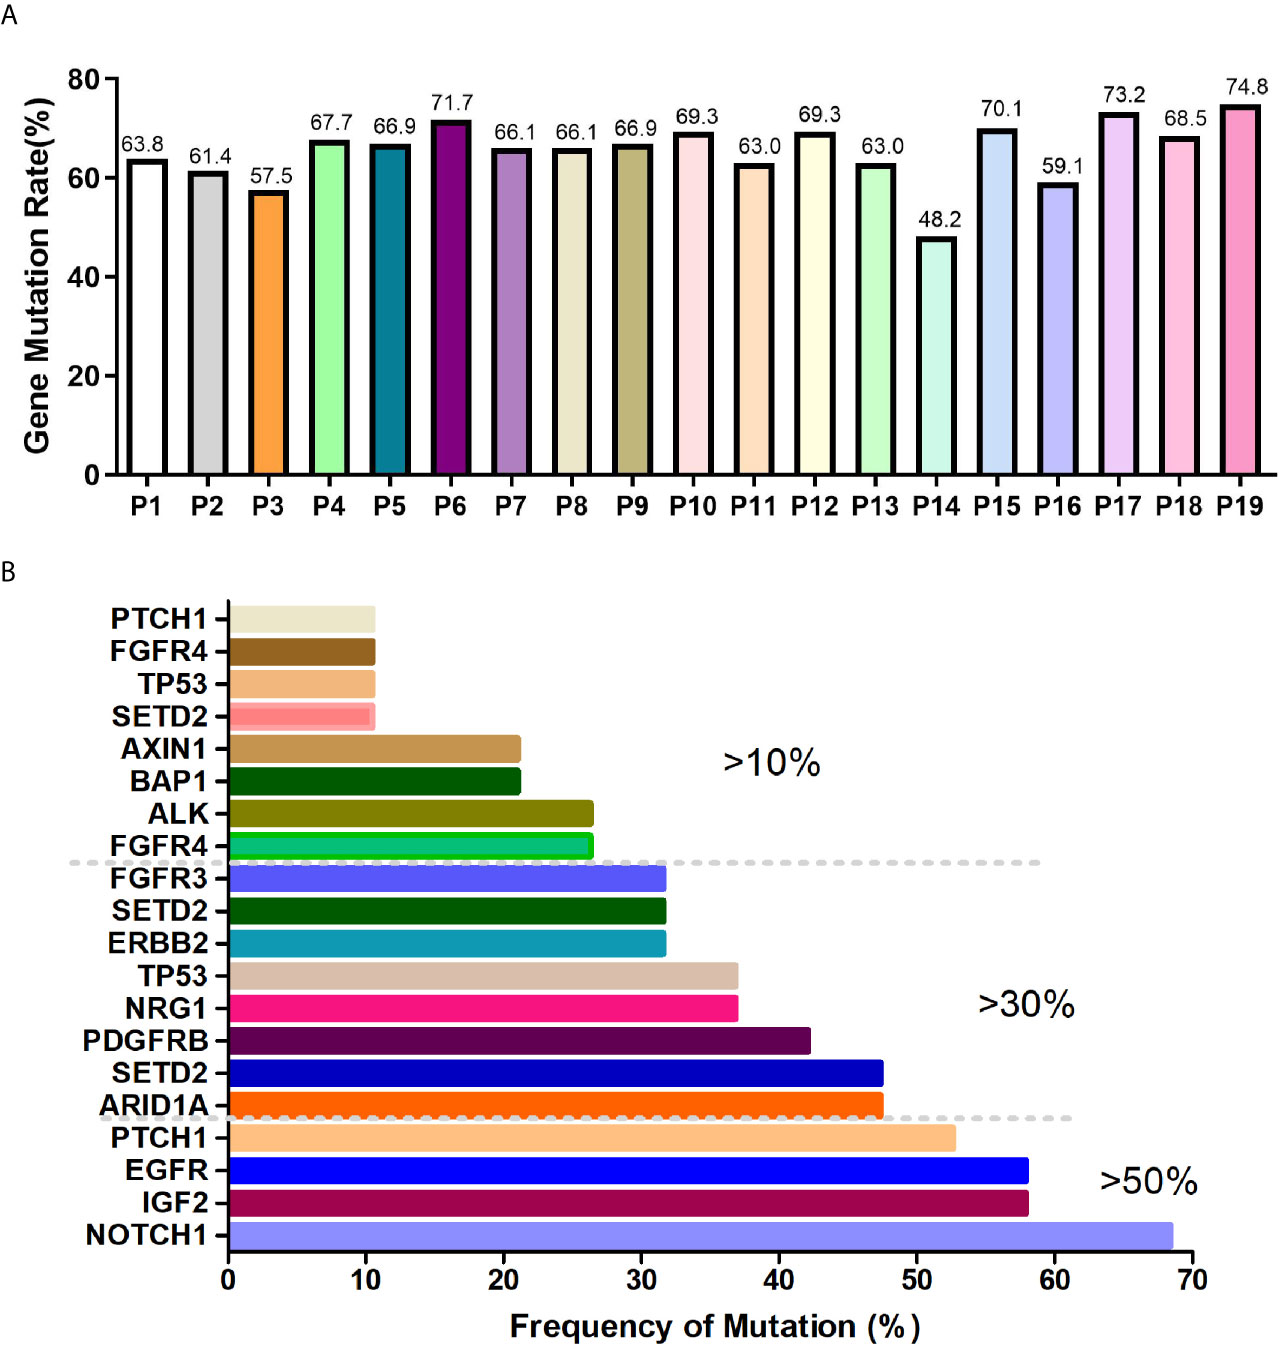
Figure 2 CTC NGS analysis of cancer-related gene mutations in lung cancer patients. (A) Proportion of mutated genes in 19 lung cancer patients. (B) >10%, >30%, >50% of patients with mutated genes.
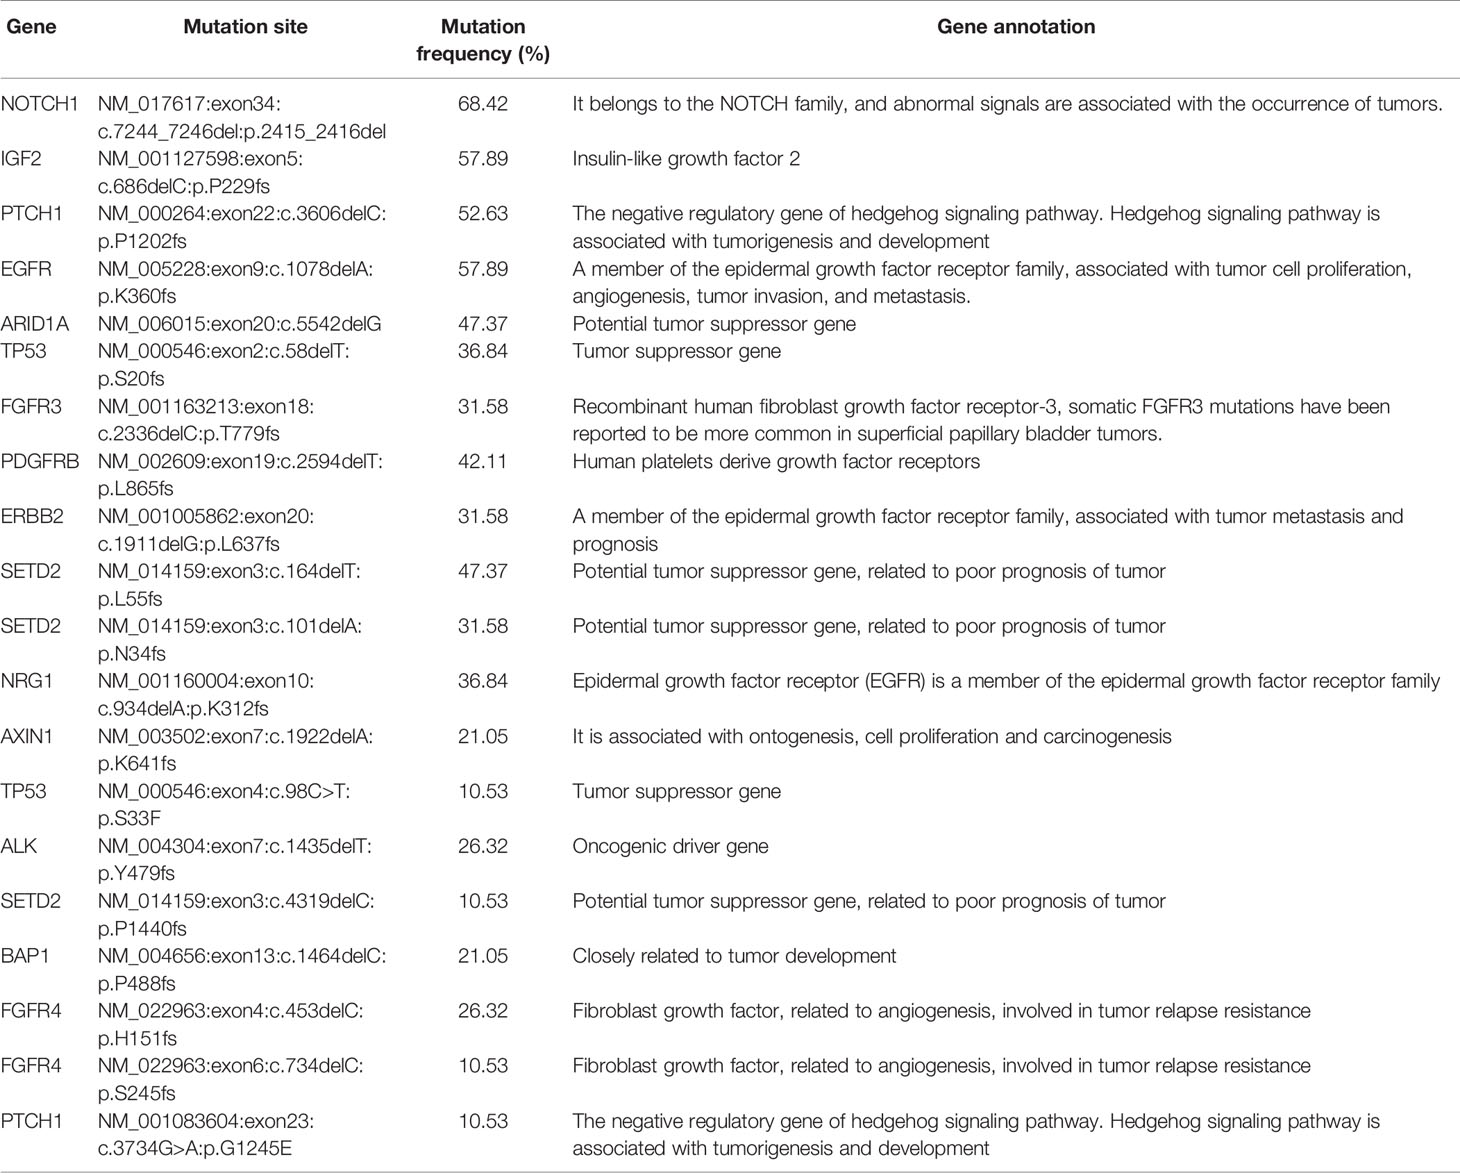
Table 2 Mutation gene information in >10%, >30% and >50% patients.
Multivariate Analysis for Discriminating Metabolites Between Lung Cancer Patients and Control Individuals
To determine whether there are specific differential metabolites in the early-stage of lung cancer, this study used LC-MS to perform metabolomics analysis on serum samples of lung cancer patients and control individuals. Typical total ion current (TIC) chromatograms of metabolic profiles analyzed using UPLC-Triple TOF-MS/MS in the positive mode or negative mode are shown in Figures S2A–D. The peaks are abundant and uniform and no obvious differences between the lung cancer group and the healthy groups were detected. In order to evaluate the stability of the analysis system during the on-boarding process, QC samples are necessary, which are a mixture of all samples in equal volumes. During data analysis, the stability of the instrument during the entire analysis process can be investigated through the repeatability of QC samples, Meanwhile, it can also be used to find the variable with great variation in the analysis system to ensure the reliability of the results. PCA suggested that the QC samples were clustered closely, verifying the good repeatability of the UPLC-Triple TOF-MS/MS method (Figures S2E, F). PCA score plots and heat map show the distribution of metabolites in lung cancer group and healthy control group in the positive/negative ion mode. The metabolite profiles showed that the early lung cancer group and the healthy control group could be significantly separated, and the lung cancer group samples had high similarity (Figure S2).
To further identify the differential metabolic characteristics of the early-stage lung cancer group, the differential metabolites between groups were screened by t- test combined with multivariate OPLS-DA analysis, which showed some differences in the metabolites between the lung cancer group and healthy groups under both ionization modes (Figures 3A, B). The quality of OPLS-DA was evaluated by R2Y and Q2 values, which were calculated as 0.035 and -0.437 in the negative ion mode, 0.031 and -0.624 in the positive mode (Figures 3C, D). Combined with VIP >1, P <0.05 and FC >1 or FC <1, the volcano chart shows that there were up-regulated or down-regulated metabolites among the 100 differential metabolites (Figures 3E, F). The most significant upregulation of differential metabolites in the early lung cancer group involved the lipid material, especially sphingolipids (such as trihexylceramide) and glycerophospholipids (such as cardiolipin), which are components of the cell membrane, and the differential metabolites are most significantly downregulated. Cyclic guanosine phosphate and guanosine 1-phosphate play important roles in purine nucleotide metabolism. In short, it is believed that these 100 differential metabolites are closely related to early-stage lung cancer (Figure 3G).
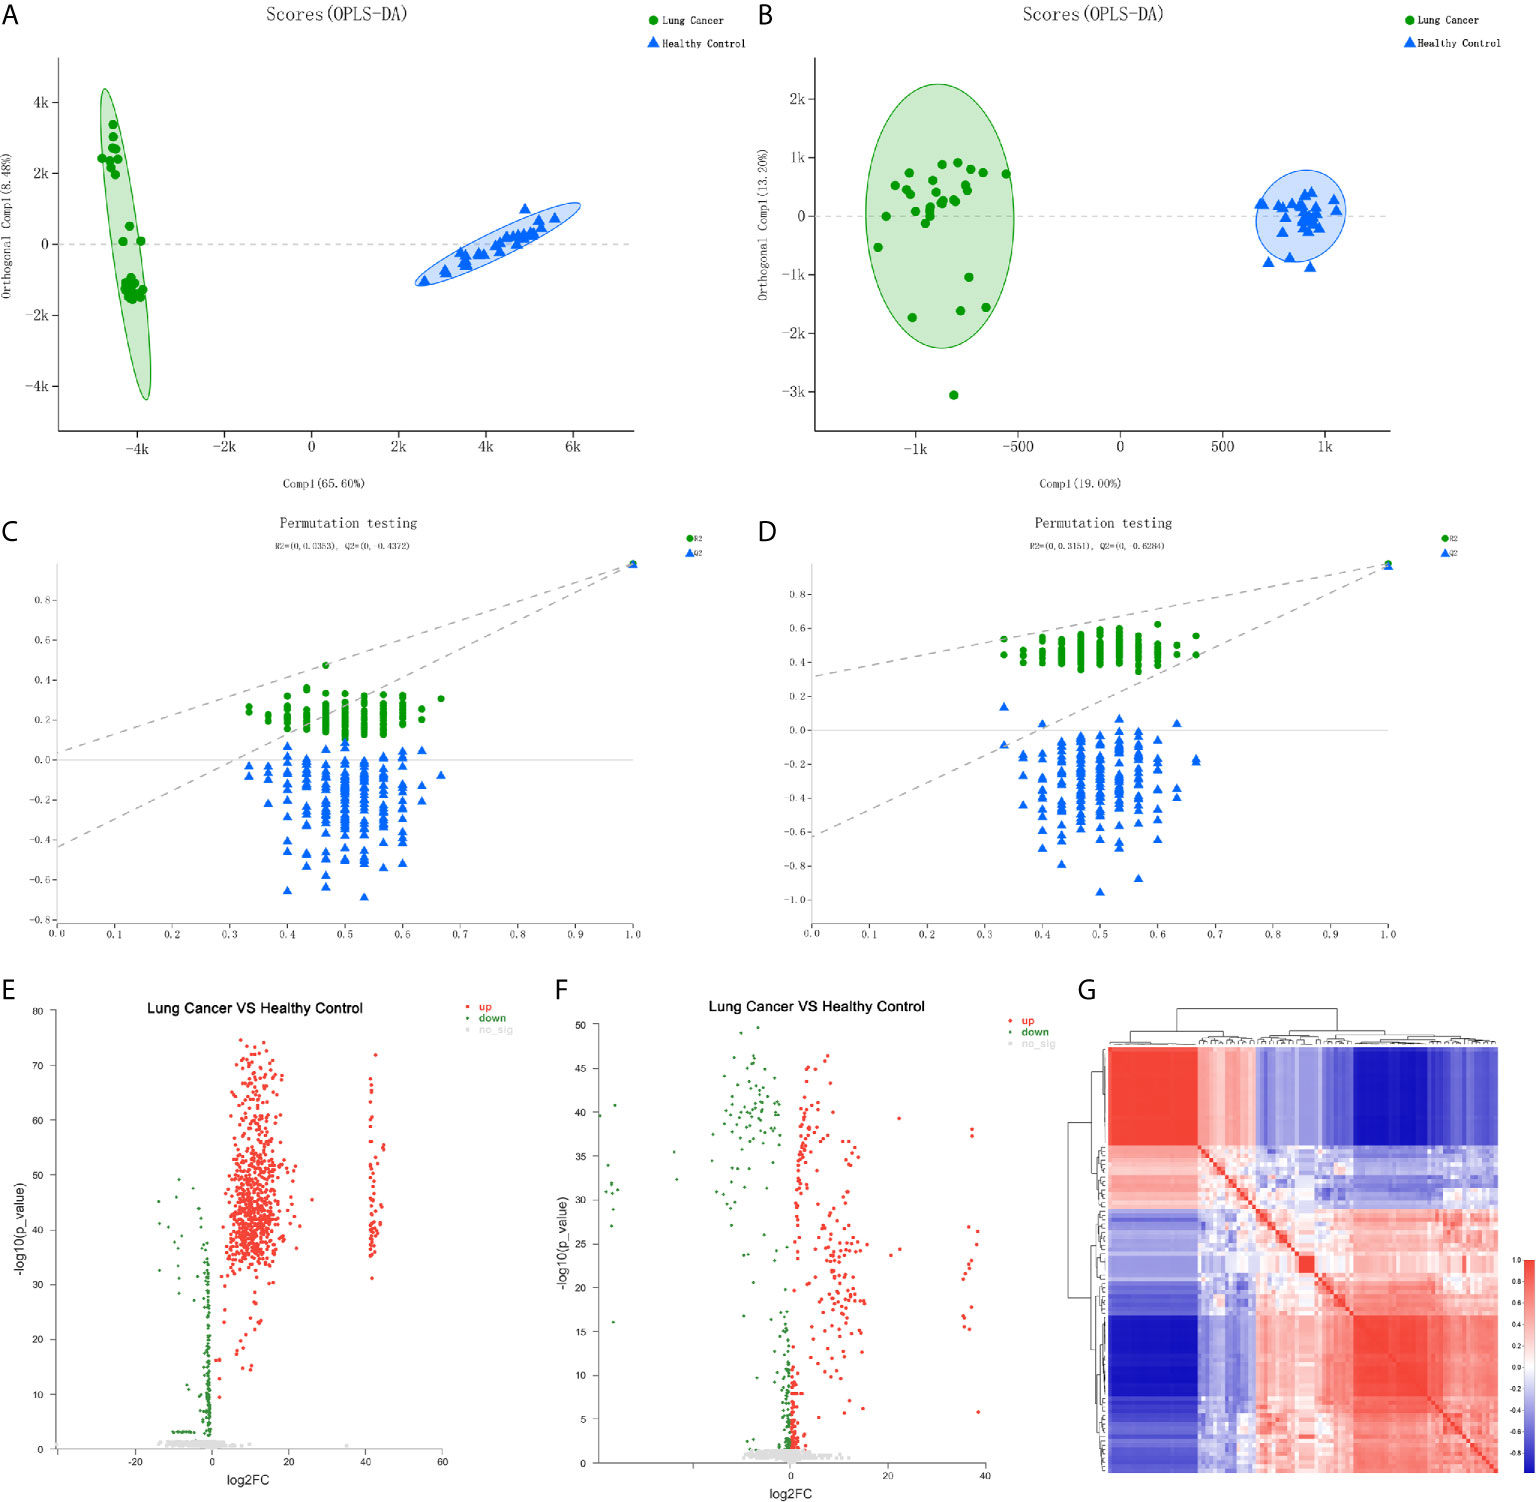
Figure 3 Differential metabolite analysis of serum from the lung cancer group and the healthy control group. (A) OPLS-DA score of the lung cancer group and the healthy control group in the negative ion mode. (B) OPLS-DA score of the lung cancer group and the healthy control group in the positive ion mode. (C) OPLS-DA differential metabolite serum anion permutation testing. R2 = (0, 0.0353), Q2 = (0, -0.4372). (D) OPLS-DA differential metabolite serum cation permutation testing. R2 = (0, 0.3151), Q2 = (0, -0.6284). (E) Volcano plot of serum anion metabolites in the control group and lung cancer group. (F) Volcano plot of differential metabolites of serum cations in the healthy controls and lung cancer group. (G) Metabolite heat map of serum differences between healthy controls and lung cancer groups.
Metabolic Pathway Analysis of the Differentially Regulated Metabolites
100 differential metabolites screened were classified into compounds by the Human Metabolome Database (HMDB), and the KEGG (Kyoto Encyclopedia of Genes and Genomes) database was used for pathway annotation and enrichment analysis. There were 6 types of differential metabolites that we screened (Figure 4A), most of which were lipids and their analogues, accounting for 78.87%, followed by organic acids and their derivatives, accounting for 8.45%, and phenylpropyl esters, accounting for 5.63%. The KEGG pathway analysis was divided into six categories (Figure 4B). The three most significant pathways for enrichment through KEGG are choline metabolism in cancer, glycerophospholipid metabolism, and the retrograde endocannabinoid signaling pathway. Enrichment analysis of the KEGG pathway revealed that the highest rate of differential metabolite enrichment was the cytosolic DNA-sensing pathway and the pathogenic Escherichia coli infection pathway (Figure 4C).
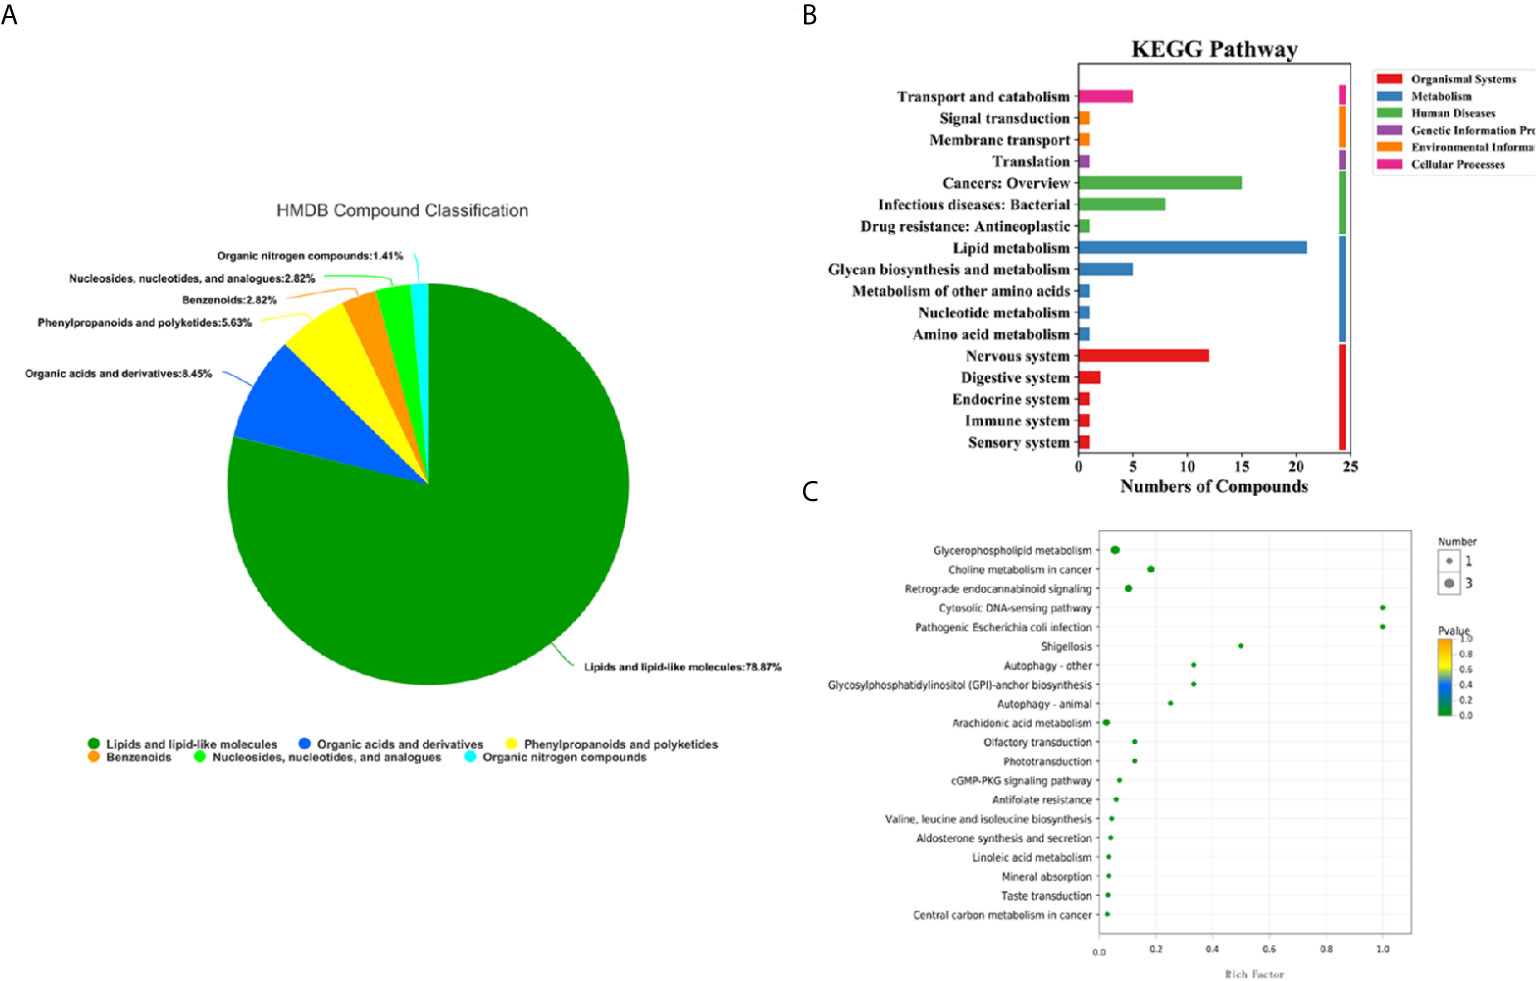
Figure 4 HMDB compound classification and KEGG pathway analysis of serum metabolites in the lung cancer group and healthy control group. (A) HMDB compound classification of serum metabolites between the lung cancer group and the healthy control group. (B) Serum KEGG pathways between the lung cancer group and the healthy control group. (C) KEGG enrichment pathways for serum metabolites in the lung cancer group and the healthy control group.
Previous studies have found that the occurrence and development of tumors are closely related to glucose and lipid metabolism (26, 27). In this study, according to KEGG pathway analysis, there were more differential metabolites enriched in the glucose and lipid metabolism pathways and tumor metabolism pathways between the two groups (Figure 4B). Among these metabolites, there were 21 differential metabolites involved in lipid metabolism pathways (Table S1), 5 differential metabolites involved in polysaccharide synthesis and metabolic pathways (Table S2), and 15 differential metabolites involved in tumor metabolic pathways (Table S3). We are currently conducting a targeted metabolomics study in another large cohort using UPLC -MS/MS. One of the results of a small sample study (5 lung cancer test groups and 5 healthy control groups) showed that phosphatidylethanolamine is up-regulated, which is similar to the results of this study (Figure S3).
Evaluation of the Metabolic Index in the Diagnosis of Lung Cancer
To effectively screen potential biomarkers in the early-stage lung cancer group, we further compared the differential metabolites in lipid metabolic pathways, polysaccharide synthesis and metabolism pathways, and tumor-related pathways between the early-stage lung cancer group and the healthy control group using receiver operating characteristic (ROC) curve and area under the curve (AUC) (Figure S4). It was found that AUC > 0.9 contained 9 differential metabolites related to lipid pathways, 3 differential metabolites related to polysaccharide synthesis and metabolism, and 5 differential metabolites related to tumor pathways. These metabolites were primarily glycerophospholipids, which are integrated with 3 types of upregulated differences and 7 types of downregulated difference, namely, PE (14:0/22:6(4Z,7Z,10Z,13Z,16Z,19Z)), PE (16:0/22:5(7Z,10Z,13Z,16Z, 19Z)), PE (14:0/20:4(5Z,8Z,11Z,14Z)), PC (18:0/20:4(8Z,11Z,14Z,17Z)), PC (16:0/22:6(4Z,7Z,10Z,13Z,16Z,19Z)), PC (16:0/20:4(5Z,8Z,11Z,14Z)), LysoPC (16:1(9Z)/0:0), L-isoleucine, LysoPC (18:0), L-palmitoylcarnitine (Figure 5 and Table 3).
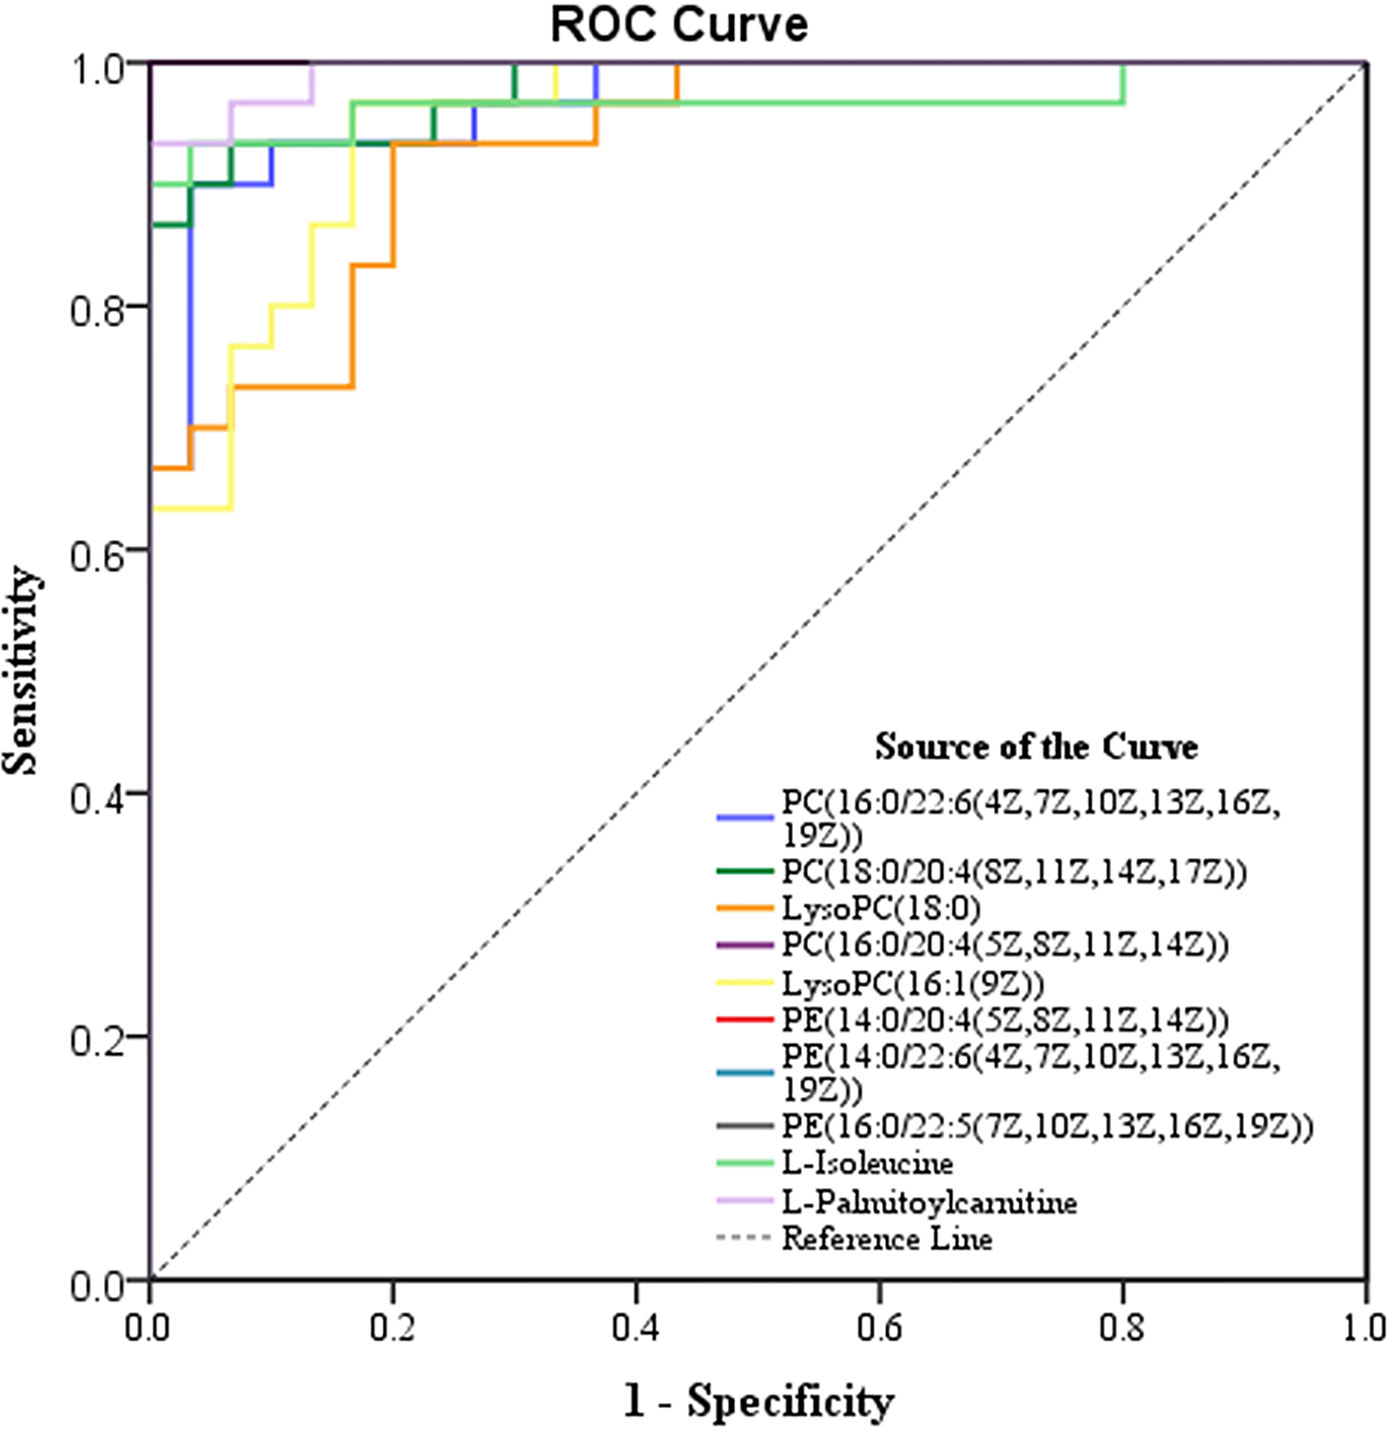
Figure 5 ROC curve of nine metabolites in the diagnosis of lung cancer.
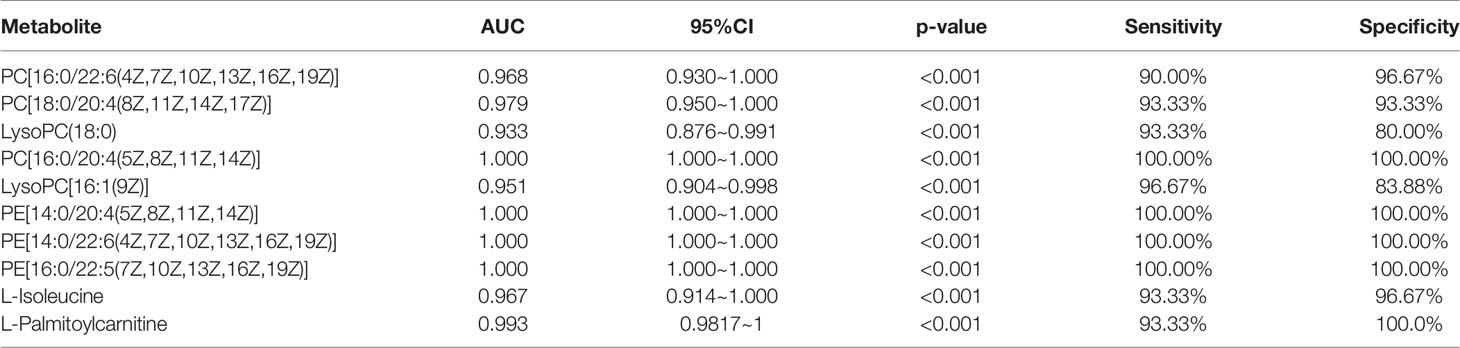
Table 3 The diagnostic efficacy of various metabolites in lung cancer.
Discussion
In this study, CTC counting, CTC next-generation sequencing, and LC-MS untargeted metabolomics were combined to characterize the potential gene mutation and energy metabolism disturbance characteristics of lung cancer, to provide a better detection method for the early screening and diagnosis of lung cancer patients. We used CellCollector® in vivo CTC capture technology to detect CTC in early lung cancer patients. The CTC detection rate was 62.5%. Compared with in vitro technology, it has a higher detection rate, which is consistent with previous research results (24, 28). Because the content of CTC in the peripheral blood of tumor patients is very low, the number is even rarer in precancerous lesions or early tumors. In our study, the median CTC was 1 in stage I/II NSCLC patients and 0 in healthy volunteers. CTC detection can be used for the early diagnosis of lung cancer, which is also consistent with previous studies (20). Unfortunately, our study cannot find out whether the number of CTCs is correlated with different stages of lung cancer, which may be related to the small sample size, of which only 7 cases were in stage II. This is also what we need to increase the sample size and patients with different stages of lung cancer to further explore in our subsequent studies.
The high CTC detection rate provides convenience for CTC molecular typing and CTC next-generation sequencing. Through CTC NGS, this study found that more than 50% of early lung cancer patients have 4 common mutated genes, namely NOTCH1, IGF2, EGFR and PTCH1. Also, 47.37% of patients have ARID1A mutations. EGFR has the highest mutation rate in NSCLC (29). NOTCH1, a member of the PCG gene family, was first discovered in mouse B-cell lymphoma and is regarded as a co-oncogene of C-MYC, closely related to cell proliferation, differentiation and apoptosis (30). Studies have shown that the stimulation of the Notch signaling pathway by high NOTCH1 expression can induce BM-1 to mediate the production of related intracellular signals to accelerate the transmission efficiency of lung cancer, thereby inducing the occurrence, development, metastasis and invasion of lung cancer (31). In our study, 68.42% of patients had a mutation in NOTCH1. Huang et al. (32) found that homozygous ARID1A was deleted at the 5’ end of the lung adenocarcinoma cell line, strongly suggesting that ARID1A is a tumor suppressor gene. Imielinska et al. reported exons and genome sequences of 183 cases of lung adenocarcinoma, and the results showed that mutations of the ARID1A gene existed in lung adenocarcinoma cells (33). ARID1A is a member of the SWI/SNF family and can regulate the expression of specific genes by changing the structure of chromatin. It is currently considered as a potential tumor suppressor gene, which plays an important role in inhibiting cell proliferation, inhibiting cell metastasis, and promoting cell differentiation and apoptosis. Frequent mutations in a variety of human malignancies indicate that ARID1A plays an important role in the occurrence and development of human malignancies. Among them, the expression of ARID1A in NSCLC was significantly lower than that of normal bronchial epithelial cells. In addition, ARID1A mutations are related to the activation of PI3K/AKT signaling pathway. However, the mutations and prognostic significance of ARID1A gene in different studies are different. There are still some problems to be solved, such as the target genes regulated by ARID1A and the specific mechanisms in tumor suppression, whether other signaling pathways can exert tumor suppression effects, and the prognostic value of ARID1A and patients. This requires comprehensive and in-depth research (34). Our study is the first to find IGF2 and RTCH1 mutations in peripheral blood CTC NGS of early lung cancer. Whether these mutations can be combined with NOTCH1, EGFR and ARID1A mutations as tumor markers in the diagnosis of early lung cancer merits further investigation.
Studies have found that CTC already exists in the early stages of cancer (35), and disturbances of metabolism are produced in the body (36), including disorders of glucose and lipid metabolism (13, 27, 37, 38), and the homeostasis of the microenvironment of the body is disrupted. Through metabolomics analysis, we found 100 different metabolites, which mainly occurred in lipid metabolism, polysaccharide synthesis and metabolism, amino acid metabolism and other pathways and were dominated by lipid metabolism, being especially enriched in choline metabolism and glycerophospholipid metabolic pathways. Chen et al. found that abnormal sphingolipid metabolism is the most important metabolic change in lung cancer patients (39). A study on lung adenocarcinoma in female non-smokers found that abnormal lipid metabolism may play role in the development of lung cancer (12). High-lipid molecules, including phospholipids (e.g., glycerophospholipids and sphingomyelin), and cholesterol are the main component of cell membranes and participate in cell signaling and cell proliferation. Lipid metabolism changes cause abnormal cell signals and lead to tumor formation (40, 41).
Tumor growth requires the uptake of a large amount of energy in the blood. The body ensures the normal energy metabolism of other organs by increasing the “raw materials” in the aerobic oxidation pathway, resulting in increased glucose metabolism and decreased fat metabolism (42). The purpose of this study was to discover a combination of serum metabolite biomarkers for the early detection of non-small cell lung cancer. In our study, the most obvious differences in the screened metabolites can be divided into four categories, namely phosphatidylethanolamine (PE), phosphatidylcholine (PC), lysophosphatidylcholine (LysoPC), L-isoleucine and L-palmitoylcarnitine. A large number of metabolomic studies have been undertaken to identify robust biomarkers for lung cancer diagnosis using plasma, serum, or urine. However, we found remarkably few metabolomic studies that specifically attempted to detect early-stage lung cancer.
The concentration of LysoPC was reduced in stage I/II NSCLC, which is similar to previous research (43). Another targeted metabolomics study found and verified that β-hydroxybutyric acid, LysoPC 20:3, PC ae C40:6 (a kind of phosphatidylcholines), citric acid, and fumaric acid differed significantly between healthy controls and stage I/II NSCLC. Robust predictive models with AUC >0.9 were developed and validated using these metabolites and other, easily measured clinical data for detecting different stages of NSCLC (44). It has been observed and reported that in mouse and human models, the plasma concentration of total LysoPC is usually inversely related to the risk of various types of cancer (45–47). In our study, we found that another member of the phosphatidylcholine family, PC(16:0/22:6(4Z,7Z,10Z,13Z,16Z,19Z)), PC(18:0/20:4(8Z,11Z,14Z,17Z)) and PC(16:0/20:4(5Z,8Z,11Z,14Z)), also appears to play a role in both stage I and stage II NSCLC. A study reported that PC levels were dysregulated in early-stage NSCLC patients (48). Decreased lipid membrane unsaturation levels were observed to protect tumor cells from free radicals or chemotherapeutics and promote invasion and infiltration (49). Clearly, more detailed lipidomic studies need to be conducted to investigate the biological significance of these PC alterations.
Lysophosphatidylethanolamine (LPE) is a group of lipids that has been recently shown to be related to breast cancer (50). In addition, PE (16:0/18:1) is associated with the stage and prognosis of pancreatic cancer and may be a potential diagnostic marker (51). Yang et al. found 25 different lipid metabolites, including PE, between malignant pleural effusion (MPE) and benign pleural effusion (NPE), indicating that lipid metabolites may be used to partition MBE and BPE (52). In our study, PE (14:0/22:6(4Z,7Z,10Z,13Z,16Z,19Z)), PE (16:0/22:5(7Z,10Z,13Z,16Z, 19Z)), and PE (14:0/20:4(5Z,8Z,11Z,14Z)) were upregulated and effectively distinguished the control group, with specificity and sensitivity close to 100% being observed. In addition, we found that the level of amino acids (L-isoleucine) was significantly increased in the lung cancer model group compared with that of the control group, indicating disorder in amino acid metabolism in the cancer model group. Maeda et al. reported 6 significantly different amino acid metabolites, with AUCs of 0.817 and 0.801 (on their validation sets), for diagnosing stage I and stage II lung cancer (53). One Study showed that L-palmitoylcarnitine is significantly reduced in advanced lung cancer patients (54). In another study, the level of palmitoylcarnitine was lower in the hepatocellular carcinoma group than in the cancer-free control group, and blood acylcarnitine levels may be influenced by hepatic fatty acid metabolism, in other words, decreased acylcarnitine levels may reflect the decreased production of acyl groups in the liver or other tissues. Indeed, palmitoylcarnitine and palmitic acid are associated with fatty acid metabolism, and this group displayed an impact factor of 0.030 based on metabolic pathway analysis (55). The decrease in L-palmitoylcarnitine in our study may also be related to a disorder of lipid metabolism in patients with lung cancer.
This study is based on CTC NGS and metabolomics analysis to conduct a comprehensive assessment of early lung cancer, in order to find new biomarkers and improve the diagnosis rate of early lung cancer. Previous studies have reported that the CTC single-cell metabolism profile may provide direct functional insights into the tumor cell metabolism of patients, and promote a more direct understanding of the relationship between cancer cell genotype and metabonomic phenotype (22). Whether CTC gene mutations and metabolomics can be used for the early diagnosis of lung cancer, we will re-enroll patients and conduct targeted verification, and finally analyze the scoring algorithm to select the best markers suitable for early diagnosis. However, there are still some shortcomings to this research. First, due to the small sample size in this study, a large sample study is needed to further verify the reliability of our research results. Second, the differential metabolites screened by untargeted metabolomics were only detected by one cohort, and not further verified by targeted metabolomics. Additional study is necessary to more fully explore and validate the metabolic changes detected in this study in NSCLC patients. And we are cognizant of these aspects and are accordingly in the process of a targeted metabolomics study in another large cohort using UPLC -MS/MS. In the end, we only performed CTC gene mutation detection but did not sequence the tissue. Whether there is a relationship between the mutations carried by CTCs and the changes in metabolic substances, which affect the microenvironment of patients, and whether there is a connection with the occurrence and development of lung cancer warrants further study.
Conclusions
In our study, there was a higher CTC detection rate, with 62.5% in I/II NSCLC, and 4 high frequency mutation genes, namely, NOTCH1, IGF2, EGFR and PTCH1. Meanwhile, we found that 10 different metabolites may have potential clinical application value for the diagnosis of CTC-positive early-stage lung cancer (AUC > 0.9). Later, a larger cohort of patients will be required for verification, which may help determine whether these markers can be used for the early diagnosis of lung cancer.
Data Availability Statement
The original contributions presented in the study are publicly available. This data can be found here: https://figshare.com/s/5fe7f423c20532952ddd DOI: 10.6084/m9.figshare.14680037.
Ethics Statement
The studies involving human participants were reviewed and approved by Approval was obtained from the Forth Hospital of Hebei Medical University ethics committee (Shijiazhuang, Hebei, China). The patients/participants provided their written informed consent to participate in this study.
Author Contributions
Conceptualization, BS. Data curation, DL and YG. Formal analysis, LW. Funding acquisition, YH. Investigation, YG and JR. Methodology, QL. Project administration, QL. Resources, GL. Supervision, YH. Validation, LW. Visualization, DL. Writing – original draft, LW. Writing – review & editing, YH and BS. All authors contributed to the article and approved the submitted version.
Funding
This work was supported by the Financial Department of Hebei Province [No. [2016] 361006 and No. 2017043367-2].
Conflict of Interest
The authors declare that the research was conducted in the absence of any commercial or financial relationships that could be construed as a potential conflict of interest.
Acknowledgments
We acknowledge Hongxia Yang from Viroad Biotechnology Co., Ltd. for technical support and CTC data collection.
Supplementary Material
The Supplementary Material for this article can be found online at: https://www.frontiersin.org/articles/10.3389/fonc.2021.630672/full#supplementary-material
Abbreviations
CTC, circulating tumor cell; NGS, next-generation sequencing; LC-MS, liquid chromatography-tandem mass spectrometry; IARC, International Agency for Research on Cancer; LDCT, Low-Dose Computed Tomography; COPD, chronic obstructive pulmonary disease; NSCLC, non-small cell lung cancer; QC, quality control; RT, retention time; RSD, relative standard deviation; FC, fold change; HMDB, Human Metabolome Database; KEGG, Kyoto Encyclopedia of Genes and Genomes; ROC, receiver operating characteristic; AUC, area under the curve. PE, Phosphatidylethanolamine; PC, Phosphatidylcholine; LysoPC, lysophosphatidylcholine.
References
1. Bray F, Ferlay J, Soerjomataram I, Siegel RL, Torre LA, Jemal A. Global Cancer Statistics 2018: GLOBOCAN Estimates of Incidence and Mortality Worldwide for 36 Cancers in 185 Countries. CA Cancer J Clin (2018) 68(6):394–424. doi: 10.3322/caac.21492
2. Goldstraw P, Chansky K, Crowley J, Rami-Porta R, Asamura H, Eberhardt WE, et al. The IASLC Lung Cancer Staging Project: Proposals for Revision of the TNM Stage Groupings in the Forthcoming (Eighth) Edition of the TNM Classification for Lung Cancer. J Thorac Oncol (2016) 11(1):39–51. doi: 10.1016/j.jtho.2015.09.009
3. Wicha MS, Hayes DF. Circulating Tumor Cells: Not All Detected Cells are Bad and Not All Bad Cells are Detected. J Clin Oncol (2011) 29(12):1508–11. doi: 10.1200/JCO.2010.34.0026
4. Pantel K, Brakenhoff RH. Dissecting the Metastatic Cascade. Nat Rev Cancer (2004) 4(6):448–56. doi: 10.1038/nrc1370
5. Ilie M, Hofman V, Long-Mira E, Selva E, Vignaud JM. Padovani B Et Al: “Sentinel” Circulating Tumor Cells Allow Early Diagnosis of Lung Cancer in Patients With Chronic Obstructive Pulmonary Disease. PloS One (2014) 9(10):e111597. doi: 10.1371/journal.pone.0111597
6. Pailler E, Adam J, Barthelemy A, Oulhen M, Auger N. Valent A Et Al: Detection of Circulating Tumor Cells Harboring a Unique ALK Rearrangement in ALK-positive non-Small-Cell Lung Cancer. J Clin Oncol (2013) 31(18):2273–81. doi: 10.1200/JCO.2012.44.5932
7. Krebs MG, Sloane R, Priest L, Lancashire L, Hou JM. Greystoke A Et Al: Evaluation and Prognostic Significance of Circulating Tumor Cells in Patients With non-Small-Cell Lung Cancer. J Clin Oncol (2011) 29(12):1556–63. doi: 10.1200/JCO.2010.28.7045
8. Heitzer E, Auer M, Gasch C, Pichler M, Ulz P. Hoffmann EM Et Al: Complex Tumor Genomes Inferred From Single Circulating Tumor Cells by array-CGH and Next-Generation Sequencing. Cancer Res (2013) 73(10):2965–75. doi: 10.1158/0008-5472.CAN-12-4140
9. Bendall SC, Nolan GP. From Single Cells to Deep Phenotypes in Cancer. Nat Biotechnol (2012) 30(7):639–47. doi: 10.1038/nbt.2283
10. He Y, Shi J, Shi G, Xu X, Liu Q. Liu C Et Al: Using the New CellCollector to Capture Circulating Tumor Cells From Blood in Different Groups of Pulmonary Disease: A Cohort Study. Sci Rep (2017) 7(1):9542. doi: 10.1038/s41598-017-09284-0
11. Duarte IF, Rocha CM, Gil AM. Metabolic Profiling of Biofluids: Potential in Lung Cancer Screening and Diagnosis. Expert Rev Mol Diagn (2013) 13(7):737–48. doi: 10.1586/14737159.2013.835570
12. Mu Y, Zhou Y, Wang Y, Li W, Zhou L. Lu X Et Al: Serum Metabolomics Study of Nonsmoking Female Patients With Non-Small Cell Lung Cancer Using Gas Chromatography-Mass Spectrometry. J Proteome Res (2019) 18(5):2175–84. doi: 10.1021/acs.jproteome.9b00069
13. Musharraf SG, Mazhar S, Choudhary MI, Rizi N, Atta ur R. Plasma Metabolite Profiling and Chemometric Analyses of Lung Cancer Along With Three Controls Through Gas Chromatography-Mass Spectrometry. Sci Rep (2015) 5:8607. doi: 10.1038/srep08607
14. Ding M, Li F, Wang B, Chi G, Liu H. A Comprehensive Analysis of WGCNA and Serum Metabolomics Manifests the Lung Cancer-Associated Disordered Glucose Metabolism. J Cell Biochem (2019) 120(6):10855–63. doi: 10.1002/jcb.28377
15. Renner K, Singer K, Koehl GE, Geissler EK, Peter K. Siska PJ Et Al: Metabolic Hallmarks of Tumor and Immune Cells in the Tumor Microenvironment. Front Immunol (2017) 8:248. doi: 10.3389/fimmu.2017.00248
16. Sekine H, Yamamoto M, Motohashi H. Tumors Sweeten Macrophages With Acids. Nat Immunol (2018) 19(12):1281–3. doi: 10.1038/s41590-018-0258-0
17. Kumar A, Misra BB. Challenges and Opportunities in Cancer Metabolomics. Proteomics (2019) 19(21-22):e1900042. doi: 10.1002/pmic.201900042
18. Massague J, Obenauf AC. Metastatic Colonization by Circulating Tumour Cells. Nature (2016) 529(7586):298–306. doi: 10.1038/nature17038
19. Amin MB, Edge S, Greene F, Byrd DR, Brookland RK, Washington MK, et al. Ajcc Cancer Staging Manual. Eighth Edition. American: Springer (2017).
20. Duan GC, Zhang XP, Wang HE, Wang ZK, Zhang H, Yu L, et al. Circulating Tumor Cells as a Screening and Diagnostic Marker for Early-Stage non-Small Cell Lung Cancer. Onco Targets Ther (2020) 13:1931–9. doi: 10.2147/OTT.S241956
21. Yang D, Yang X, Li Y, Zhao P, Fu R, Ren T, et al. Clinical Significance of Circulating Tumor Cells and Metabolic Signatures in Lung Cancer After Surgical Removal. J Transl Med (2020) 18(1):243. doi: 10.1186/s12967-020-02401-0
22. Abouleila Y, Onidani K, Ali A, Shoji H, Kawai T, Lim CT, et al. Live Single Cell Mass Spectrometry Reveals Cancer-Specific Metabolic Profiles of Circulating Tumor Cells. Cancer Sci (2019) 110(2):697–706. doi: 10.1111/cas.13915
23. Yu Z, Chen H, Ai J, Zhu Y, Li Y, Borgia JA, et al. Global Lipidomics Identified Plasma Lipids as Novel Biomarkers for Early Detection of Lung Cancer. Oncotarget (2017) 8(64):107899–906. doi: 10.18632/oncotarget.22391
24. He Y, Shi J, Schmidt B, Liu Q, Shi G, Xu X, et al. Circulating Tumor Cells as a Biomarker to Assist Molecular Diagnosis for Early Stage Non-Small Cell Lung Cancer. Cancer Manag Res (2020) 12:841–54. doi: 10.2147/CMAR.S240773
25. Di Guida R, Engel J, Allwood JW, Weber RJ, Jones MR, Sommer U, et al. Non-Targeted UHPLC-MS Metabolomic Data Processing Methods: A Comparative Investigation of Normalisation, Missing Value Imputation, Transformation and Scaling. Metabolomics (2016) 12:93. doi: 10.1007/s11306-016-1030-9
26. Farre PL, Scalise GD, Duca RB, Dalton GN, Massillo C, Porretti J, et al. CTBP1 and Metabolic Syndrome Induce an mRNA and miRNA Expression Profile Critical for Breast Cancer Progression and Metastasis. Oncotarget (2018) 9(17):13848–58. doi: 10.18632/oncotarget.24486
27. Yu S, Li J, Gao W, Wu Y, Qin X, Li Z. Uncovering the Anticancer Mechanism of Petroleum Extracts of Farfarae Flos Against Lewis Lung Cancer by Metabolomics and Network Pharmacology Analysis. BioMed Chromatogr (2020) 34(9):4878. doi: 10.1002/bmc.4878
28. Gorges TM, Penkalla N, Schalk T, Joosse SA, Riethdorf S, Tucholski J, et al. Enumeration and Molecular Characterization of Tumor Cells in Lung Cancer Patients Using a Novel in Vivo Device for Capturing Circulating Tumor Cells. Clin Cancer Res (2016) 22(9):2197–206. doi: 10.1158/1078-0432.CCR-15-1416
29. da Cunha Santos G, Shepherd FA, Tsao MS. EGFR Mutations and Lung Cancer. Annu Rev Pathol (2011) 6:49–69. doi: 10.1146/annurev-pathol-011110-130206
30. Pesch B, Casjens S, Stricker I, Westerwick D, Taeger D, Rabstein S, et al. Notch1, HIF1A and Other Cancer-Related Proteins in Lung Tissue From Uranium Miners–Variation by Occupational Exposure and Subtype of Lung Cancer. PLoS One (2012) 7(9):e45305. doi: 10.1371/journal.pone.0045305
31. Hua-Rong C, Yue-Quan J. Expression and Significance of Notch1 and Bmi-1 Protein in Lung Cancer Tissue. Chin J Tissue Eng Res (2016) 20:683–7. doi: 10.3969/j.issn.2095-4344.2016.05.013
32. Huang J, Zhao YL, Li Y, Fletcher JA, Xiao S. Genomic and Functional Evidence for an ARID1A Tumor Suppressor Role. Genes Chromosomes Cancer (2007) 46(8):745–50. doi: 10.1002/gcc.20459
33. Imielinski M, Berger AH, Hammerman PS, Hernandez B, Pugh TJ. Hodis E Et Al: Mapping the Hallmarks of Lung Adenocarcinoma With Massively Parallel Sequencing. Cell (2012) 150(6):1107–20. doi: 10.1016/j.cell.2012.08.029
34. Pavlidou E, Balis V. Diagnostic Significance and Prognostic Role of the ARID1A Gene in Cancer Outcomes (Review). World Acad Sciences J (2020) 2:49–64. doi: 10.3892/wasj.2020.37
35. Hosseini H, Obradovic MM, Hoffmann M, Harper KL, Sosa MS, Werner-Klein M, et al. Early Dissemination Seeds Metastasis in Breast Cancer. Nature (2016) 540(7634):552–8. doi: 10.1038/nature20785
36. Ward PS, Thompson CB. Metabolic Reprogramming: A Cancer Hallmark Even Warburg did Not Anticipate. Cancer Cell (2012) 21(3):297–308. doi: 10.1016/j.ccr.2012.02.014
37. Perrotti F, Rosa C, Cicalini I, Sacchetta P, Del Boccio P, Genovesi D, et al. Advances in Lipidomics for Cancer Biomarkers Discovery. Int J Mol Sci (2016) 17(12):1992. doi: 10.3390/ijms17121992
38. Li Y, Song X, Zhao X, Zou L, Xu G. Serum Metabolic Profiling Study of Lung Cancer Using Ultra High Performance Liquid Chromatography/Quadrupole Time-of-Flight Mass Spectrometry. J Chromatogr B Analyt Technol BioMed Life Sci (2014) 966:147–53. doi: 10.1016/j.jchromb.2014.04.047
39. Chen Y, Ma Z, Min L, Li H, Wang B, Zhong J, et al. Biomarker Identification and Pathway Analysis by Serum Metabolomics of Lung Cancer. BioMed Res Int (2015) 2015:183624. doi: 10.1155/2015/183624
40. Ogretmen B, Hannun YA. Biologically Active Sphingolipids in Cancer Pathogenesis and Treatment. Nat Rev Cancer (2004) 4:(8):604–16. doi: 10.1038/nrc1411
41. Lee GK, Lee HS, Park YS, Lee JH, Lee SC, Lee JH, et al. Lipid MALDI Profile Classifies non-Small Cell Lung Cancers According to the Histologic Type. Lung Cancer (2012) 76(2):197–203. doi: 10.1016/j.lungcan.2011.10.016
42. Luan Y, Li Y, Yue X, Cao Y, Xiang F, Mao D, et al. Metabonomics of Mice Intestine in Codonopsis Foetens Induced Apoptosis of Intestine Cancer Cells. Saudi J Biol Sci (2019) 26(5):1003–10. doi: 10.1016/j.sjbs.2018.11.010
43. Guo S, Wang Y, Zhou D, Li Z. Significantly Increased Monounsaturated Lipids Relative to Polyunsaturated Lipids in Six Types of Cancer Microenvironment are Observed by Mass Spectrometry Imaging. Sci Rep (2014) 4:5959. doi: 10.1038/srep05959
44. Zhang L, Zheng J, Ahmed R, Huang G, Reid J, Mandal R, et al. A High-Performing Plasma Metabolite Panel for Early-Stage Lung Cancer Detection. Cancers (Basel) (2020) 12(3):622. doi: 10.3390/cancers12030622
45. Kuhn T, Floegel A, Sookthai D, Johnson T, Rolle-Kampczyk U, Otto W, et al. Higher Plasma Levels of Lysophosphatidylcholine 18:0 are Related to a Lower Risk of Common Cancers in a Prospective Metabolomics Study. BMC Med (2016) 14:13. doi: 10.1186/s12916-016-0552-3
46. Taylor LA, Arends J, Hodina AK, Unger C, Massing U. Plasma Lyso-Phosphatidylcholine Concentration is Decreased in Cancer Patients With Weight Loss and Activated Inflammatory Status. Lipids Health Dis (2007) 6:17. doi: 10.1186/1476-511X-6-17
47. Raynor A, Jantscheff P, Ross T, Schlesinger M, Wilde M, Haasis S, et al. Saturated and Mono-Unsaturated Lysophosphatidylcholine Metabolism in Tumour Cells: A Potential Therapeutic Target for Preventing Metastases. Lipids Health Dis (2015) 14:69. doi: 10.1186/s12944-015-0070-x
48. Chen Y, Ma Z, Zhong J, Li L, Min L, Xu L, et al. Simultaneous Quantification of Serum Monounsaturated and Polyunsaturated Phosphatidylcholines as Potential Biomarkers for Diagnosing non-Small Cell Lung Cancer. Sci Rep (2018) 8(1):7137. doi: 10.1038/s41598-018-25552-z
49. Rysman E, Brusselmans K, Scheys K, Timmermans L, Derua R, Munck S, et al. De Novo Lipogenesis Protects Cancer Cells From Free Radicals and Chemotherapeutics by Promoting Membrane Lipid Saturation. Cancer Res (2010) 70(20):8117–26. doi: 10.1158/0008-5472.CAN-09-3871
50. Cui M, Wang Q, Chen G. Serum Metabolomics Analysis Reveals Changes in Signaling Lipids in Breast Cancer Patients. BioMed Chromatogr (2016) 30(1):42–7. doi: 10.1002/bmc.3556
51. Tao L, Zhou J, Yuan C, Zhang L, Li D, Si D, et al. Metabolomics Identifies Serum and Exosomes Metabolite Markers of Pancreatic Cancer. Metabolomics (2019) 15(6):86. doi: 10.1007/s11306-019-1550-1
52. Yang Z, Song Z, Chen Z, Guo Z, Jin H, Ding C, et al. Metabolic and Lipidomic Characterization of Malignant Pleural Effusion in Human Lung Cancer. J Pharm BioMed Anal (2020) 180:113069. doi: 10.1016/j.jpba.2019.113069
53. Maeda J, Higashiyama M, Imaizumi A, Nakayama T, Yamamoto H, Daimon T, et al. Possibility of Multivariate Function Composed of Plasma Amino Acid Profiles as a Novel Screening Index for non-Small Cell Lung Cancer: A Case Control Study. BMC Cancer (2010) 10:690. doi: 10.1186/1471-2407-10-690
54. Tian Y, Wang Z, Liu X, Duan J, Feng G, Yin Y, et al. Prediction of Chemotherapeutic Efficacy in Non-Small Cell Lung Cancer by Serum Metabolomic Profiling. Clin Cancer Res (2018) 24(9):2100–9. doi: 10.1158/1078-0432.CCR-17-2855
Keywords: lung cancer, LC-MS untargeted metabolomics, circulating tumor cell, next-generation sequencing, diagnosis
Citation: Wan L, Liu Q, Liang D, Guo Y, Liu G, Ren J, He Y and Shan B (2021) Circulating Tumor Cell and Metabolites as Novel Biomarkers for Early-Stage Lung Cancer Diagnosis. Front. Oncol. 11:630672. doi: 10.3389/fonc.2021.630672
Received: 18 November 2020; Accepted: 09 April 2021;
Published: 31 May 2021.
Edited by:
Sara Rodriguez-Enriquez, Instituto Nacional de Cardiología, MexicoReviewed by:
Stephen John Ralph, Griffith University, AustraliaVassilis Georgoulias, University of Crete, Greece
Copyright © 2021 Wan, Liu, Liang, Guo, Liu, Ren, He and Shan. This is an open-access article distributed under the terms of the Creative Commons Attribution License (CC BY). The use, distribution or reproduction in other forums is permitted, provided the original author(s) and the copyright owner(s) are credited and that the original publication in this journal is cited, in accordance with accepted academic practice. No use, distribution or reproduction is permitted which does not comply with these terms.
*Correspondence: Baoen Shan, YmFvZW5zaGFuNjJAc2luYS5jb20=; Yutong He, aHl0b25nNjlAeWFob28uY29t