 Shengbo Li1
 Xiaofan Yang
 Zhenbing Chen
94% of researchers rate our articles as excellent or good
Learn more about the work of our research integrity team to safeguard the quality of each article we publish.
Find out more
ORIGINAL RESEARCH article
Front. Oncol. , 31 August 2021
Sec. Cancer Molecular Targets and Therapeutics
Volume 11 - 2021 | https://doi.org/10.3389/fonc.2021.625257
Gastric cancer (GC) is the second most common cancer and the third most frequent cause of cancer-related deaths in China. E2Fs are a family of transcription factors reported to be involved in the tumor progression of various cancer types; however, the roles of individual E2Fs are still not known exactly in tumor progression of GC. In this study, we examined the expression of E2Fs to investigate their roles in tumor progression in GC patients using multiple databases, including ONCOMINE, GEPIA2, Kaplan-Meier plotter, cBioPortal, Metascape, LinkedOmics, GeneMANIA, STRING and UCSC Xena. We also performed real-time polymerase chain reaction (RT-PCR) to validate the expression levels of individual E2Fs in several GC cell lines. Our results demonstrated that the mRNA levels of E2F1/2/3/5/8 were significantly higher both in GC tissues and cell lines. The expression levels of E2F1 and E2F4 were correlated with poor overall survival (OS), decreased post-progression survival (PPS), and decreased progression-free survival (FP) in patients with GC. However, overexpression of E2F2, E2F5, E2F7 and E2F8 is significantly associated with disease-free survival and overall survival in patients with GC. In addition, higher E2F3 and E2F6 mRNA expression was found to increase GC patients’ OS and PPS. 224 of 415 patients with STAD (54%) had gene mutations that were associated with longer disease-free survival (DFS) but not OS. Cell cycle pathway was closely associated with mRNA level of more than half of E2Fs (E2F1/2/3/7/8). There were close and complicated interactions among E2F family members. Finally, our results indicated the gene expressions of E2Fs had a positive relationship with its copy numbers. Taken together, E2F1/2/3/5/8 can serve as biomarkers for GC patients with high prognostic value for OS of GC patients or therapeutic targets for GC.
Gastric cancer (GC) is the second most common cancer and the third most frequent cause of cancer-related deaths in China (1). Most stomach tumors are stomach adenocarcinoma (STAD) (90%–95%) (2). The high mortality rate of GC patients is often related to the difficulty of diagnosing GC, which is often due to its lack of early symptoms (3). Efforts have been made to explore the therapeutic targets for the treatment of GC, with some progress (4–7); however, some molecular characteristics of GC remain unknown. Elucidating the underlying mechanisms of the pathogenesis and etiology of GC would help to discover new diagnostic biomarkers and develop new treatments for GC.
E2Fs are a set of transcription factors encoded by a family of genes. Eight members (E2F1–E2F8) of the E2F family have been identified. It has been reported that E2Fs are primarily involved in the cell cycle regulation and DNA synthesis and are associated with various tumors. An increasing number of studies have found abnormal expression or activation of some E2Fs and have investigated their prognostic value in GC (8–13). Nevertheless, the exact role of each E2F member in development and progression of GC remains unknown.
Developments in sequencing technologies and multiple databases have made it possible to comprehensively analyze E2Fs. In the present study, data from several large public databases were used for comprehensive bioinformatics analyses of different E2Fs and their associations with clinical parameters in GC patients. Real-time polymerase chain reaction (RT-PCR) was performed to confirm the differentially expressed levels of E2Fs in two GC cell lines. Furthermore, we analyzed the functions of E2Fs in GC. Finally, we explored the potential drivers of the abnormal mRNA levels of E2Fs in GC.
ONCOMINE (http://www.oncomine.org) is an online cancer microarray database. The E2F mRNA levels were compared between the 20 cancer types and their normal controls using ONCOMINE (accessed between June and October 2020). The parameters used in this process were set as follows: p = 0.01, fold change = 1.5, gene rank = 10%, and data type = mRNA. Multiple testing correction was conducted using the false discovery rate (FDR) method.
The GEPIA2 database (http://gepia2.cancer-pku.cn) is an updated version of GEPIA, containing RNA sequencing data of 9,736 tumors and 8,587 normal samples from The Cancer Genome Atlas (TCGA) and Genotype Tissue Expression (GTEx) projects (14). The GEPIA2 database (accessed between June and October 2020) was used to analyze the differential mRNA levels of E2Fs, for plot profiling, and to detect similar genes. Differences in the mRNA levels were compared by analysis of variance (ANOVA). Multiple testing correction was conducted using the FDR method, and the significance was set at p-value <0.01.
The GC cell lines MGC-803 and SGC-7901 and the normal gastric epithelial cell line GES-1 were used. Cells were grown in RPMI 1640 medium (Gibco, Waltham, MA, USA) supplemented with 10% fetal bovine serum (FBS; Gibco) and 1% penicillin and streptomycin at 37°C with 5% CO2. Total RNA was isolated using an RNA extraction kit (#CW0581M, CWBIO, Tianjin, China) according to the manufacturer’s instructions. RNA was reverse transcribed into cDNA using a HiScript® III RT SuperMix for qPCR (+gDNA wiper) kit (#R323-01, Vazyme, Nanjing, China). RT-PCR was conducted on the StepOnePlus™ platform (Applied Biosystems, Foster, CA, USA) using a ChamQ™ SYBR® qPCR master mix kit (#Q311-02, Vazyme). Primer sequences are presented in Table 1. Relative gene expression levels were calculated using the 2–ΔΔCt method and normalized to ACTB.
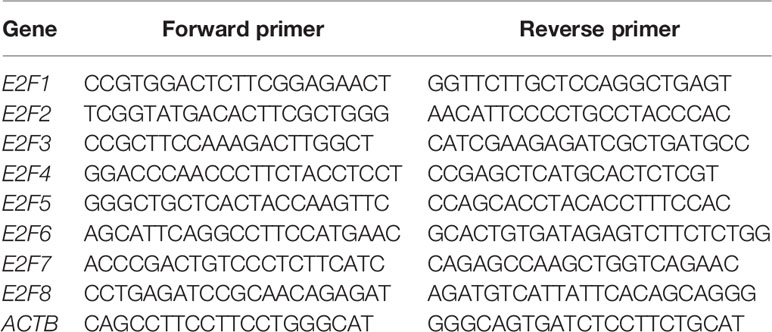
Table 1 Primer sequences of E2Fs for RT-PCR.
The Kaplan-Meier plotter (http://www.kmplot.com) is an online database that can assess the roles of 54,000 genes (coding for mRNAs, miRNAs, and proteins) in the survival of 21 cancer types, including breast (n = 6,234), ovarian (n = 2,190), lung (n = 3,452), and gastric (n = 1,440) cancers (15). In this study, the Kaplan-Meier plotter (accessed between June and October 2020) was used to analyze the effects of E2Fs mRNA levels on the overall survival (OS), post-progression survival (PPS), and first progression (FP) of GC patients. The JetSet best probe set was used as the probe-set option. Patients were split using the auto-selected best cutoff. The cutoff for significance was set to p < 0.05.
cBioPortal (http://www.cbioportal.org) is an online database that can conduct multidimensional cancer genomics studies (16). The STAD (The Cancer Genome Atlas, Firehose legacy) dataset (accessed between June and October 2020), containing 478 samples, was selected. The genomic profiles were composed of mutations, putative copy-number alterations from GISTIC, and mRNA expression z-scores (RNASeq V2 RSEM), and the z-score threshold was set at ±1.8. Samples with mRNA data (RNA Seq V2) (415) ware selected as patient/case set. The correlation of genetic mutations with OS and disease-free survival (DFS) of STAD patients was analyzed using the log-rank test with a significance threshold of p < 0.05. Co-expression analysis was conducted, using the cBioPortal’s online instruction as a reference.
Functional enrichment analysis of E2Fs and the genes similar to them was conducted using GEPIA2 (http://gepia2.cancer-pku.cn, accessed between June and October 2020) and Metascape (https://metascape.org) (accessed between June and October 2020). Metascape provides comprehensive gene list annotation and analysis resources (17). First, for each E2F family member, the top 30 similar genes that have a similar expression pattern in STAD were identified using GEPIA2 datasets. Metascape was used to perform Gene Ontology (GO) and Kyoto Encyclopedia of Genes and Genomes (KEGG) enrichment pathway analysis of the E2Fs and similar genes. The parameters were set as follows: p < 0.01, minimum count of 3, and enrichment factor > 1.5. A protein-protein interaction (PPI) network was created using BioGrid, InWeb_IM, and OmniPath. In addition, the molecular complex detection (MCODE) algorithm was utilized to analyze clusters of the PPI networks.
Furthermore, gene set enrichment analysis (GSEA) was also conducted using the online tool LinkedOmics (http://www.linkedomics.org/admin.php, accessed between June and October 2020). LinkedOmics is an open access portal that contains the multi-omics data of 32 TCGA Cancers (18). TCGA_STAD was selected as the interested cancer cohort, for which RNAseq datatype was selected as search dataset and target dataset. The interesting list was gsea_result_3583_1616921367.rnk. The interesting list contains 17608 unique entrezgene IDs. The expression dataset of 6843 genes related to the expression of E2Fs in 415 samples was used to perform GSEA using the “LinkInterpreter” module. The top-ranking enrichment term for each E2F factor was shown.
E2F-gene and E2F-protein interaction networks were constructed using GeneMANIA (https://genemania.org, accessed between June and October 2020) and STRING (https://string-db.org, accessed between June and October 2020). GeneMANIA provides user information about protein and genetic co-expression, co-localization, interactions, pathways, and shared protein domains of submitted genes (19). The data, including 325 co-expression datasets, four co-localization datasets, 10 genetic interaction datasets, six pathway datasets, 244 physical interactions datasets, 42 interaction prediction datasets, and two shared protein domain collections, were used to identify the interactions among the E2F genes. The STRING database collects and integrates all publicly available PPI data and predicts potential functions (20). STRING was used to perform a protein network interaction analysis among the E2Fs.
UCSC Xena (https://xenabrowser.net) is a genome-related database that can be used as a visualization and analysis tool (21). Data on the relationship between the gene expression levels of E2Fs and their copy number segments were downloaded from the Genomic Data Commons (GDC) TCGA STAD data in the UCSC Xena browser (accessed between June and October 2020).
IBM SPSS 19.0 software was used for statistical analyses. Measurement data were analyzed using the Student’s t-test. The significance threshold of p-value was 0.05.
The results obtained from the ONCOMINE database are presented in Figure 1 and Table 2. FDR method was used to correct for multiple testing. Significantly higher mRNA expression of E2F2/3/7 was found in GC tissues in multiple datasets (Figure 1). In DErrico’s Gastric dataset (22), E2F2 was overexpressed in gastric mixed adenocarcinoma tissues compared with that in the normal controls, with a fold change of 2.256 (p = 8.84E-05). Significant upregulation of E2F3 was also found in different GC tissues compared to that in normal tissues. In addition, Cui et al. have shown that E2F3 is upregulated in GC (fold change = 1.556, p = 6.88E-07) compared to that in the normal controls (12). Wang et al. have also reported that E2F3 is overexpressed in GC (fold change=2.261, p=1.99E-04) (13). Furthermore, E2F7 was upregulated in GC (fold change = 1.977, p = 3.93E-05) and gastric intestinal-type adenocarcinoma (fold change = 3.234, p = 3.39E-07) (Table 2).
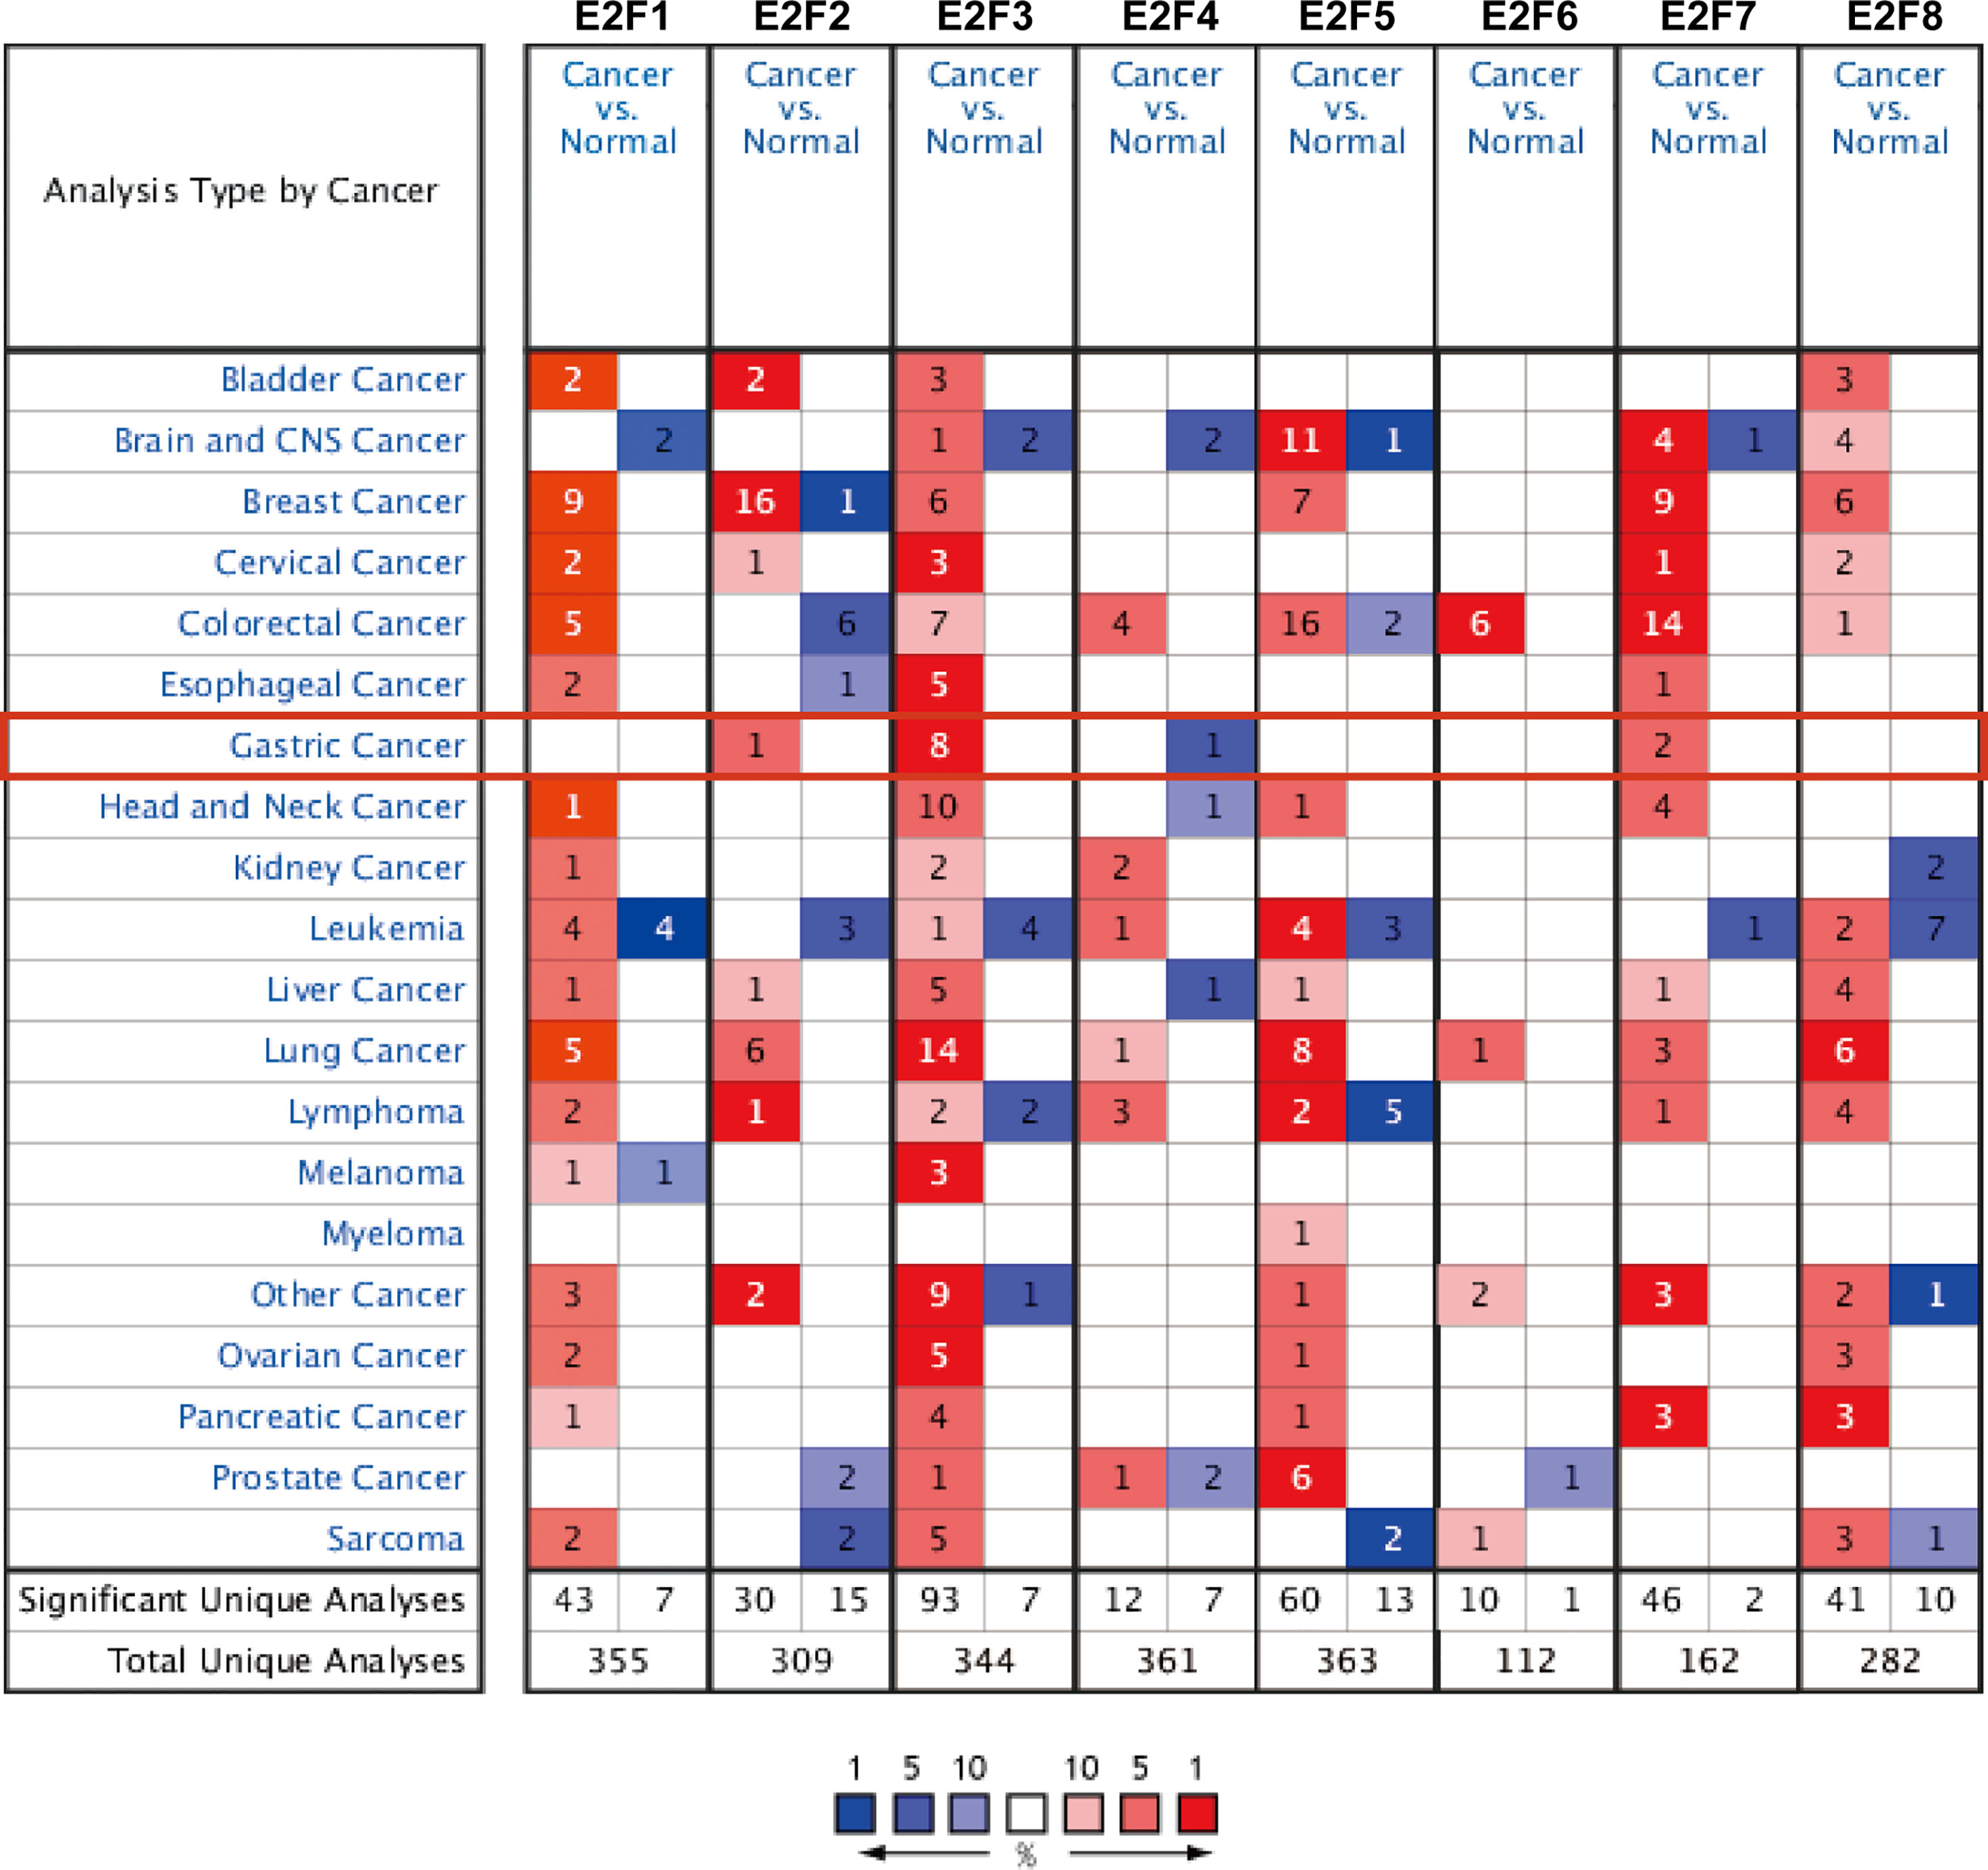
Figure 1 The mRNA expression levels of E2Fs in 20 different types of cancer diseases (ONCOMINE). Differences in the mRNA levels were compared by student’s t-test. The parameters were set as follows: p = 0.01, fold change = 1.5, gene rank = 10%, and data type = mRNA. Multiple testing correction was conducted using the false discovery rate (FDR) method.
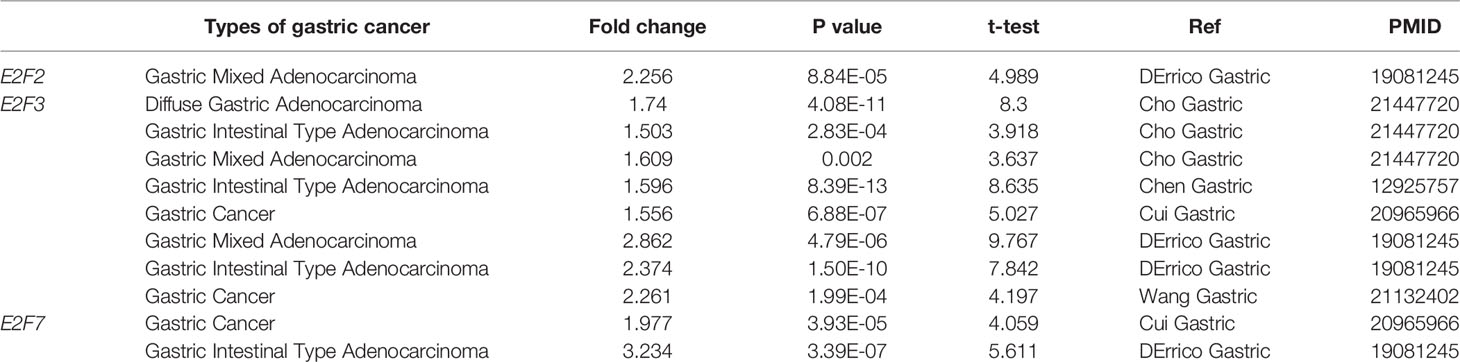
Table 2 Changes of E2Fs mRNA levels between different types of GC and normal gastric tissues (ONCOMINE).
The results from the GEPIA2 dataset indicated that higher mRNA levels of E2F1/2/3/5/7/8 were observed in STAD tissues compared with those in the normal controls, whereas E2F4/6 were not differentially transcribed in STAD tissues compared with those in the normal tissues (Figure 2). FDR method was used to correct for multiple testing. The results from RT-PCR indicated that all E2Fs, except E2F7, were overexpressed in GC cell lines (Figure 3).
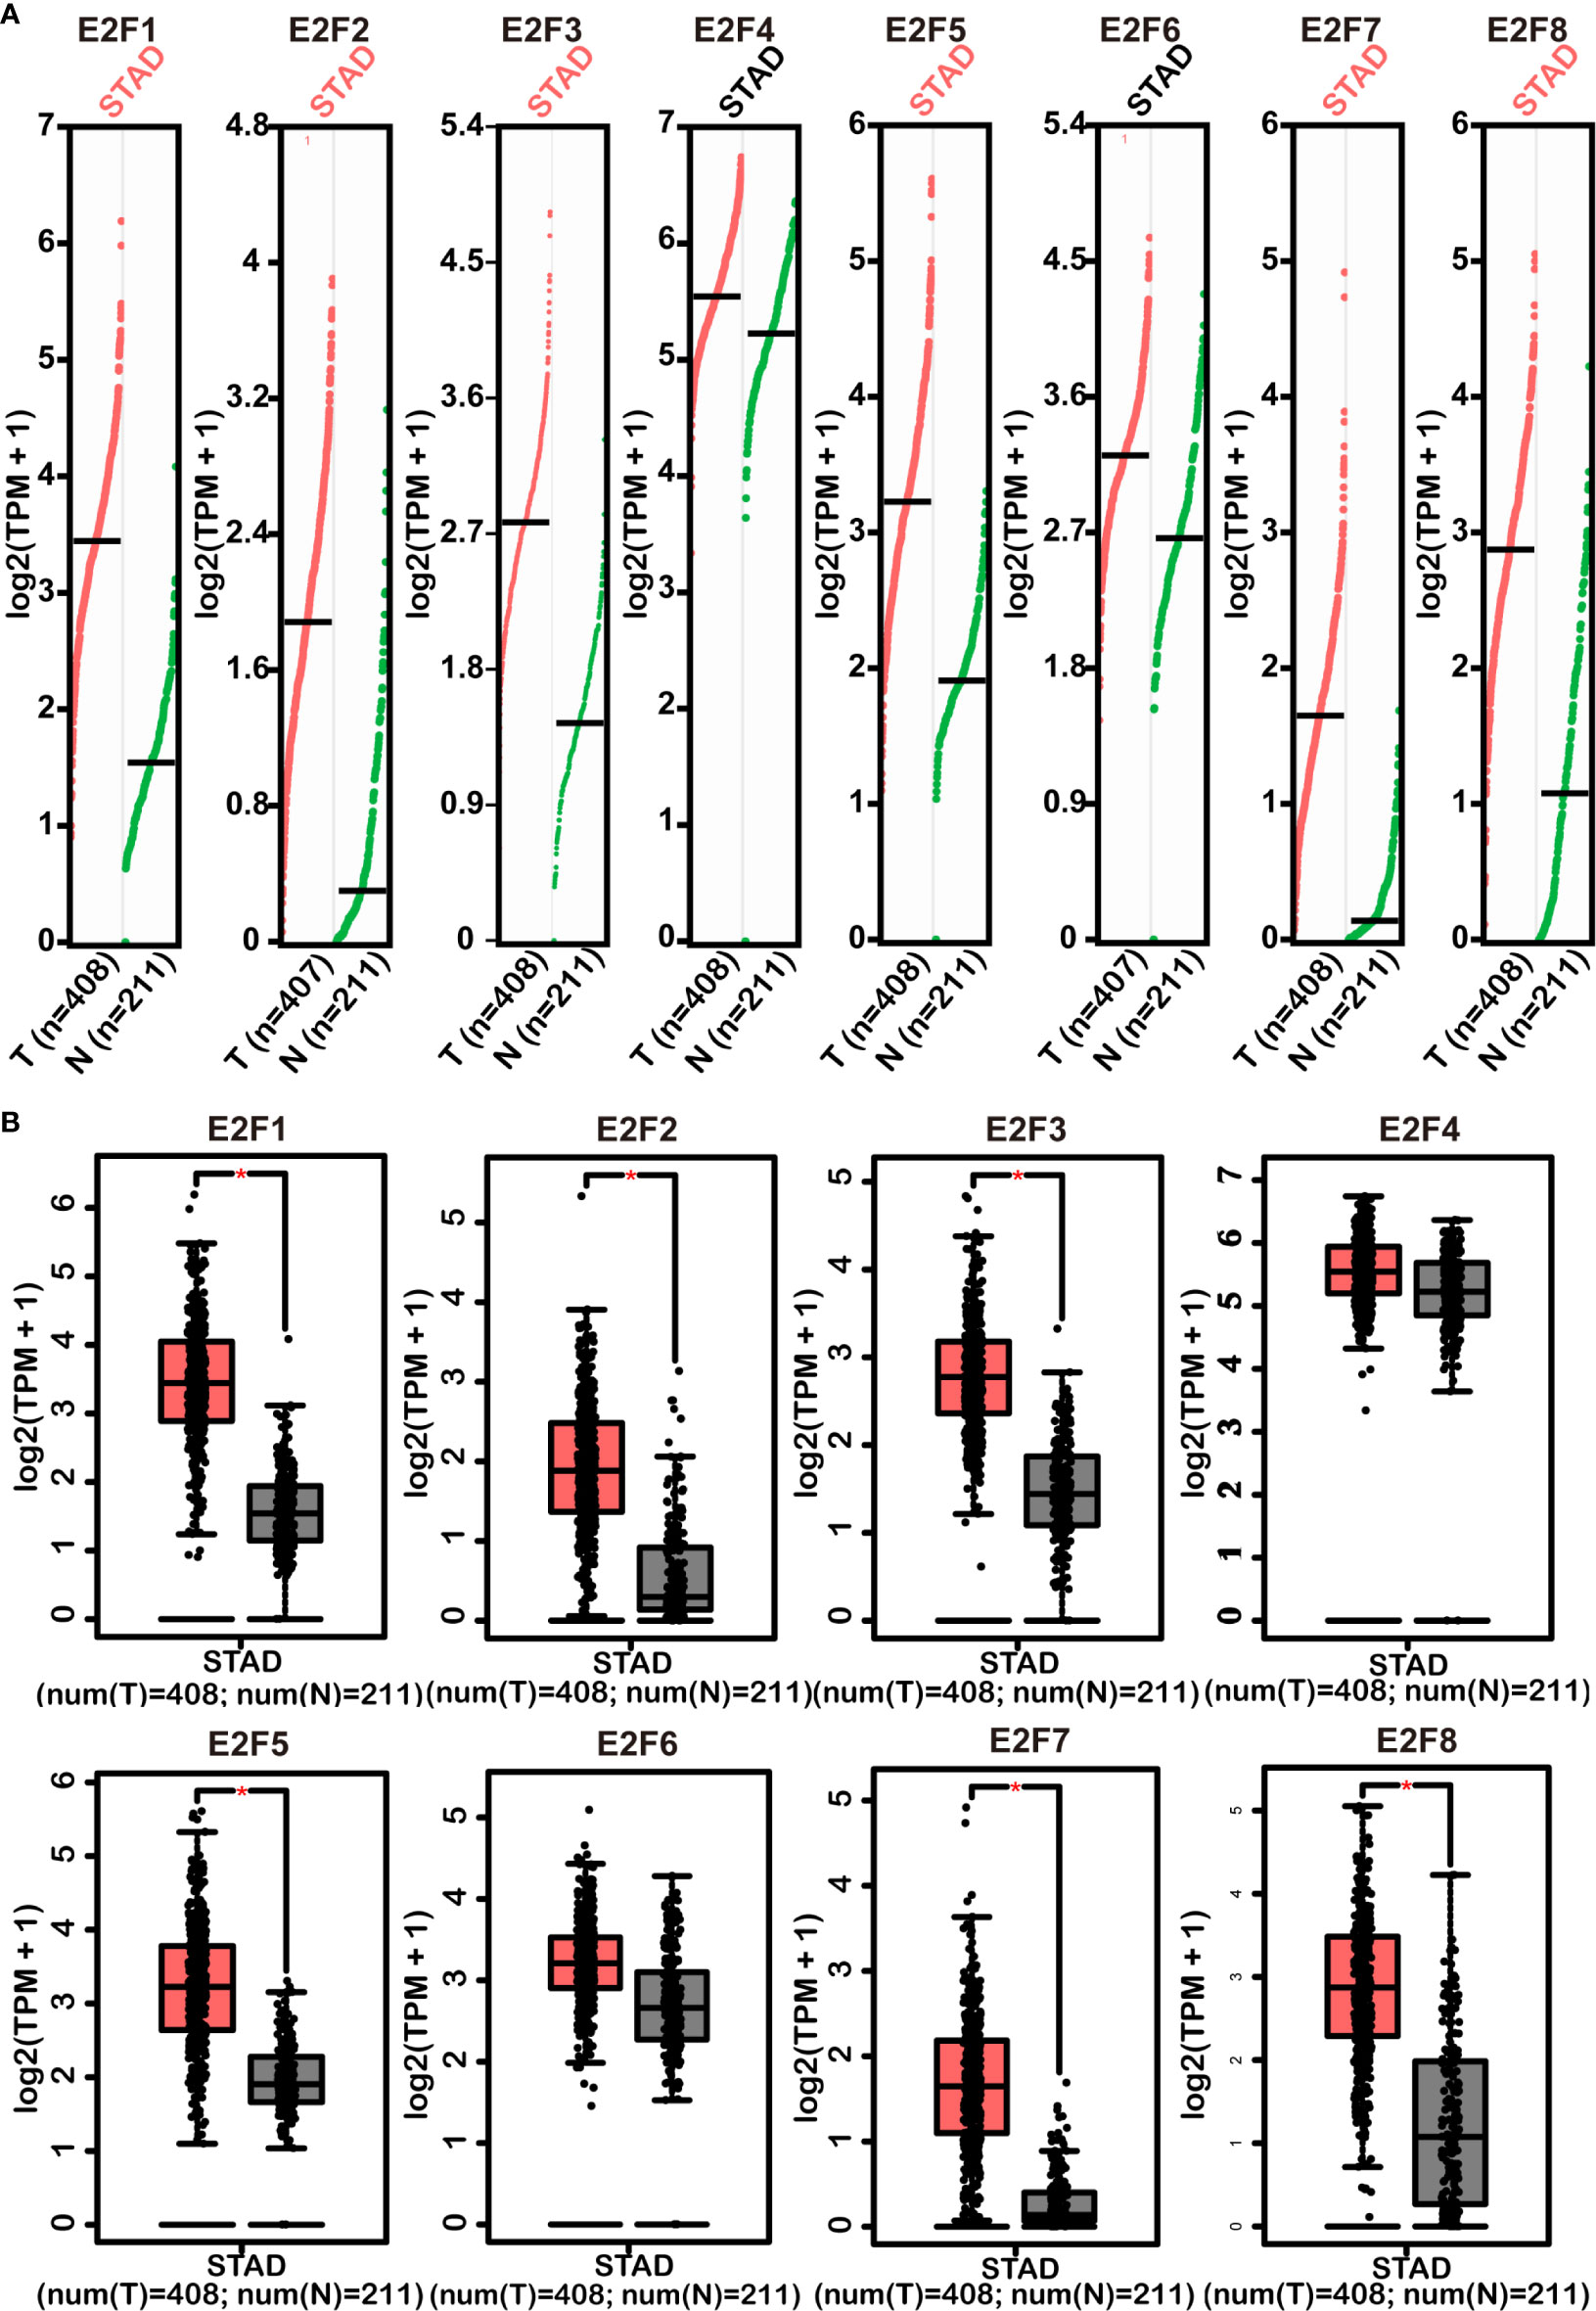
Figure 2 Comparisons of mRNA levels of E2Fs in STAD tissues with those in normal stomach tissues (GEPIA2). Scatter diagram (A) and box plot (B) represented differences of the mRNA level of E2Fs between STAD tissues and normal controls. Multiple testing correction was conducted using the false discovery rate (FDR) method. The parameters were set as follows: p = 0.01, |Log2FC| = 1, matched normal data = match TCGA normal and GTEx data. Red versus grey in (B) represents tumor tissues versus normal tissues. The pink STAD in (A) and * in (B) indicate that the differences are statistically significant. STAD, stomach adenocarcinoma; TPM, transcripts per million; T, tumor samples; N, normal samples.
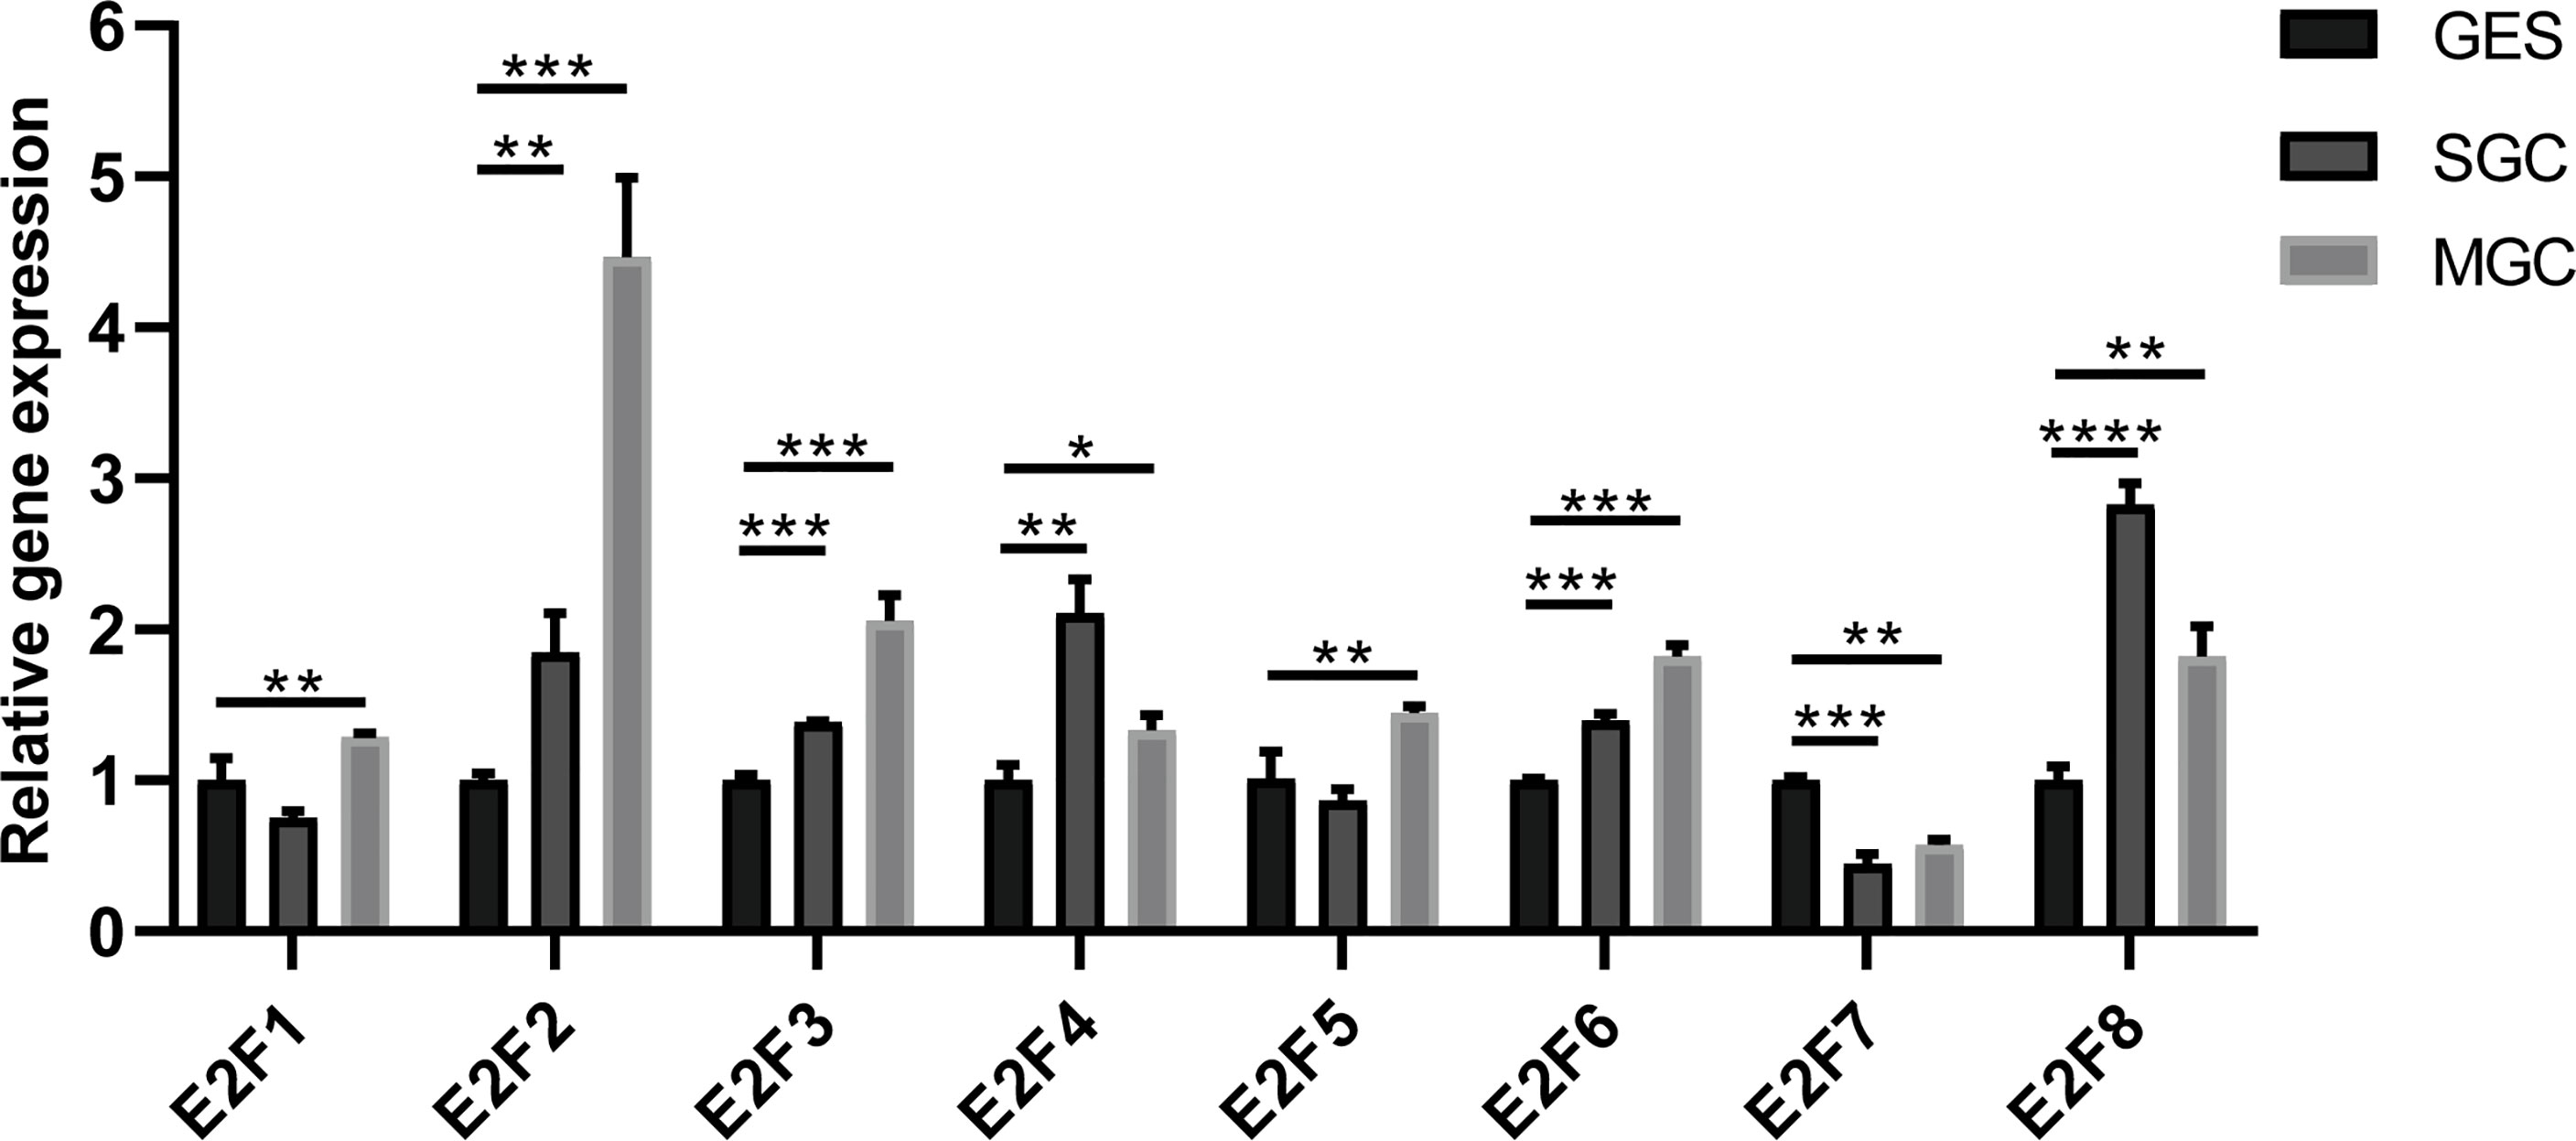
Figure 3 Differential expressions of E2Fs in GC cell lines and normal gastric epithelial cell line. MGC, gastric cancer cell line MGC-803; SGC, gastric cancer cell line SGC-7901; GES, normal gastric epithelial cell line GES-1. *p < 0.05, **p < 0.01, *** p < 0.001, and ****p < 0.0001.
We tried to elucidate the relationship between the mRNA levels of E2Fs and the STAD tumor stage. As shown in Figure 4, we unexpectedly found no significant associations between the mRNA levels of E2Fs and tumor stages (p > 0.01). We further found that the increased transcriptional levels of E2F1 and E2F4 were correlated with unfavorable OS, FP, and PPS (p < 0.05) in the GC patients (Figure 5). However, the increased transcriptional levels of E2F2/5/7/8 favored the OS, FP, and PPS of GC patients (p < 0.05) (Figure 5). In addition, high transcriptional levels of E2F3/6 significantly favored OS and PPS in GC patients (p < 0.05) (Figure 5).
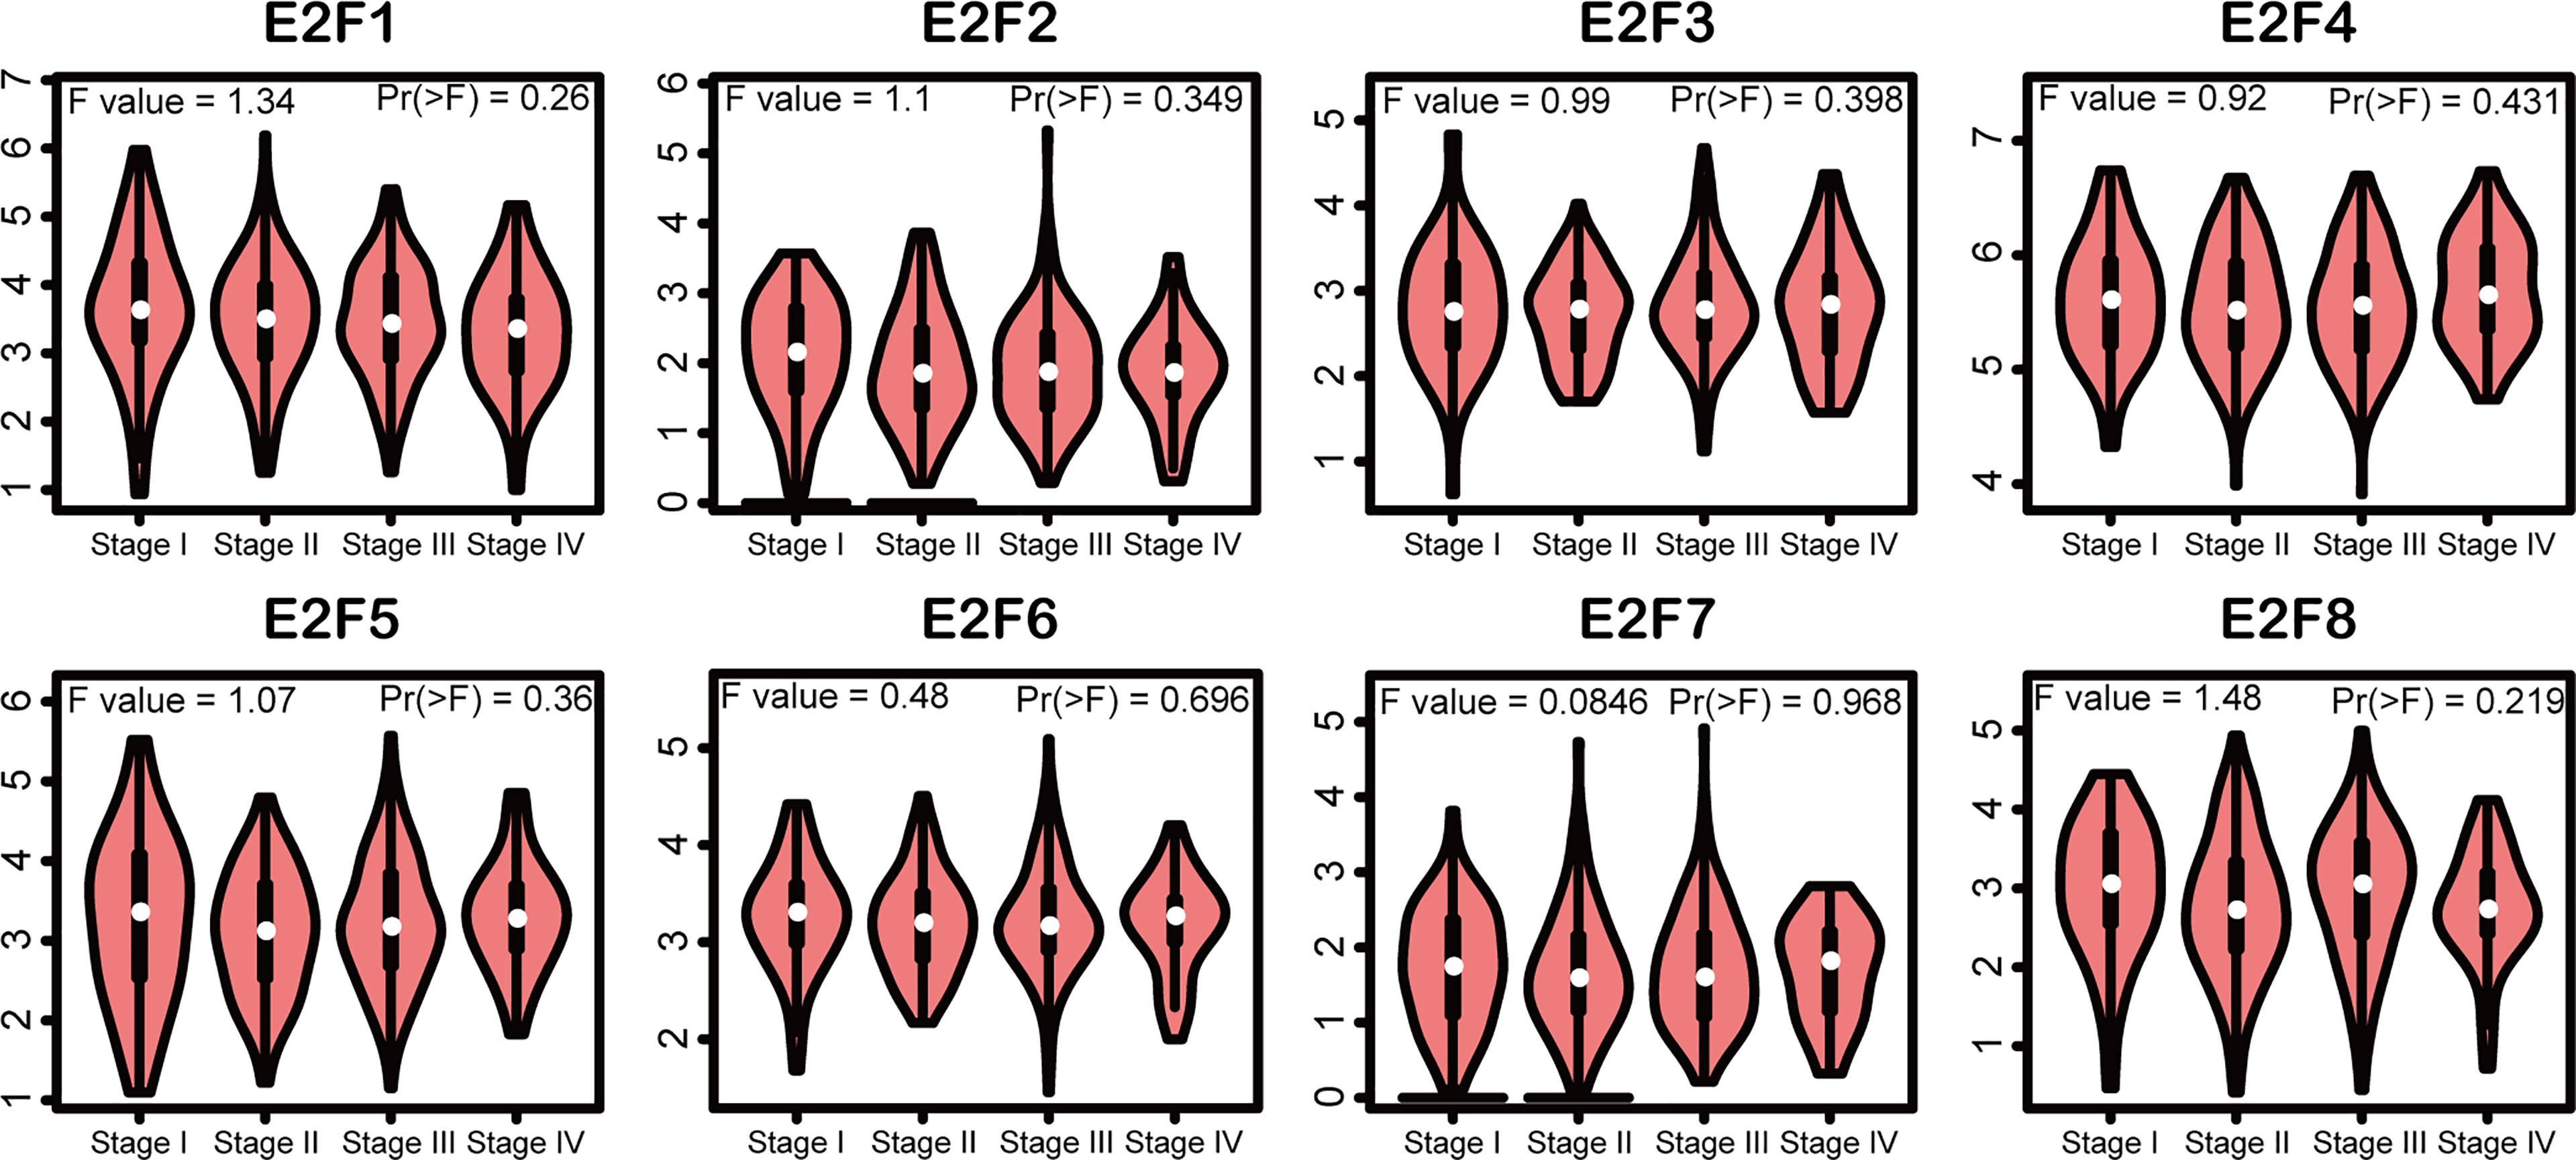
Figure 4 Association of mRNA expression of E2Fs with tumor stages of STAD patients (GEPIA2). Violin plots depicted the differences of mRNA level of E2Fs across STAD tumor stage. The statistical significance was examined using one-way analysis of variance (ANOVA). The significance threshold was set at p < 0.01.
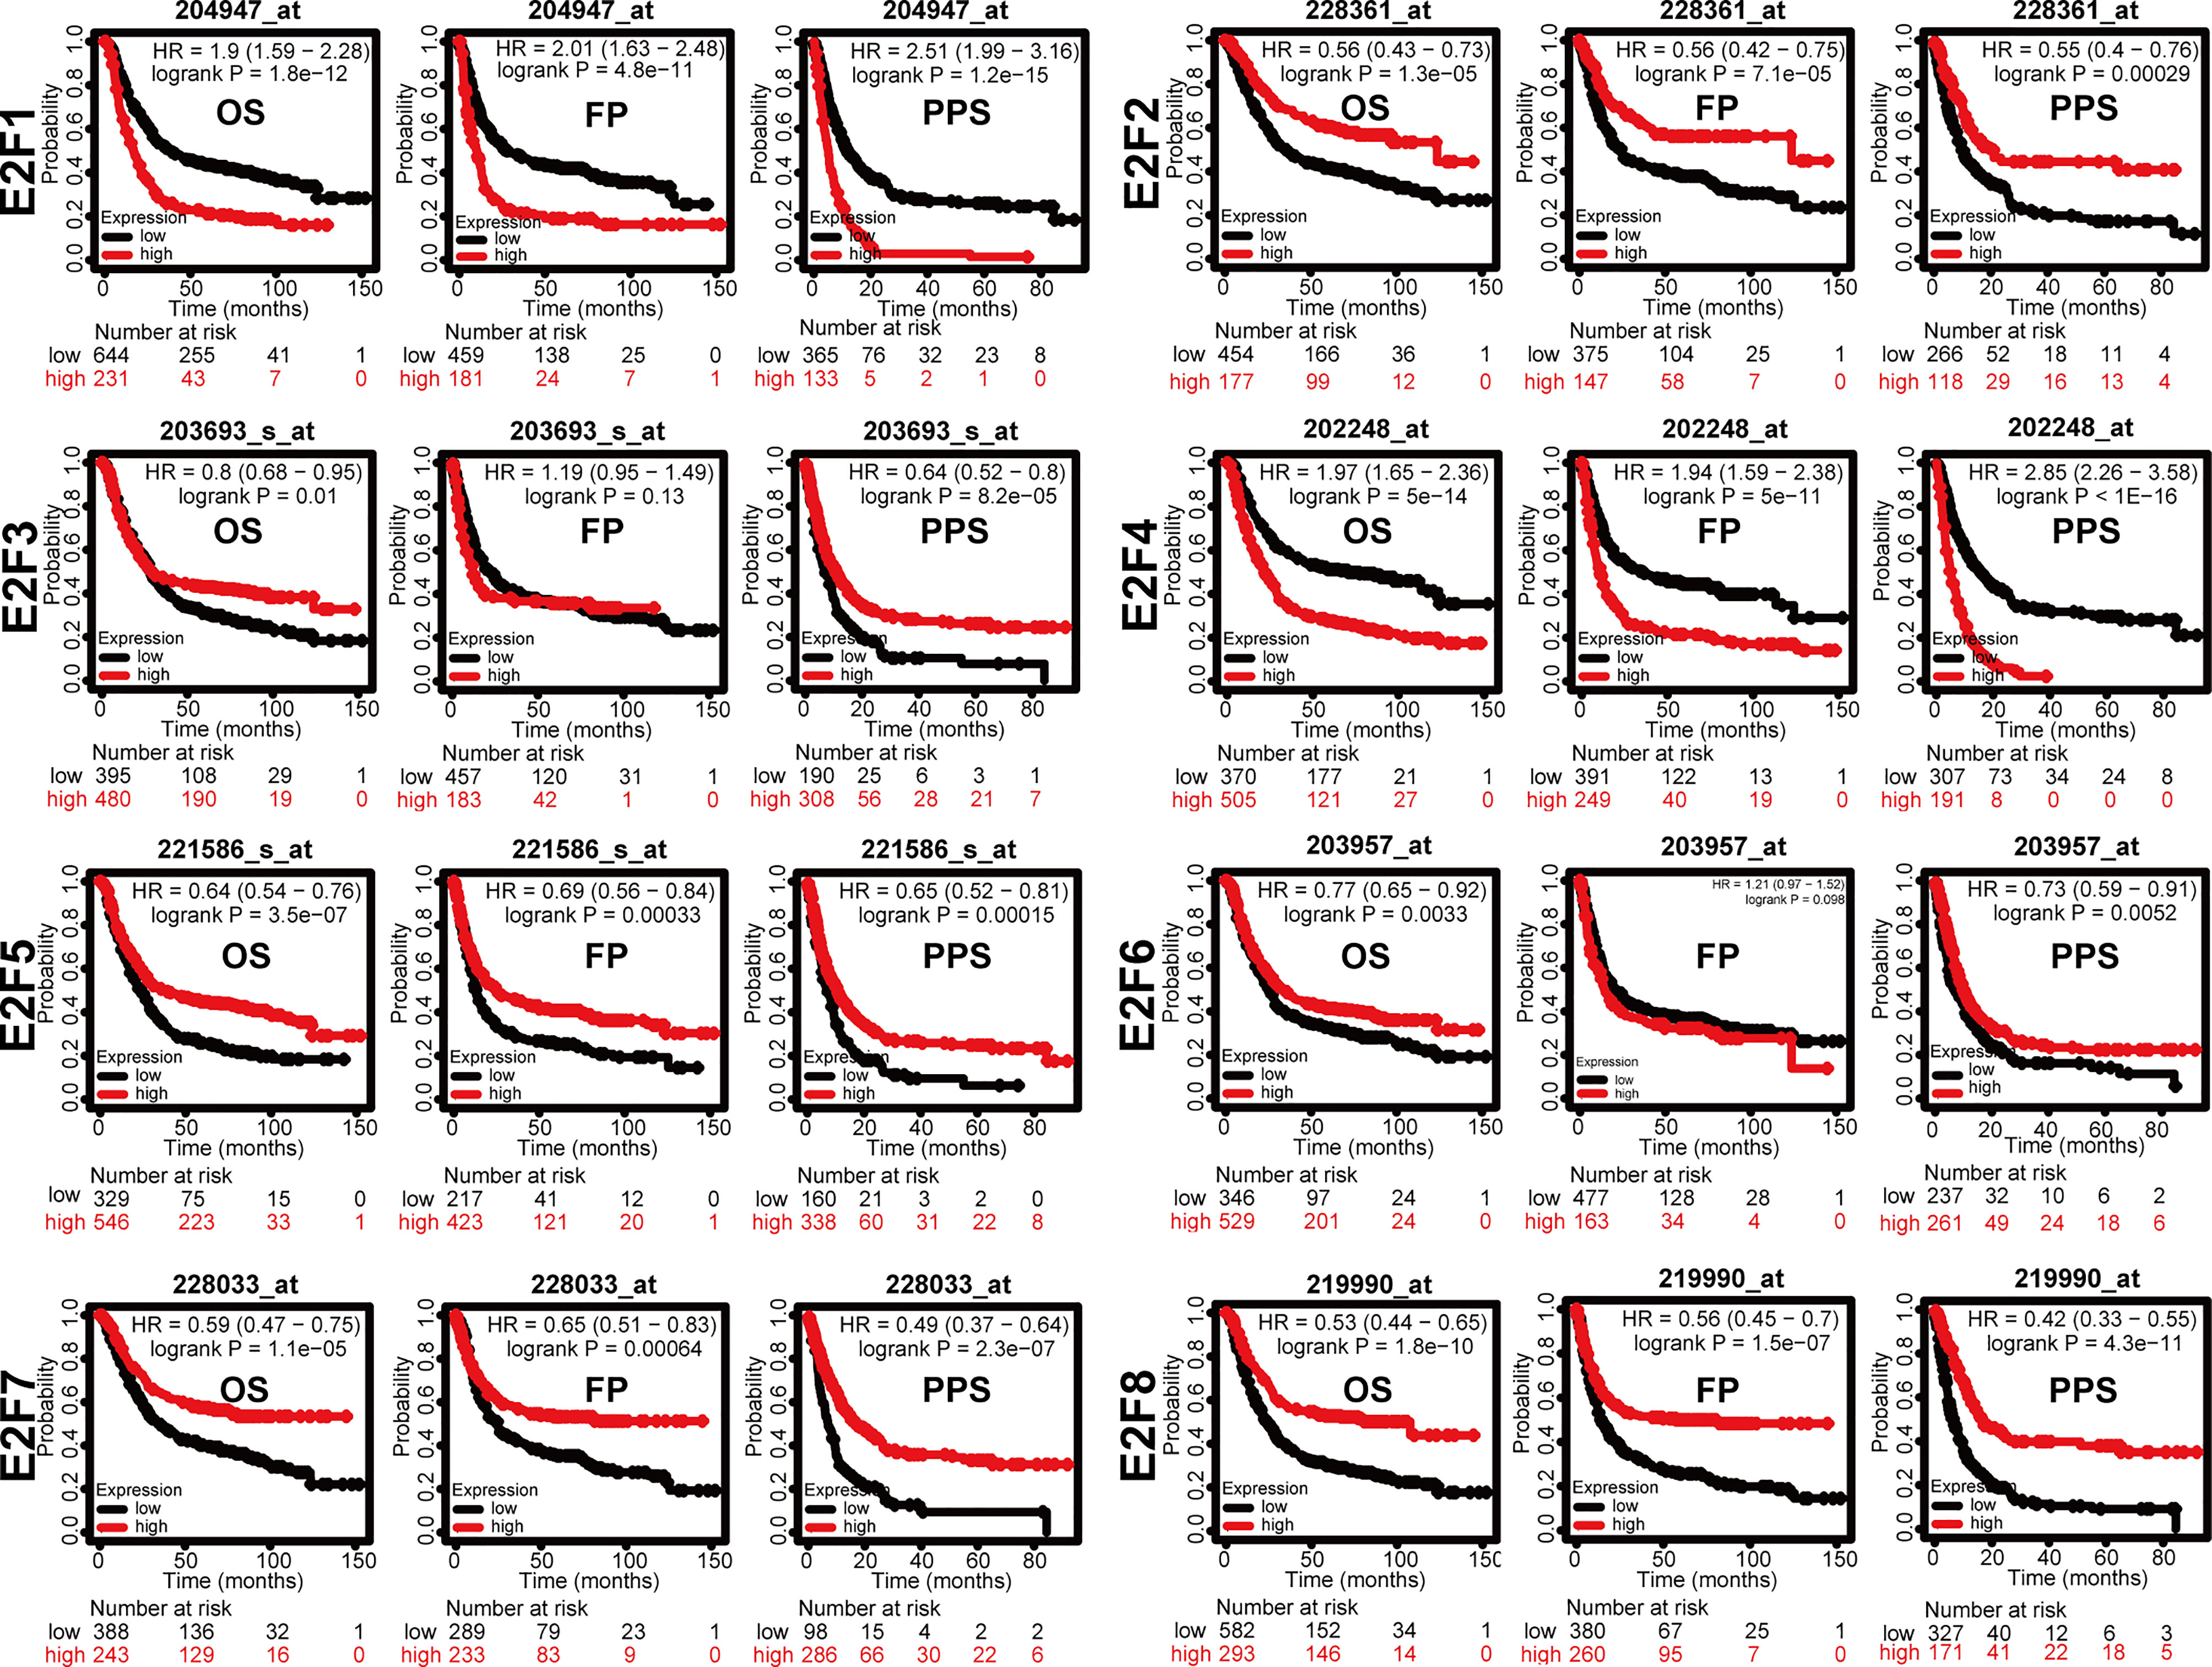
Figure 5 Prognostic value of mRNA expression of E2Fs in GC patients (Kaplan-Meier Plotter). Overall survival curve, progression-free survival, and post-progression survival curve of GC patients were plotted. The JetSet best probe set was used as the probe set option. Patients were split by the auto selected best cutoff. If the expression level was higher than the cutoff value, the OS curve was marked as high; if the expression level was lower than the cutoff value, the OS curve was marked as low. The cutoff for significance was set to p < 0.05. OS, overall survival; FP, first progression; PPS, post-progression survival.
To assess the gene mutations of E2Fs and their relevance to OS and DFS, we used the cBioPortal online tool for STAD (TCGA, Firehose Legacy; https://www.cbioportal.org). As shown in Figure 6A, a total of 415 patients with STAD were analyzed, and gene mutations were found in 224 (54%) patients. E2F5, E2F1, E2F3, and E2F4 had the highest gene mutation percentages (19%, 18%, 14% and 12%, respectively). As shown in Figure 6B, patients with tubular STAD were the most likely to have gene alterations of E2Fs (67.11% of 76 cases). Furthermore, genetic alterations in E2Fs were associated with longer DFS (Figure 6D, p = 5.262E-3) but not OS (Figure 6C, p = 0.231) of STAD patients.
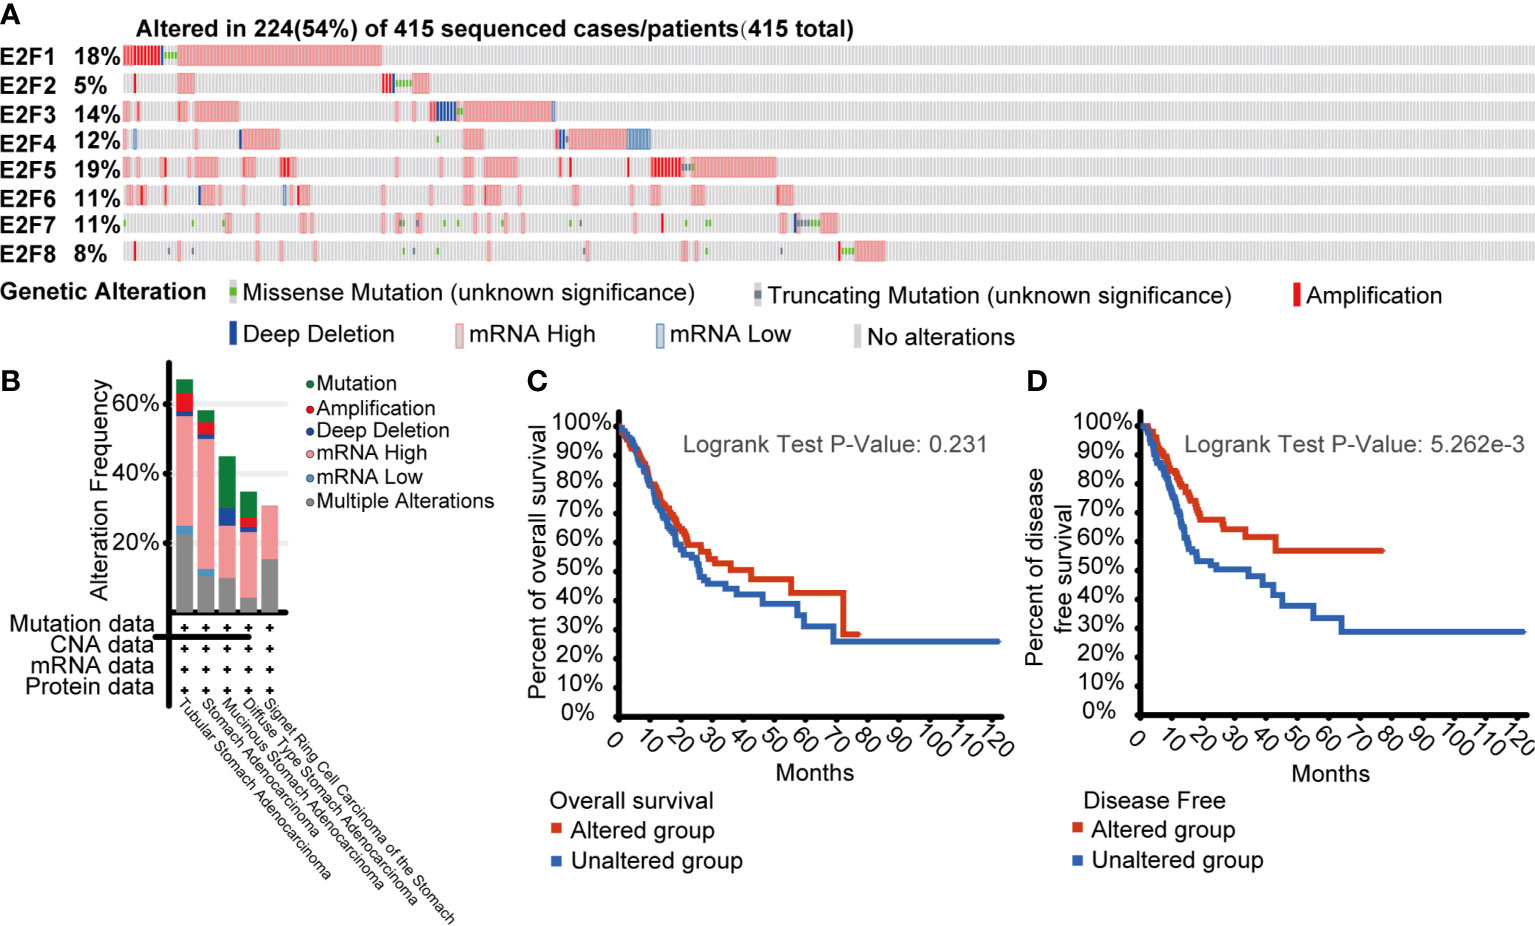
Figure 6 Gene mutations of E2Fs and their significance in overall survival (OS) and disease-free survival (DFS) of STAD patients (cBioPortal). (A) Analysis of gene mutations of E2Fs in GC. A total of 415 patients with STAD were analyzed, and gene mutations were found in 224 (54%) patients. E2F5, E2F1, E2F3, and E2F4 had the highest gene mutation percentages (19%, 18%, 14%, and 12%, respectively). (B) Cancer types summary of mutations in E2Fs. Patients with tubular STAD were the most likely to have gene alterations of E2Fs (67.11% of 76 cases). (C) Kaplan-Meier OS curve by E2Fs gene mutations status. (D) Kaplan-Meier DFS curve by E2Fs gene mutations status.
First, the top 30 similar genes that have a similar expression pattern in STAD were identified using GEPIA2 datasets. The GO and KEGG enrichment pathway analyses of E2Fs and their similar genes were performed using Metascape. The results of GO and KEGG analyses are displayed in Figure 7 and Tables 3, 4. Eleven biological process (BP) items, six cellular component (CC) items, and three molecular function items made up the top 20 GO enriched list (Figures 7A, B and Table 3). BPs such as mitotic nuclear division, DNA replication, DNA repair, DNA conformation change, and cell cycle phase transition were significantly regulated by these genes. CCs, including spindles, replication forks, condensed nuclear chromosomes, nuclear peripheries, condensin complexes, nuclear bodies, were remarkably associated with E2Fs and the similar genes. Additionally, the MFs associated with these genes were ATPase activity, single-stranded DNA binding, and chromatin binding. KEGG pathway analysis revealed the involvement of E2Fs in pathways such as the cell cycle, DNA replication, spliceosome, and RNA transport in STAD (Figures 7C, D and Table 4). PPI enrichment analysis was performed, and significant modules were identified (Figures 7E, F). Seven MCODE components were extracted, which were mainly associated with chromosomes, centromeric regions, chromosomal regions, and kinetochores.
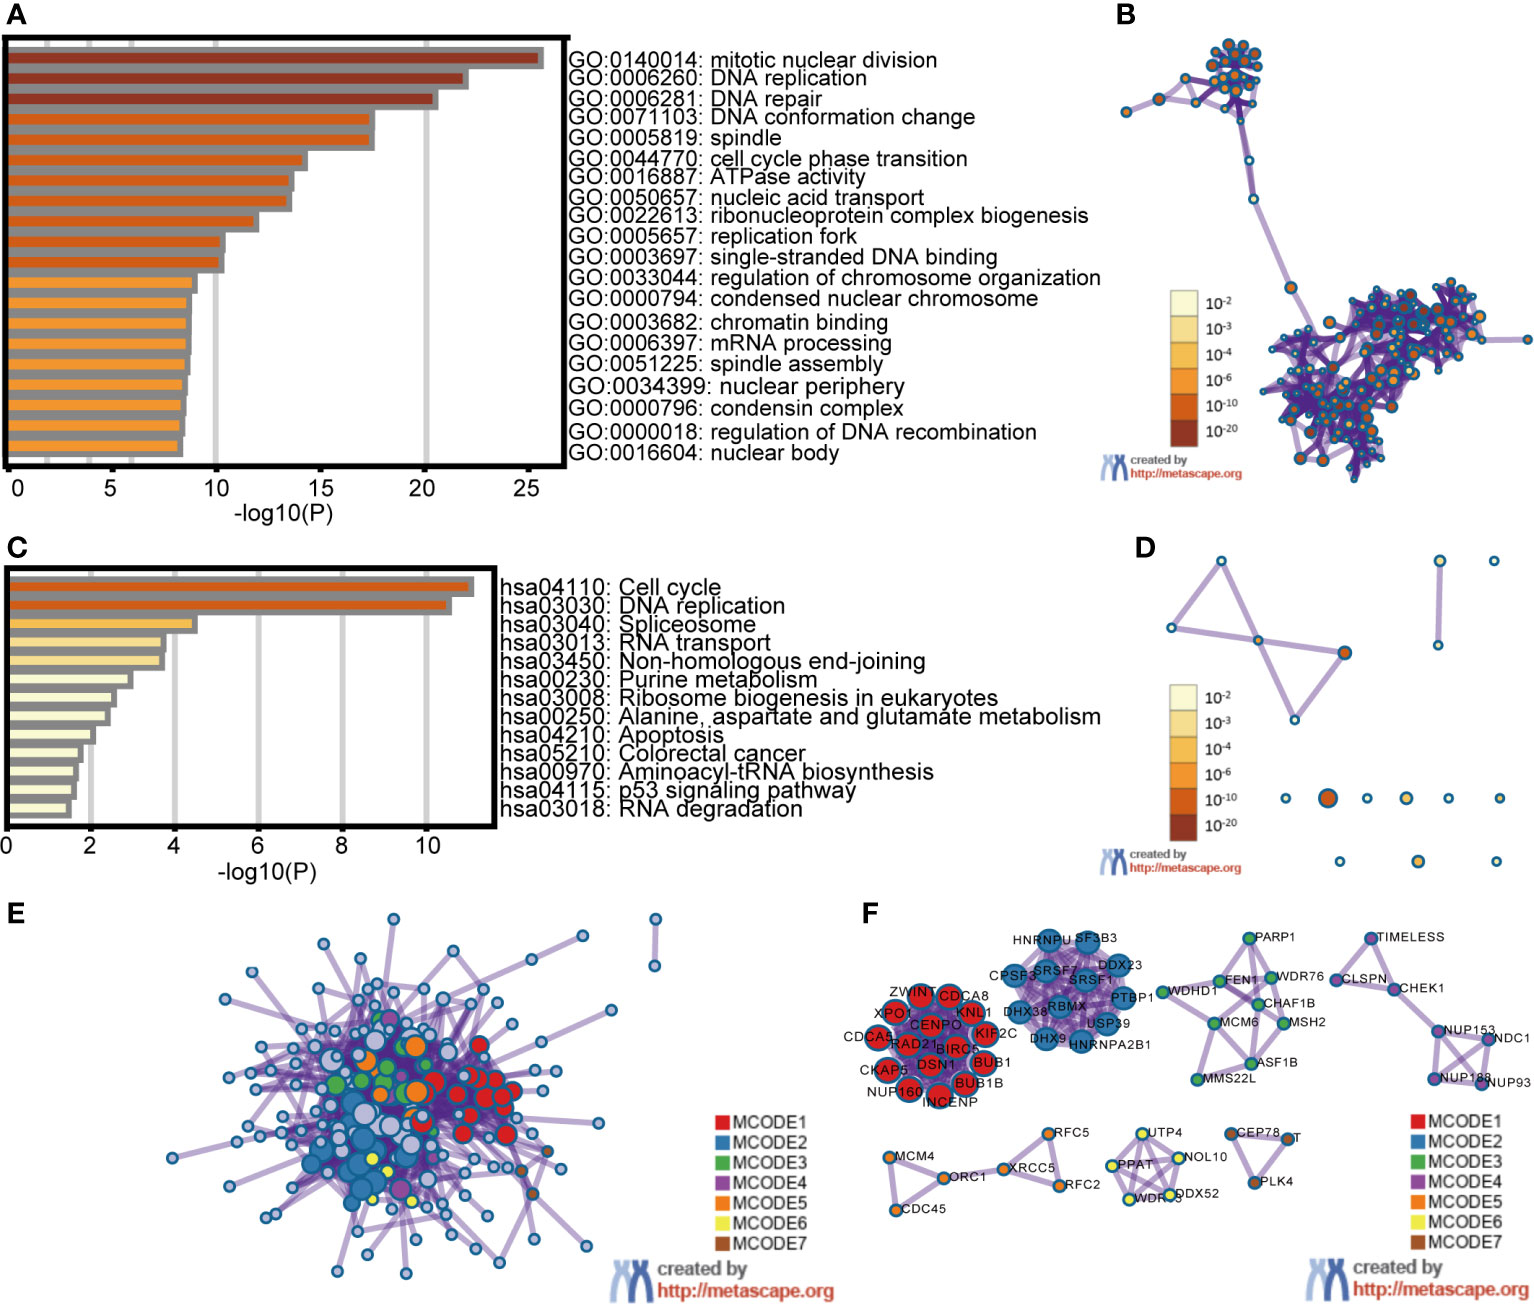
Figure 7 Enrichment analysis of E2Fs and the genes similar to them in STAD patients (Metascape). The top 30 similar genes of each E2F family member in STAD were identified using the GEPIA2 datasets. The Metascape was used to perform Gene Ontology (GO) and Kyoto Encyclopedia of Genes and Genomes (KEGG) enrichment pathway analysis of the E2Fs and similar genes. A subset of enriched terms was selected and rendered as network plots to further reveal the relationships between the enriched terms. A Protein-protein interaction (PPI) network was created using BioGrid, InWeb_IM, and OmniPath. In addition, the molecular complex detection (MCODE) algorithm was utilized to analyze clusters of the PPI network. (A) Heatmap of GO enriched terms colored by p-value. (B) Network of GO enriched terms colored by p-value, where terms containing more genes tend to have a more significant p-value. (C) Heatmap of KEGG enriched terms colored by p-value. (D) Network of KEGG enriched terms colored by p-value, where terms containing more genes tend to have a more significant p-value. (E) PPI network of genes similar to E2Fs. (F) MCODE components identified in genes similar to E2Fs.
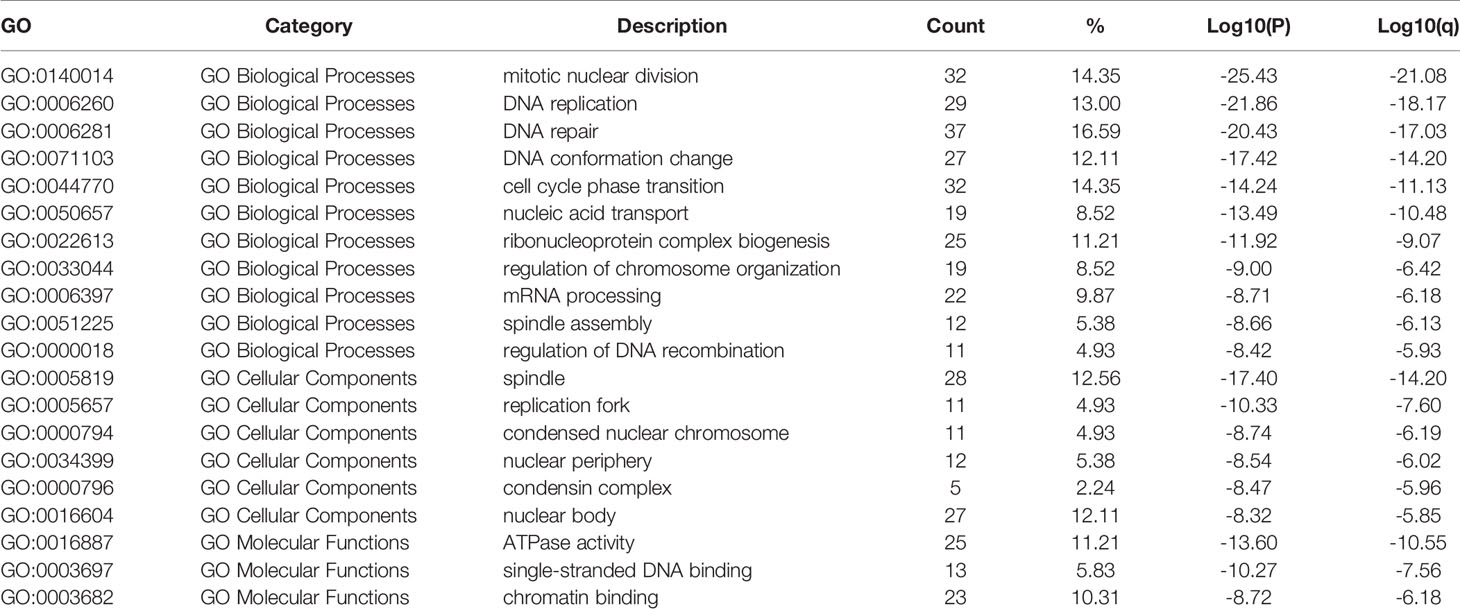
Table 3 GO function enrichment analysis of E2Fs and their similar genes in STAD (Metascape).
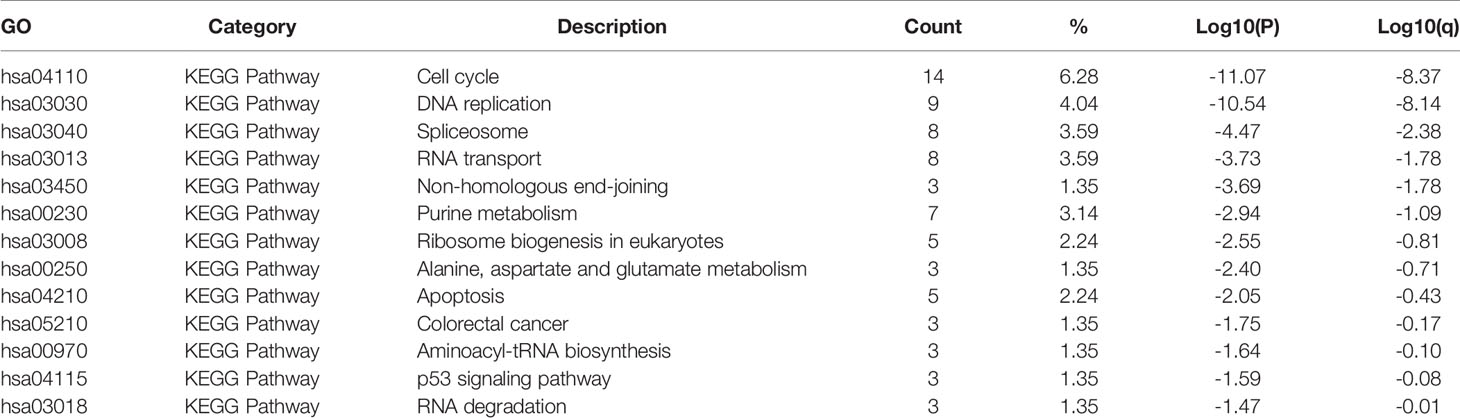
Table 4 KEGG enrichment analyses of E2Fs and their similar genes in STAD (Metascape).
Furthermore, GSEA of the E2Fs at the gene level was performed using the online tool LinkedOmics. The GSEA results showed that the mRNA expressions of E2F1/2/3/7/8 were closely associated with the cell cycle pathway (Figure 8). GSEA of E2F4 revealed significant enrichment in the ribosome. GSEA of E2F5 revealed a significant enrichment in ribosome biogenesis in eukaryotes, and GSEA of E2F6 revealed a significant enrichment in the spliceosome (Figure 8).
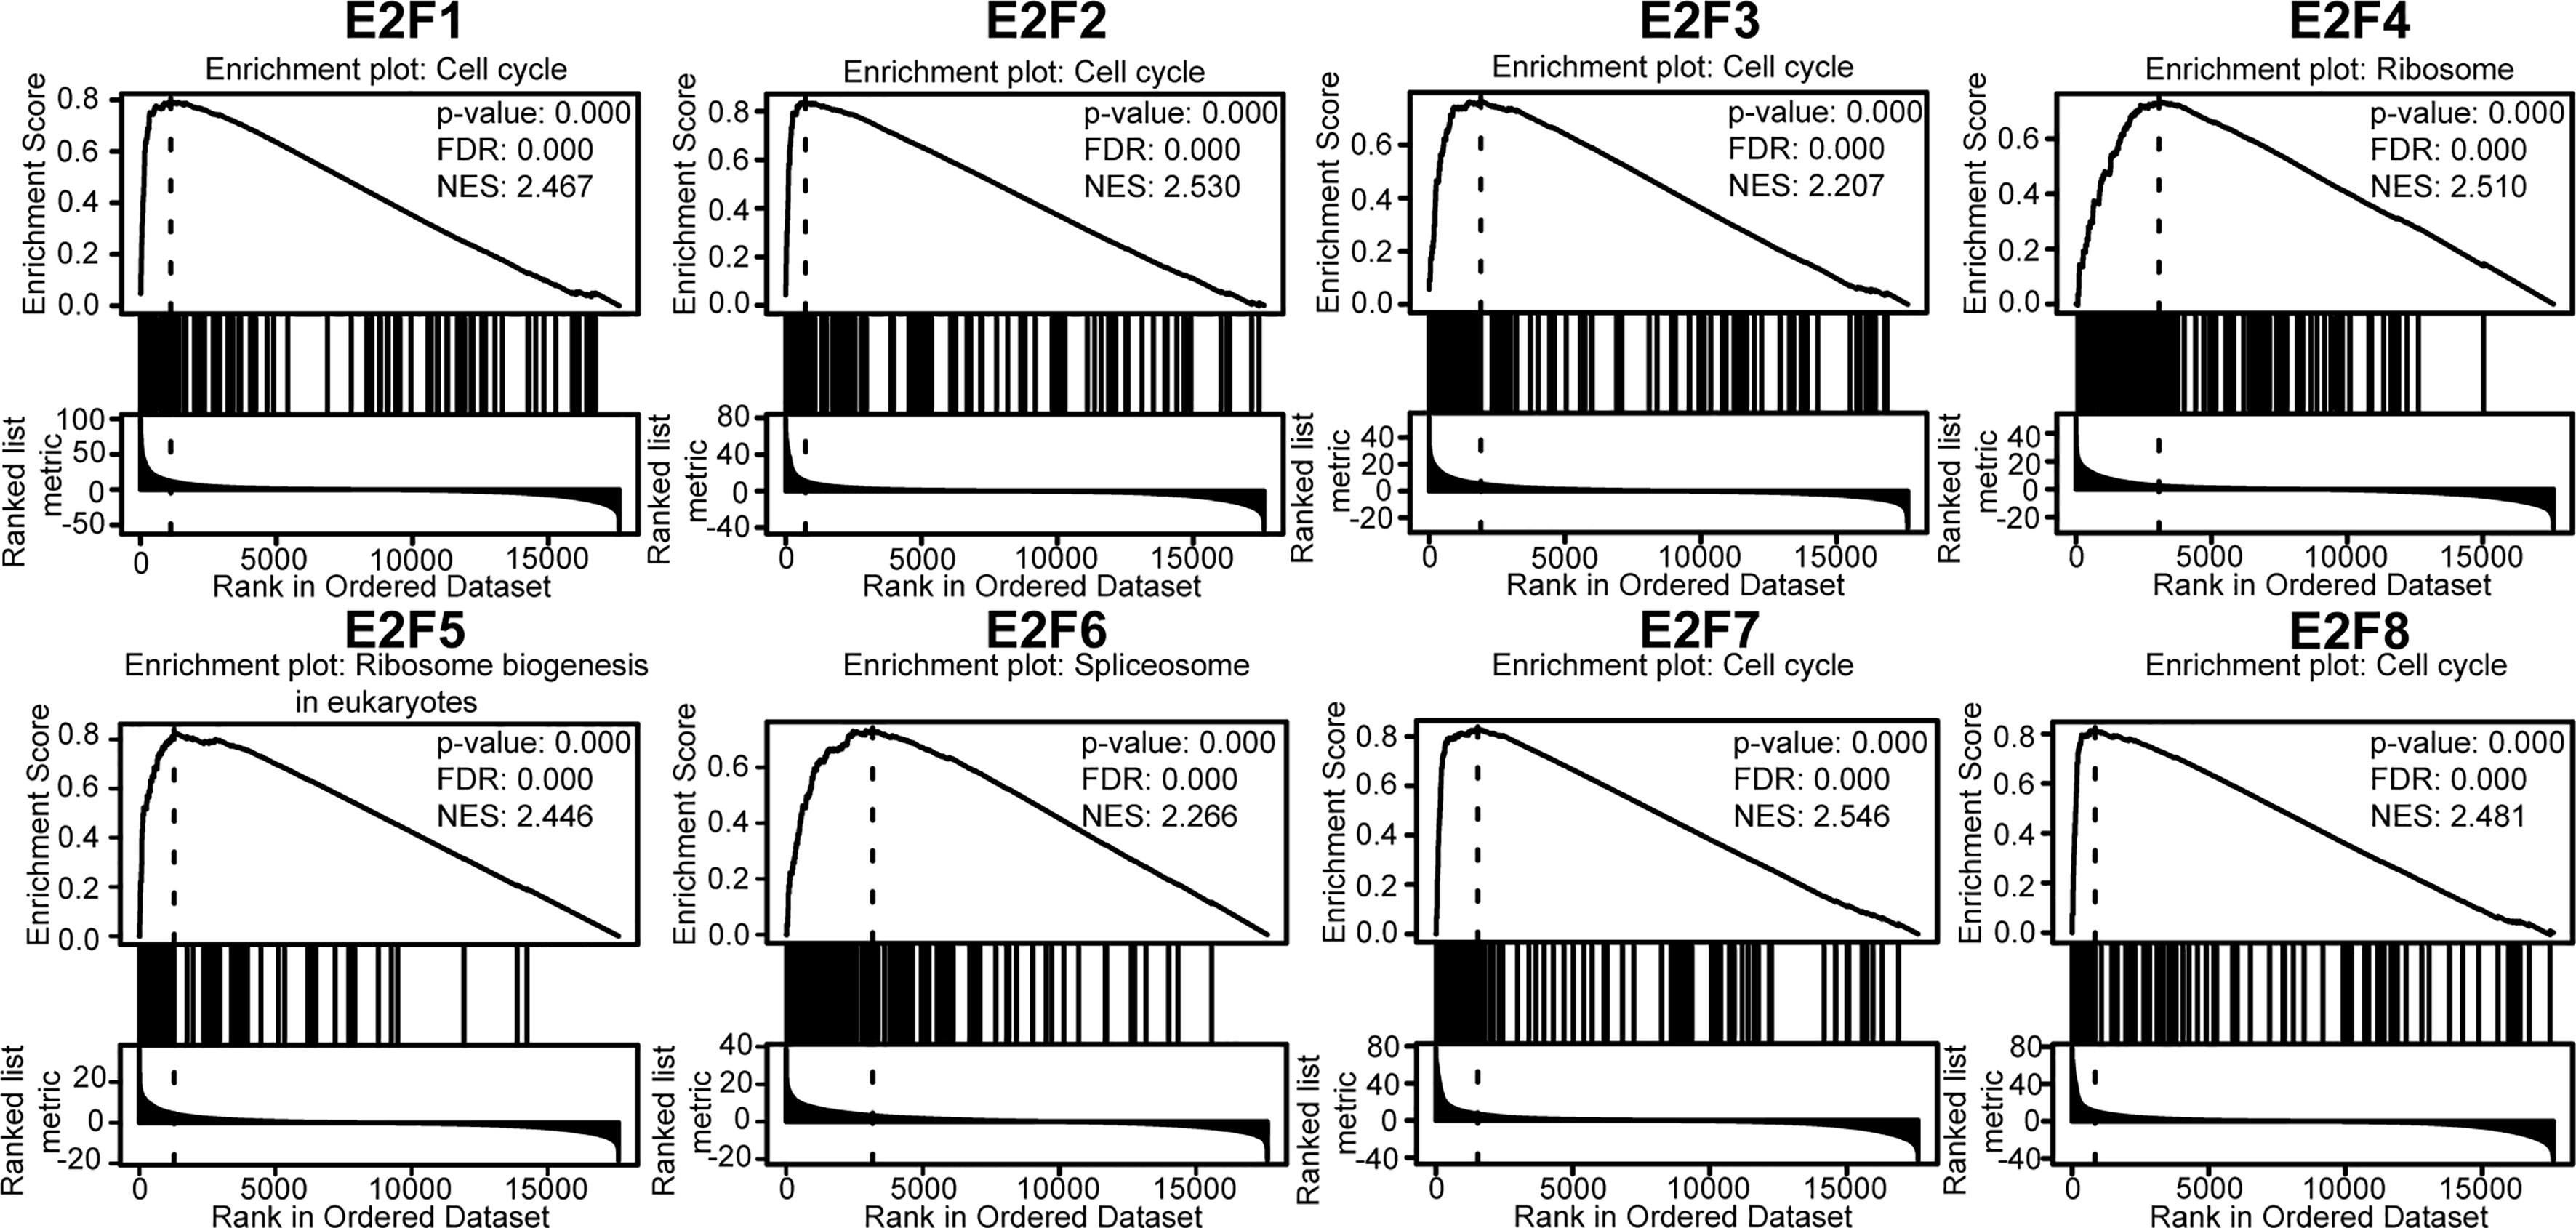
Figure 8 Gene set enrichment analysis (GSEA) of E2Fs (LinkedOmics). TCGA_STAD was selected as the interested cancer cohort, for which RNAseq datatype was selected as search dataset and target dataset. The interesting list was gsea_result_3583_1616921367.rnk. The interesting list contains 17608 unique entrezgene IDs. The expression dataset of 6843 genes related to the expression of E2Fs in 415 samples was used to perform GSEA using the “LinkInterpreter” module. The parameters were set as follows: enrichment analysis = KEGG pathway; rank criteria = FDR; minimum Number of Genes (Size) = 3; simulations = 500; p = 0.05; FDR < 0.25, |NES| > 1. The top-ranking enrichment term for each E2F factor was shown. TCGA, the cancer genome atlas; FDR, false discovery rate; NES, normalized enrichment score.
As shown in Figure 9A, there were significant and moderate positive correlations between E2F1 and E2F2, E2F3, E2F4, and E2F8; E2F2 with E2F1 and E2F8; E2F3 with E2F1, E2F5, E2F6, and E2F7; E2F4 with E2F1; E2F5 with E2F3 and E2F6; E2F6 with E2F3 and E2F5; E2F7 with E2F3 and E2F8; and E2F8 with E2F1, E2F2, and E2F7. The correlations remained significant after Bonferroni correction (adjusted p = 0.0018). As shown in Figure 9B, the results of correlation analysis of the E2Fs at the gene level indicated that 28 genes, including TFDP1, TFDP2 and TFDP3, were enriched in this network based on their functions related to co-expression, co-localization, genetic interactions, pathways, physical interactions, and shared protein domains. STRING was used to explore the potential interactions among the E2Fs at the protein level. As shown in Figure 9C, eight nodes and 12 edges were found in the PPI network.
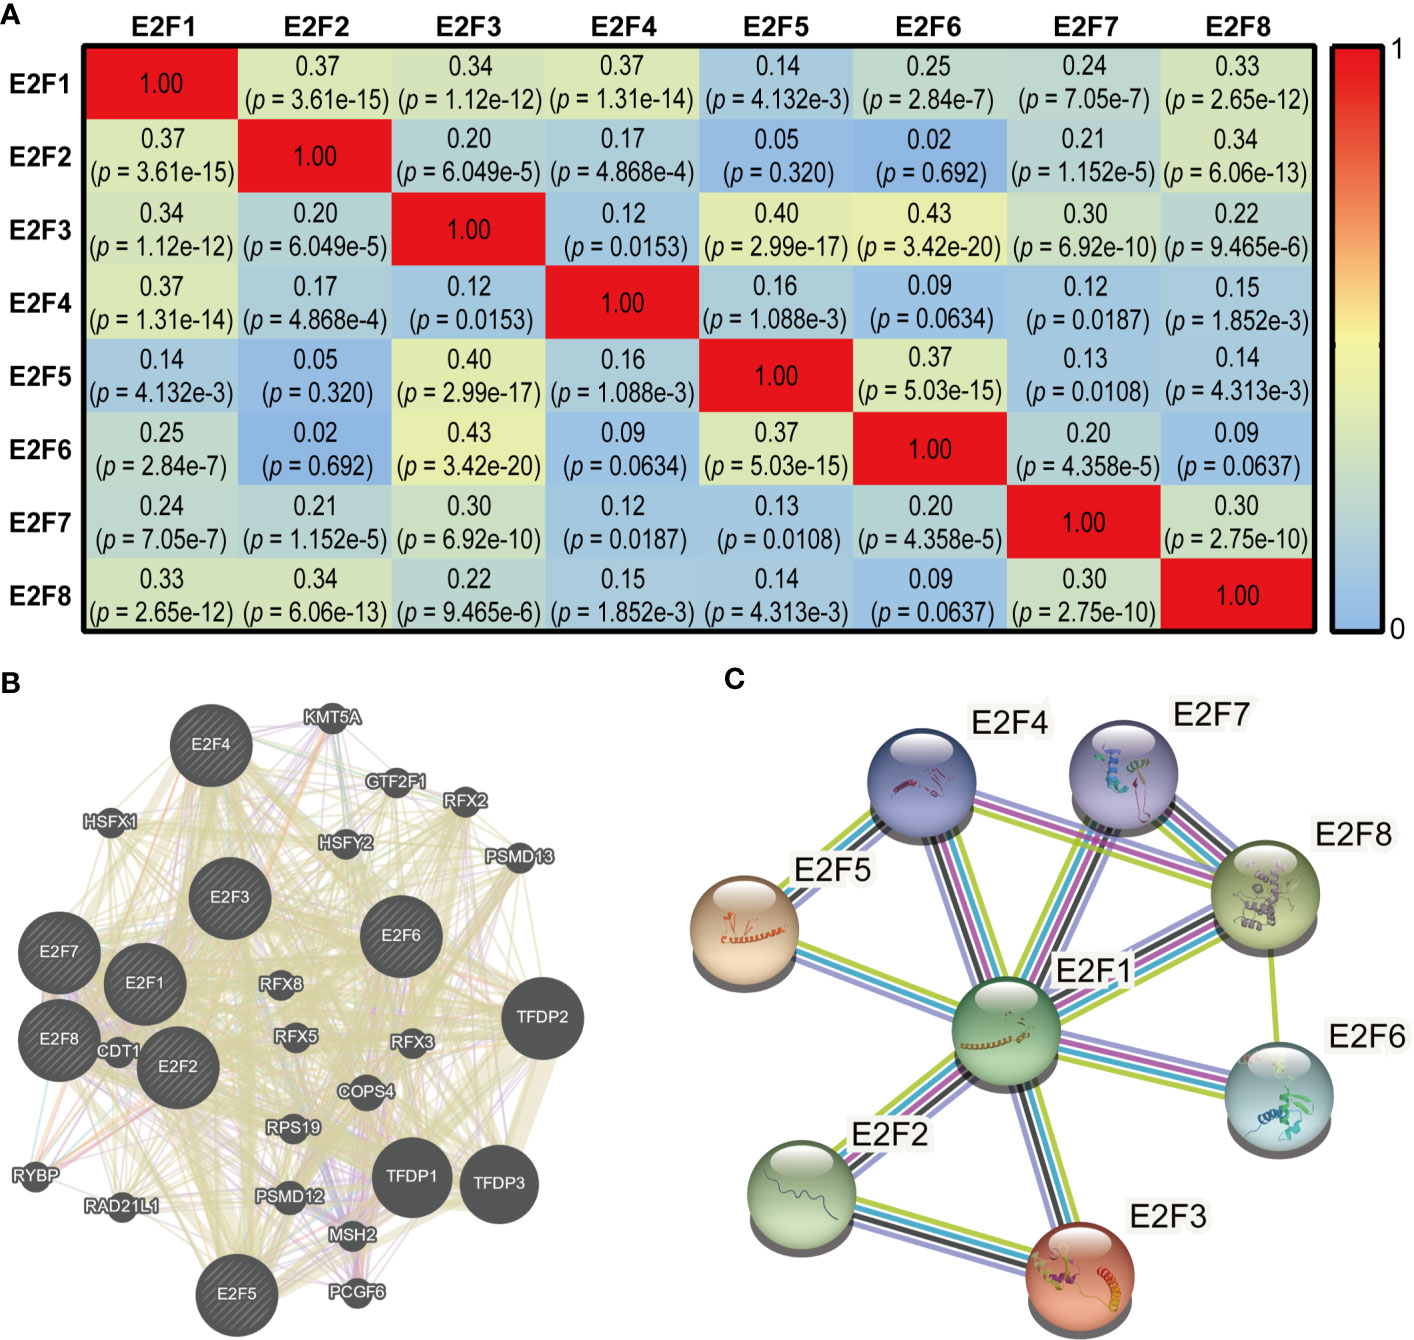
Figure 9 Co-expression and interaction analysis of E2Fs at gene and protein levels in STAD patients (cBioPortal, GeneMANIA and STRING). (A) Pearson correlation analysis of expression of E2Fs predicted by the cBioPortal. (B) Gene-gene interaction network among E2Fs predicted by the GeneMANIA. (C) Protein-protein interaction network among E2Fs predicted by the STRING.
We further explored the potential drivers of the elevated mRNA levels of the E2Fs in STAD. We sought to determine whether there was any correlation between the gene expression levels of E2Fs and the copy number segments from the GDC TCGA STAD data obtained using the UCSC Xena browser (https://xenabrowser.net). As indicated in Figure 10, the gene expression of all E2Fs had a positive and significant relationship with their copy numbers.
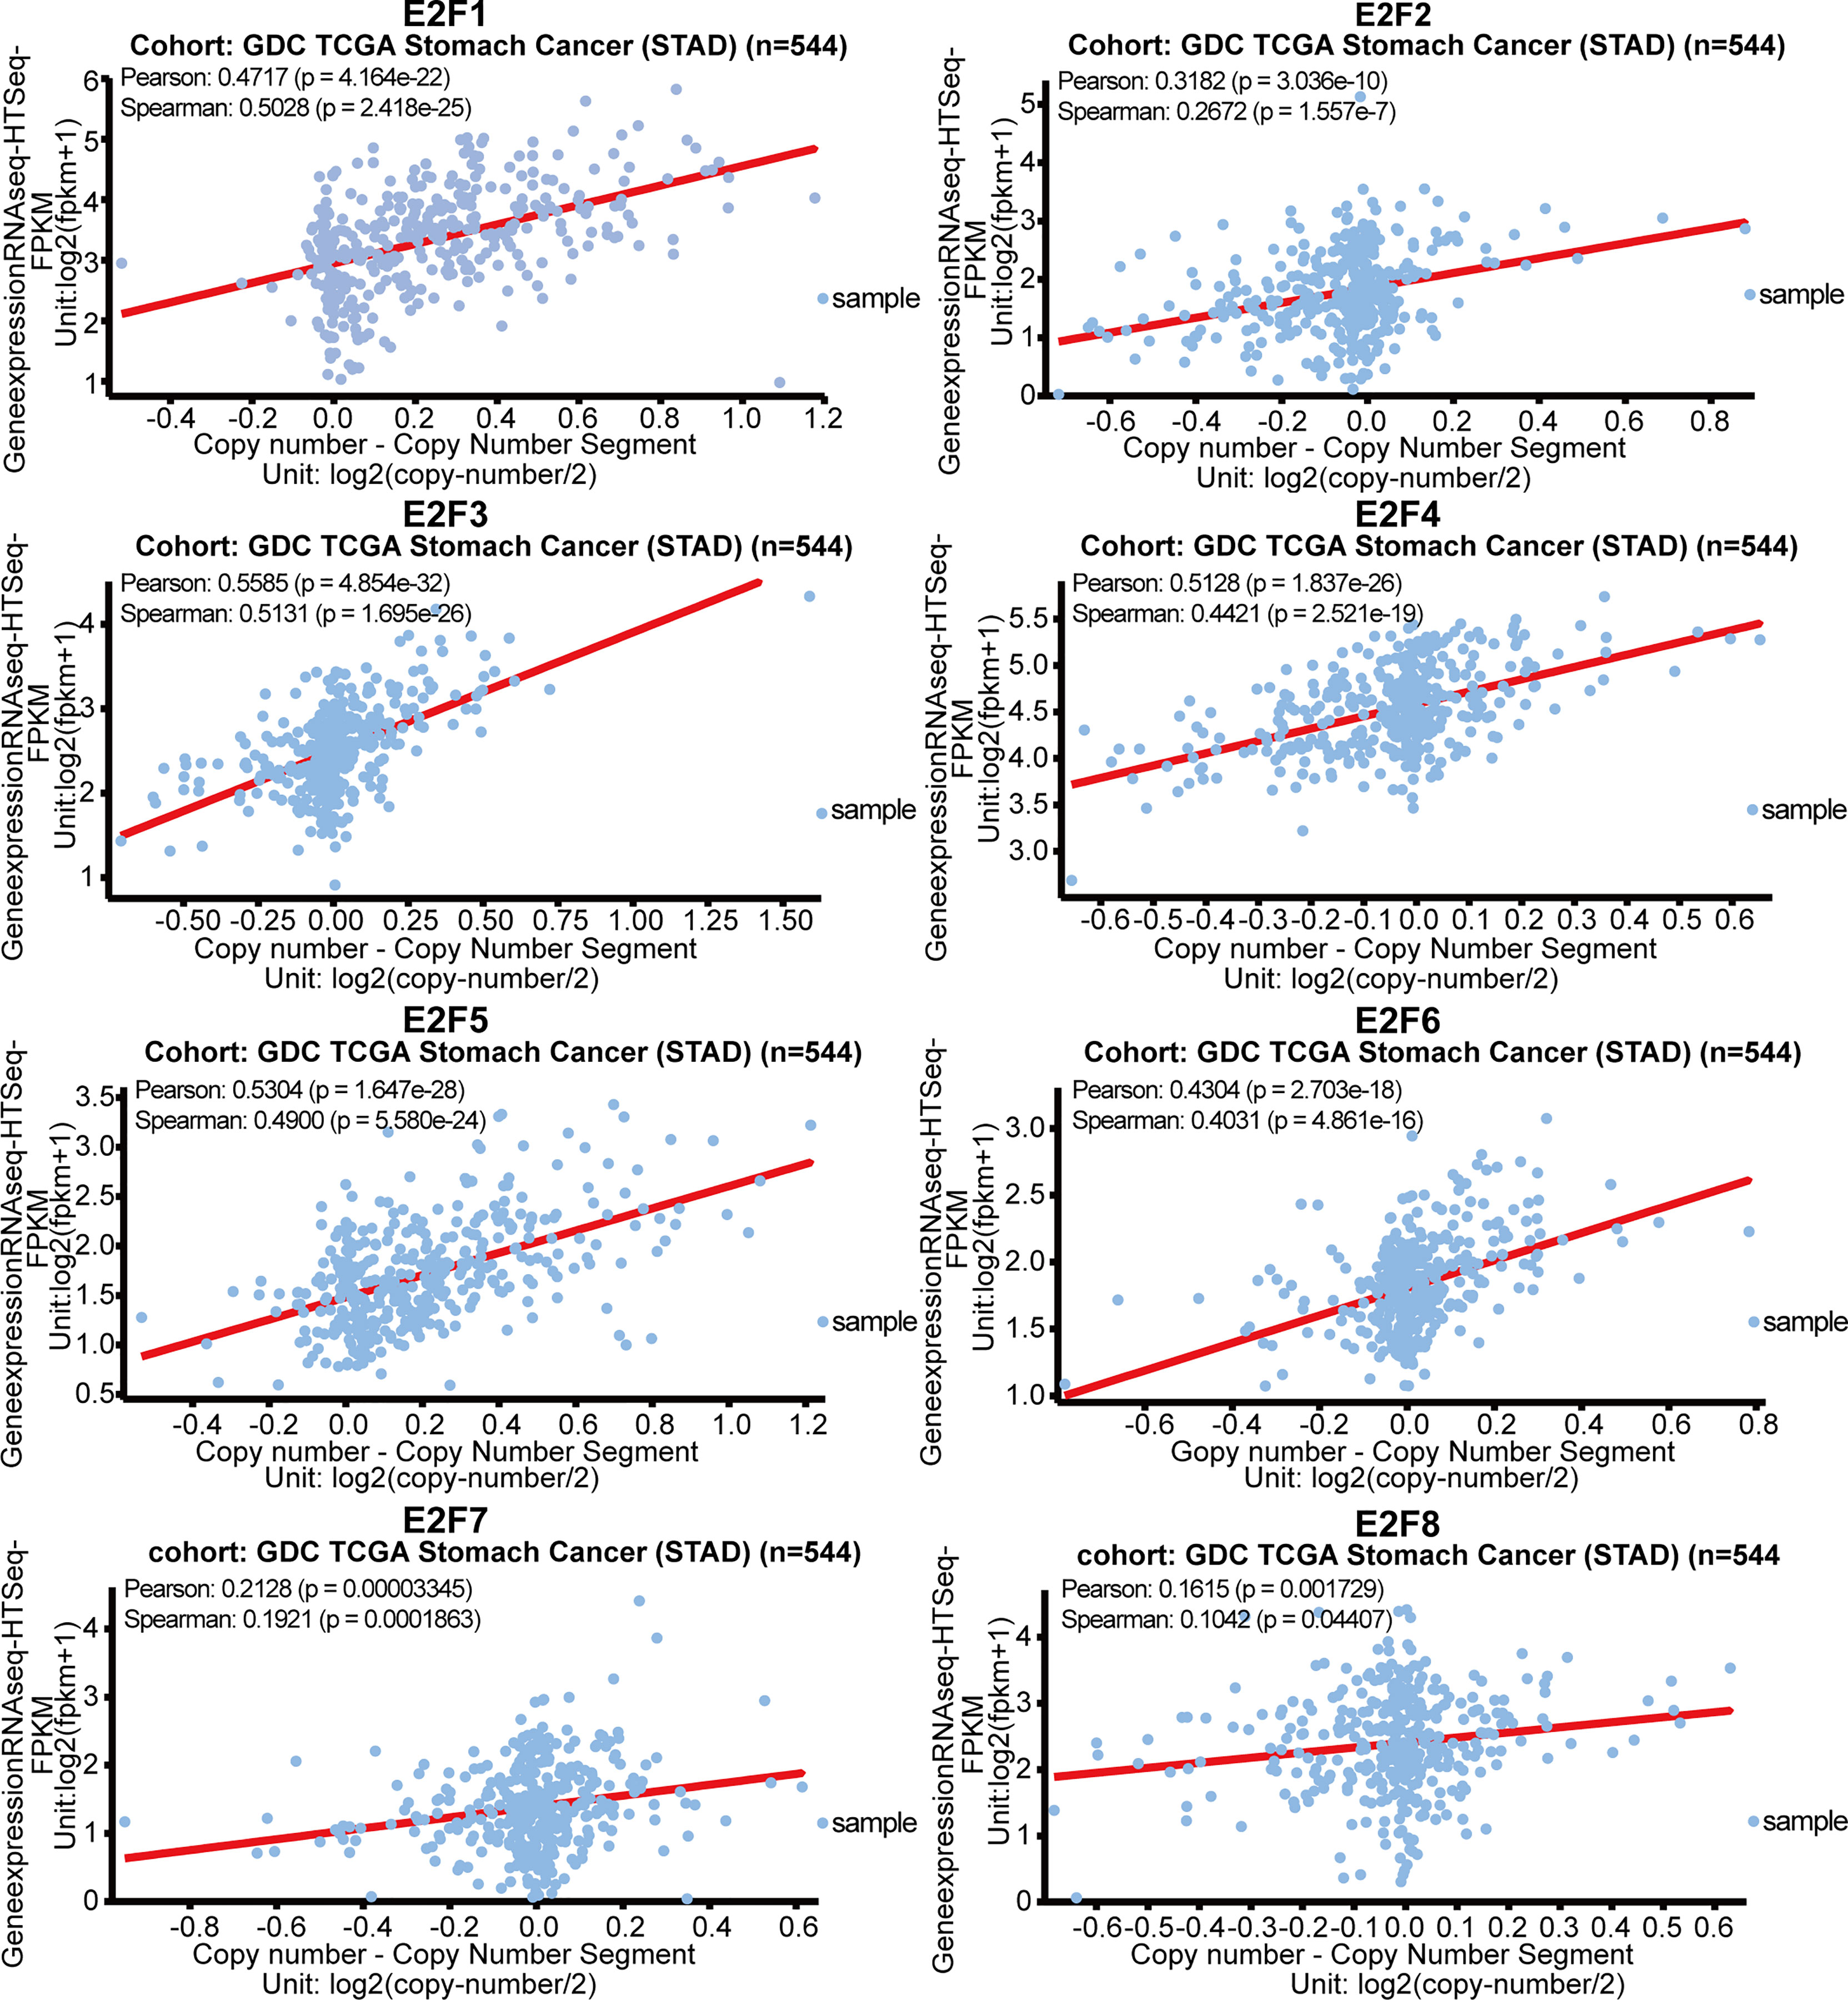
Figure 10 Correlations of gene copy numbers with mRNA levels of E2Fs in STAD (UCSC Xena).
E2Fs have been shown to be associated with many tumors (23–26). As for GC, the vast majority of studies have focused on the roles of one particular member or some members from among the E2Fs, and there have been few comprehensive analyses of the expression of all E2Fs and their associations with clinical parameters in GC patients. Manicum et al. (27) reported associations between E2F1/2/3/4/5/6/7 mRNA levels and OS in GC patients. Liu et al. (28) reported the prognostic value of the expression of E2Fs and its association with clinical parameters in GC patients using publicly available databases. In the present study, we confirmed the abnormal expression of E2Fs in GC using several large public databases. We also confirmed the differential expression levels of E2Fs in two GC cell lines and a normal gastric epithelial cell line by RT-PCR. Our results demonstrated that the mRNA levels of E2F1/2/3/5/8 were significantly overexpressed in both GC tissues and two GC cell lines. In addition, we investigated the genetic alterations and their prognostic value in GC patients in detail and found genetic alterations in E2Fs was relevant to longer DFS but not OS. Furthermore, the functional enrichment analyses and interaction analyses were conducted, and the results of GSEA analyses revealed that cell cycle pathway was closely associated with mRNA level of more than half of E2Fs. Finally, we investigated the potential drivers of the abnormal E2FS mRNA levels in GC and found that the expressions of all E2Fs had a positive and significant relationship with the DNA copy numbers. So, we demonstrated the significance of E2Fs in GC from different perspectives and suggested that E2F1/2/3/5/8 could serve as potential biomarkers for GC patients with high prognostic value for OS of GC patients or therapeutic targets for GC.
Biomarkers have been reported to exhibit tissue-specific expression (29). Our results from the ONCOMINE database indicated that E2F mRNA levels are elevated to various degrees in most cancers compared with their levels in normal tissues. To the best of our knowledge, pan-cancer analysis of E2Fs has not been previously reported. A comprehensive pan-cancer analysis of E2Fs would provide a deeper understanding of the nature of E2Fs dysregulation in cancer.
The mRNA levels of E2F2/3/7 were increased in GC tissues in both the ONCOMINE and GEPIA2 datasets. The results from RT-PCR indicated that all E2Fs, except E2F7, were overexpressed at different levels in the GC cell lines, which might be due to cell line heterogeneity. Given that E2F1 is a transcriptional activator and E2F4 is a repressor, typically representing opposing activities, it was interesting to find that increased expression of both E2F1 and E2F4 was correlated with poor survival in GC patients. As a family of transcription factors, E2Fs play important roles in GC by modulating the transcription of specific target genes, and their regulatory activity and biological effects can be reflected by their target gene expression. It has been reported that high E2F1 or E2F4 activity in liposarcoma patients is associated with unfavorable prognosis, with the core target gene sets of E2F1 containing 116 genes and the core target gene sets of E2F4 containing 199 genes, among which only 21 are shared (30). As we have shown, GSEA indicated that E2F1 was mainly involved in the cell cycle pathway; E2F4, however, was mainly involved in ribosome pathway. Thus, we reasoned that a similar situation might occur in GC, where E2F1 and E2F4 mainly exert effects on different target gene sets and only share a small fraction of common target genes. The systematic identification of E2F target gene sets in GC will further improve our understanding of the mechanisms behind the prognostic value of E2Fs in GC.
Genetic mutations have been reported to correlate with the pathogenesis and prognosis of various types of tumors (31–33); therefore, we further explored genetic mutations in E2Fs for GC, based on cBioPortal. We found that E2Fs had a relatively high mutation rate (54%) in GC patients, and the genetic mutations in E2Fs were associated with longer DFS but not OS. Genetic mutations in E2Fs appeared to have a protective role against the progression of GC. The clinical implications of this finding deserve further studies. We also performed enrichment analysis for E2Fs and 30 neighboring genes. GSEA analysis revealed that the cell cycle pathway was closely associated with the mRNA level of more than half of the E2Fs (E2F1/2/3/7/8). These results also emphasized the conserved functions of the E2Fs. The results of co-expression and interaction analyses revealed close and complicated associations among the E2Fs. It has been reported that DNA copy number is positively associated with the expression levels for 98.9% of all the abundantly expressed human genes, indicating global gene dosage sensitivity (34). Therefore, we investigated the potential drivers of expression dysregulation of E2Fs in GC and found that the gene expression of all E2Fs had a positive and significant relationship with their DNA copy numbers, and this extends the results of the E2F gene expression studies and can guide further efforts in identifying the potential mechanisms of pathogenesis and treatments for GC.
E2F1, the most investigated member of E2Fs, has been confirmed to have prognostic value in many tumors, such as hepatocellular carcinoma (35), breast cancer (36), and pancreatic ductal adenocarcinoma (37), and spinal osteosarcoma (38). In GC, upregulated E2F1 expression, targeting the TINCR/STAU1/CDKN2B signaling axis, was positively associated with poor prognosis due to its association with advanced stage and larger tumor size (39). E2F1 increased the expression of the miR-106b-25 cluster, leading to the impairment of TGFβ-dependent cell-cycle arrest and resistance to TGFβ-dependent apoptosis (40). Lin et al. (41) reported that circCYFIP2, serving as an oncogenic circRNA, promoted GC progression by regulating the miR-1205/E2F1 axis. Simultaneous silencing of E2F1 inhibits GC progression (42). However, another study reported that E2F1 overexpression inhibited GC progression in vitro (43). In the present study, E2F1 was significantly overexpressed in GC tissues and in MGC-803 cells. Overexpression of E2F1, mainly related to the cell cycle pathway, was associated with poor OS, FP, and PPS in GC patients.
The role of E2F2 in GC has been less frequently studied. Recently, it has been reported that downregulation of miR-31, one of the direct target genes of E2F2, is related to poor prognosis in GC patients (44). Furthermore, another study found that miR-26a showed low expression in cisplatin-resistant GC cells; and the knockdown of E2F2, a direct target gene of miR-26a, sensitized GC cells to cisplatin-based chemotherapies. The results from our study indicated that E2F2 overexpression was observed in GC tissues and GC cell lines. The increased E2F2 mRNA level favored OS, FP, and PPS in GC patients.
A previous study has shown that upregulated E2F3 expression in GC might imply poor prognosis. MiR-152, which targets the 3′-UTR of E2F3 and reduces its expression, regulates polo-like kinase 1 (PLK1) mediated protein kinase B and extracellular signal-regulated kinase signals, and modulates GC metastasis (45). E2F3 might have a pro-oncogenic effect on GC metastasis and progression by regulating the miR-125a/DKK3 axis (46). In addition, by targeting E2F3, miR-564 acts a tumor suppressor in GC (47). The colorectal neoplasia differentially expressed (CRNDE) gene was a cancer-promoting lncRNA in GC; by competitive molecular sponging of miR145, CRNDE strongly stimulated the expression of E2F3 (48). By interacting with lncRNA MEG3 and decreasing E2F3 expression, miR-141 inhibits GC proliferation (49). The miR-449a/E2F3 axis is involved in the biological processes of proliferation and apoptosis in GC (50). In our current analysis, E2F3 was upregulated in GC patients and GC cell lines and had a favorable effect on OS and PPS.
In earlier investigations, pRb2/p130 negatively regulated the cell cycle by interacting with the E2F4 and E2F5, thus playing oncosuppressive roles (51). Cyclins interact with some transcription factors, such as E2F4, SIN3A, NFYA, and FOXM1, while overexpression of cyclins is correlated with unfavorable prognosis in GC patients (52). In the progression of multiple GCs, mutations of E2F4 are early events that occur even in the intestinal metaplastic mucosa (53). Knockdown of RAD51 improved the effects of chemotherapy combined with PCI-24781 and cis-diamminedichloroplatinum, and during this process, the interaction of E2F4 with the RAD51 promoter had a major effect (54). In gastric adenocarcinoma which has frequent microsatellite instability, mutations of E2F4 are integral multiples of three nucleotides lost or gained (55). In the current study, there was no significant difference in E2F4 mRNA levels between GC tissues and normal control in the GEPIA2 database. However, E2F4 was upregulated in the GC cell lines. GC patients with increased E2F4 mRNA levels had poor OS, FP and PPS.
Similar to E2F2, there have been relatively few reports on E2F5 in GC. It has been reported that miRNA-34a, by targeting E2F5, increases the sensitivity of GC cells to paclitaxel (56). Another study indicated that miR-106b promotes the cell cycling of GC cells by regulating p21 and E2F5 (57). In the current study, E2F5 mRNA levels were significantly higher in GC tissues and GC cell lines, which markedly favored OS, FP, and PPS in GC patients.
A relatively high E2F6 mRNA level has been found in gastric adenocarcinoma with no lymph node metastasis, and low expression of E2F6 in gastric adenocarcinoma could be considered an aggressive phenotype (58). It has also been reported that downregulation of lncRNA CASC2 mediated by E2F6 predicts worse outcomes and facilitates cancer progression in GC patients (59). Induction of miR-31 decreases the expression of E2F6 and SMUG1, improving GC cell sensitivity to 5-fluorouracil and inhibiting GC cell migration and invasion (60). We found that E2F6 was overexpressed in GC patients according to the GEPIA2 datasets and GC cell lines and that high E2F6 mRNA levels favored OS and PPS in GC patients.
E2F7 and E2F8 have been reported to be involved in several malignancies such as pancreatic cancer (61), gallbladder cancer (62), colorectal cancer (63, 64), cervical cancer (65), breast cancer (66) and lung cancer (67, 68). However, the involvement of E2F7 and E2F8 in GC has yet not been investigated. Our results indicated that E2F7 mRNA levels were high in GC tissues. However, E2F7 was downregulated in MGC-803 and SGC-7901 cells compared with its expression in GES-1 cells, and this might be due to cell line heterogeneity. E2F7 and E2F8 expression was not associated with tumor stage in patients with GC. The increased mRNA levels of E2F7 and E2F8, mainly related to the cell cycle pathway, were correlated with favorable OS, FP and PPS in GC patients.
Our results indicated that there were no significant associations between the mRNA levels of E2Fs and GC stages, indicating that mRNA levels of E2Fs might reflect tumor burden and that E2Fs might participate in all stages of GC. Also, it is well-known that GC is of heterogeneity (69). Different GC subtypes have various biologic characteristics. It would be beneficial to evaluate the particular express pattern of E2Fs of different subtypes of GC. A randomized controlled trial with large sample size would be helpful to further validate our results and to further our investigation.
Validating with three cell lines instead of GC patient samples is one of the limitations. It remains uncertain how well cell lines reflect the biological characteristics of tumors. Systematic differences between cell lines and human cancers may be due to many factors such as culture conditions, clonal selection, and genomic instability (70). So, despite these promising results and their clinical implications, we should acknowledge the limitations, as well as directions for future research.
In summary, our results indicated that the mRNA levels of E2F1/2/3/5/8 were significantly increased in both GC tissues and cell lines compared with those in the control samples, which mainly resulted from gene amplification and were associated with the clinical outcomes of GC patients. Genetic alterations in E2Fs were associated with longer DFS but not OS in STAD patients. These results suggest that E2F1/2/3/5/8 could serve as potential biomarkers of prognostic significance in GC. These results may help to better understand the mechanisms of GC and the development of E2Fs-mediated drugs for GC treatment. However, further investigations are warranted to examine our results and the clinical implications of E2Fs in cancer.
The datasets presented in this study can be found in online repositories. The names of the repository/repositories and accession number(s) can be found in the article/supplementary material.
SL designed the research, conducted the experiments, performed statistical analyses and drafted the manuscript. XY and WL revised the draft. ZC provided administrative/technical/material assistances and supervised the study. All authors contributed to the article and approved the submitted version.
This work was supported by the National Natural Science Foundation of China (Grant No. 81772094, 81974289).
The authors declare that the research was conducted in the absence of any commercial or financial relationships that could be construed as a potential conflict of interest.
All claims expressed in this article are solely those of the authors and do not necessarily represent those of their affiliated organizations, or those of the publisher, the editors and the reviewers. Any product that may be evaluated in this article, or claim that may be made by its manufacturer, is not guaranteed or endorsed by the publisher.
1. Xing R, Zhou Y, Yu J, Yu Y, Nie Y, Luo W, et al. Whole-Genome Sequencing Reveals Novel Tandem-Duplication Hotspots and a Prognostic Mutational Signature in Gastric Cancer. Nat Commun (2019) 10:2037. doi: 10.1038/s41467-019-09644-6
2. Choi KW, Joo M, Kim HS, Lee WY. Synchronous Triple Occurrence of MALT Lymphoma, Schwannoma, and Adenocarcinoma of the Stomach. World J Gastroenterol (2017) 23:4127–31. doi: 10.3748/wjg.v23.i22.4127
3. Zhang P, Zheng Z, Ling L, Yang X, Zhang N, Wang X, et al. W09, a Novel Autophagy Enhancer, Induces Autophagy-Dependent Cell Apoptosis via Activation of the EGFR-Mediated RAS-RAF1-MAP2K-MAPK1/3 Pathway. Autophagy (2017) 13:1093–112. doi: 10.1080/15548627.2017.1319039
4. Van CE, Sagaert X, Topal B, Haustermans K, Prenen H. Gastric Cancer. Lancet (2016) 388:2654–64. doi: 10.1016/S0140-6736(16)30354-3
5. Ding N, Zou Z, Sha H, Su S, Qian H, Meng F, et al. iRGD Synergizes With PD-1 Knockout Immunotherapy by Enhancing Lymphocyte Infiltration in Gastric Cancer. Nat Commun (2019) 10:1336. doi: 10.1038/s41467-019-09296-6
6. Min J, Vega PN, Engevik AC, Williams JA, Yang Q, Patterson LM, et al. Heterogeneity and Dynamics of Active Kras-Induced Dysplastic Lineages From Mouse Corpus Stomach. Nat Commun (2019) 10:5549. doi: 10.1038/s41467-019-13479-6
7. Türeci O, Sahin U, Schulze-Bergkamen H, Zvirbule Z, Lordick F, Koeberle D, et al. A Multicentre, Phase IIa Study of Zolbetuximab as a Single Agent in Patients With Recurrent or Refractory Advanced Adenocarcinoma of the Stomach or Lower Oesophagus: The MONO Study. Ann Oncol (2019) 30:1487–95. doi: 10.1093/annonc/mdz199
8. Lee J, Park CK, Park JO, Lim T, Park YS, Lim HY, et al. Impact of E2F-1 Expression on Clinical Outcome of Gastric Adenocarcinoma Patients With Adjuvant Chemoradiation Therapy. Clin Cancer Res (2008) 14:82–8. doi: 10.1158/1078-0432.Ccr-07-0612
9. Zhang X, Ni Z, Duan Z, Xin Z, Wang H, Tan J, et al. Overexpression of E2F mRNAs Associated With Gastric Cancer Progression Identified by the Transcription Factor and miRNA Co-Regulatory Network Analysis. PLoS One (2015) 10:e0116979. doi: 10.1371/journal.pone.0116979
10. Cho JY, Lim JY, Cheong JH, Park YY, Yoon SL, Kim SM, et al. Gene Expression Signature-Based Prognostic Risk Score in Gastric Cancer. Clin Cancer Res (2011) 17:1850–7. doi: 10.1158/1078-0432.Ccr-10-2180
11. Zhang E, Yin D, Han L, He X, Si X, Chen W, et al. E2F1-Induced Upregulation of Long Noncoding RNA LINC00668 Predicts a Poor Prognosis of Gastric Cancer and Promotes Cell Proliferation Through Epigenetically Silencing of CKIs. Oncotarget (2016) 7:23212–26. doi: 10.18632/oncotarget.6745
12. Cui J, Chen Y, Chou WC, Sun L, Chen L, Suo J, et al. An Integrated Transcriptomic and Computational Analysis for Biomarker Identification in Gastric Cancer. Nucleic Acids Res (2011) 39:1197–207. doi: 10.1093/nar/gkq960
13. Wang Q, Wen YG, Li DP, Xia J, Zhou CZ, Yan DW, et al. Upregulated INHBA Expression Is Associated With Poor Survival in Gastric Cancer. Med Oncol (2012) 29:77–83. doi: 10.1007/s12032-010-9766-y
14. Tang Z, Kang B, Li C, Chen T, Zhang Z. GEPIA2: An Enhanced Web Server for Large-Scale Expression Profiling and Interactive Analysis. Nucleic Acids Res (2019) 47:W556–60. doi: 10.1093/nar/gkz430
15. Nagy Á, Lánczky A, Menyhárt O, Győrffy B. Validation of miRNA Prognostic Power in Hepatocellular Carcinoma Using Expression Data of Independent Datasets. Sci Rep (2018) 8:9227. doi: 10.1038/s41598-018-27521-y
16. Gao J, Aksoy BA, Dogrusoz U, Dresdner G, Gross B, Sumer SO, et al. Integrative Analysis of Complex Cancer Genomics and Clinical Profiles Using the Cbioportal. Sci Signal (2013) 6:pl1. doi: 10.1126/scisignal.2004088
17. Zhou Y, Zhou B, Pache L, Chang M, Khodabakhshi AH, Tanaseichuk O, et al. Metascape Provides a Biologist-Oriented Resource for the Analysis of Systems-Level Datasets. Nat Commun (2019) 10:1523. doi: 10.1038/s41467-019-09234-6
18. Vasaikar SV, Straub P, Wang J, Zhang B. LinkedOmics: Analyzing Multi-Omics Data Within and Across 32 Cancer Types. Nucleic Acids Res (2018) 46:D956–d63. doi: 10.1093/nar/gkx1090
19. Franz M, Rodriguez H, Lopes C, Zuberi K, Montojo J, Bader GD, et al. GeneMANIA Update 2018. Nucleic Acids Res (2018) 46:W60–4. doi: 10.1093/nar/gky311
20. Szklarczyk D, Gable AL, Lyon D, Junge A, Wyder S, Huerta-Cepas J, et al. STRING V11: Protein-Protein Association Networks With Increased Coverage, Supporting Functional Discovery in Genome-Wide Experimental Datasets. Nucleic Acids Res (2019) 47:D607–13. doi: 10.1093/nar/gky1131
21. Goldman MJ, Craft B, Hastie M, Repečka K, McDade F, Kamath A, et al. Visualizing and Interpreting Cancer Genomics Data via the Xena Platform. Nat Biotechnol (2020) 38:675–8. doi: 10.1038/s41587-020-0546-8
22. D’Errico M, de Rinaldis E, Blasi MF, Viti V, Falchetti M, Calcagnile A, et al. Genome-Wide Expression Profile of Sporadic Gastric Cancers With Microsatellite Instability. Eur J Cancer (2009) 45:461–9. doi: 10.1016/j.ejca.2008.10.032
23. Sun CC, Li SJ, Hu W, Zhang J, Zhou Q, Liu C, et al. Comprehensive Analysis of the Expression and Prognosis for E2Fs in Human Breast Cancer. Mol Ther (2019) 27:1153–65. doi: 10.1016/j.ymthe.2019.03.019
24. Zhou Q, Zhang F, He Z, Zuo MZ. E2F2/5/8 Serve as Potential Prognostic Biomarkers and Targets for Human Ovarian Cancer. Front Oncol (2019) 9:161. doi: 10.3389/fonc.2019.00161
25. Zheng H, Wang JJ, Yang XR, Yu YL. Upregulation of miR-34c After Silencing E2F Transcription Factor 1 Inhibits Paclitaxel Combined With Cisplatin Resistance in Gastric Cancer Cells. World J Gastroenterol (2020) 26:499–513. doi: 10.3748/wjg.v26.i5.499
26. Ohtsuka M, Ling H, Ivan C, Pichler M, Matsushita D, Goblirsch M, et al. H19 Noncoding RNA, an Independent Prognostic Factor, Regulates Essential Rb-E2F and CDK8-β-Catenin Signaling in Colorectal Cancer. EBioMedicine (2016) 13:113–24. doi: 10.1016/j.ebiom.2016.10.026
27. Manicum T, Ni F, Ye Y, Fan X, Chen BC. Prognostic Values of E2F mRNA Expression in Human Gastric Cancer. Biosci Rep (2018) 38:BSR20181264. doi: 10.1042/bsr20181264
28. Liu X, Hu C. Novel Potential Therapeutic Target for E2F1 and Prognostic Factors of E2F1/2/3/5/7/8 in Human Gastric Cancer. Mol Ther Methods Clin Dev (2020) 18:824–38. doi: 10.1016/j.omtm.2020.07.017
29. Li YS, Jiang TF, Zhou WF, Li JY, Li XH, Wang Q, et al. Pan-Cancer Characterization of Immune-Related lncRNAs Identifies Potential Oncogenic Biomarkers. Nat Commun (2020) 11:1000. doi: 10.1038/s41467-020-14802-2
30. Cheng C, Lou SK, Andrews EH, Ung MH, Varn FS. Integrative Genomic Analyses Yield Cell-Cycle Regulatory Programs With Prognostic Value. Mol Cancer Res (2016) 14:332–43. doi: 10.1158/1541-7786.MCR-15-0368
31. Gotoh O, Sugiyama Y, Takazawa Y, Kato K, Tanaka N, Omatsu K, et al. Clinically Relevant Molecular Subtypes and Genomic Alteration-Independent Differentiation in Gynecologic Carcinosarcoma. Nat Commun (2019) 10:4965. doi: 10.1038/s41467-019-12985-x
32. Kridel R, Chan FC, Mottok A, Boyle M, Farinha P, Tan K, et al. Histological Transformation and Progression in Follicular Lymphoma: A Clonal Evolution Study. PLoS Med (2016) 13:e1002197. doi: 10.1371/journal.pmed.1002197
33. Oh SC, Sohn BH, Cheong JH, Kim SB, Lee JE, Park KC, et al. Clinical and Genomic Landscape of Gastric Cancer With a Mesenchymal Phenotype. Nat Commun (2018) 9:1777. doi: 10.1038/s41467-018-04179-8
34. Fehrmann RS, Karjalainen JM, Krajewska M, Westra HJ, Maloney D, Simeonov A, et al. Gene Expression Analysis Identifies Global Gene Dosage Sensitivity in Cancer. Nat Genet (2015) 47:115–25. doi: 10.1038/ng.3173
35. Yu Y, Zhao D, Li K, Cai Y, Xu P, Li R, et al. E2F1 Mediated DDX11 Transcriptional Activation Promotes Hepatocellular Carcinoma Progression Through PI3K/AKT/mTOR Pathway. Cell Death Dis (2020) 11:273. doi: 10.1038/s41419-020-2478-0
36. Berteaux N, Lottin S, Monté D, Pinte S, Quatannens B, Coll J, et al. H19 mRNA-Like Noncoding RNA Promotes Breast Cancer Cell Proliferation Through Positive Control by E2F1. J Biol Chem (2005) 280:29625–36. doi: 10.1074/jbc.M504033200
37. Wang H, Yu S, Peng H, Shu Y, Zhang W, Zhu Q, et al. Long Noncoding RNA Linc00337 Functions as an E2F1 Co-Activator and Promotes Cell Proliferation in Pancreatic Ductal Adenocarcinoma. J Exp Clin Cancer Res (2020) 39:216. doi: 10.1186/s13046-020-01725-5
38. Zhou X, Li J, Teng J, Liu Y, Zhang D, Liu L, et al. Long Noncoding RNA BSN-AS2 Induced by E2F1 Promotes Spinal Osteosarcoma Progression by Targeting miR-654-3p/SYTL2 Axis. Cancer Cell Int (2020) 20:133. doi: 10.1186/s12935-020-01205-y
39. Xu TP, Wang YF, Xiong WL, Ma P, Wang WY, Chen WM, et al. E2F1 Induces TINCR Transcriptional Activity and Accelerates Gastric Cancer Progression via Activation of TINCR/STAU1/CDKN2B Signaling Axis. Cell Death Dis (2017) 8:e2837. doi: 10.1038/cddis.2017.205
40. Petrocca F, Visone R, Onelli MR, Shah MH, Nicoloso MS, de Martino I, et al. E2F1-Regulated microRNAs Impair TGFbeta-Dependent Cell-Cycle Arrest and Apoptosis in Gastric Cancer. Cancer Cell (2008) 13:272–86. doi: 10.1016/j.ccr.2008.02.013
41. Lin J, Liao S, Li E, Liu Z, Zheng R, Wu X, et al. Circcyfip2 Acts as a Sponge of miR-1205 and Affects the Expression of Its Target Gene E2F1 to Regulate Gastric Cancer Metastasis. Mol Ther Nucleic Acids (2020) 21:121–32. doi: 10.1016/j.omtn.2020.05.007
42. Xie Y, Yin Y, Li L, Ma Y, Xiao Q. Short Interfering RNA Directed Against the E2F-1 Gene Suppressing Gastric Cancer Progression In Vitro. Oncol Rep (2009) 21:1345–53. doi: 10.3892/or_00000360
43. Xie Y, Wang C, Li L, Ma Y, Yin Y, Xiao Q. Overexpression of E2F-1 Inhibits Progression of Gastric Cancer In Vitro. Cell Biol Int (2009) 33:640–9. doi: 10.1016/j.cellbi.2009.02.015
44. Wang H, Zhang X, Liu Y, Ni Z, Lin Y, Duan Z, et al. Downregulated miR-31 Level Associates With Poor Prognosis of Gastric Cancer and Its Restoration Suppresses Tumor Cell Malignant Phenotypes by Inhibiting E2F2. Oncotarget (2016) 7:36577–89. doi: 10.18632/oncotarget.9288
45. Shi L, Zhu H, Shen Y, Dou X, Guo H, Wang P, et al. Regulation of E2F Transcription Factor 3 by microRNA-152 Modulates Gastric Cancer Invasion and Metastasis. Cancer Manag Res (2020) 12:1187–97. doi: 10.2147/cmar.S239752
46. Pei Y, Tang Z, Cai M, Yao Q, Xie B, Zhang X. The E2F3/miR-125a/DKK3 Regulatory Axis Promotes the Development and Progression of Gastric Cancer. Cancer Cell Int (2019) 19:212. doi: 10.1186/s12935-019-0930-y
47. Guo Y, Qi Y, Guo A, Du C, Zhang R, Chu X. miR-564 Is Downregulated in Gastric Carcinoma and Targets E2F3. Oncol Lett (2017) 13:4155–60. doi: 10.3892/ol.2017.5964
48. Hu CE, Du PZ, Zhang HD, Huang GJ. Long Noncoding RNA CRNDE Promotes Proliferation of Gastric Cancer Cells by Targeting miR-145. Cell Physiol Biochem (2017) 42:13–21. doi: 10.1159/000477107
49. Zhou X, Ji G, Ke X, Gu H, Jin W, Zhang G. MiR-141 Inhibits Gastric Cancer Proliferation by Interacting With Long Noncoding RNA MEG3 and Down-Regulating E2F3 Expression. Dig Dis Sci (2015) 60:3271–82. doi: 10.1007/s10620-015-3782-x
50. Li X, Li H, Zhang R, Liu J, Liu J. MicroRNA-449a Inhibits Proliferation and Induces Apoptosis by Directly Repressing E2F3 in Gastric Cancer. Cell Physiol Biochem (2015) 35:2033–42. doi: 10.1159/000374010
51. Cito L, Indovina P, Forte IM, Pentimalli F, Di Marzo D, Somma P, et al. Prb2/P130 Localizes to the Cytoplasm in Diffuse Gastric Cancer. J Cell Physiol (2015) 230:802–5. doi: 10.1002/jcp.24805
52. Zhang HP, Li SY, Wang JP, Lin J. Clinical Significance and Biological Roles of Cyclins in Gastric Cancer. Onco Targets Ther (2018) 11:6673–85. doi: 10.2147/ott.S171716
53. Ogata S, Tamura G, Endoh Y, Sakata K, Ohmura K, Motoyama T. Microsatellite Alterations and Target Gene Mutations in the Early Stages of Multiple Gastric Cancer. J Pathol (2001) 194:334–40. doi: 10.1002/path.895
54. He WL, Li YH, Hou WJ, Ke ZF, Chen XL, Lu LY, et al. RAD51 Potentiates Synergistic Effects of Chemotherapy With PCI-24781 and Cis-Diamminedichloroplatinum on Gastric Cancer. World J Gastroenterol (2014) 20:10094–107. doi: 10.3748/wjg.v20.i29.10094
55. Schneider BG, Bravo JC, Roa JC, Roa I, Kim MC, Lee KM, et al. Microsatellite Instability, Prognosis and Metastasis in Gastric Cancers From a Low-Risk Population. Int J Cancer (2000) 89:444–52. doi: 10.1002/1097-0215(20000920)89:5<444::aid-ijc8>3.0.co;2-f
56. Li L, Wu C, Zhao Y. miRNA-34a Enhances the Sensitivity of Gastric Cancer Cells to Treatment With Paclitaxel by Targeting E2F5. Oncol Lett (2017) 13:4837–42. doi: 10.3892/ol.2017.6041
57. Yao YL, Wu XY, Wu JH, Gu T, Chen L, Gu JH, et al. Effects of microRNA-106 on Proliferation of Gastric Cancer Cell Through Regulating P21 and E2F5. Asian Pac J Cancer Prev (2013) 14:2839–43. doi: 10.7314/apjcp.2013.14.5.2839
58. Korourian A, Roudi R, Shariftabrizi A, Kalantari E, Sotoodeh K, Madjd Z. Differential Role of Wnt Signaling and Base Excision Repair Pathways in Gastric Adenocarcinoma Aggressiveness. Clin Exp Med (2017) 17:505–17. doi: 10.1007/s10238-016-0443-0
59. Li Y, Jiang L, Lv S, Xu H, Fan Z, He Y, et al. E2F6-Mediated lncRNA CASC2 Down-Regulation Predicts Poor Prognosis and Promotes Progression in Gastric Carcinoma. Life Sci (2019) 232:116649. doi: 10.1016/j.lfs.2019.116649
60. Korourian A, Madjd Z, Roudi R, Shariftabrizi A, Soleimani M. Induction of miR-31 Causes Increased Sensitivity to 5-FU and Decreased Migration and Cell Invasion in Gastric Adenocarcinoma. Bratisl Lek Listy (2019) 120:35–9. doi: 10.4149/bll_2019_005
61. Raman P, Maddipati R, Lim KH, Tozeren A. Pancreatic Cancer Survival Analysis Defines a Signature That Predicts Outcome. PLoS One (2018) 13:e0201751. doi: 10.1371/journal.pone.0201751
62. Ye YY, Mei JW, Xiang SS, Li HF, Ma Q, Song XL, et al. MicroRNA-30a-5p Inhibits Gallbladder Cancer Cell Proliferation, Migration and Metastasis by Targeting E2F7. Cell Death Dis (2018) 9:410. doi: 10.1038/s41419-018-0444-x
63. Liu W, Song Y, Zhang C, Gao P, Huang B, Yang J. The Protective Role of All-Transretinoic Acid (ATRA) Against Colorectal Cancer Development Is Achieved via Increasing miR-3666 Expression and Decreasing E2F7 Expression. BioMed Pharmacother (2018) 104:94–101. doi: 10.1016/j.biopha.2018.05.015
64. Zhang Z, Li J, Huang Y, Peng W, Qian W, Gu J, et al. Upregulated miR-1258 Regulates Cell Cycle and Inhibits Cell Proliferation by Directly Targeting E2F8 in CRC. Cell Prolif (2018) 51:e12505. doi: 10.1111/cpr.12505
65. Zong S, Liu X, Zhou N, Yue Y. E2F7, EREG, miR-451a and miR-106b-5p Are Associated With the Cervical Cancer Development. Arch Gynecol Obstet (2019) 299:1089–98. doi: 10.1007/s00404-018-5007-y
66. Iino K, Mitobe Y, Ikeda K, Takayama KI, Suzuki T, Kawabata H, et al. RNA-Binding Protein NONO Promotes Breast Cancer Proliferation by Post-Transcriptional Regulation of SKP2 and E2F8. Cancer Sci (2020) 111:148–59. doi: 10.1111/cas.14240
67. Wang C, Li S, Xu J, Niu W, Li S. microRNA-935 Is Reduced in Non-Small Cell Lung Cancer Tissue, Is Linked to Poor Outcome, and Acts on Signal Transduction Mediator E2F7 and the AKT Pathway. Br J BioMed Sci (2019) 76:17–23. doi: 10.1080/09674845.2018.1520066
68. Park SA, Platt J, Lee JW, López-Giráldez F, Herbst RS, Koo JS. E2F8 as a Novel Therapeutic Target for Lung Cancer. J Natl Cancer Inst (2015) 107:djv151. doi: 10.1093/jnci/djv151
69. Zhang M, Hu S, Min M, Ni Y, Lu Z, Sun X, et al. Dissecting Transcriptional Heterogeneity in Primary Gastric Adenocarcinoma by Single Cell RNA Sequencing. Gut (2021) 70:464–75. doi: 10.1136/gutjnl-2019-320368
Keywords: E2F, gastric cancer, comprehensive bioinformatics analysis, biomarkers, prognosis
Citation: Li S, Yang X, Li W and Chen Z (2021) Comprehensive Analysis of E2F Family Members in Human Gastric Cancer. Front. Oncol. 11:625257. doi: 10.3389/fonc.2021.625257
Received: 02 November 2020; Accepted: 16 August 2021;
Published: 31 August 2021.
Edited by:
Manish A. Shah, Cornell University, United StatesReviewed by:
Lisa Marie Julian, Simon Fraser University, CanadaCopyright © 2021 Li, Yang, Li and Chen. This is an open-access article distributed under the terms of the Creative Commons Attribution License (CC BY). The use, distribution or reproduction in other forums is permitted, provided the original author(s) and the copyright owner(s) are credited and that the original publication in this journal is cited, in accordance with accepted academic practice. No use, distribution or reproduction is permitted which does not comply with these terms.
*Correspondence: Zhenbing Chen, emJjaGVuQGh1c3QuZWR1LmNu
Disclaimer: All claims expressed in this article are solely those of the authors and do not necessarily represent those of their affiliated organizations, or those of the publisher, the editors and the reviewers. Any product that may be evaluated in this article or claim that may be made by its manufacturer is not guaranteed or endorsed by the publisher.
Research integrity at Frontiers
Learn more about the work of our research integrity team to safeguard the quality of each article we publish.