- Department of General Surgery, Tianjin Medical University General Hospital, Tianjin Medical University, Tianjin, China
Papillary thyroid carcinoma (PTC) is the most common subtype of thyroid cancer. PTC is typically curable with an excellent survival rate; however, some patients experience disease recurrence or death. This study aimed to discover potential key genes and signaling pathways of PTC, which could provide new insights for thyroid lesions. Four GEO microarray datasets were integrated to screen for candidate genes involved in PTC progression. A total of 164 upregulated and 168 downregulated differentially expressed genes (DEGs) were screened. Gene Ontology/Kyoto Encyclopedia of Genes and Genomes were used in pathway enrichment analyses for DEGs. A protein-protein interaction network was then built and analyzed utilizing STRING and Cytoscape, followed by the identification of 13 hub genes by cytoHubba. CDH3, CTGF, CYR61, OGN, FGF13, and CHRDL1 were selected through survival analyses. Furthermore, immune infiltration, mutations and methylation analysis indicated that these six hub genes played vital roles in immune surveillance and tumor progression. ROC and K-M plots showed that these genes had good prognostic values for PTC which was validated by TCGA dataset. Finally, GSEA for a single hub gene revealed that each candidate hub gene had close associations with PTC development. These findings provided new insights into PTC pathogenesis and identified six candidate gene prognosis signature for PTC.
Introduction
Thyroid cancer (THCA) is one of the most common endocrine malignancies worldwide, and has an increasing incidence (>3% per year) (1). In 2018, the global incidence of THCA in women was 10.2 per 100,000 (3× that of men), and the disease accounted for 5.1% (1/20 cancer diagnoses) of all cancers in women (2). Thyroid cancer is the sixth most common type of cancer in American women, with approximately 37,810 new cases diagnosed and 1,150 deaths in 2019 (1). Among Chinese women, THCA is the most commonly diagnosed cancer in women before the age of 30, and 67,900 new cases and 4,300 deaths occurred in 2015 (3). THCA can be subdivided into multiple subtypes. The most common subtype is papillary thyroid cancer (PTC), accounting for about 80% of all THCAs (4). Although the majority of patients with PTC have a good prognosis, >10% of patients experience disease recurrence or metastasis during long-term follow-up (5). Therefore, it is necessary to elucidate the pathogenesis of PTC and identify effective prognostic biomarkers.
In recent years, BRAF and RAS point mutations have been shown to closely precede the development of PTC (6, 7). In addition, rearrangements involving RET and NTRK1 lead to activation of the mitogen-activated protein kinase (MAPK) signaling pathway, which can accelerate PTC progression (8, 9). Despite significant research advances, the underlying mechanisms of PTC tumorigenesis remain elusive. Therefore, more relevant genes need to be identified to fully understand the mechanism of PTC progression. The widespread application of next-generation sequencing and other gene microarray technologies have resulted in the generation of numerous public databases that store a high number of large functional genome datasets. The rapid development of computational tools has provided another key to identifying potential genes and pathways involved in PTC (10). The heterogeneity between study samples and studies from a single cohort often pose challenges with data interpretation (11, 12). The data are often incomplete or inconsistent with one another. As a result, a comprehensive analysis of integrated gene expression data using bioinformatics methods can address this shortcoming.
In the present study, raw data from four microarray datasets from the Gene Expression Omnibus (GEO; http://www.ncbi.nlm.nih.gov/geo/) were downloaded and used for bioinformatics analyses. A six gene signature was identified by combining the specific gene expression comparison, Gene Ontology (GO)/Kyoto Encyclopedia of Genes and Genomic Pathways (KEGG) analysis, protein-protein interaction (PPI) network construction, clinical-pathological features, infiltrating immune cell analysis, mutation, and methylation data. Finally, a gene set enrichment analysis (GSEA) was also used to investigate potential biological functions.
Materials and Methods
Data Preparation and Pre-Processing
Five raw PTC-associated gene expression datasets, including GSE3678, GSE6004, GSE33630, GSE53157, and GSE58545, were downloaded from NCBI-GEO (https://www.ncbi.nlm.nih.gov/gds/). Among them, the GSE3678, GSE6004, GSE33630 and GSE53157 datasets were based on the GPL570 [HG-U133_Plus_2] Affymetrix Human Genome U133 Plus 2 Array platform. The GSE58545 dataset was analyzed on the GPL96 [HG-U133A] platform, which was used to test the correlation of screened hub genes. The raw data from these datasets were processed using the R language statistical software (version 3.6.1). The horizontal linear model, affy (13), and affyPLM packages (14) were used for the probe horizontal. Box plots of RNA degradation and Normalized Unscaled Standard Error (NUSE) were plotted to test the trend consistency of the data after the quality of the data was analyzed. RNA degradation was checked using the AffyRNAdeg function and microarray datasets with consistent trends and good RNA quality were selected for follow-up analyses. Data from The Cancer Genome Atlas (TCGA; https://cancergenome.nih.gov/)) was used as an external validation dataset.
Differentially Expressed Gene Screening and Integration
To ensure comparability and completeness of the dataset, gene expression profiling data were standardized and batch effects were removed. Normalization was performed using the RMA function in the Affy package (13). Differentially expressed genes (DEGs) between the tumor and peri-tumor tissues were screened using the LIMMA package (15). Threshold values of log2FC>1 and adjusted P<0.05 were considered statistically significantly meaningful and the dataset (GSE3678, GSE6004, GSE33630, and GSE53157) DEGs were subjected to overlapping analyses using the website (http://bioinformatics.psb.ugent.be/beg/).
Gene Ontology (GO) Enrichment and Kyoto Encyclopedia of Genes and Genomes (KEGG) Pathway Analysis
GO was used to make predictions based on the molecular function (MF), cellular components (CC), and biological processes (BP) of potential functions of target genes. KEGG enrichment analysis was used to determine the functional properties of DEGs. An online annotation, visualization, and integrated discovery database (16) (DAVID; http://david.abcc.ncifcrf.gov/) and Metascape (17) (http://metascape.org) were used to access GO and KEGG pathway enrichment analyses. P<0.05 was deemed statistically significant.
PPI Network Construction and Hub Gene Identification
The Search Tool for the Retrieval of Interacting Genes/Proteins (STRING) database search tool is an online tool used to evaluate PPI information (18). In this study, DEGs with co-expression coefficients greater than 0.4 were extracted from the STRING database. The Cytoscape software, a publicly available bioinformatics software platform for visualizing and analyzing molecular interaction networks, was used to build a PPI network (19). Hub genes were selected from the intersection of the top 65 genes calculated using 12 topological analysis methods by using the Cytoscape plugin cytoHubba (20).
The cBioPortal for Cancer Genomics Analysis
The cBioPortal for Cancer Genomics (http://www.cbioportal.org/) is an open source platform that supports visualization, analysis, and downloads of multiple cancer genomic datasets (21). The frequency of genetic alterations in 13 hub genes in patients with PTC and their relationship to survival outcomes were explored by using cBioPortal.
Gene Expression Profiling Interactive Analysis Database Analysis
Gene Expression Profiling Interactive Analysis (GEPIA; http://gepia.cancer-pku.cn/) is a newly developed interactive web server for analyzing the RNA sequencing expression data of 9,736 tumors and 8,587 peri-tumor samples from The Cancer Genome Atlas (TCGA) and the Genotype-Tissue Expression (GTEx) databases using a standard processing pipeline (22). Disease-free survival (DFS) is the duration of time from the start of treatment to the date of progression, the start date of second-line treatment, or the date of death, whichever occurs first. OS is the length of time from the date of diagnosis or first treatment to the date of death or the last follow-up visit. We used GEPIA to compare gene expression and to evaluate the contribution of the screened candidate genes to OS and DFS of PTC patients.
Clinical Patients’ Samples and Transcriptome Sequencing Validation
Tumor and paired peri-tumor samples were collected from 10 histopathologically and clinically diagnosed PTC patients at Tianjin Medical University General Hospital from January 2017 to March 2017. Total RNA was extracted using TRIzol reagent and the quality of the extracted RNA was checked by Agilent 2100 Bioanalyzer (Santa Clara, CA, USA). Then, the cDNA libraries were constructed and sequenced on a HiSeq 2000 at Beijing Genomics institution. The study was planned according to the ethical guidelines following the Declaration of Helsinki. This project was approved by the Ethics Committee of Tianjin Medical University General Hospital. All participants gave informed consent prior to enrollment in the investigation.
UALCAN Database Analysis
UALCAN (http://ualcan.path.uab.edu) is a comprehensive, user-friendly, interactive web resource using TCGA RNA-seq data and the latest clinical data for 31 cancer types (23). It was designed to allow for the analysis of tumor and peri-tumor samples as well as different tumor types based on individual cancer stages, tumor grades, or other clinicopathological features and the relative gene expression of the subgroups. We selected key genes from the 13 hub genes to correlate to multiple clinical disease characteristics.
Human Protein Atlas Analysis
The Human Protein Atlas (https://www.proteinatlas.org/) is a website containing immunohistochemistry (IHC) data to help investigate protein expression in human tissues and cells (24). Patient information, staining intensity, staining location, and sample number are available for each type of cancer. We assessed the expression of representative proteins in PTC and peri-tumor tissues of six key genes using IHC images after screening.
Construction of a Prognostic Gene Signature
To assess the prognostic value of the hub genes, we downloaded the THCA clinical dataset from TCGA database and tested the six gene signature via multifactorial Cox regression analysis using the Sangerbox (http://sangerbox.com/Tool) online tool.
DNA Methylation Interactive Visualization Database Analysis
DNA Methylation Interactive Visualization Database (DNMIVD); (http://119.3.41.228/dnmivd/index/) is a comprehensive annotation and interactive visualization database for DNA methylation profiles of diverse human cancers constructed with high throughput microarray data from TCGA and the GEO databases (25). To determine the best-fitting prognostic model, we established a multivariate proportional hazard regression model for the six hub genes. We utilized a Kaplan-Meier multivariate proportional hazards regression model to divide patients into high-risk and low-risk groups.
Immune Infiltration Analysis
Tumor Immune Estimation Resource (TIMER; https://cistrome.shinyapps.io/timer/) is a web resource for systematic evaluation of the clinical impact of various immune cell populations on different cancer types, and consists of 10,897 samples from 32 cancer types. In this study, we analyzed the expression of six hub genes in THCA involved in tumor purity and the abundance of their immune infiltration (B cells, CD4+ T cells, CD8+ T cells, neutrophils, macrophages, and dendritic cells (DCs). Furthermore, we explored the relationship between gene copy number variation and the abundance of immune infiltration.
Gene Set Enrichment Analysis
GSEA is the process of sorting genes by the degree of differential expression between two types of samples using a predefined set of genes, usually from functional annotations or results of previous experiments, and then verifying whether the predefined set of genes is enriched at the top or bottom of this sorting table. We downloaded the THCA gene expression matrix from TCGA database and performed GSEA analysis using the Sangerbox website (http://sangerbox.com/Tool) to predict potential hallmarks. A permutation test with 1,000 permutations was used to identify the significantly changed pathways. Thresholds of an adjusted p-value <0.05 were considered statistically significant.
Statistical Analysis
Data were expressed as mean ± standard deviation. Analyses were done using GraphPad Prism (version 8.0; San Diego, CA, USA). Comparisons between the tumor and peri-tumor groups were performed using Student’s t-test. P value less than 0.05 were considered statistically significant.
Results
Screening of DEGs and Functional Enrichment Analysis
Workflows are presented for DEGs identification, function enrichment, and the validation analysis (Figure 1). To ensure more reliable quality of the datasets, GSE3678, GSE6004, GSE33630, and GSE53157 dataset deviations with those with higher levels were removed, leaving 76 PTC samples and peri-tumor samples for comparison. A total of 1,547, 1,050, 1,025, and 699 DEGs were identified for the GSE3678, GSE6004, GSE33630, and GSE53157 datasets, respectively (Figures 2A–D). Among the DEGs, 82 genes showed the same expression trend across the four datasets, including 55 upregulated genes (Figure 2E) and 27 downregulated genes (Figure 2F). Using the data profile GSE3678 as a reference, the heat map showed the distribution of significant differences among the 82 DEGs (Figure 2G). After filtering out 332 overlapping DEGs, 164 upregulated and 168 downregulated genes were discovered at the intersection of at least three microarray datasets for PTC and peri-tumor for GO and KEGG analyses. The data were visualized with Sangerbox software. The top 10 for each GO term and the top 10 KEGG pathways are listed. For BPs, DEGs were mainly enriched in blood coagulation, the bone morphogenetic protein signaling pathway, angiogenesis, wound healing, and extracellular matrix organization (Figure 3A). The CCs analysis revealed that DEGs were mostly enriched in the extracellular space, proteinaceous extracellular matrix, extracellular region, extracellular exosome, and costamere (Figure 3B). In molecular function, DEGs were primarily enriched for heparin binding, calcium ion binding, insulin-like growth factor binding, growth factor activity, and small molecule binding (Figure 3C). The KEGG pathway analysis indicated that the DEGs were predominantly enriched in the complement and coagulation cascades, extracellular matrix-receptor interaction, tyrosine metabolism, mineral absorption, proteoglycans in cancer, tight junction, cell adhesion molecules, p53 signaling pathway, PPAR signaling pathway, and oxytocin signaling pathway (Figure 3D).
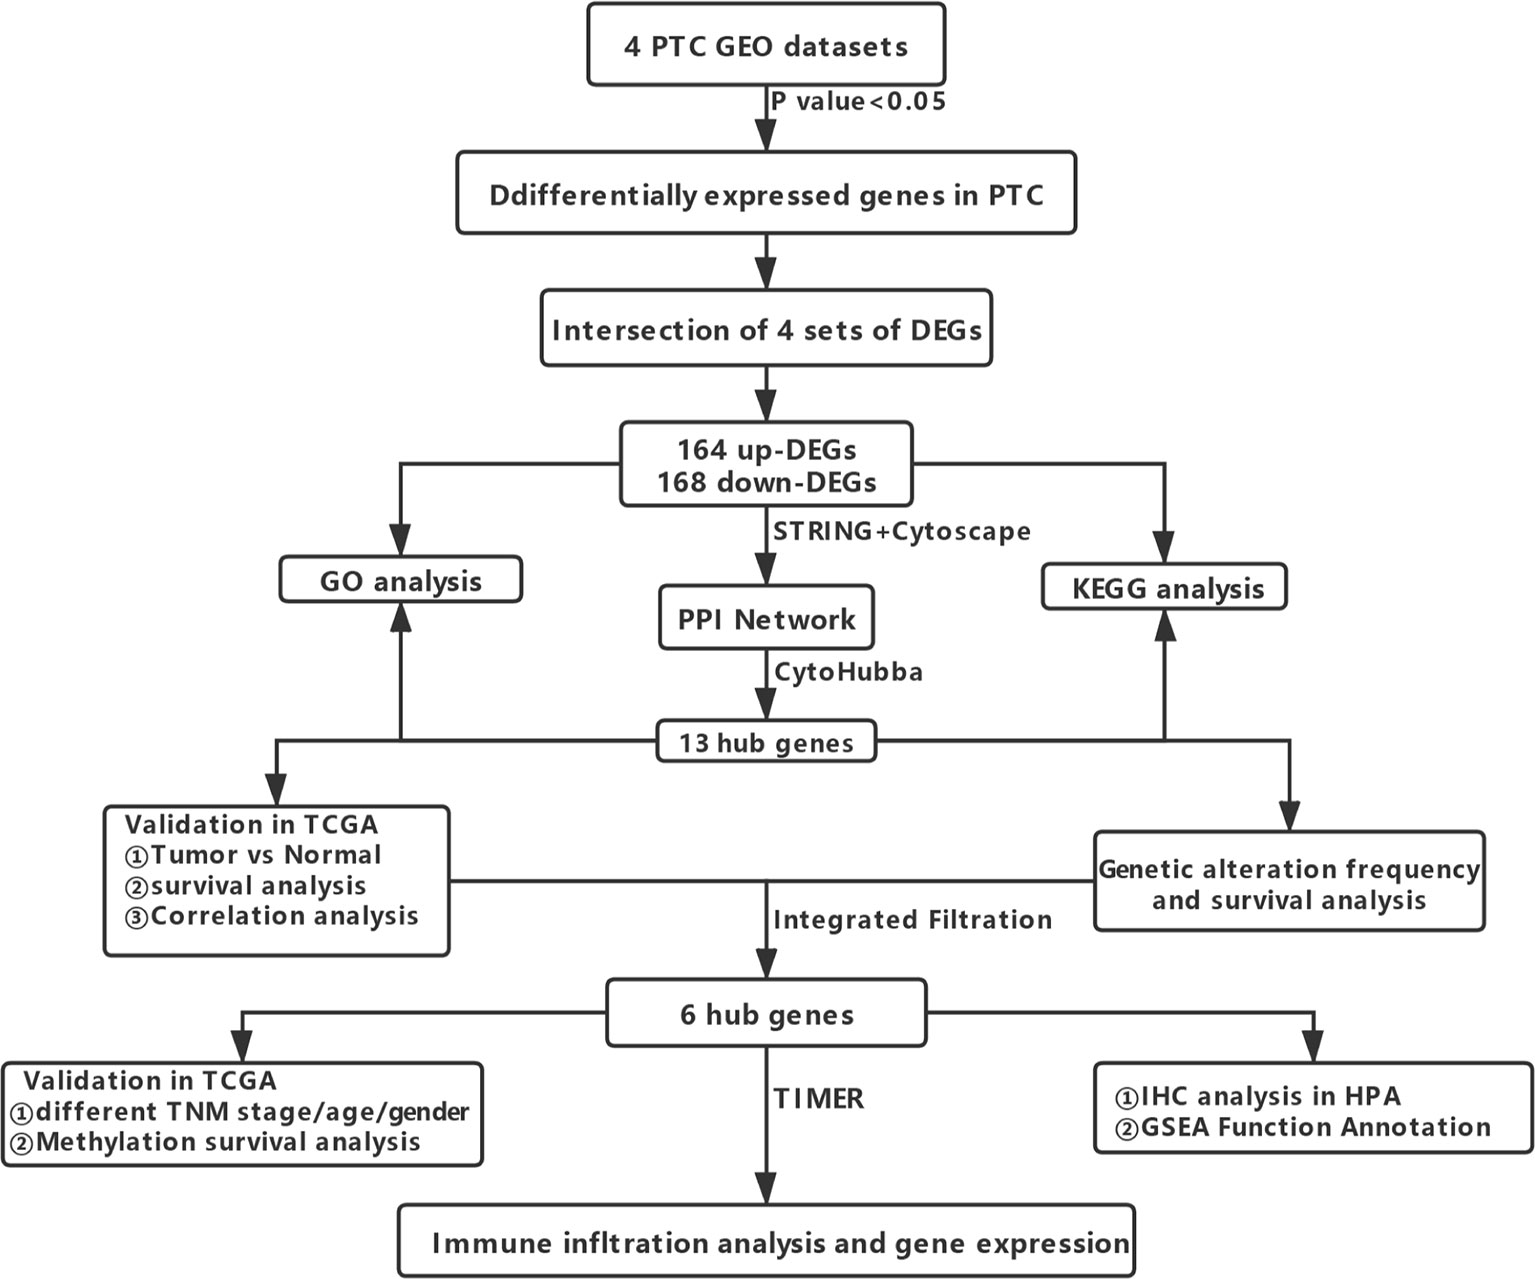
Figure 1 Flowchart showing the workflow for the identification, functional analysis, and verification of DEGs.
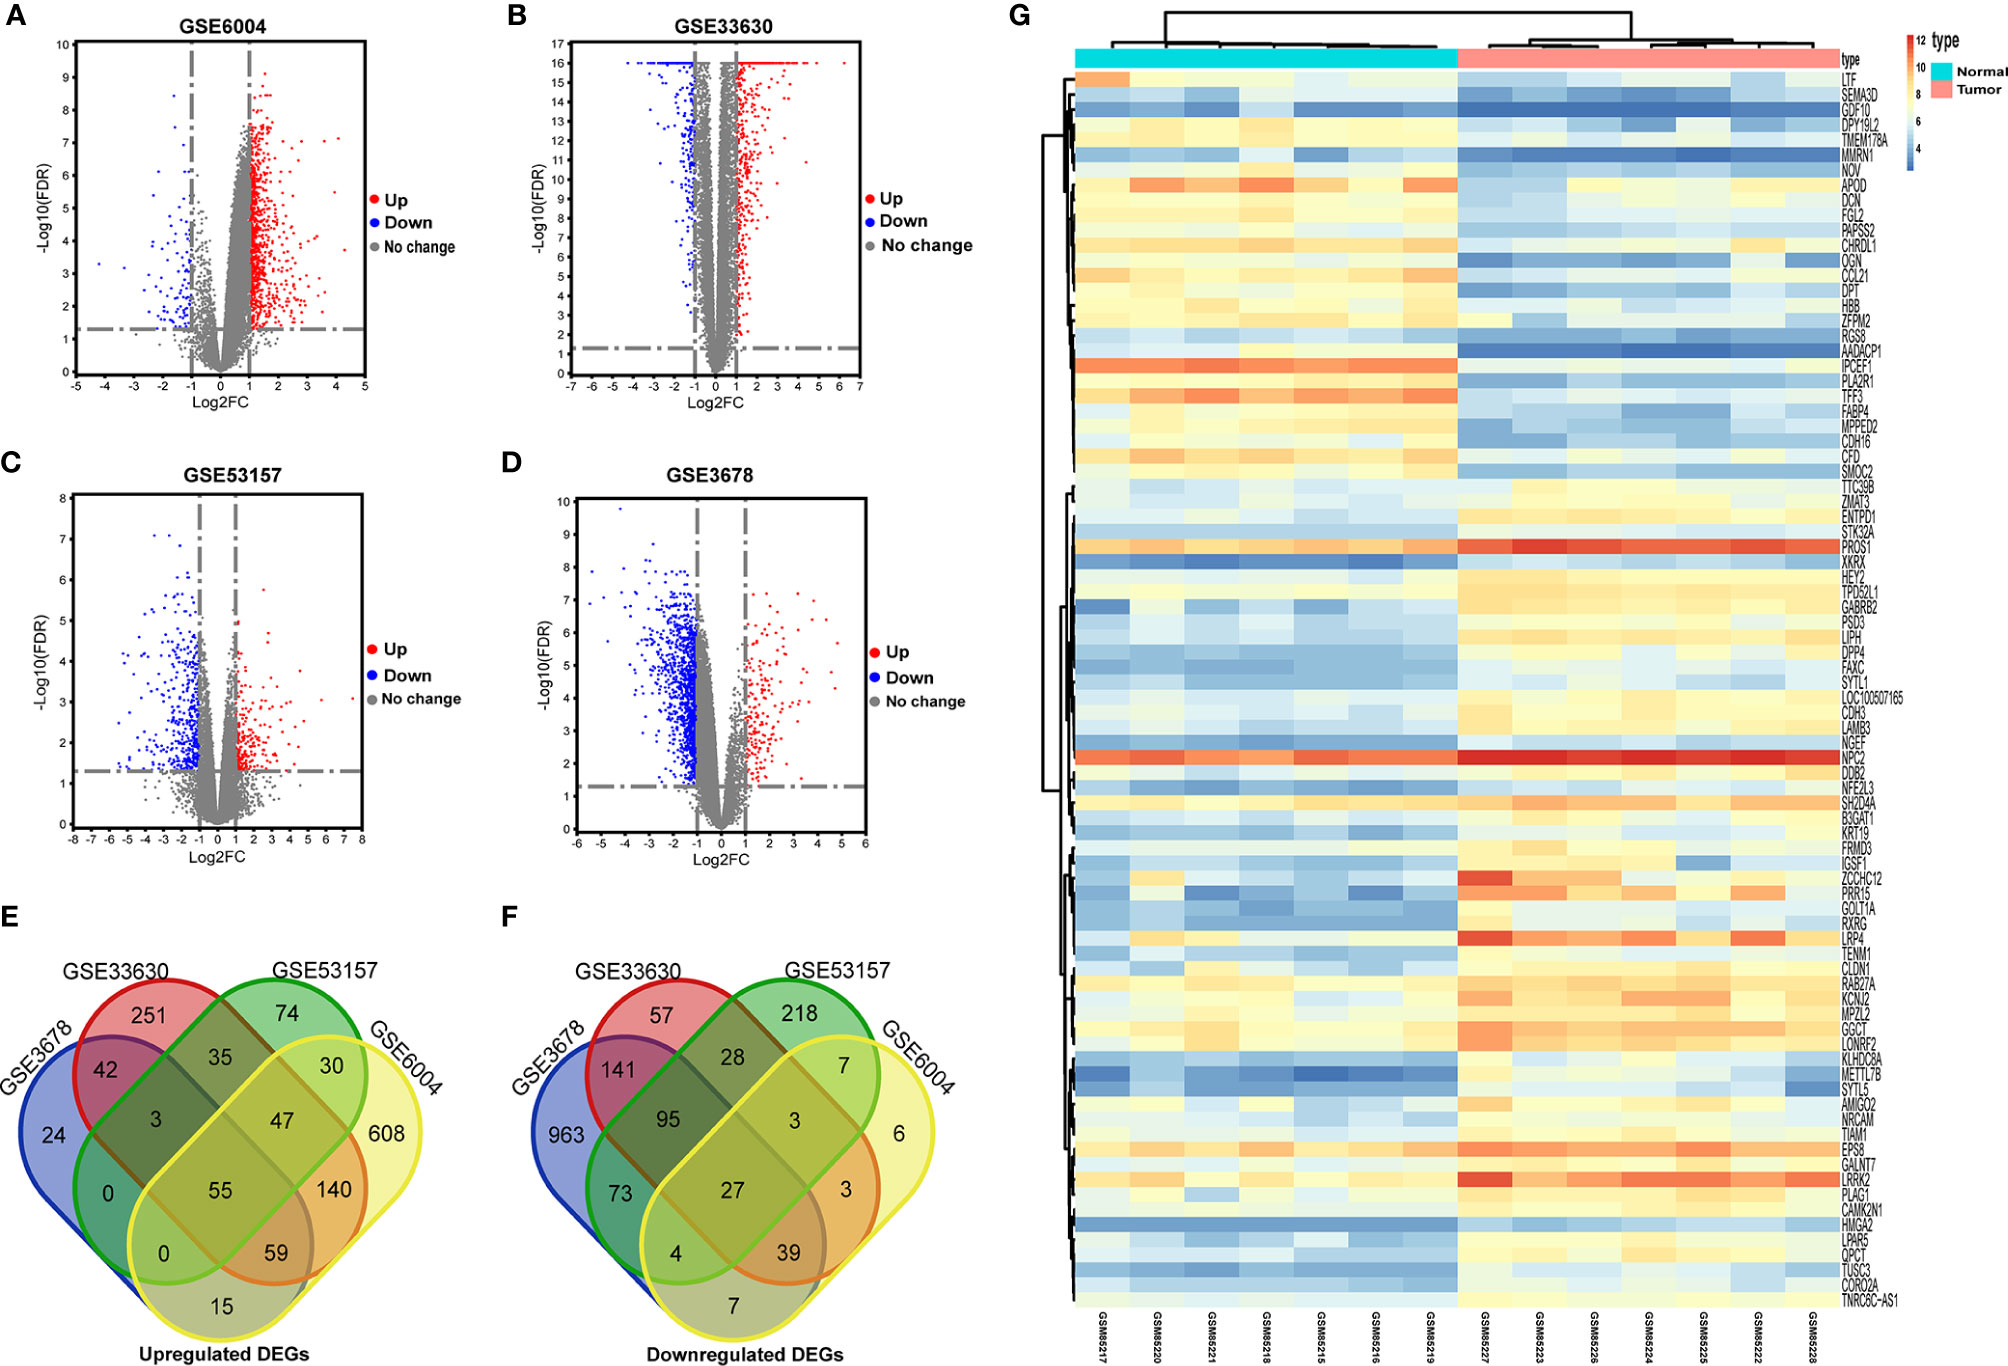
Figure 2 Identification of differentially expressed genes in PTC from public GEO datasets. (A–D) Volcano plots of DEGs in the four indicated datasets. DEGs, differentially expressed genes. X-axis: log2 (FC); Y-axis: -log10 (FDR) for each gene. Genes with FDR < 0.05 and FC > 1.0 or < -1.0 are considered DEGs for each dataset. Blue: downregulated genes; Grey: no differentially expressed genes; Red: upregulated genes. (E, F) Screening of DEGs in mRNA expression profiling datasets GSE3678, GSE6004, GSE33630, and GSE53157. (E) The overlapping regions indicate the commonly upregulated DEGs. (F) The overlapping regions indicate the commonly downregulated DEGs. (G) Representative heat map of the 82 overlapping genes between PTC and normal samples in the GSE3678 dataset. Orange represents higher expression and blue represents lower expression.
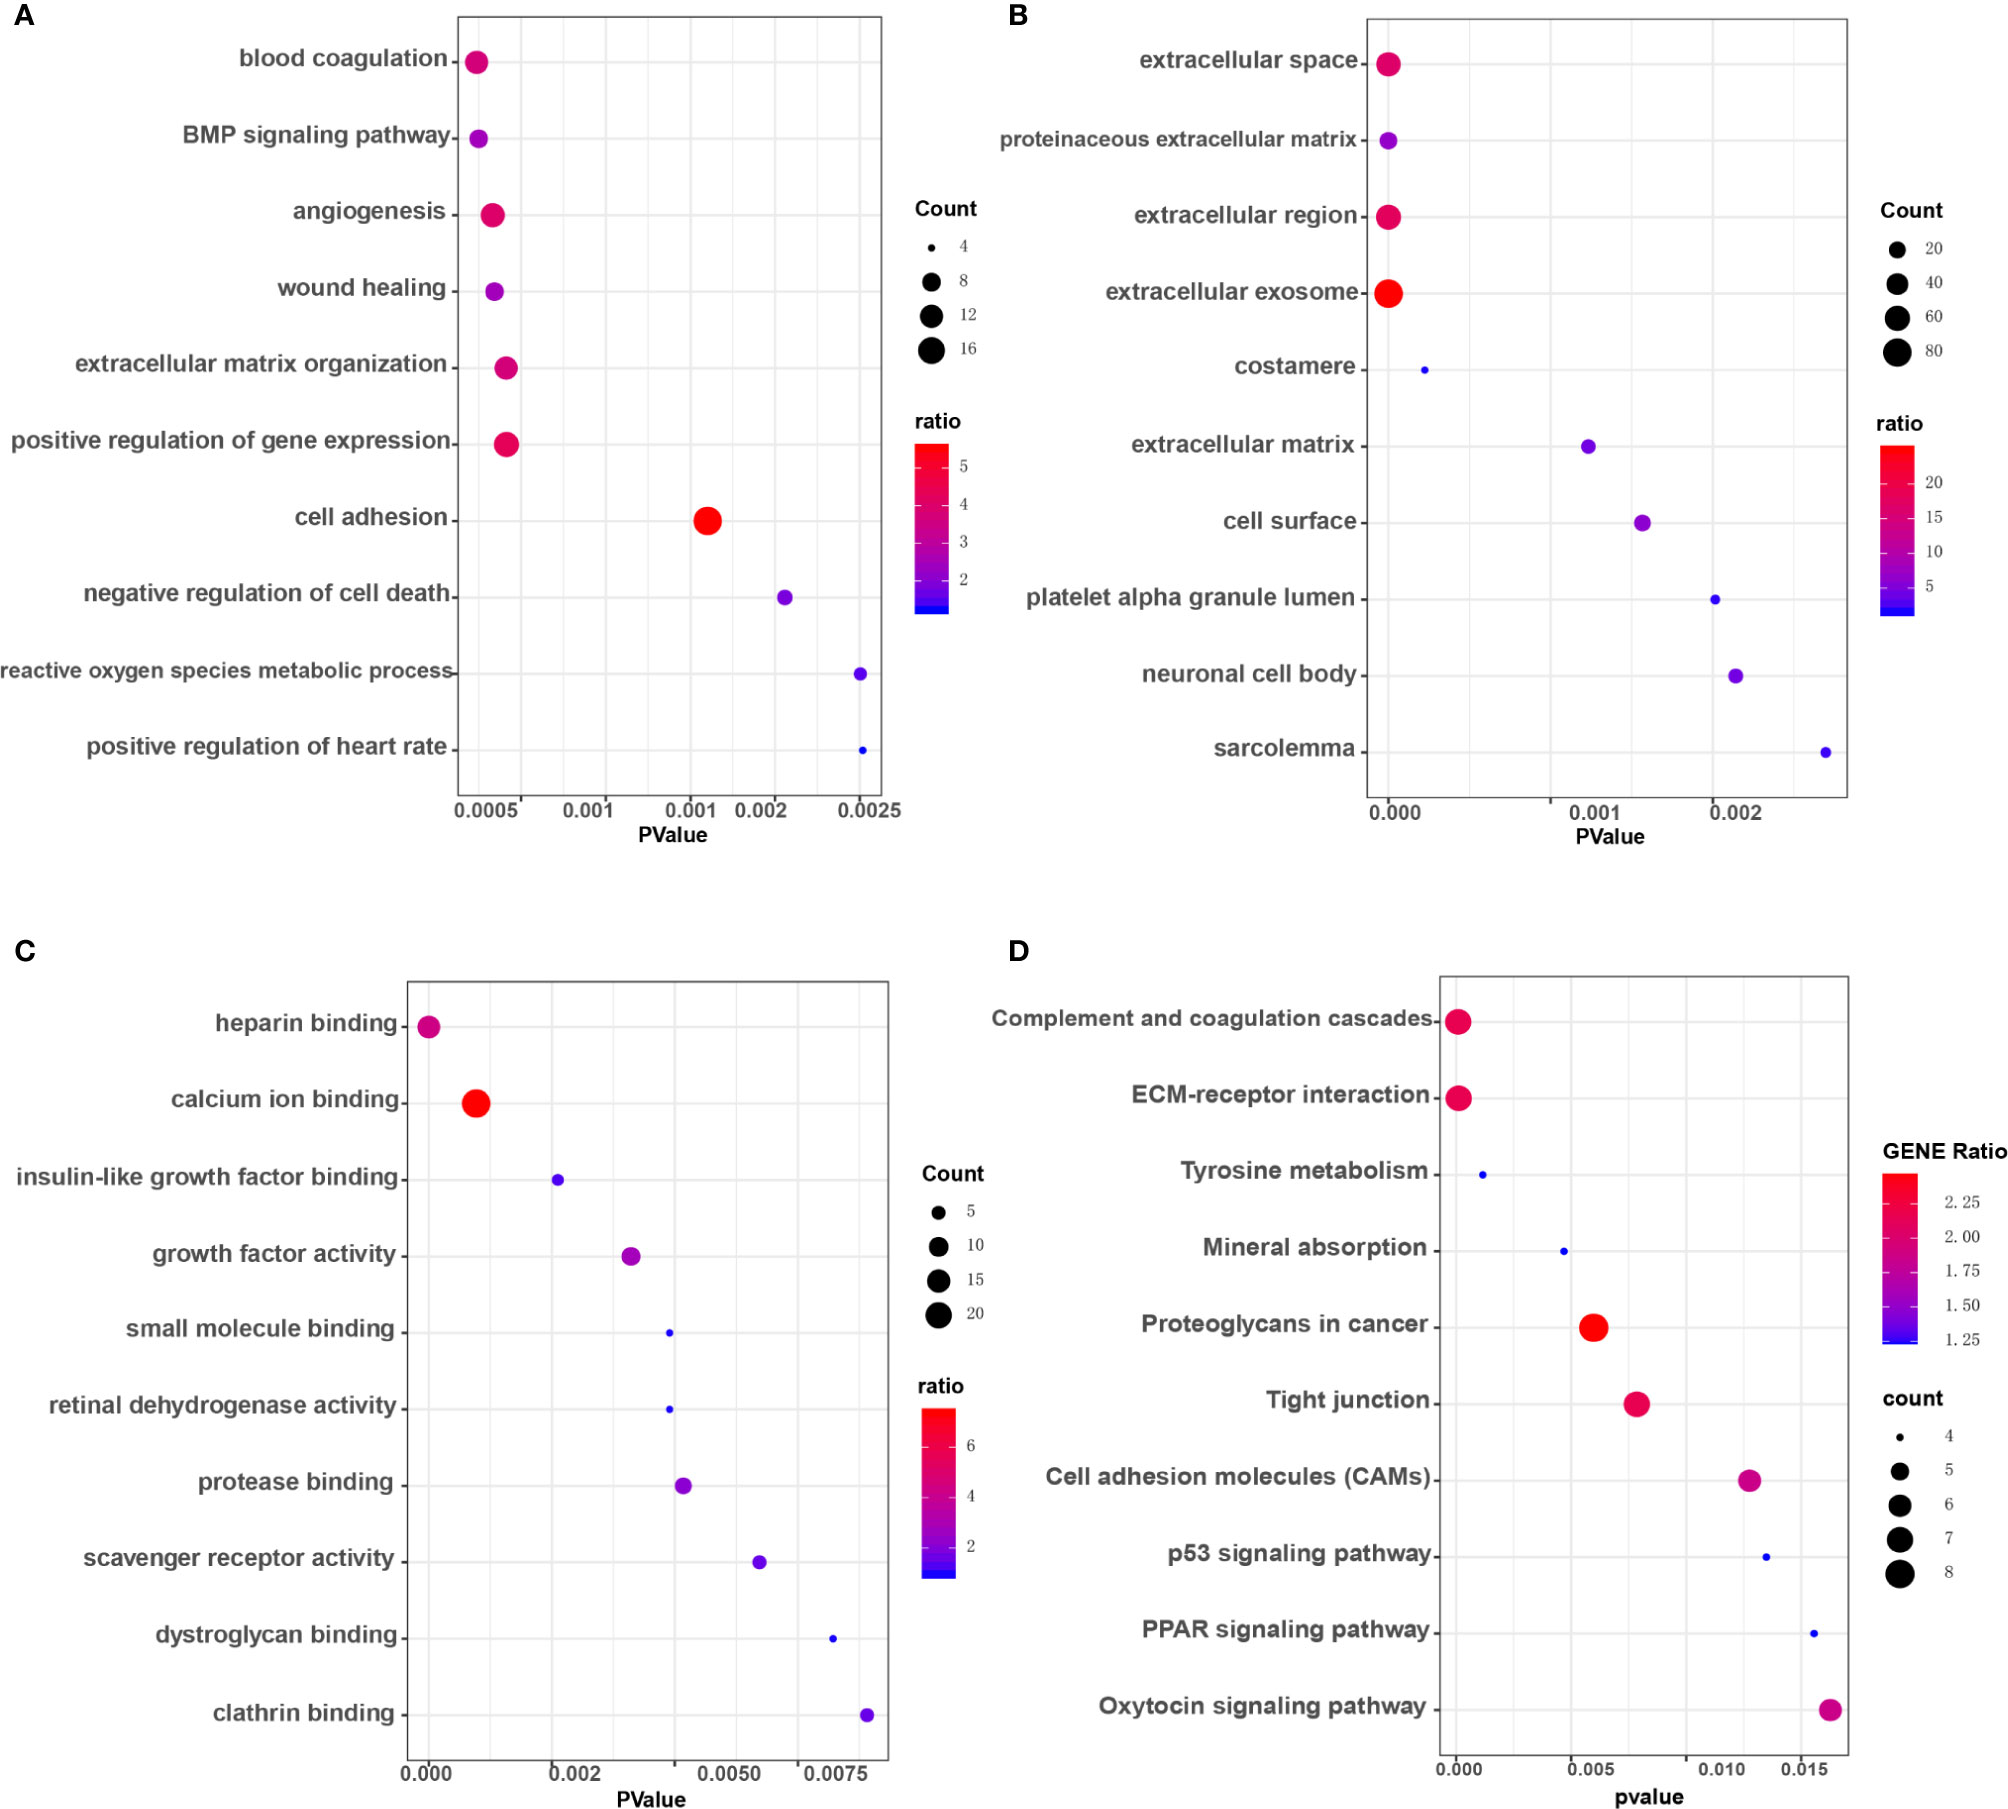
Figure 3 GO enrichment and KEGG pathway analysis of overlapping DEGs in at least three microarray datasets. (A) Biological processes (BP) enrichment analysis. (B) Cellular components (CC) enrichment analysis. (C) Molecular function (MF) enrichment analysis. (D) KEGG pathway analysis.
Key Genes Screened Through the PPI Network and Functional Enrichment Analysis
332 DEGs previously screened were used in the PPI network analysis and a total of 242 DEGs (118 upregulated genes and 124 downregulated genes) were filtered into a PPI network containing 242 nodes and 466 edges using the STRING online database and were visualized using Cytoscape software (Figure 4). Thirteen hub genes were identified at the intersection of the top 65 DEGs calculated with 12 cytoHubba algorithms, including CTGF, CDH3, CHRDL1, FGF13, LPAR1, OGN, TIMP1, CYR61, CHI3L1, SERPINA1, PROM1, CCL21, and WFS1 (Figure 5A). The correlation between the 13 hub genes were calculated using the TCGA-THCA dataset (Figure 5B). A Pearson’s correlation analysis revealed significant correlations among them. To validate these results, another GEO dataset (GSE58545) was used to measure the mRNA expression of the 13 hub genes. Rank clustering showed that the hub genes can distinguish PTC samples from peri-tumor group samples (Figure 5C). Furthermore, Metascape software was used for GO and KEGG pathway analysis. The top 13 GO enrichment terms(Figures 6A, B) and BPs included: cartilage development, positive regulation of protein kinase activity, regulation of MAPK cascade, multicellular organismal homeostasis, negative regulation of cell projection organization, positive regulation of MAPK cascade, response to 1-oleoyl-sn-glycer, negative regulation of ATF6-mediated unfolded protein response, acute-phase response. CCs include: extracellular matrix, and prominosome. Molecular function includes: growth factor activity, and extracellular matrix structural constituent. The top 4 KEGG pathways were Rap1 signaling, melanoma, complement and coagulation cascades, and the NF-kappa B signaling pathway (Figure 6C). Most of the pathways are involved in tumorigenesis and immune processes.
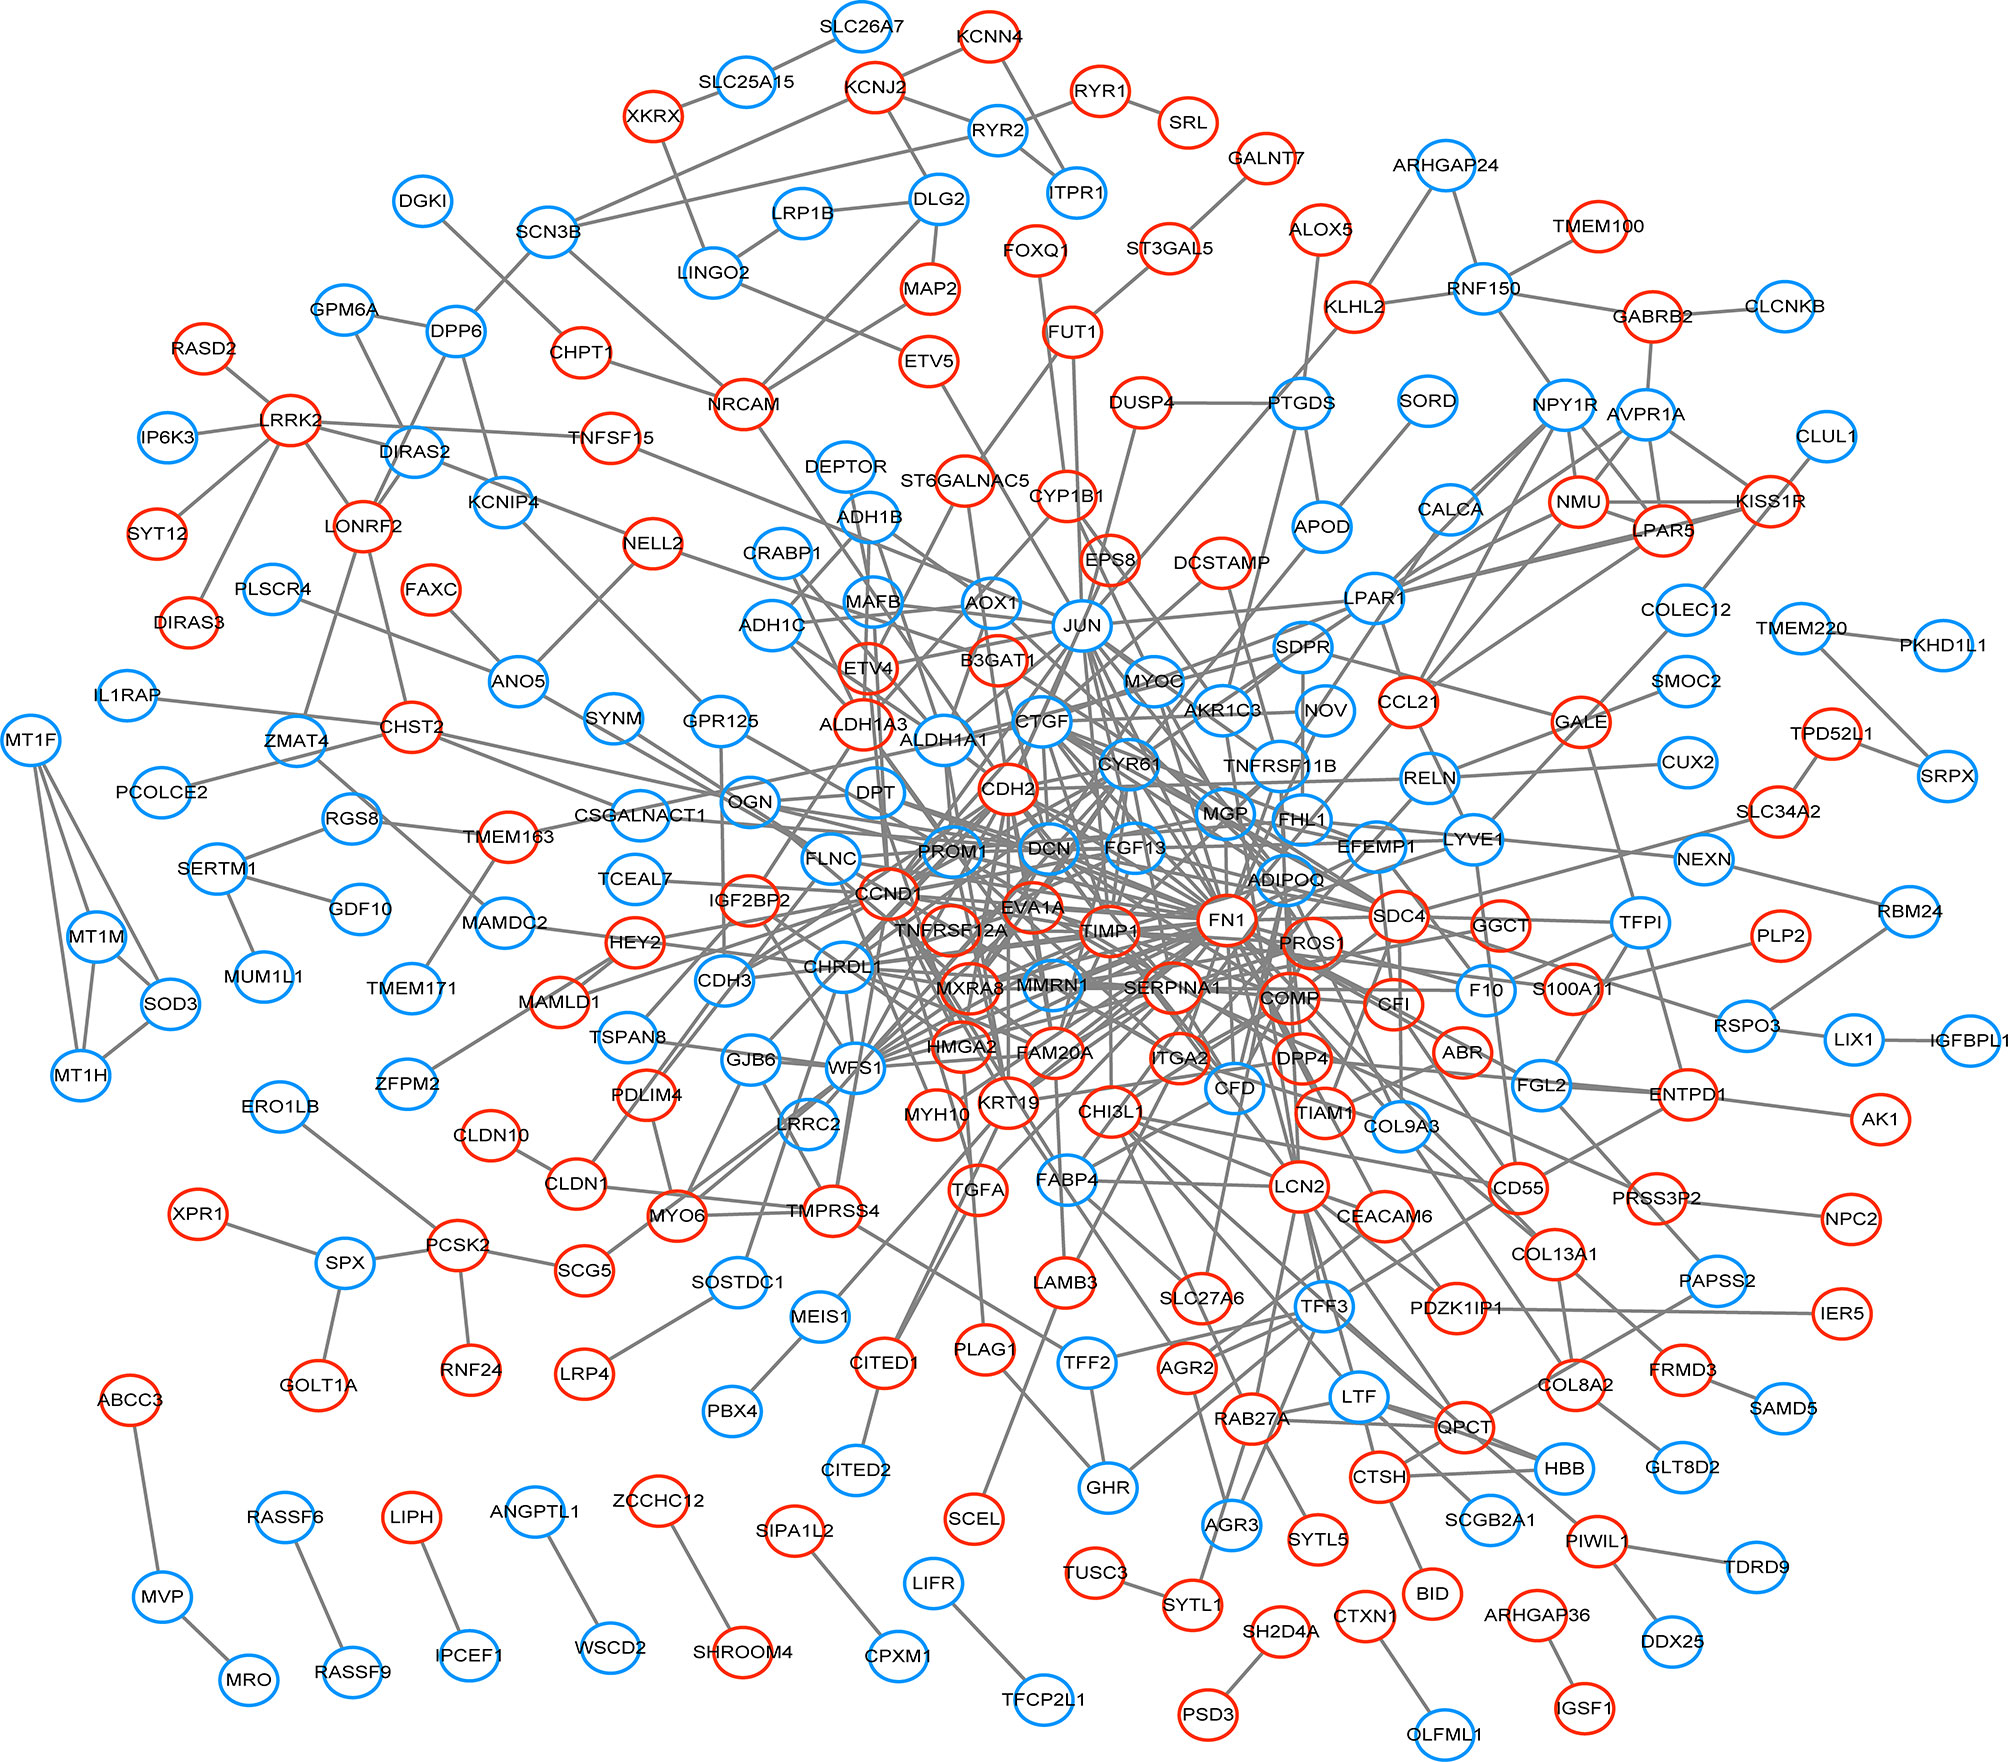
Figure 4 The PPI network of DEGs was constructed using Cytoscape. Red circles represent upregulated genes, while blue circles represent downregulated genes.
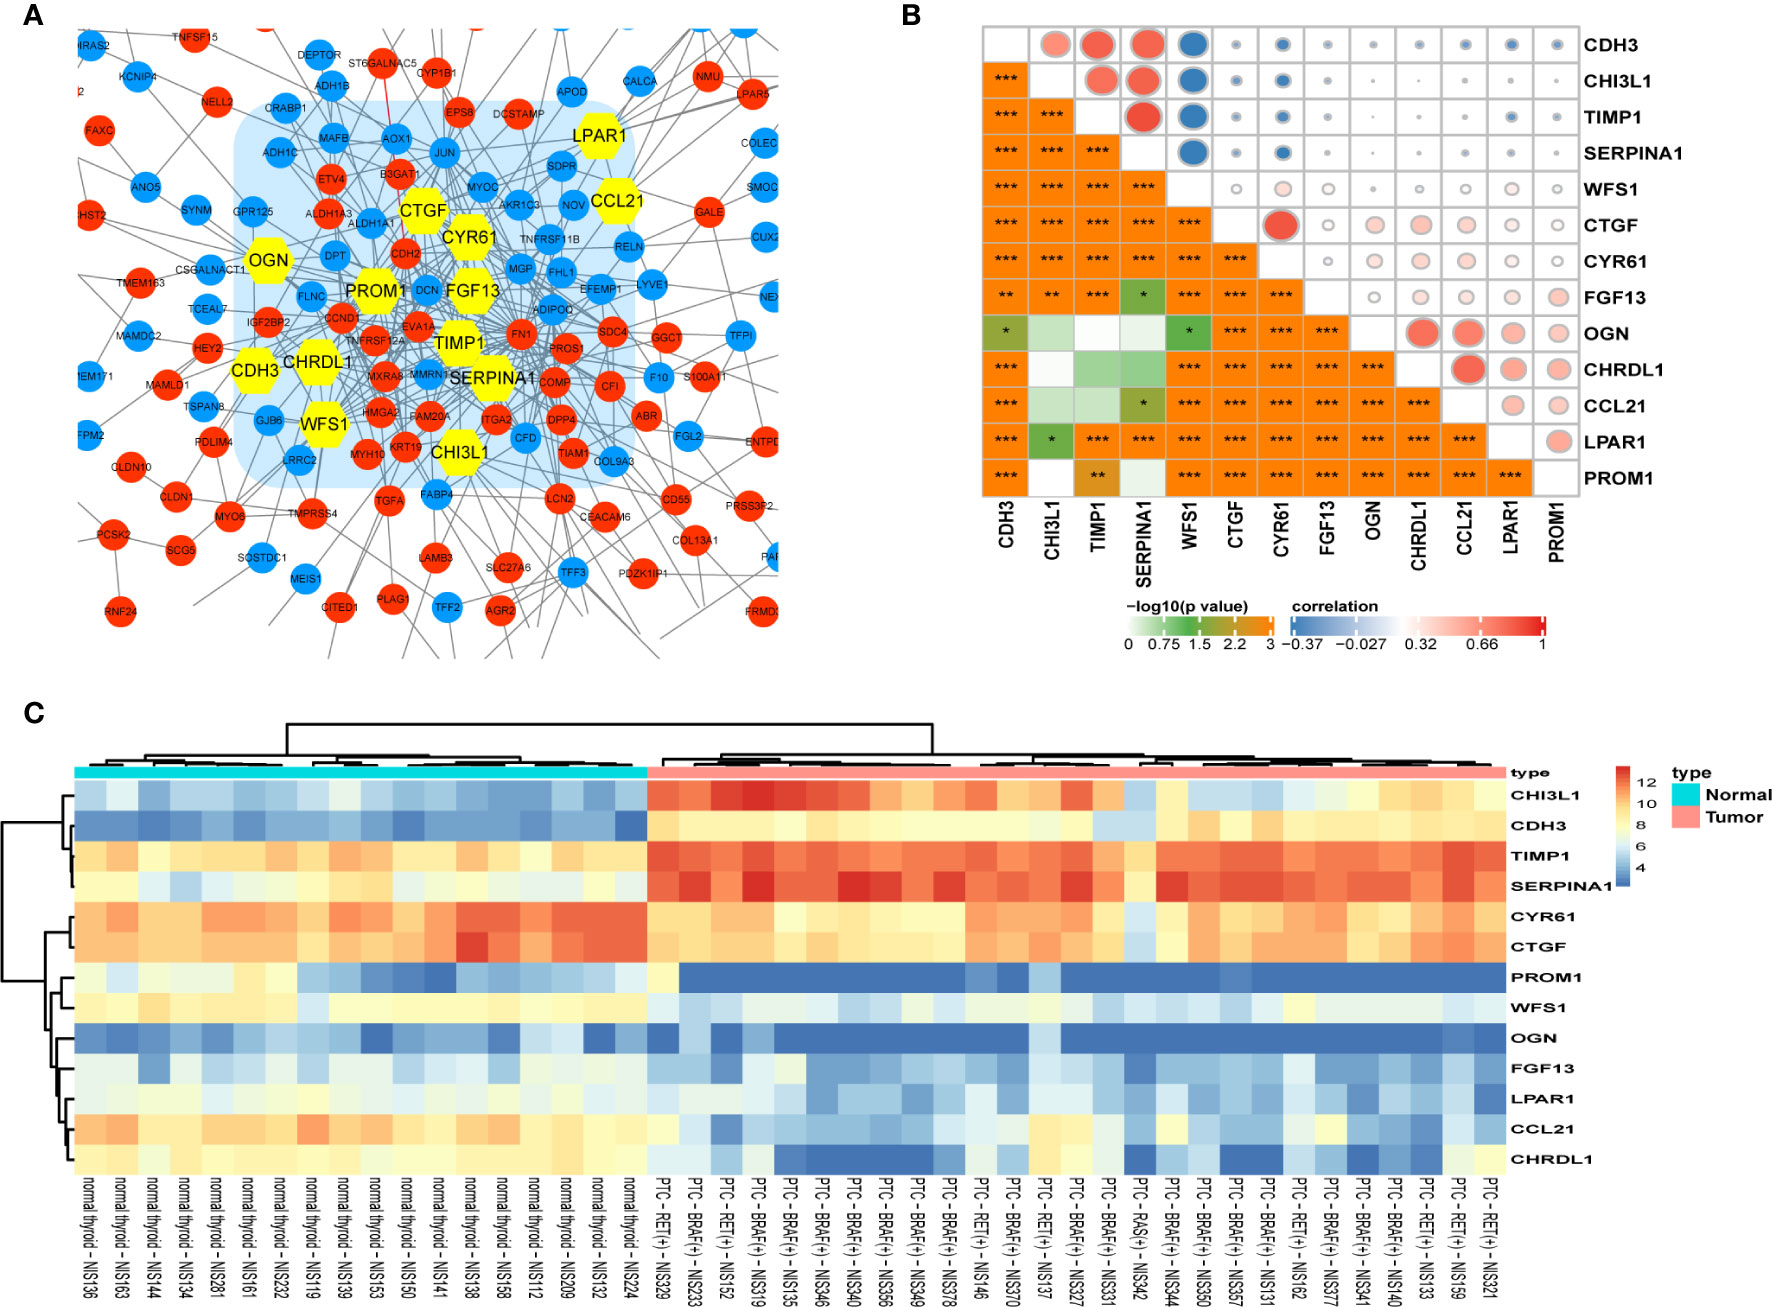
Figure 5 Identification and analysis of hub genes. (A) Thirteen statistically significant hub genes were screened using the Cytoscape software plugin cytoHubba. (B) Pearson’s correlation analysis of 13 hub genes. (C) The hierarchical clustering heat map of the 13 most significant hub genes was constructed using the GSE58545 dataset. Orange indicates that the expression of genes is relatively upregulated, blue indicates that the expression of genes is relatively downregulated. (*p< 0.05; **p < 0.01; ***p < 0.001).
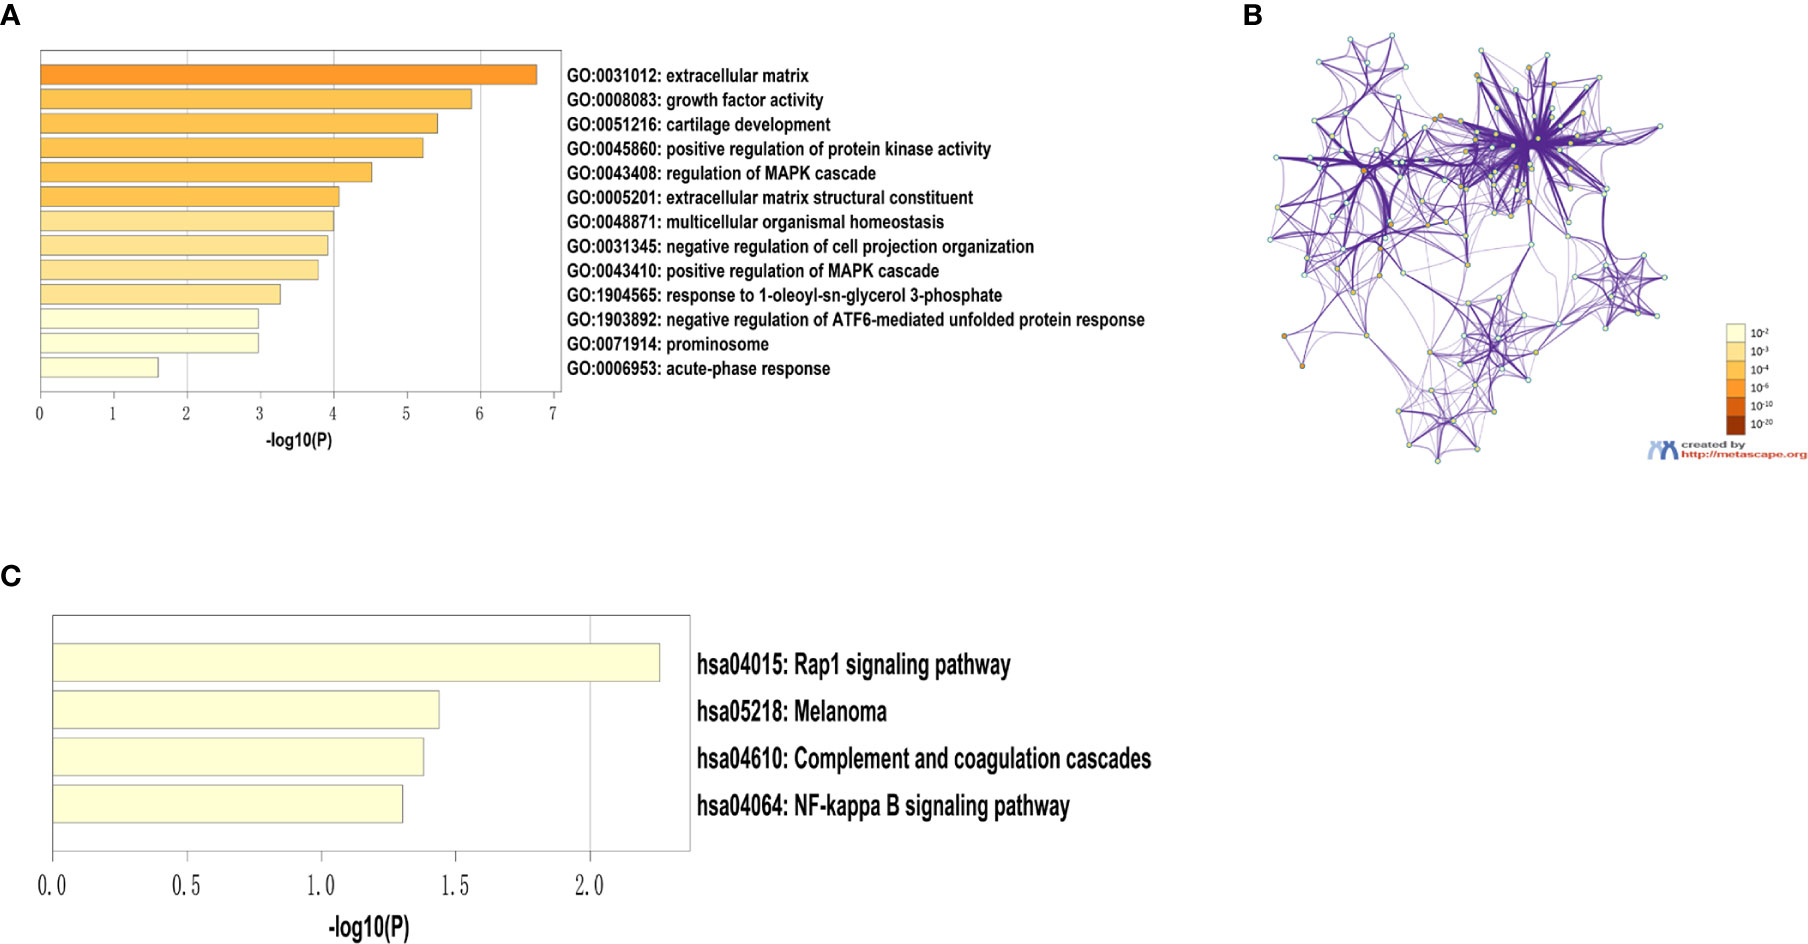
Figure 6 Results of the hub gene GO and KEGG pathway analysis. (A) Top 13 GO enrichment terms. (B) A network of GO-rich terms colored by p-value. (C) Top nine KEGG pathway enrichment terms.
Genetic Alterations of 13 Screened Hub Genes in PTC Patients
In order to analyze the genetic alterations of the 13 hub genes in THCA in the cBioPortal online databases, the THCA (TCGA; Firehose Legacy), PTC (TCGA; Cell 2014), and THCA (TCGA, PanCancer Atlas) databases were used. Results showed that the percentages of genetic alterations in each dataset were 3.17% (16/505), 3.02% (15/496), 2.6% (13/500), respectively (Figure 7A). Specific to PTC, the alteration frequency of the 13 hub genes was 4% for CDH3, 3% for CCL21, 2.6% for CHRDL1, 3% for FGF13, 5% for LPAR1, 4% for OGN, 2.1% for TIMP1, 6% for CYR61 (CCN1), 4% for CHI3L1, 4% for SERPINA1, 2.3% for PROM1, 6% for CTGF (CCN2), and 3% for WFS1. In addition, the predominant alterations were expression changes instead of mutations (Figure 7B).
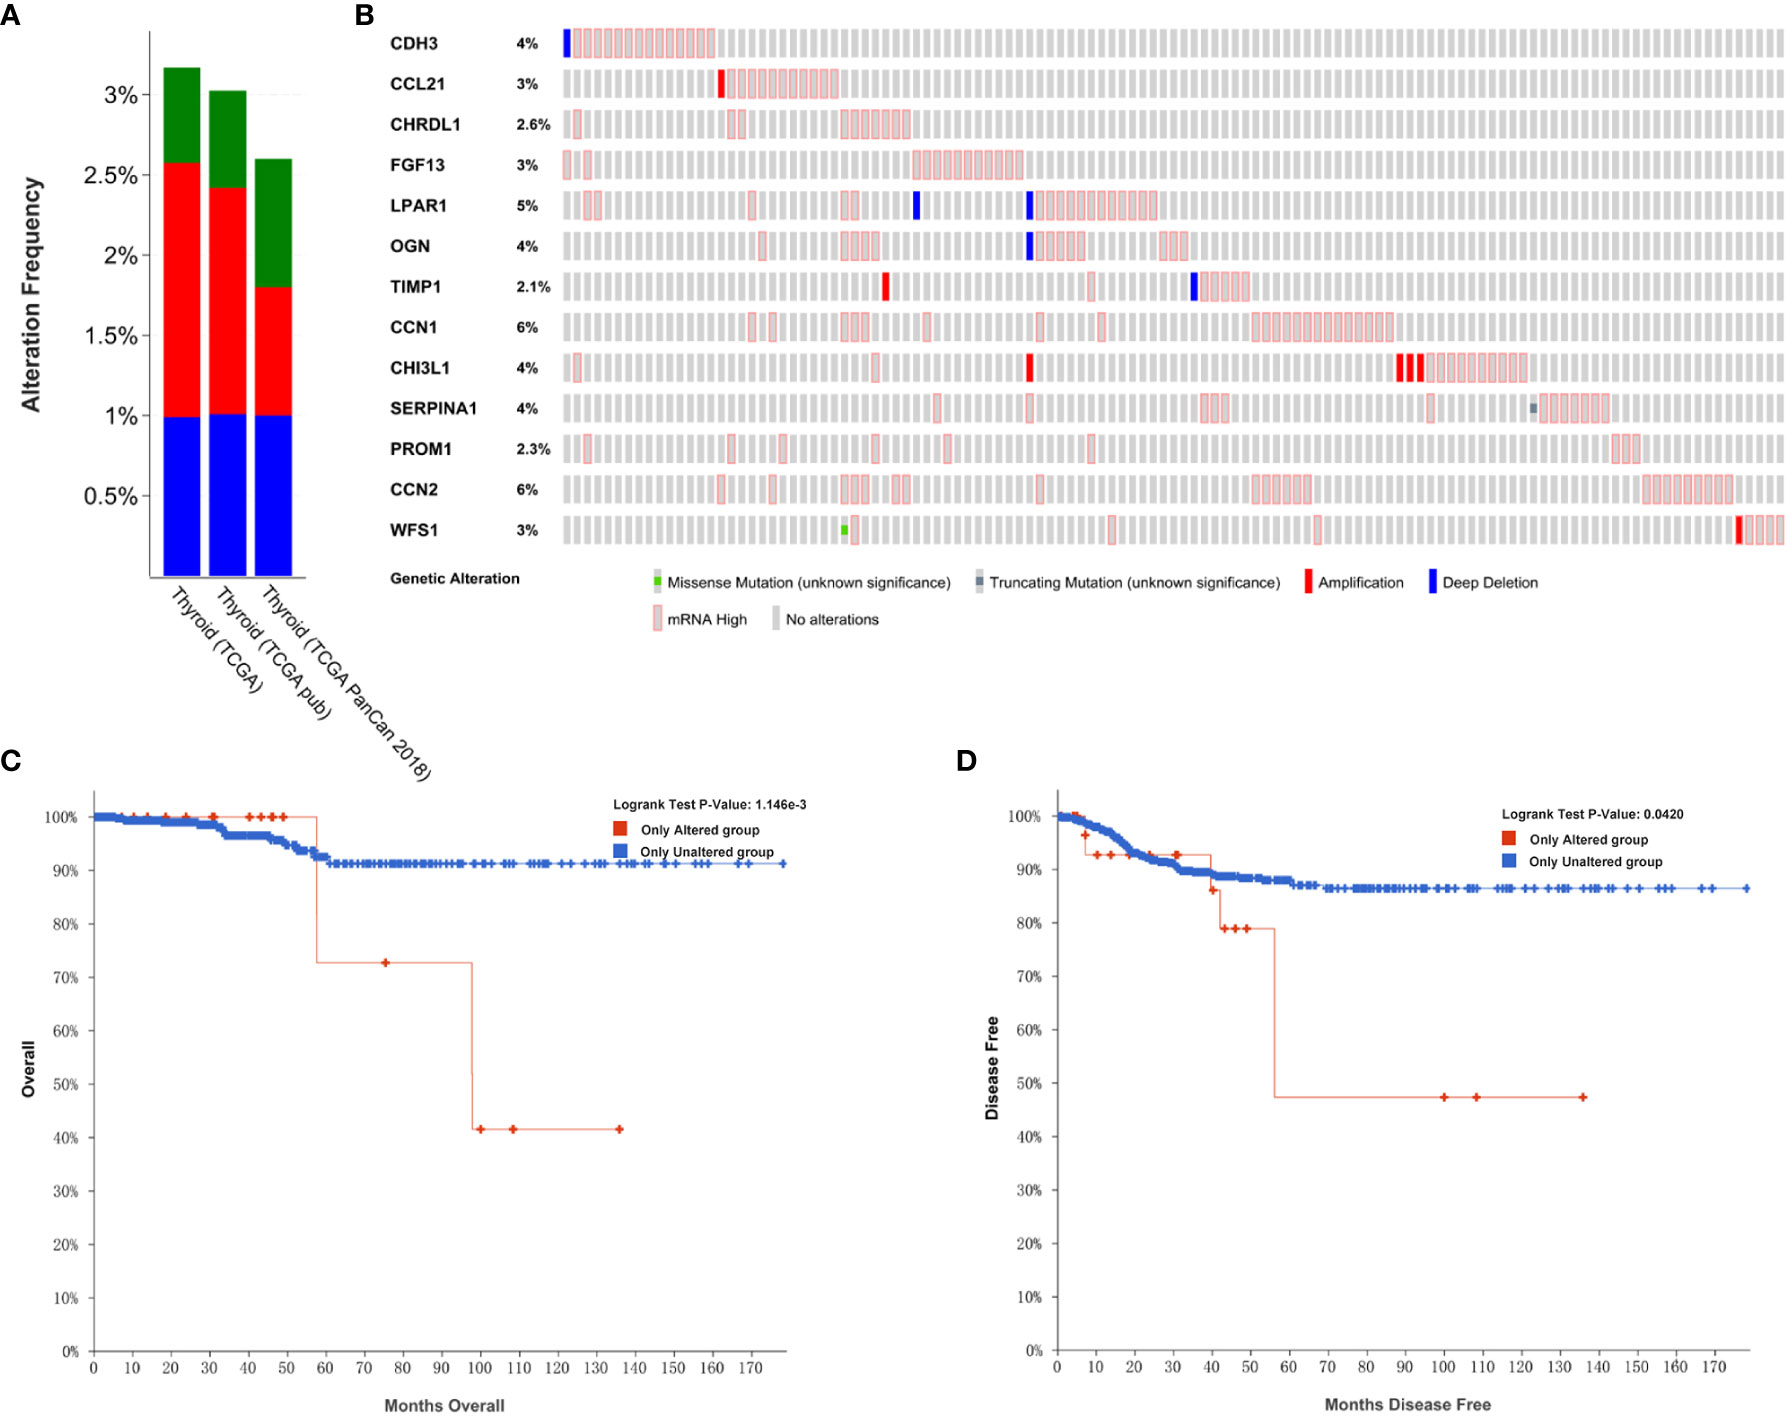
Figure 7 Genetic alterations linked to hub genes in THCA in the TCGA. (A) Thirteen hub gene alterations in THCA (TCGA, Firehose Legacy), PTC (TCGA, Cell 2014), THCA (TCGA, PanCancer Atlas). (B) Alteration frequencies of hub genes based on the PTC (TCGA, Cell 2014) dataset. (C) Kaplan-Meier plots comparing OS in cases with and without hub gene alterations. (D) Kaplan-Meier plots comparing DFS in cases with and without hub gene alterations.
We also performed an analysis of the correlation between cases with hub gene alterations and survival outcomes. Accordingly, results showed that cases with hub gene alterations were significantly associated with worse OS and DFS (p=1.146E-3; p=0.0420; Figures 7C, D).
We used GEPIA to evaluate the contribution of the 13 hub genes to clinical outcomes. The results revealed that CDH3 (p=0.017) was significantly associated with OS (Figure 8A). CYR61 (p=0.0017), OGN (p=0.039), CHRDL1 (p=0.0028), and FGF13 (p=0.047) were significantly correlated with DFS (Figures 8D–G). Moreover, CTGF was involved in both OS (p=0.022) and DFS (p=0.0004; Figures 8B, C). The remaining hub gene survival analyses did not show any statistical significance (Supplementary Figure 1). In summary, we demonstrated that the 13 hub genes are involved in PTC, and six genes (CDH3, CYR61, OGN, CHRDL1, FGF13, and CTGF) were significantly correlated to patient outcomes.
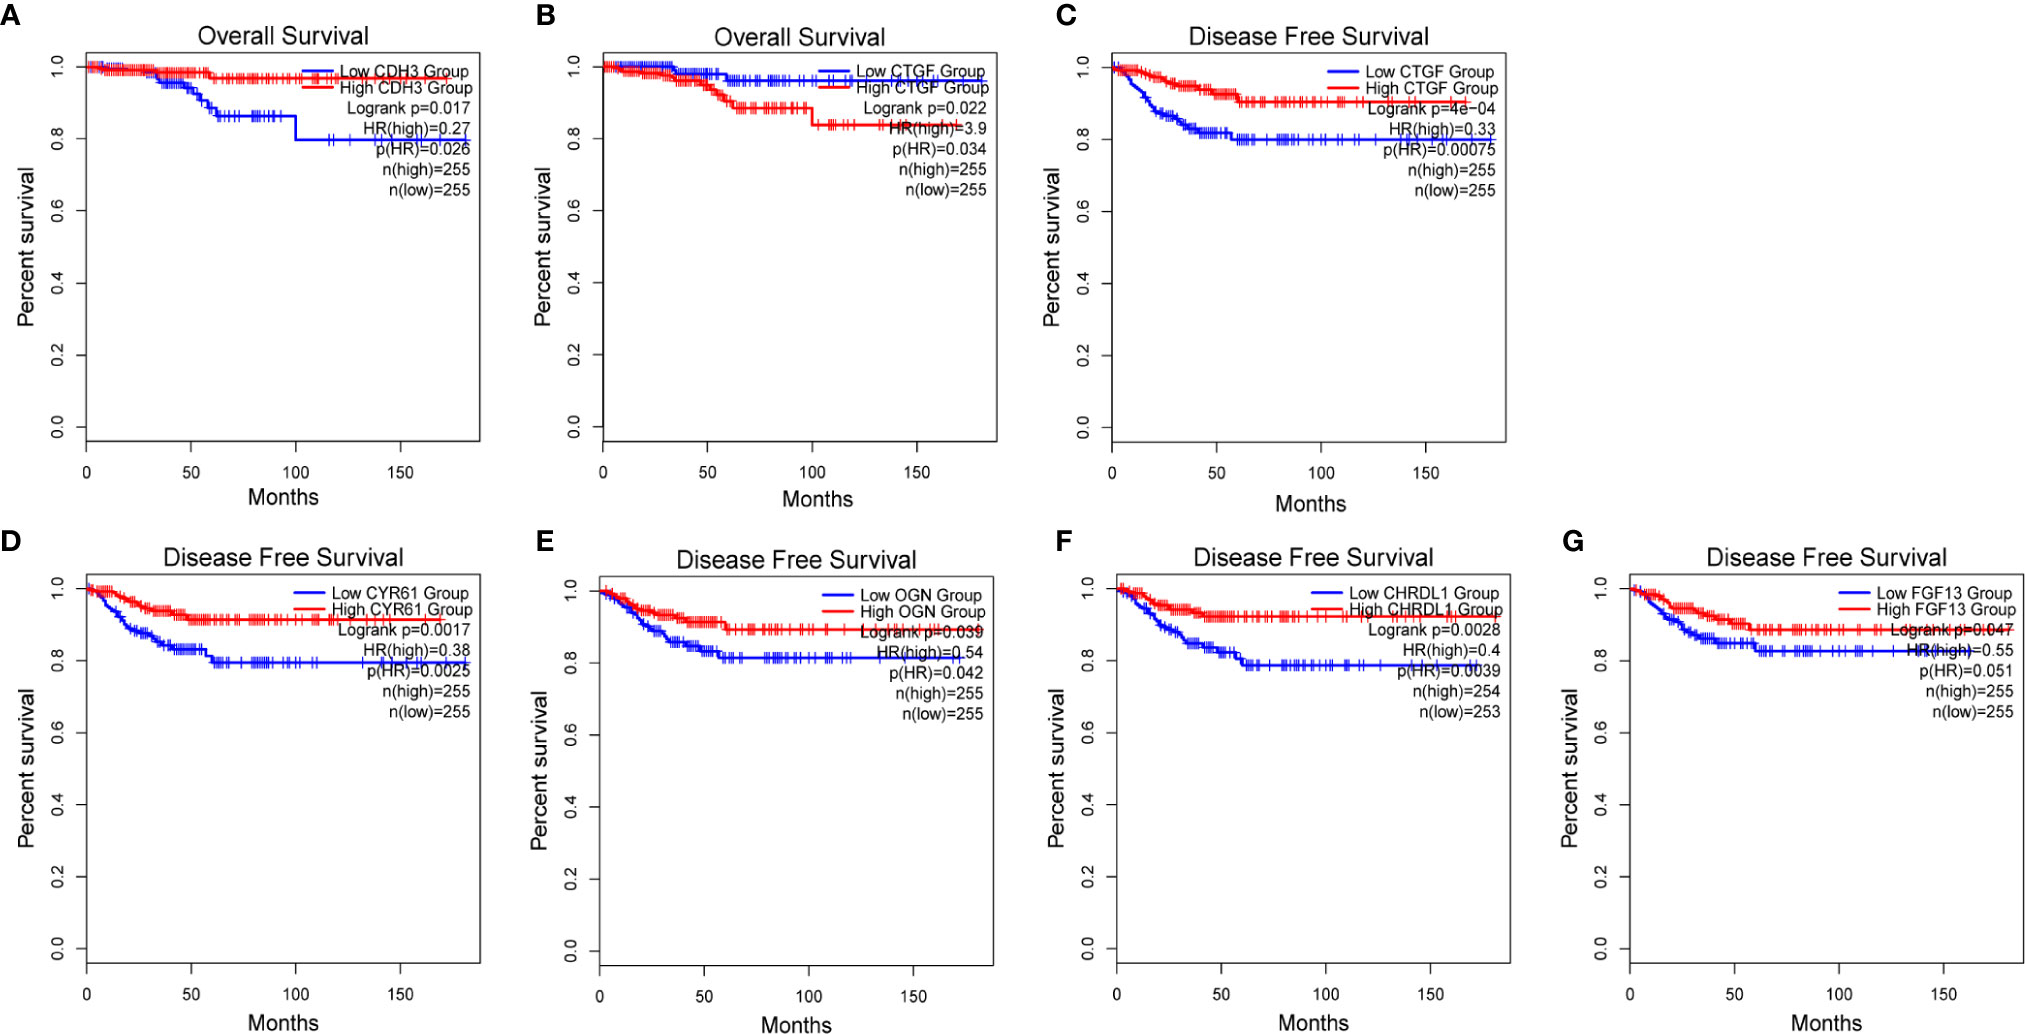
Figure 8 Survival analysis of 6 hub genes. (A, B) Kaplan-Meier survival analyses of TCGA PTC patients based on the expression of CDH3 and CTGF. (C–G) Disease-free survival (DFS) of TCGA PTC patients based on CTGF, CYR61, OGN, CHRDL1 and FGF13, respectively.
Validation of the Expression of Six Prognosis-Related Hub Genes
With GEPIA, we detected the transcript levels of six hub genes in 59 peri-tumor tissues and 512 THCA tissues from TCGA database. CDH3 was found to be highly expressed, while CTGF, CYR61, CHRDL1, OGN and FGF13 had significantly lower expression in tumor tissues compared with peri-tumor tissues (Figure 9A). In order to validate the bioinformatics analysis results, 10 paired PTC tumor and peri-tumor samples were collected and performed for transcriptome sequencing studies. Comparing with peri-tumor controls, the expression of CTGF, CYR61, CHRDL1, OGN and FGF13 were significantly decreased, whereas CDH3 significantly increased in PTC tissues (Figure 9B) which were consistent with the bioinformatics results obtained by TCGA dataset. Additionally, the expression of the six hub genes were analyzed according to various clinicopathological characteristics, which included tumor stage, lymph node metastases, sex, and age by using UALCAN software. CDH3 transcript levels were significantly increased, while the expression of CHRDL1, CTGF, CYR61, FGF13, and OGN were significantly decreased in THCA patients compared with healthy subjects (Figures 10A–F). The expression levels of the six genes were not different when comparing tumor stages, lymph node metastasis, age, and sex (Figures 10A–F). To verify the transcriptome analysis results, immunohistochemistry data of the six genes were obtained from the Human Protein Atlas website. The protein expression levels of CDH3, CHRDL1, CTGF, CYR61, and OGN showed similar patterns of changes as the transcript levels (Figure 11).
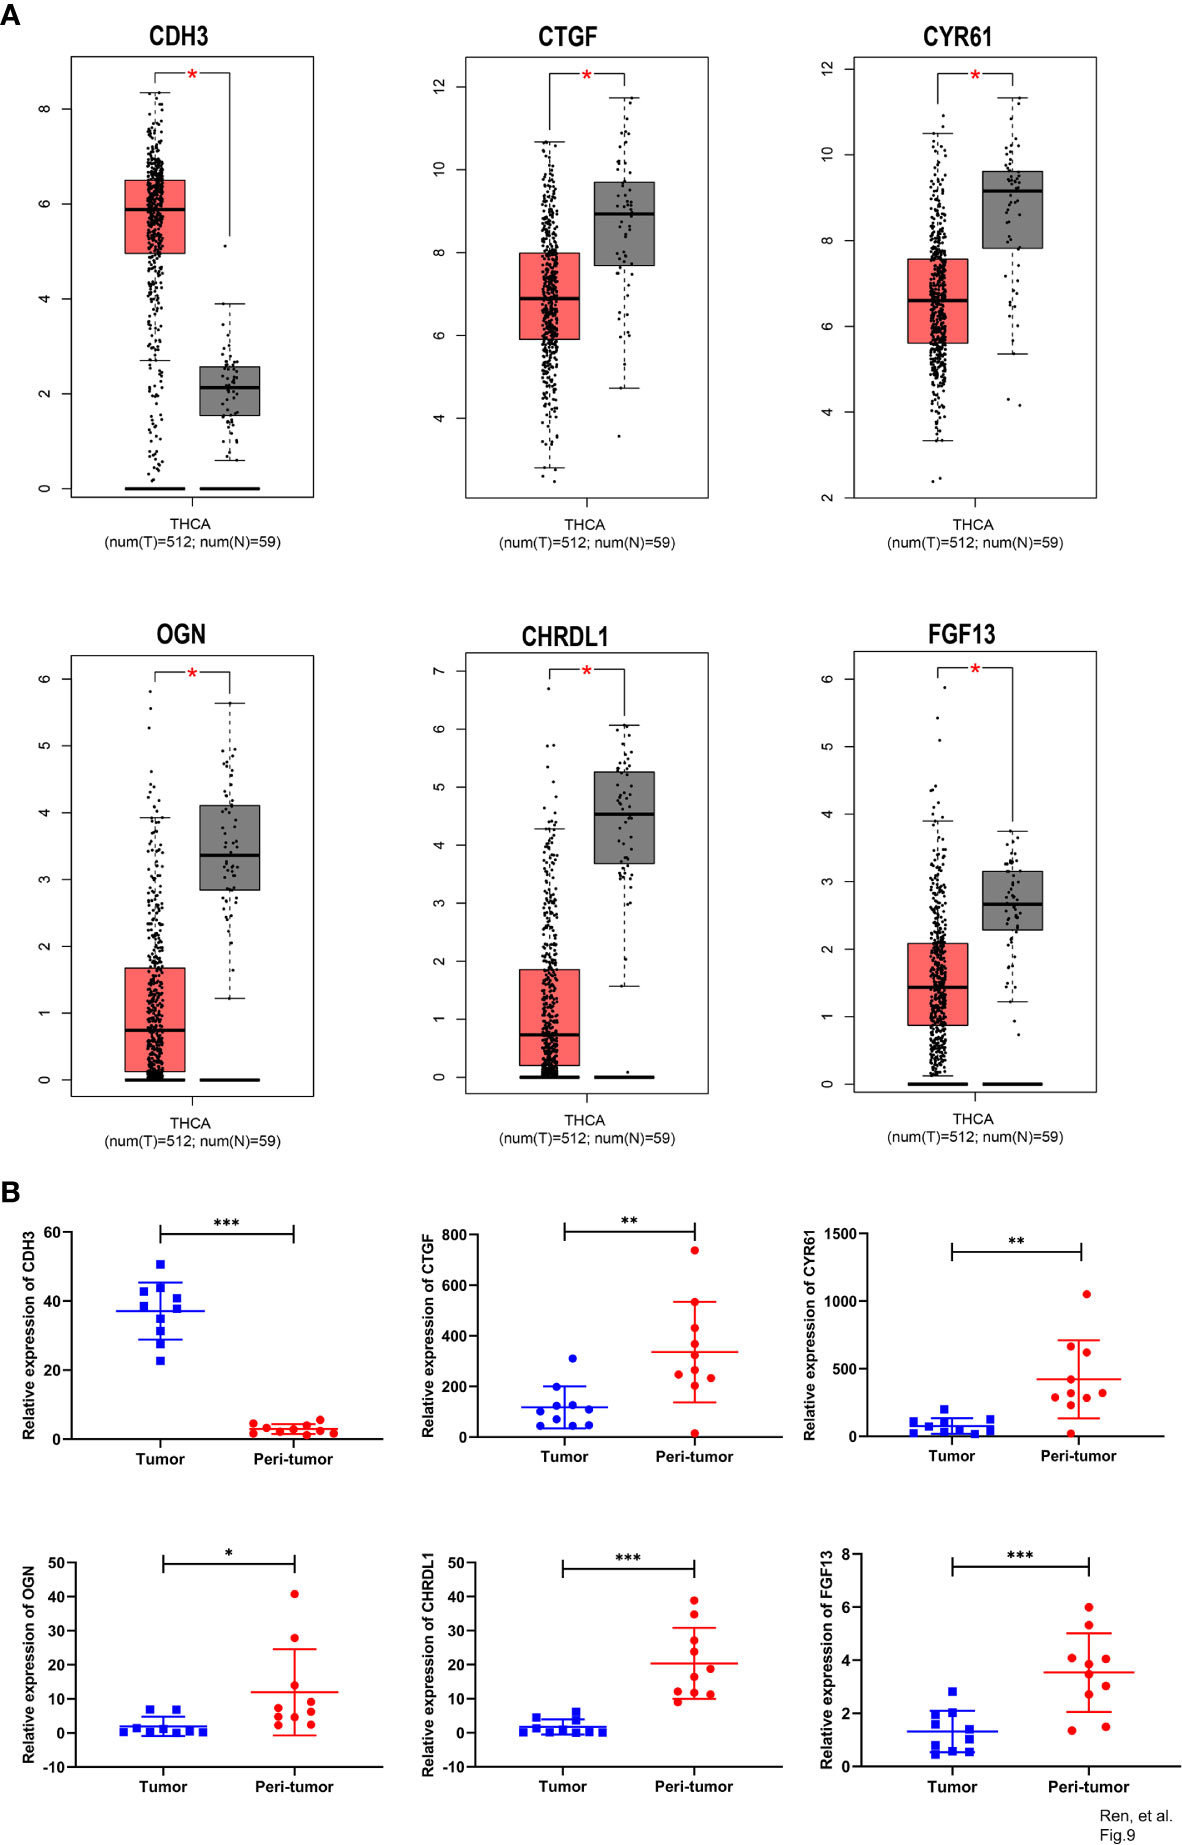
Figure 9 Comparison of expression of six hub genes between tumor and peri-tumor. (A) Box plots of CDH3, CTGF, CYR61, OGN, CHRDL1 and FGF13 expression in THCA tumor and peri-tumor tissues. (B) Scatter plots of CDH3, CTGF, CYR61, OGN, CHRDL1 and FGF13 were constructed using transcriptome sequence data of our own patients’ cohort. (*p<0.05; **p<0.01; ***p<0.001).
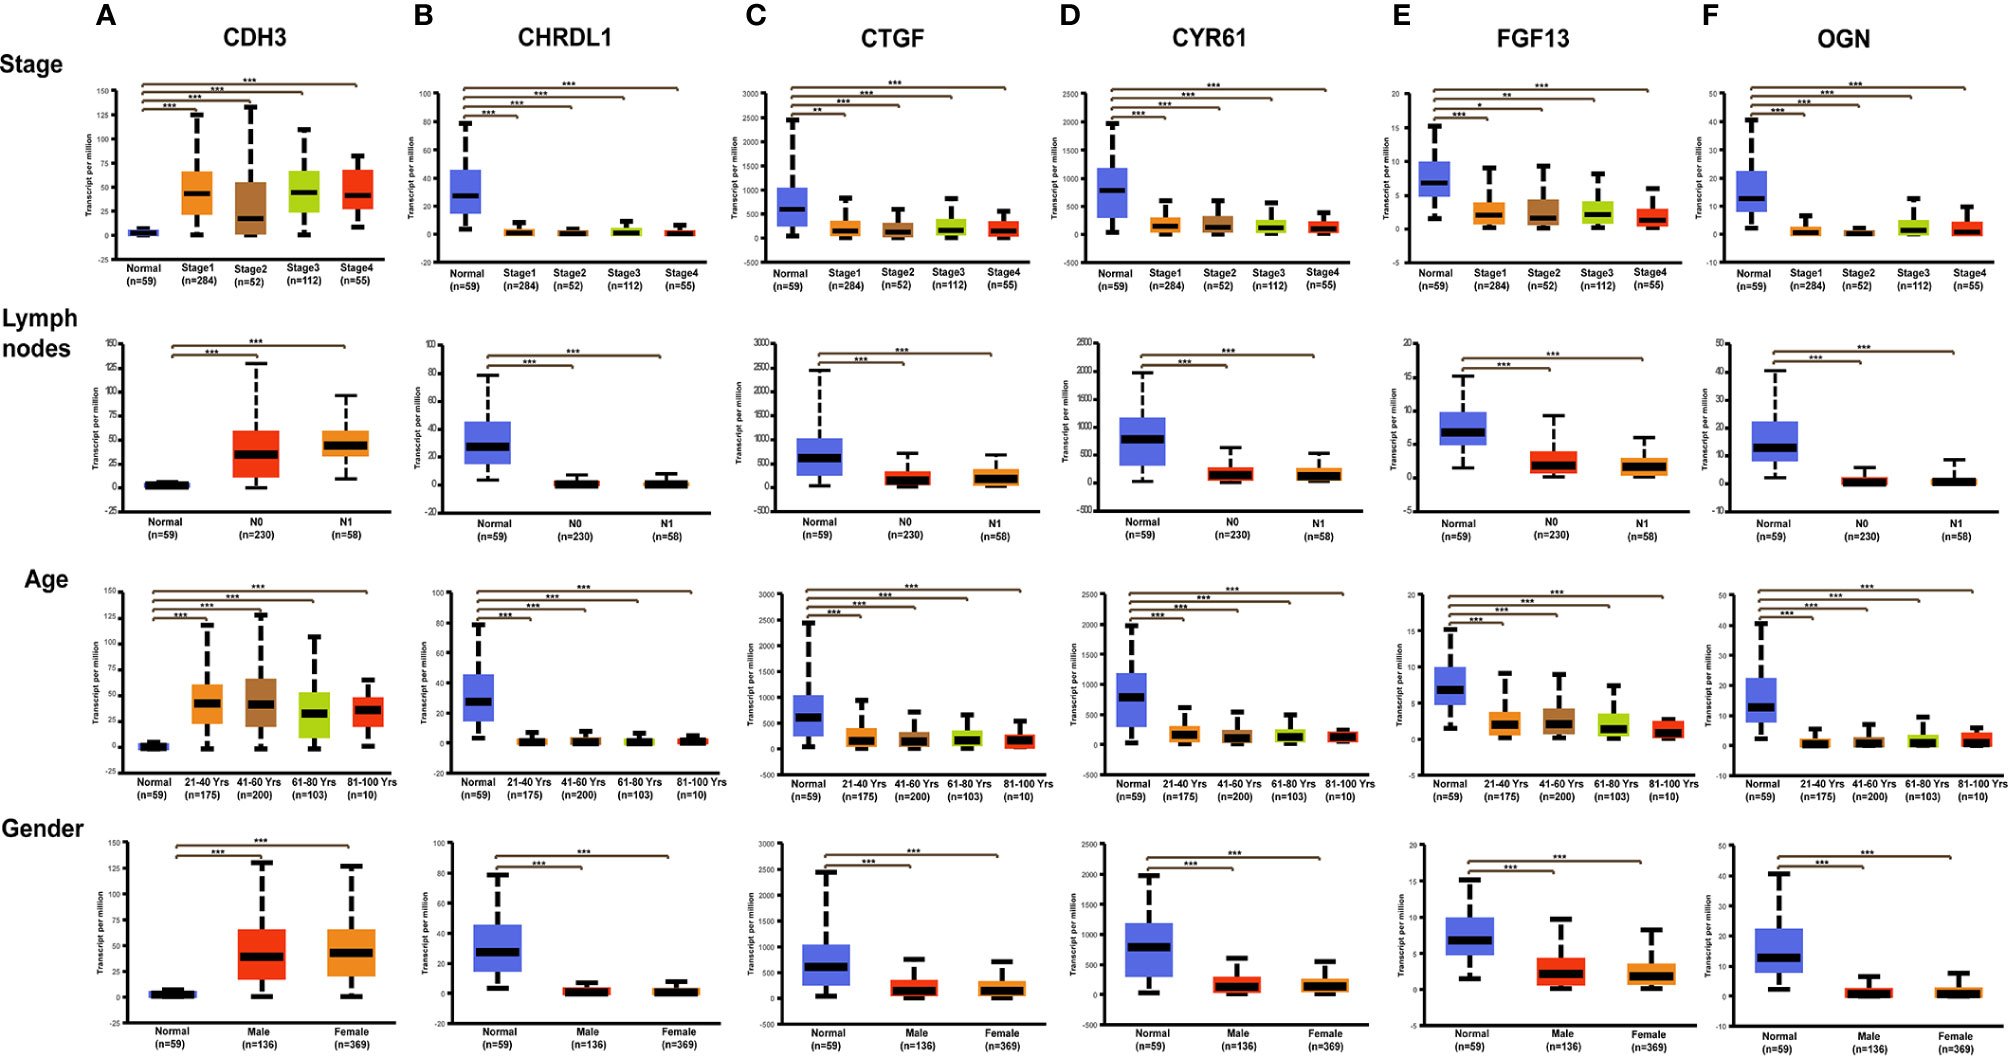
Figure 10 Expression of six hub genes in THCA subgroups stratified by clinical parameters in the UALCAN database. Boxplots showing the relative expression of six hub genes in normal individuals or THCA patients by tumor stage, lymph node metastases, gender, and age, respectively. (A) CDH3, (B) CTGF, (C) CYR61, (D) OGN, (E) FGF13, (F) CHRDL1. The center lines are the medians, and the bottom and top edges of the boxes are the 25th and 75th percentiles, respectively. *p<0.05; **p<0.01; ***p<0.00001.
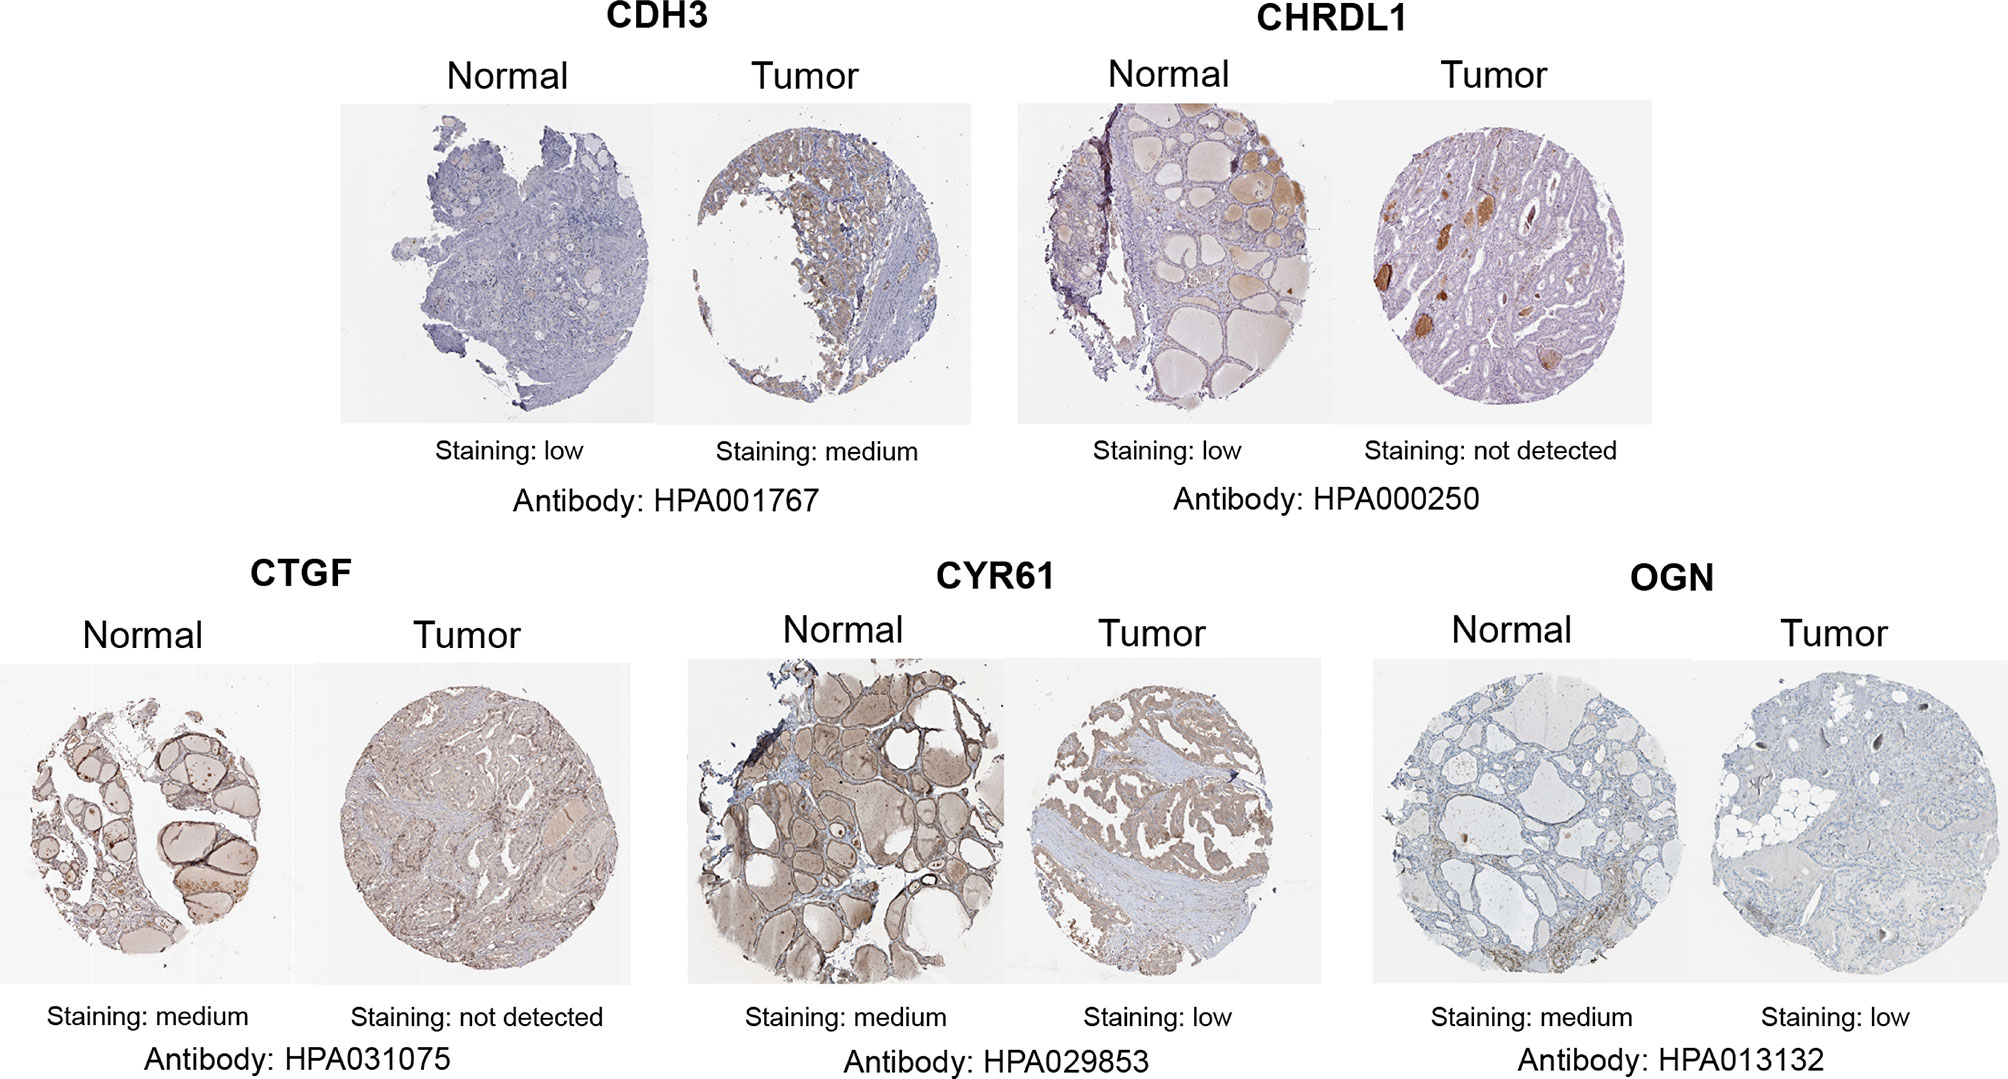
Figure 11 Representative immunohistochemistry staining of screened genes. Protein expression levels of CDH3, CHRDL1, CTGF, CYR61, and OGN in PTC tissue obtained from the Human Protein Atlas.
To validate the classification performance of the six gene signature model using different data platforms, we used TCGA data as an external dataset. We then calculated the risk score for each sample using the Sangerbox website and used the cut-off values of the training set to classify the samples into high and low risk groups. The low risk group had a significantly different prognosis than the high risk group (Figure 12A). An ROC analysis showed 1-, 3-, and 5-year AUCs of 0.81, 0.67, and 0.72 for the six gene signatures, respectively (Figure 12B). The data were presented for TCGA samples focusing on risk score, survival time, survival status, and expression of the six gene signature (Figure 12C). CDH3 was highly expressed in tumor samples, whereas high expression of CTGF, CYR61, OGN, FGF13, and CHRDL1 was associated with better prognosis and appeared to be a protective factor. Furthermore, we performed methylation survival analysis of the six gene signature using the DNMIVD tool. Patients were then classified into either high risk or low risk groups, using the median risk score as the cut-off point. Patients in the high risk group had a significantly shorter median OS than those in the low risk group (p<0.022; Figure 12D). We also calculated the Z-score distribution of the prognostic classifier and patient survival status (Figure 12E). Overall, our data showed that all six genes were significantly associated with THCA and could be used as a signature to sensitively and accurately determine prognosis in tumor patients.
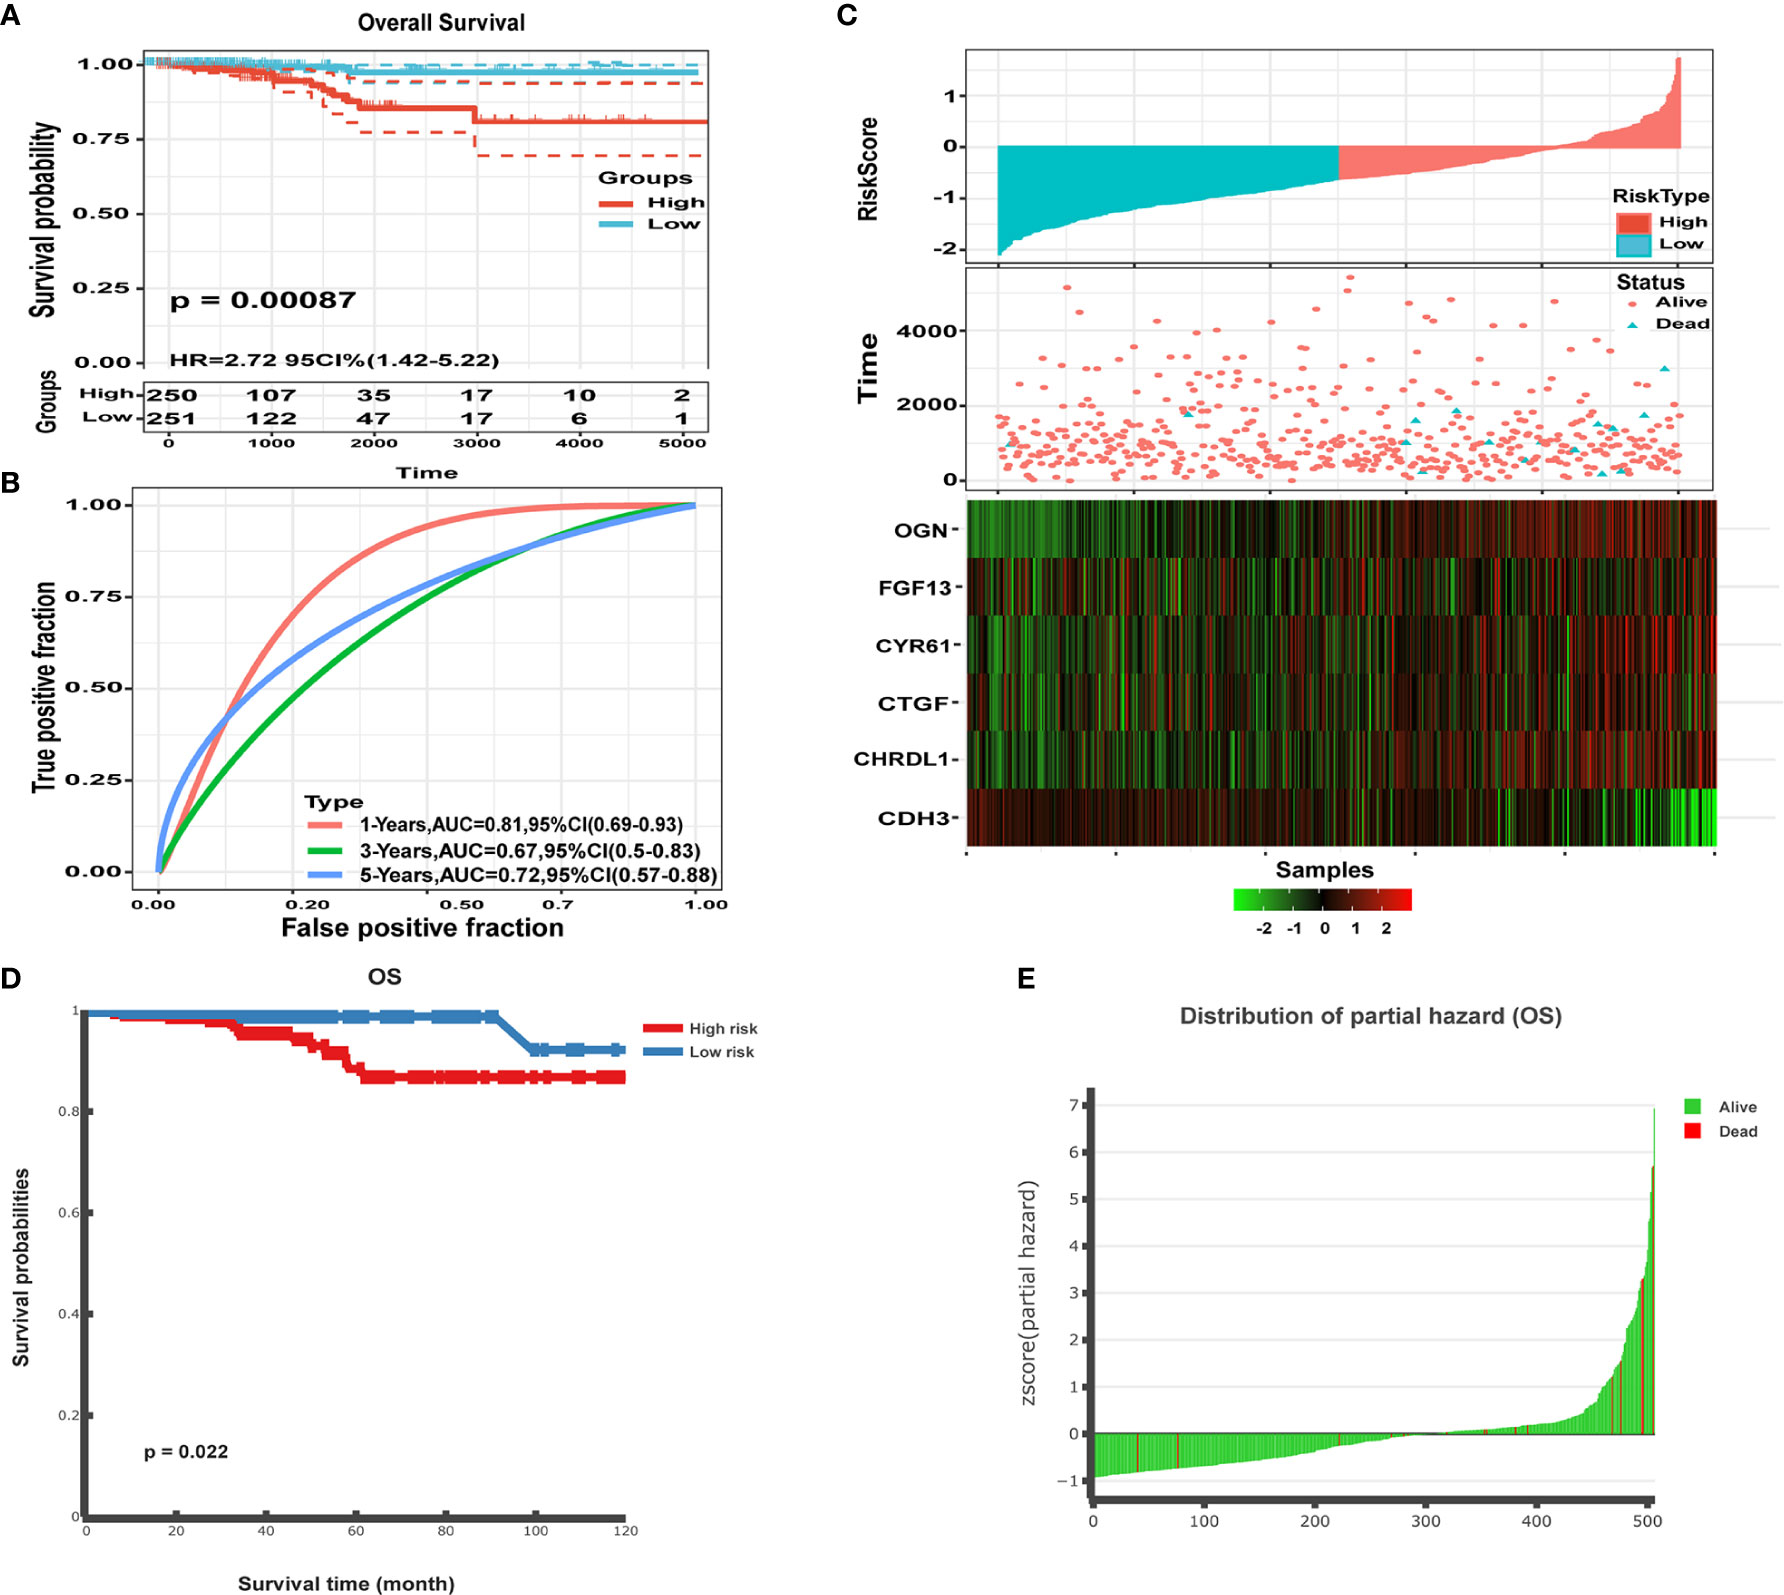
Figure 12 Performance of the six gene signature model. (A) Kaplan-Meier survival curve distribution of the six gene signature from the TCGA-THCA dataset. (B) ROC curve and AUC for the six gene signature classification. (C) TCGA-THCA set focused on risk score, survival time, survival status, and expression of the six gene signature. (D) Kaplan-Meier survival analysis for the patients in the THCA dataset. Patients were divided into low risk and high risk groups using the median cutoff value of the partial hazard. P-values were calculated using the log-rank test. (E) Z-score distribution of the prognostic classifier and patient survival status.
Relationship Between Key Gene Expression and Tumor Purity and Immune Infiltration
The tumor microenvironment (TME) is composed of tumor cells, stromal cells, and infiltrating immune cells. The TIMER database was utilized to analyze the association of specific gene expression levels with THCA immune populations. Interestingly, CDH3 (r=-0.101, p=2.59E-02) and OGN (r=-0.104, p=2.09E-02) was negatively correlated with tumor purity. Moreover, the expression of CDH3, CTGF, OGN, and CHRDL1 was significantly correlated with the infiltration of B cells, CD8+ T cells, CD4+ T cells, macrophages, neutrophils, and DCs. The expression of CYR61 was significantly correlated with the infiltration of CD8+ T cells, CD4+ T cells, and neutrophils. The expression of FGF13 was significantly correlated with the infiltration of B cells, CD4+ T cells, macrophages, neutrophils and DCs (Figure 13A). Interestingly, the copy number variation (CNV) of FGF13 and CHRDL1 were significantly correlated with infiltration levels of B cells and DCs. OGN was associated with B cells and CYR61 was associated with CD4+ T cells. CTGF and CDH3 were both associated with B cells, neutrophils, and DCs, and the CNV of CDH3 was also significantly correlated with infiltration levels of CD8+ T cells, CD4+ T cells, and macrophages (Figure 13B).
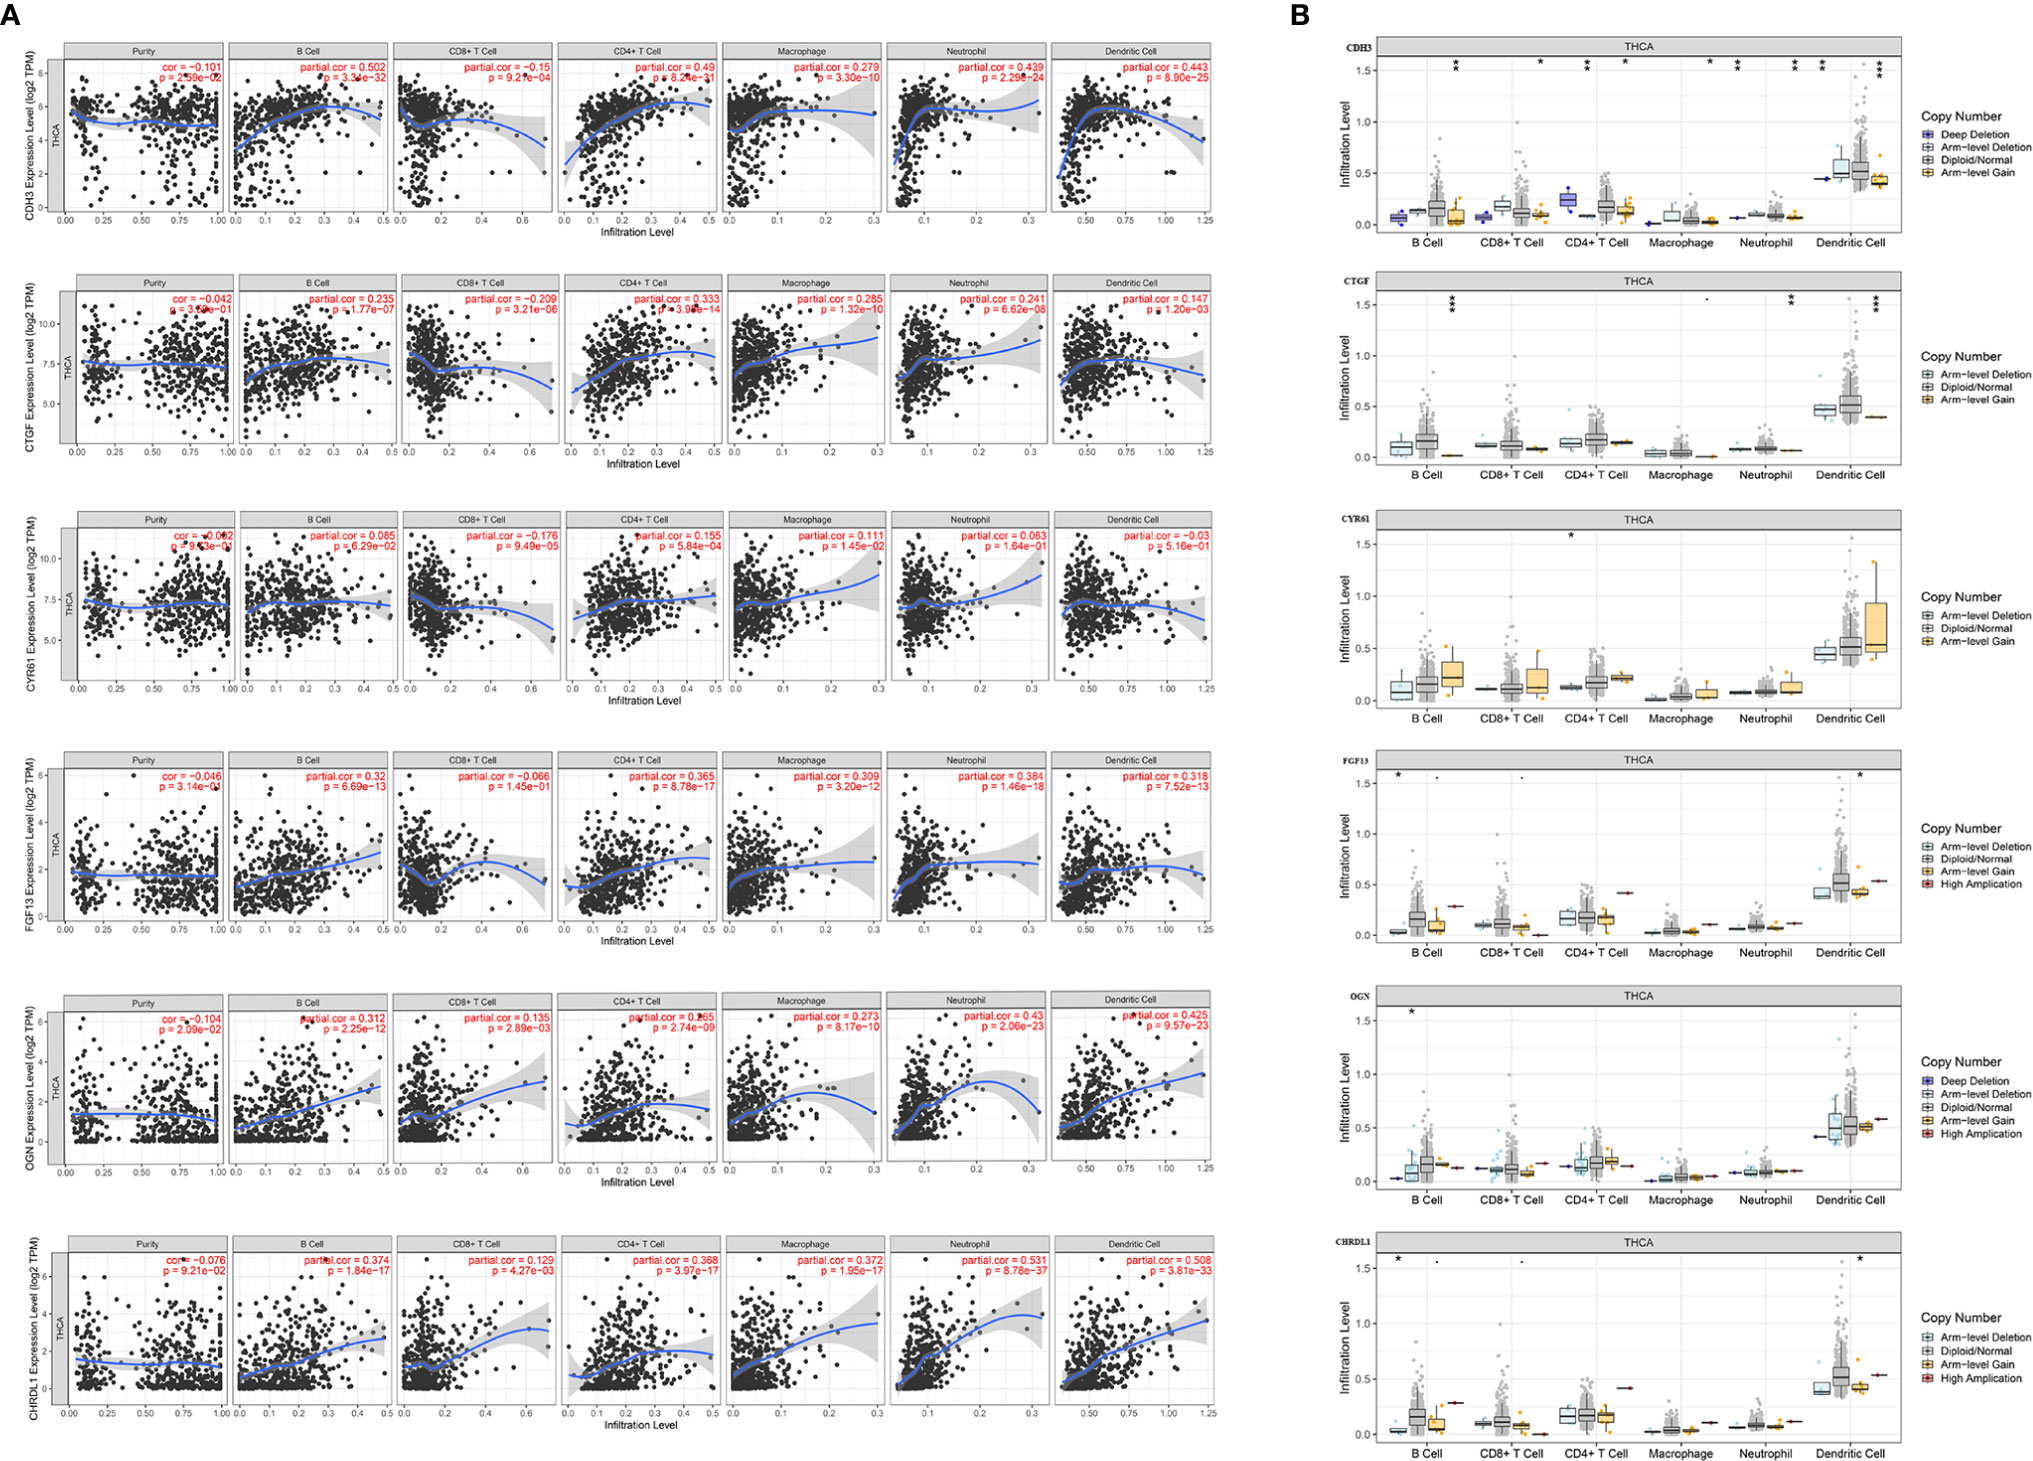
Figure 13 Correlation of expression of the six hub genes with immune infiltration in THCA. (A) Correlation of genes including CDH3, CTGF, CYR61, FGF13, OGN, and CHRDL1 with tumor purity, and infiltration of B cells, CD8+ T cells, CD4+ T cells, macrophages, neutrophils, and dendritic cells. (B) The effect of copy number variation of CDH3, CTGF, CYR61, FGF13, OGN, and CHRDL1 on the distribution of various immune cells. (*p < 0.05; **p < 0.01; ***p < 0.001).
Significant Pathways and Genes Obtained by GSEA
To further explore the potential function of the six key genes in THCA, we performed GSEA on TCGA-THCA RNA-seq data. A total of 100 significant genes were acquired by GSEA with both positive and negative correlations. GSEA was used to conduct a hallmark analysis for CDH3, CTGF, CYR61, FGF13, OGN, and CHRDL1. FGF13, CTGF, CHRDL1, OGN, and CYR61 were all enriched through hypoxia and UV response downregulation pathways. Meanwhile, CTGF, CHRDL1, and OGN were all enriched in UV response upregulation pathways. The five genes (FGF13, CTGF, CHRDL1, OGN, and CYR61) were also enriched through pathways such as TGF-β signaling, adipogenesis, hedgehog signaling, androgen response, apical surface, apoptosis, notch signaling, KRAS signaling upregulated and down regulated genes, and early and late estrogen response. The signaling pathways most involved with CDH3 include the P53 pathway, apical junction, apoptosis, interferon-alpha response, coagulation, and glycolysis (Figures 14A–F). Some of these pathways are associated with tumor development. Remarkably, these pathways were significantly enriched in high risk samples.
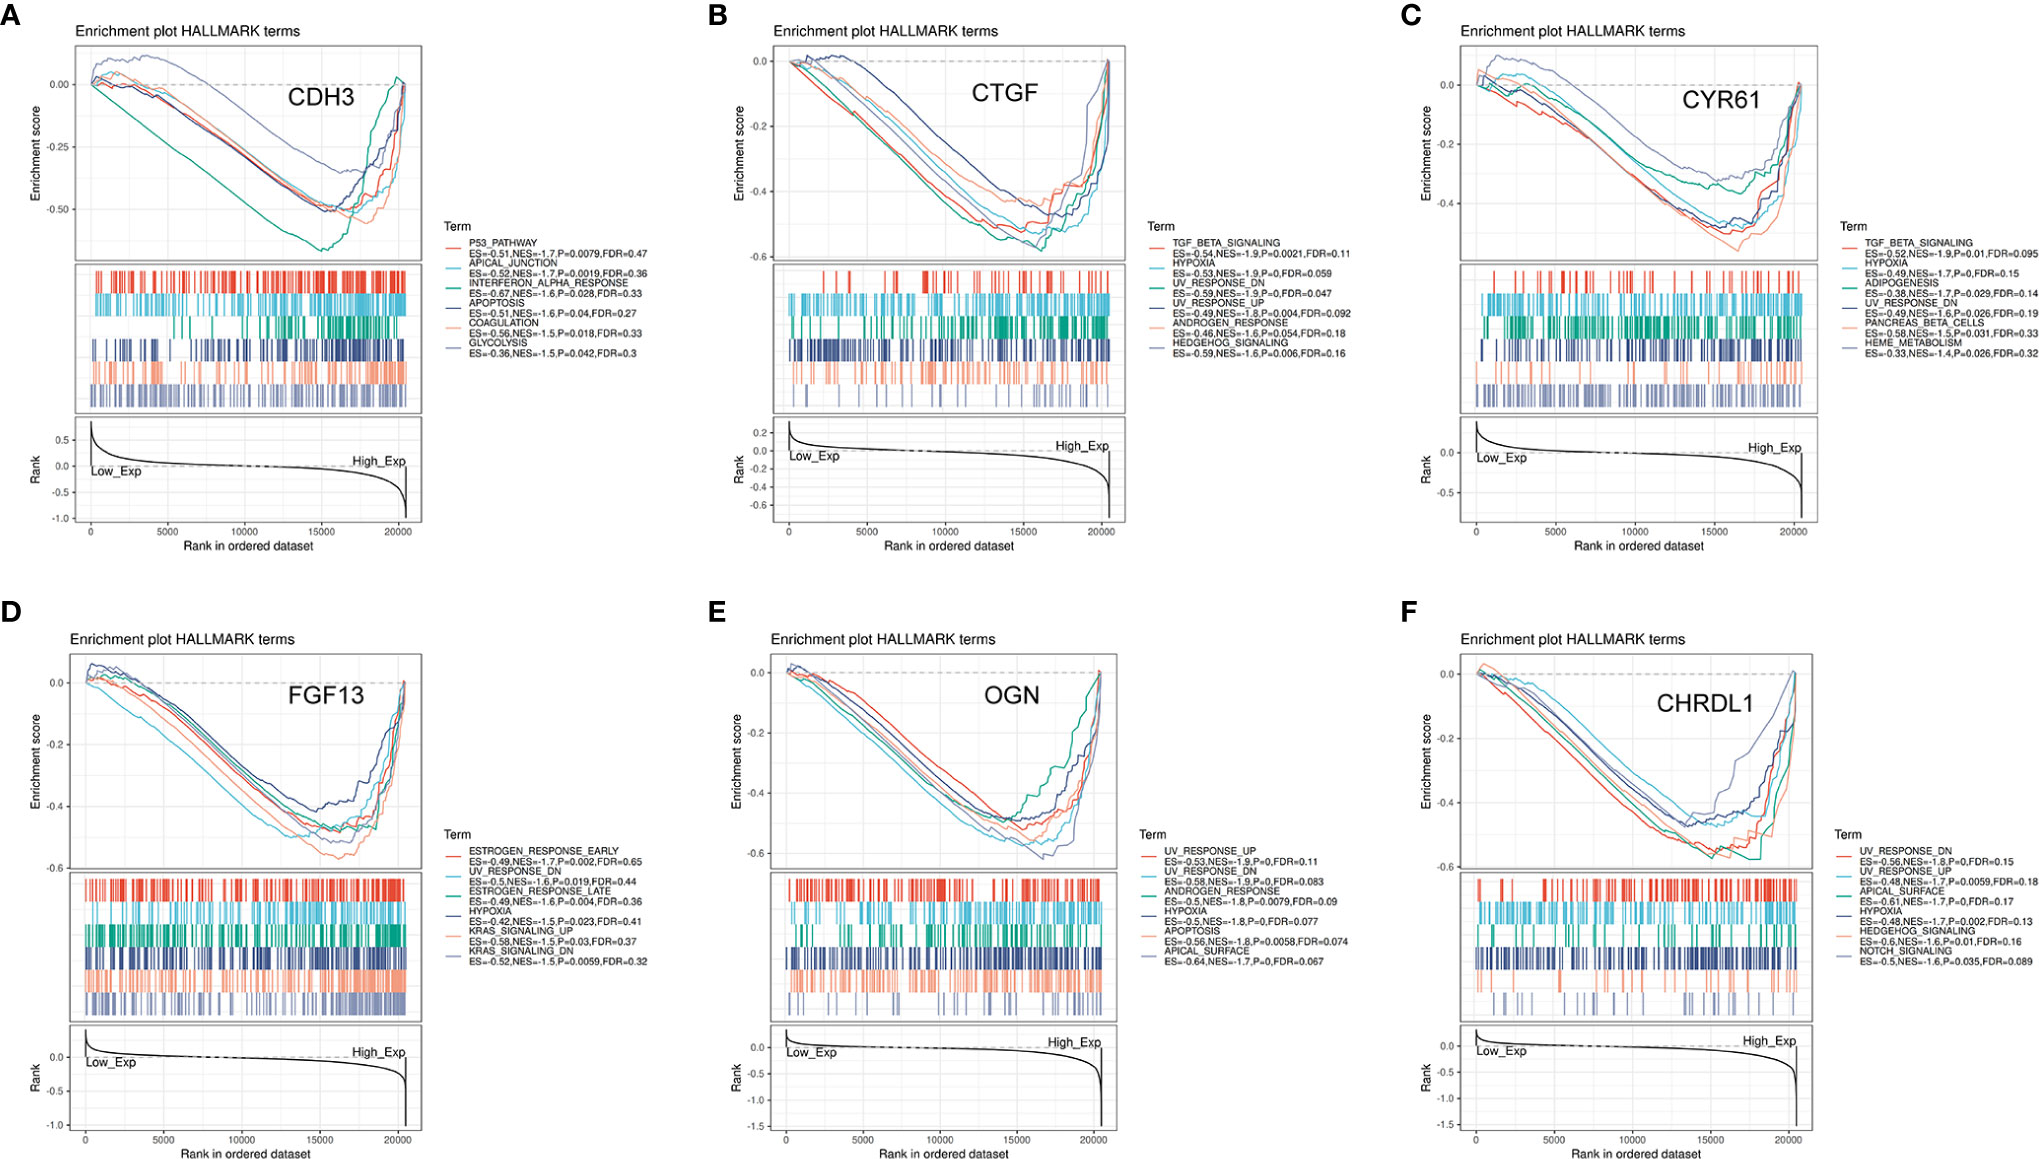
Figure 14 Significant genes associated with six hub genes and hallmark pathways in THCA obtained by GSEA. (A–F) Top six gene sets according to a GSEA enrichment score for CDH3, CTGF, CYR61, FGF13, OGN, and CHRDL1.
Discussion
In recent years, the development of bioinformatics has allowed for the discovery of new biomarkers for PTC with extensive research using microarrays and RNA-seq (10). In our present study, we analyzed four microarray datasets, including 76 PTC and 55 peri-tumor samples. We filtered 332 overlapping DEGs in at least three microarray datasets. GO terminology and KEGG pathway analysis showed that the screened DEGs are implicated in the pathogenesis of PTC. A correlated PPI network containing 242 nodes and 466 edges was constructed and visualized utilizing the STRING database and Cytoscape software. The 13 most significant hub genes were screened using the cytoHubba algorithm with Cytoscape software and were identified using cBioPortal. Gene alterations of the 13 hub genes occurred in 243 (49%) of the queried samples. Almost every hub gene had different kinds of genetic alterations, and we found that mRNA upregulation, amplification, and deep deletions were the three most commonly occurring types of aberrations. Interestingly, we found the cases with hub gene alterations correlated with worse OS (p=1.146e-3) and DFS (p=0.0420). The results showed that the cases in which the hub gene was altered predicted poor OS and DFS. Furthermore, the KEGG results suggest that most of the 13 hub gene-related pathways are mainly involved in tumorigenesis. According to previous studies, Rap1 activation is involved in RET/PTC1-mediated BRAF kinase and p42/p44 mitogen-activated protein kinase stimulation, which may contribute to the transformed phenotype of RET/PTC-expressing thyroid cells and tumorigenesis (26). Complement and coagulation cascades can eliminate pathogens and damaged host cells, and when their activation is uncontrolled or excessively activated tumorigenesis may be enhanced (27, 28). KLF5 promotes the tumorigenesis and metastasis potential of THCA cells through the NF-κB signaling pathway, which enhances proliferation, invasion, and migration of cadmium-induced GPER-positive THCA cells (29, 30). These results shed some light on the role of the hub genes and their related signaling pathways in the occurrence and development of PTC. Similarly, GO enrichment analysis showed that the 13 hub genes were mainly related to tumor development, especially the ATF6 and MAPK pathways. According to published literature, ATF6 mediates apoptosis by inducing unfolded proteins to reduce myeloid leukemia sequence 1 (Mcl-1) proteins (31). In our analysis, hub genes were enriched in negatively regulating ATF6-mediated unfolded proteins and increased Mcl-1 expression, which could lead to malignant cell growth and apoptotic escape (32). The MAPK signaling cascade regulates important cellular processes, including cell proliferation, gene expression, cell survival, death, and cell motility in mammals. It has been shown that TNFR1 and CD95 can induce anti-apoptotic signals through the MAPK proliferative cascade response, which can contribute to malignant tumor cell metastasis and resistance to anticancer drugs (33, 34). Until now, THCA has been regarded as a largely MAPK-driven cancer, with approximately 70% of THCAs being associated with activation of the mutations in this pathway (35). Therefore, it is reasonable to assume that the 13 screened hub genes might play a pivotal role in the development of PTC.
To further evaluate the reliability of hub genes and identify genes that can be used as PTC biomarkers, we conducted a gene expression and Kaplan-Meier analysis of 13 hub genes. Six genes came out of this analysis: CDH3, CTGF, CYR61, FGF13, CHRDL1, and OGN. P-cadherin/CDH3 belongs to the family of classical calcium adhesion proteins, which are cell adhesion molecules involved in cellular localization and tissue integrity, and has been implicated in many types of cancers, such as hepatocellular carcinoma (36), pancreatic cancer (37), and breast cancer (38). However, the role of P-cadherin in THCA remains unclear. CTGF is a stromal cell multifunctional protein that regulates cell migration, proliferation, and differentiation, as well as several neural-related processes like stimulation of nerve function, glial bridging, and natural spinal cord regeneration (39). CTGF has been widely reported as an independent prognostic marker for colorectal cancer metastasis (40). However, our knowledge of the role of CTGF in PTC development are little. CYR61 is a stromal cellular protein located in the extracellular matrix and is associated with wound healing, angiogenesis, and osteoblast differentiation. CYR61 is highly expressed in peri-tumor thyroid tissues, so it is necessary to further explore the relationship between CYR61 expression and the molecular mechanisms of tumorigenesis. On the other hand, the prognostic roles of FGF13, CHRDL1, and OGN in PTC are still uncertain. The transcription levels of CTGF, CYR61, FGF13, CHRDL1, and OGN were significantly higher in health controls than in THCA patients in the subgroup analyses involving disease stage, lymph node metastasis, gender, and age. Decreased gene expression was associated with poorer survival, suggesting that these five hub genes were tumor suppressor genes. Whereas CDH3 was significantly upregulated in THCA tissues and positively correlated with tumor stage, lymph node metastasis, sex, and age which indicated that CDH3 was an oncogene. We also referred to DNMIVD to explore the relationship between methylation status and survival curves of the designated hub genes in THCA. We found that the median OS of patients in the high risk group was significantly shorter than that of patients in the low risk group, which may suggest that methylation of the six hub genes is associated with poor prognosis in PTC.
Gene signatures are currently being used in clinical practice, and gene expression profiling to screen for new cancer prognostic markers is now a promising high-throughput molecular identification method. In this study, we validated the classification performance of the six gene signature model by TCGA platform data due to the fact that the survival time were not available in the GEO database. The ROC curves showed that our six gene signature had a high AUC, implying that all six genes can be used as biomarkers to sensitively and accurately predict prognosis.
To further explore the biological functions of the six hub genes, we performed a tumor immune infiltration analysis with TIMER and GSEA for each hub gene. Our results revealed that expression of each hub gene correlated with most infiltrating immune cells including B cells, CD4+ T cells, CD8+ T cells, neutrophils, macrophages, and dendritic cells (DCs) in THCA tissue specimens. Also, CDH3 and OGN expression were positively correlated with tumor purity. Moreover, GSEA results indicated that the six hub genes mainly enriched in hypoxia, the TGF-β signaling pathway, UV response pathways, and notch signaling. Hypoxia is one of the features of solid tumors that directly contributes to the malignant properties of cancer, including tumor invasion, progression, and metastasis (41, 42). Hypoxia also is a distinctive feature of the TME. The TME included non-tumor cells that existed in and around the tumor, and had a significant impact on the genomic analysis of tumor samples (43). Hypoxic signals increase resistance to T cell-mediated killing by enhancing CTLA-4 expression on CD8+ T cells, as well as recruiting Tregs, myeloid-derived suppressor cells, and tumor associated macrophages (TAMs) into the TME (44). Therefore, exploration of hypoxia and TME associated biomarkers may be potentially valuable for the detection and treatment of cancer. In addition, TGF-β pathway can influence tumor progression through regulating immune cells in the TME. One of the most notable functions of TGF-β is the induction of M2 macrophage polarization. TGF-β-rich TMEs may promote tumor immune evasion by suppressing the inflammatory function of macrophages, DCs maturation and neutrophils differentiation (45–47). On the other hand, the TGF-β signaling pathway is critical in promoting CD4+ T cells differentiated into Tregs which enhance tolerance to tumor antigens and promote immune evasion (45, 48). Deep understanding of TGF-β signal pathway in TME would throw lights on the interaction of immune cells and tumor progression. Similarly, notch signaling and UV response pathways also involved in tumor progression through affecting the immune cells in the TME (49, 50).
In the present study, we screened six hub genes that are associated with immune infiltration and are enriched in the above GSEA pathway. The six gene signature could predict the prognosis of THCA patients. Additional work is needed to further explore the interaction between our screened hub genes and immune cell infiltration in the TME.
Conclusion
Taken above, our study identified a six genes signature by using multiple cohort datasets and comprehensive bioinformatics analyses. The six genes were enriched in immune-related pathways which closely related to tumorigenesis and prognosis of PTC. However, more samples from different databases and more experimental studies still be needed to validate our observations.
Data Availability Statement
Publicly available datasets were analyzed in this study. These data can be found here: GEO (http://www.ncbi.nlm.nih.gov/geo/) and TCGA (https://portal.gdc.cancer.gov/).
Ethics Statement
The studies involving human participants were reviewed and approved by the Medical Ethics Committee of Tianjin Medical University General Hospital, and informed consent of all participants was obtained.
Author Contributions
HR and NZ designed the study and performed data analysis. HR and XL revised the images. HR and FL performed the literature search and data collection. NZ and XH revised the manuscript. All authors contributed to the article and approved the submitted version.
Funding
This work was supported by the National Natural Science Foundation of China (Grant No. 81672641).
Conflict of Interest
The authors declare that the research was conducted in the absence of any commercial or financial relationships that could be construed as a potential conflict of interest.
Supplementary Material
The Supplementary Material for this article can be found online at: https://www.frontiersin.org/articles/10.3389/fonc.2021.624421/full#supplementary-material
Supplementary Figure 1 | Survival analysis of the remaining hub genes. (A–K) Overall Survival (OS) analysis of the 11 hub genes: CCL21, FGF13, CHI3L1, LPAR1, OGN, PROM1, SERPINA1, WFS1, CHRDL1, CYR61, and TIMP1. p < 0.05 was regarded as statistically significant. (L–S) Disease-Free Survival (DFS) analysis of eight hub genes: CCL21, CDH3, CHI3L1, TIMP1, LPAR1, PROM1, SERPINA1, and WFS1. p < 0.05 was regarded as statistically significant.
Abbreviations
GEO, Gene Expression Omnibus ; PTC, Papillary thyroid cancer ; DTC, differentiated thyroid cancer; DEGs, differentially expressed genes; THCA, Thyroid Cancer; GO, Gene Ontology; KEGG, Kyoto Encyclopedia of Genes and Genomes; BP, biological processes; CC, cellular components; MF, molecular functions; PPI, protein-protein interaction; TCGA, The Cancer Genome Atlas; TNM, Tumor Node Metastasis; OS, overall survival; DFS, disease-free survival; GSEA, Gene Set Enrichment Analysis; HPA, Human Protein Atlas; TME, the tumor microenvironment; TAMs, tumor associated macrophages.
References
1. Siegel RL, Miller KD, Jemal A. Cancer statistics, 2019. CA Cancer J Clin (2019) 69(1):7–34. doi: 10.3322/caac.21551
2. Bray F, Ferlay J, Soerjomataram I, Siegel RL, Torre LA, Jemal A. Global cancer statistics 2018: GLOBOCAN estimates of incidence and mortality worldwide for 36 cancers in 185 countries. CA Cancer J Clin (2018) 68(6):394–424. doi: 10.3322/caac.21492
3. Chen W, Zheng R, Baade PD, Zhang S, Zeng H, Bray F, et al. Cancer statistics in China, 2015. CA Cancer J Clin (2016) 66(2):115–32. doi: 10.3322/caac.21338
4. Agrawal N, Akbani R, Aksoy BA, Ally A, Arachchi H, Asa SL. Integrated genomic characterization of papillary thyroid carcinoma. Cell (2014) 159(3):676–90. doi: 10.1016/j.cell.2014.09.050
5. Grant CS. Papillary thyroid cancer: strategies for optimal individualized surgical management. Clin Ther (2014) 36(7):1117–26. doi: 10.1016/j.clinthera.2014.03.016
6. Xing M, Alzahrani AS, Carson KA, Viola D, Elisei R, Bendlova B, et al. Association between BRAF V600E mutation and mortality in patients with papillary thyroid cancer. JAMA (2013) 309(14):1493–501. doi: 10.1001/jama.2013.3190
7. Krishnamoorthy GP, Davidson NR, Leach SD, Zhao Z, Lowe SW, Lee G, et al. and Mutations Cooperate to Drive Thyroid Tumorigenesis through ATF4 and c-MYC. Cancer Discov (2019) 9(2):264–81. doi: 10.1158/2159-8290.CD-18-0606
8. Prescott JD, Zeiger MA. The RET oncogene in papillary thyroid carcinoma. Cancer (2015) 121(13):2137–46. doi: 10.1002/cncr.29044
9. Greco A, Miranda C, Pierotti MA. Rearrangements of NTRK1 gene in papillary thyroid carcinoma. Mol Cell Endocrinol (2010) 321(1):44–9. doi: 10.1016/j.mce.2009.10.009
10. Wan Y, Zhang X, Leng H, Yin W, Zeng W, Zhang C. Identifying hub genes of papillary thyroid carcinoma in the TCGA and GEO database using bioinformatics analysis. PeerJ (2020) 8:e9120. doi: 10.7717/peerj.9120
11. Yu J, Mai W, Cui Y, Kong L. Key genes and pathways predicted in papillary thyroid carcinoma based on bioinformatics analysis. J Endocrinol Invest (2016) 39(11):1285–93. doi: 10.1007/s40618-016-0491-z
12. Huang Y, Tao Y, Li X, Chang S, Jiang B, Li F, et al. Bioinformatics analysis of key genes and latent pathway interactions based on the anaplastic thyroid carcinoma gene expression profile. Oncol Lett (2017) 13(1):167–76. doi: 10.3892/ol.2016.5447
13. Gautier L, Cope L, Bolstad BM, Irizarry RA. affy–analysis of Affymetrix GeneChip data at the probe level. Bioinformatics (2004) 20(3):307–15. doi: 10.1093/bioinformatics/btg405
14. Heber S, Sick B. Quality assessment of Affymetrix GeneChip data. OMICS (2006) 10(3):358–68. doi: 10.1089/omi.2006.10.358
15. Ritchie ME, Phipson B, Wu D, Hu Y, Law CW, Shi W, et al. limma powers differential expression analyses for RNA-sequencing and microarray studies. Nucleic Acids Res (2015) 43(7):e47. doi: 10.1093/nar/gkv007
16. Huang da W, Sherman BT, Lempicki RA. Systematic and integrative analysis of large gene lists using DAVID bioinformatics resources. Nat Protoc (2009) 4(1):44–57. doi: 10.1038/nprot.2008.211
17. Warde-Farley D, Donaldson SL, Comes O, Zuberi K, Badrawi R, Chao P, et al. The GeneMANIA prediction server: biological network integration for gene prioritization and predicting gene function. Nucleic Acids Res (2010) 38(Web Server issue):W214–W20. doi: 10.1093/nar/gkq537
18. Franceschini A, Szklarczyk D, Frankild S, Kuhn M, Simonovic M, Roth A, et al. STRING v9.1: protein-protein interaction networks, with increased coverage and integration. Nucleic Acids Res (2013) 41(Database issue):D808–15. doi: 10.1093/nar/gks1094
19. Shannon P, Markiel A, Ozier O, Baliga NS, Wang JT, Ramage D, et al. Cytoscape: a software environment for integrated models of biomolecular interaction networks. Genome Res (2003) 13(11):2498–504. doi: 10.1101/gr.1239303
20. Chin C-H, Chen S-H, Wu H-H, Ho C-W, Ko M-T, Lin C-Y. cytoHubba: identifying hub objects and sub-networks from complex interactome. BMC Syst Biol (2014) 8 Suppl 4:S11. doi: 10.1186/1752-0509-8-S4-S11
21. Gao J, Aksoy BA, Dogrusoz U, Dresdner G, Gross B, Sumer SO, et al. Integrative analysis of complex cancer genomics and clinical profiles using the cBioPortal. Sci Signal (2013) 6(269):pl1. doi: 10.1126/scisignal.2004088
22. Tang Z, Li C, Kang B, Gao G, Li C, Zhang Z. GEPIA: a web server for cancer and normal gene expression profiling and interactive analyses. Nucleic Acids Res (2017) 45(W1):98–102. doi: 10.1093/nar/gkx247
23. Chandrashekar DS, Bashel B, Balasubramanya SAH, Creighton CJ, Ponce-Rodriguez I, Chakravarthi BVSK, et al. UALCAN: A Portal for Facilitating Tumor Subgroup Gene Expression and Survival Analyses. Neoplasia (2017) 19(8):649–58. doi: 10.1016/j.neo.2017.05.002
24. Asplund A, Edqvist P-HD, Schwenk JM, Pontén F. Antibodies for profiling the human proteome-The Human Protein Atlas as a resource for cancer research. Proteomics (2012) 12(13):2067–77. doi: 10.1002/pmic.201100504
25. Ding W, Chen J, Feng G, Chen G, Wu J, Guo Y, et al. DNMIVD: DNA methylation interactive visualization database. Nucleic Acids Res (2020) 48(D1):D856–D62. doi: 10.1093/nar/gkz830
26. De Falco V, Castellone MD, De Vita G, Cirafici AM, Hershman JM, Guerrero C, et al. RET/papillary thyroid carcinoma oncogenic signaling through the Rap1 small GTPase. Cancer Res (2007) 67(1):381–90. doi: 10.1158/0008-5472.CAN-06-0981
27. Conway EM. Reincarnation of ancient links between coagulation and complement. J Thromb Haemost (2015) 13 Suppl 1:S121–32. doi: 10.1111/jth.12950
28. Zelaya H, Rothmeier AS, Ruf W. Tissue factor at the crossroad of coagulation and cell signaling. J Thromb Haemost (2018) 16(10):1941–52. doi: 10.1111/jth.14246
29. Ma Y, Wang Q, Liu F, Ma X, Wu L, Guo F, et al. KLF5 promotes the tumorigenesis and metastatic potential of thyroid cancer cells through the NF-κB signaling pathway. Oncol Rep (2018) 40(5):2608–18. doi: 10.3892/or.2018.6687
30. Zhu P, Liao L-Y, Zhao T-T, Mo X-M, Chen GG, Liu Z-M. GPER/ERK&AKT/NF-κB pathway is involved in cadmium-induced proliferation, invasion and migration of GPER-positive thyroid cancer cells. Mol Cell Endocrinol (2017) 442:68–80. doi: 10.1016/j.mce.2016.12.007
31. Morishima N, Nakanishi K, Nakano A. Activating transcription factor-6 (ATF6) mediates apoptosis with reduction of myeloid cell leukemia sequence 1 (Mcl-1) protein via induction of WW domain binding protein 1. J Biol Chem (2011) 286(40):35227–35. doi: 10.1074/jbc.M111.233502
32. Perciavalle RM, Opferman JT. Delving deeper: MCL-1’s contributions to normal and cancer biology. Trends Cell Biol (2013) 23(1):22–9. doi: 10.1016/j.tcb.2012.08.011
33. Chang L, Karin M. Mammalian MAP kinase signalling cascades. Nature (2001) 410(6824):37–40. doi: 10.1038/35065000
34. Schütze S, Tchikov V, Schneider-Brachert W. Regulation of TNFR1 and CD95 signalling by receptor compartmentalization. Nat Rev Mol Cell Biol (2008) 9(8):655–62. doi: 10.1038/nrm2430
35. Naoum GE, Morkos M, Kim B, Arafat W. Novel targeted therapies and immunotherapy for advanced thyroid cancers. Mol Cancer (2018) 17(1):51. doi: 10.1186/s12943-018-0786-0
36. Li L, Yu S, Wu Q, Dou N, Li Y, Gao Y. KLF4-Mediated CDH3 Upregulation Suppresses Human Hepatoma Cell Growth and Migration via GSK-3β Signaling. Int J Biol Sci (2019) 15(5):953–61. doi: 10.7150/ijbs.30857
37. Taniuchi K, Nakagawa H, Hosokawa M, Nakamura T, Eguchi H, Ohigashi H, et al. Overexpressed P-cadherin/CDH3 promotes motility of pancreatic cancer cells by interacting with p120ctn and activating rho-family GTPases. Cancer Res (2005) 65(8):3092–9. doi:–10.1158/0008.5472.CAN-04-3646
38. Albergaria A, Ribeiro AS, Pinho S, Milanezi F, Carneiro V, Sousa B, et al. ICI 182,780 induces P-cadherin overexpression in breast cancer cells through chromatin remodelling at the promoter level: a role for C/EBPbeta in CDH3 gene activation. Hum Mol Genet (2010) 19(13):2554–66. doi: 10.1093/hmg/ddq134
39. Mokalled MH, Patra C, Dickson AL, Endo T, Stainier DYR, Poss KD. Injury-induced ctgfa directs glial bridging and spinal cord regeneration in zebrafish. Science (2016) 354(6312):630–4. doi: 10.1126/science.aaf2679
40. Lin B-R, Chang C-C, Che T-F, Chen S-T, Chen RJ-C, Yang C-Y, et al. Connective tissue growth factor inhibits metastasis and acts as an independent prognostic marker in colorectal cancer. Gastroenterology (2005) 128(1):9–23. doi: 10.1053/j.gastro.2004.10.007
41. Harris AL. Hypoxia–a key regulatory factor in tumour growth. Nat Rev Cancer (2002) 2(1):38–47. doi:nbsp;10.1038/nrc704
42. Gilkes DM, Semenza GL, Wirtz D. Hypoxia and the extracellular matrix: drivers of tumour metastasis. Nat Rev Cancer (2014) 14(6):430–9. doi: 10.1038/nrc3726
43. Fridman WH, Pagès F, Sautès-Fridman C, Galon J. The immune contexture in human tumours: impact on clinical outcome. Nat Rev Cancer (2012) 12(4):298–306. doi: 10.1038/nrc3245
44. Palazon A, Goldrath AW, Nizet V, Johnson RS. HIF transcription factors, inflammation, and immunity. Immunity (2014) 41(4):518–28. doi: 10.1016/j.immuni.2014.09.008
45. Batlle E, Massagué J. Transforming Growth Factor-β Signaling in Immunity and Cancer. Immunity (2019) 50(4):924–40. doi: 10.1016/j.immuni.2019.03.024
46. Pickup M, Novitskiy S, Moses HL. The roles of TGFβ in the tumour microenvironment. Nat Rev Cancer (2013) 13(11):788–99. doi: 10.1038/nrc3603
47. Fridlender ZG, Sun J, Kim S, Kapoor V, Cheng G, Ling L, et al. Polarization of tumor-associated neutrophil phenotype by TGF-beta: “N1” versus “N2” TAN. Cancer Cell (2009) 16(3):183–94. doi: 10.1016/j.ccr.2009.06.017
48. Strainic MG, Shevach EM, An F, Lin F, Medof ME. Absence of signaling into CD4+ cells via C3aR and C5aR enables autoinductive TGF-β1 signaling and induction of Foxp3+ regulatory T cells. Nat Immunol (2013) 14(2):162–71. doi: 10.1038/ni.2499
49. Leong KG, Karsan A. Recent insights into the role of Notch signaling in tumorigenesis. Blood (2006) 107(6):2223–33. doi: 10.1182/blood-2005-08-3329
Keywords: papillary thyroid cancer, hub genes, signaling pathways, bioinformatics, tumor infiltrating
Citation: Ren H, Liu X, Li F, He X and Zhao N (2021) Identification of a Six Gene Prognosis Signature for Papillary Thyroid Cancer Using Multi-Omics Methods and Bioinformatics Analysis. Front. Oncol. 11:624421. doi: 10.3389/fonc.2021.624421
Received: 31 October 2020; Accepted: 02 March 2021;
Published: 18 March 2021.
Edited by:
An Wouters, University of Antwerp, BelgiumReviewed by:
Franz Rödel, University Hospital Frankfurt, GermanyWang Heng, Hubei University of Medicine, China
Aijun Zhang, Houston Methodist Research Institute, United States
Copyright © 2021 Ren, Liu, Li, He and Zhao. This is an open-access article distributed under the terms of the Creative Commons Attribution License (CC BY). The use, distribution or reproduction in other forums is permitted, provided the original author(s) and the copyright owner(s) are credited and that the original publication in this journal is cited, in accordance with accepted academic practice. No use, distribution or reproduction is permitted which does not comply with these terms.
*Correspondence: Na Zhao, bmF6aGFvQHRtdS5lZHUuY24=
 He Ren
 Xin Liu