
95% of researchers rate our articles as excellent or good
Learn more about the work of our research integrity team to safeguard the quality of each article we publish.
Find out more
ORIGINAL RESEARCH article
Front. Oncol. , 09 March 2021
Sec. Neuro-Oncology and Neurosurgical Oncology
Volume 11 - 2021 | https://doi.org/10.3389/fonc.2021.622880
This article is part of the Research Topic Impact of Radiotherapy and Radiosurgery on Neuro-Oncology View all 10 articles
 Zhongyang Li1
 Shang Cai2,3Huijun Li4,5Jincheng Gu4,5Ye Tian2,3Jianping Cao1,6Dong Yu1*
 Zaixiang Tang4,5*
Background: Lower-grade glioma (LGG) is a type of central nervous system tumor that includes WHO grade II and grade III gliomas. Despite developments in medical science and technology and the availability of several treatment options, the management of LGG warrants further research. Surgical treatment for LGG treatment poses a challenge owing to its often inaccessible locations in the brain. Although radiation therapy (RT) is the most important approach in this condition and offers more advantages compared to surgery and chemotherapy, it is associated with certain limitations. Responses can vary from individual to individual based on genetic differences. The relationship between non-coding RNA and the response to radiation therapy, especially at the molecular level, is still undefined.
Methods: In this study, using The Cancer Genome Atlas dataset and bioinformatics, the gene co-expression network that is involved in the response to radiation therapy in lower-grade gliomas was determined, and the ceRNA network of radiotherapy response was constructed based on three databases of RNA interaction. Next, survival analysis was performed for hub genes in the co-expression network, and the high-efficiency biomarkers that could predict the prognosis of patients with LGG undergoing radiotherapy was identified.
Results: We found that some modules in the co-expression network were related to the radiotherapy responses in patients with LGG. Based on the genes in those modules and the three databases, we constructed a ceRNA network for the regulation of radiotherapy responses in LGG. We identified the hub genes and found that the long non-coding RNA, DRAIC, is a potential molecular biomarker to predict the prognosis of radiotherapy in LGG.
Gliomas are the most prevalent malignant primary brain tumors accounting for 81% of all malignant brain tumors (1). The World Health Organization (WHO) has classified gliomas into four grades; WHO grade II and III gliomas are not as malignant as WHO grade IV glioblastoma (GBM). Therefore, WHO grade II and grade III gliomas are defined as lower-grade gliomas (LGG) by The Cancer Genome Atlas (TCGA). Lower-grade gliomas include astrocytomas, oligodendrogliomas, and oligoastrocytomas (2).
Standard treatment of LGG includes surgery, chemotherapy, and radiation therapy. Because lower-grade gliomas occur primarily in the functional areas of the brain and tend to grow aggressively with diffuse infiltration, the suitability of surgery is often controversial. Chemotherapy with temozolomide has some limitations (such as hematological toxicity and myelosuppression (3, 4)). Radiation therapy has significant advantages in the treatment of LGG. Almost all patients with LGG receive radiation therapy during their treatment (5).
Although radiotherapy is associated with several advantages in the treatment of LGG, there exists the problem of heterogeneity in the efficacy of radiotherapy. Patients who receive radiation therapy show varying responses; some show better short-term responses and overall survival compared to others (6). Moreover, side effects such as cognitive abnormality and seizure due to the brain damage caused by ionizing radiation have been observed in some patients (7, 8). With progress in precision medicine, the study of biomarkers for use in radiation therapy and the molecular mechanisms regulating the sensitivity of radiation therapy have gradually become the focus of research in radiation oncology in recent times.
Long non-coding RNAs (lncRNA) belong to a class of non-coding RNA with a length of not more than 200 nucleotides and usually lack coding potential. Several studies have confirmed that lncRNA expression is associated with tumor initiation, progression, and treatment (9–13). Some lncRNAs have also been implicated in the regulation of tumor radiosensitivity. For example, lncRNA CYTOR sponges miR-195 to regulate the radiosensitivity of non-small cell lung cancer (NSCLC) (14). And lncRNA GAS5 can interact with miR-21 and enhance radiosensitivity in NSCLC (15) whereas lncRNA ANRIL enhances the radiosensitivity of nasopharyngeal carcinoma via miR-125a (16). Collectively, these studies reveal that lncRNAs can modulate tumor radiosensitivity by functioning as competitive endogenous RNA (ceRNA).
The mechanism of ceRNA is a hypothesis that some RNAs, such as lncRNA, act as a molecular sponge and compete with mRNA for binding to miRNA via the miRNA response element (MRE) (17). Although increasing research on ceRNA reveals its role in the progression of many diseases and the treatment responses (18, 19), few studies pertaining to the radiosensitivity of LGG currently focus on the regulatory function of their non-coding RNAs or the mechanism of ceRNAs. Therefore, additional systematic studies on the mechanisms of the regulation of radiosensitivity in LGG are needed.
In this study, we used weighted correlation network analysis (WGCNA) to screen the most relevant modules in the co-expression network and construct a ceRNA network. WGCNA is a systems biology method used to detect the co-expression of gene modules (20, 21) and genes in the same module having a similar expression mode. This technique has been widely used in biological research. Our study provides clues to determine the mechanism of post-transcriptional regulation in LGG radiosensitivity using transcriptome level data. Through analysis of the expression level of hub genes in the co-expression network, we found a lncRNA as a potential biomarker that can be used to predict the prognosis of patients with LGG undergoing radiotherapy.
Gene expression data and clinical follow-up data from patients with LGG were downloaded from The Cancer Genome Atlas (TCGA). TCGA is the world’s largest oncogene database, providing a large number of gene expression data, mutation data, epigenetic data, clinical data, and survival data of different tumors.
The expression levels in the RNA-seq data are normalized by TCGA. We directly used the data standardized by Fragments Per Kilobase per Million (FPKM) provided by TCGA as the expression level of the gene.
We categorized patients into radiosensitive and radioresistant groups based on the short-term response of their primary tumor to radiotherapy. Patients who showed complete remission after radiotherapy were considered radiosensitive whereas those exhibiting disease progression after radiotherapy were considered resistant to radiotherapy. For survival analysis, our inclusion criteria for patients were follow-up survival time greater than 30 days and those who had received radiation therapy.
The lncRNA and mRNA expression data were extracted from RNA-seq expression data of TCGA-LGG according to the GENCODE (https://www.gencodegenes.org/) annotations database V34.
To validate our findings of the biomarkers related to TCGA-LGG radiosensitivity, we performed overall survival validation using two independent datasets of Chinese Glioma Genome Atlas (CGGA, http://www.cgga.org.cn). The expression of the two CGGA datasets was sequence matched using STAR (22) and transcripts were quantified using RSEM (23). The two CGGA datasets included 325 (24, 25) and 693 patients with glioma (26, 27), respectively.
In both CGGA datasets, patients were screened based on criteria, such as glioma grade WHO II and III, whether or not they received radiation therapy, and survival follow-up longer than 30 days.
The clinical data of patients from TCGA and CGGA are uploaded as supplementary material.
Co-expression network analysis was conducted using the “WGCNA” package in R 4.0 software. Genes with a low amplitude of change and low expression are generally not considered to play a critical biological role in the regulation of organismal function and in improving the computational efficiency of WGCNA. The filter standard of miRNA is a median absolute deviation (MAD) higher than 0.01. MAD is a robust statistic used to describe the dissociation between samples. For lncRNA and mRNA, the top 5000 lncRNA and mRNA with high MAD were selected. Hierarchical clustering analysis was conducted to remove the outliers.
We performed a co-expression network analysis on lncRNA, mRNA, and miRNA expression levels. First, the value of the powers (beta) was estimated using the “pickSoftThreshold” function in the WGCNA package. The R-squared criterion was set to 0.9. Pearson correlation coefficients were calculated using the expression data to generate a correlation matrix, which was converted to a weighted adjacency matrix based on the power. Lastly, a topological overlap matrix (TOM) was generated to describe the connection between genes. Genes with high co-expression were then grouped into same modules based on the TOM. The merge cut-off threshold was set to 0.2, which meant that modules with a similarity higher than 0.8 were merged into one module.
Principal component analysis (PCA) of the modules in the co-expression network of lncRNA, mRNA, and miRNA was performed. The first principal component (Eigengene) represented the gene expression level within the module and was used for Pearson correlation analysis for radiosensitivity. The modules with the strongest correlation and p-value < 0.05 were considered to play a key role in radiosensitivity.
We predicted these genes using three RNA interaction databases, including lncBase (http://carolina.imis.athena-innovation.gr/diana_tools/web/index.php?r=lncbasev2%2Findex-predicted), miRDB (http://mirdb.org/), and mirTarbase (http://mirtarbase.cuhk.edu.cn/php/index.php). The lncBase was used to predict the interaction of lncRNA with miRNA, whereas miRDB and mirTarbase were used to predict the interaction of miRNA with mRNA. The threshold for the miTGscore in the lncBase was set to 0.9. Interaction pairs with an miTGscore above 0.9 were considered reliable and were included in the construction of the ceRNA network. The target mRNAs of miRNAs were predicted using miRDB and mirTarbase, and the sum aggregate of these two databases was considered as the target of miRNA. The R package “ggalluvial” (28) was used for the visualization of the ceRNA network.
Gene ontology (GO) and Kyoto Encyclopedia of Genes and Genomes (KEGG) enrichment analysis of target genes in the ceRNA network were implemented using the R package “clusterprofiler” (29). GO enrichment analysis included three ontologies, namely, biological process (BP), molecular function (MF), and cellular component (CC). The p-value of GO and KEGG enrichment analysis was adjusted using the Benjamini-Hochberg method. The R package “GOplot” (30) was used to visualize the GO enrichment data.
To further screen biomarkers, RNA within the three modules were identified as hub genes. Hub genes are considered to be genes with high connectivity within the module that play a key pivotal role in regulation and are, therefore, more meaningful as biomarkers. Gene significance (GS) and module membership (MM) were calculated for each gene. The selection criteria for hub genes were set to GS > 0.2 and MM > 0.8.
To identify the relationship between the expression level of these hub genes and patient prognosis after radiotherapy, all patients who had received radiotherapy and had valid survival data were selected for survival analysis. Patients were divided into high and low groups based on the expression level of each gene. Kaplan-Meier curves and log-rank test were used for survival analysis to calculate the effect of the expression of each gene on the prognosis of patients with LGG who had received radiotherapy. Survival analysis and visualization were performed using the “survival” (31) and “survminer” R package. The p-value was adjusted using the false discovery rate.
This study included 49 patients with LGG (Table 1), among whom 30 had gliomas that showed complete response after radiotherapy and 19 showed radiographic progressive disease. The RNA-seq expression data of all patients were available, but because the miRNA-seq data of one of the patients in the complete response group was missing, only 48 patients were included for the miRNA co-expression network analysis.
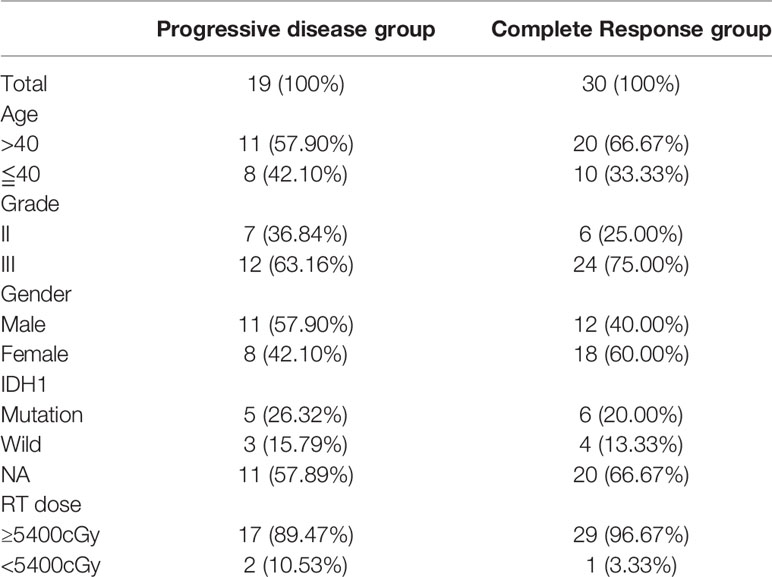
Table 1 Patient characteristics (n=49).
A total of 19,600 mRNA and 14,085 lncRNA were identified using GENCODE annotation database v34. The MAD of genes were calculated. There were a total of 2142 miRNAs in the miRNA expression data, of which 792 had MADs greater than 0.01. The top 5000 lncRNA and mRNA with larger MAD were extracted for further analyses.
The mRNA expression data of one of the patients in the complete response group was identified as an outlier in hierarchical clustering analysis and was removed. Beta value is key to build a high-efficiency co-expression network to find the most relevant module in WGCNA analysis. The power value was calculated using the function “pickSoftThreshold.” The minimum R-squared value was set to 0.9 (Figure 1). The beta value of lncRNA for the construction of the co-expression network was set to 4, whereas it was set to 9 and 8 for mRNA and miRNA, respectively.
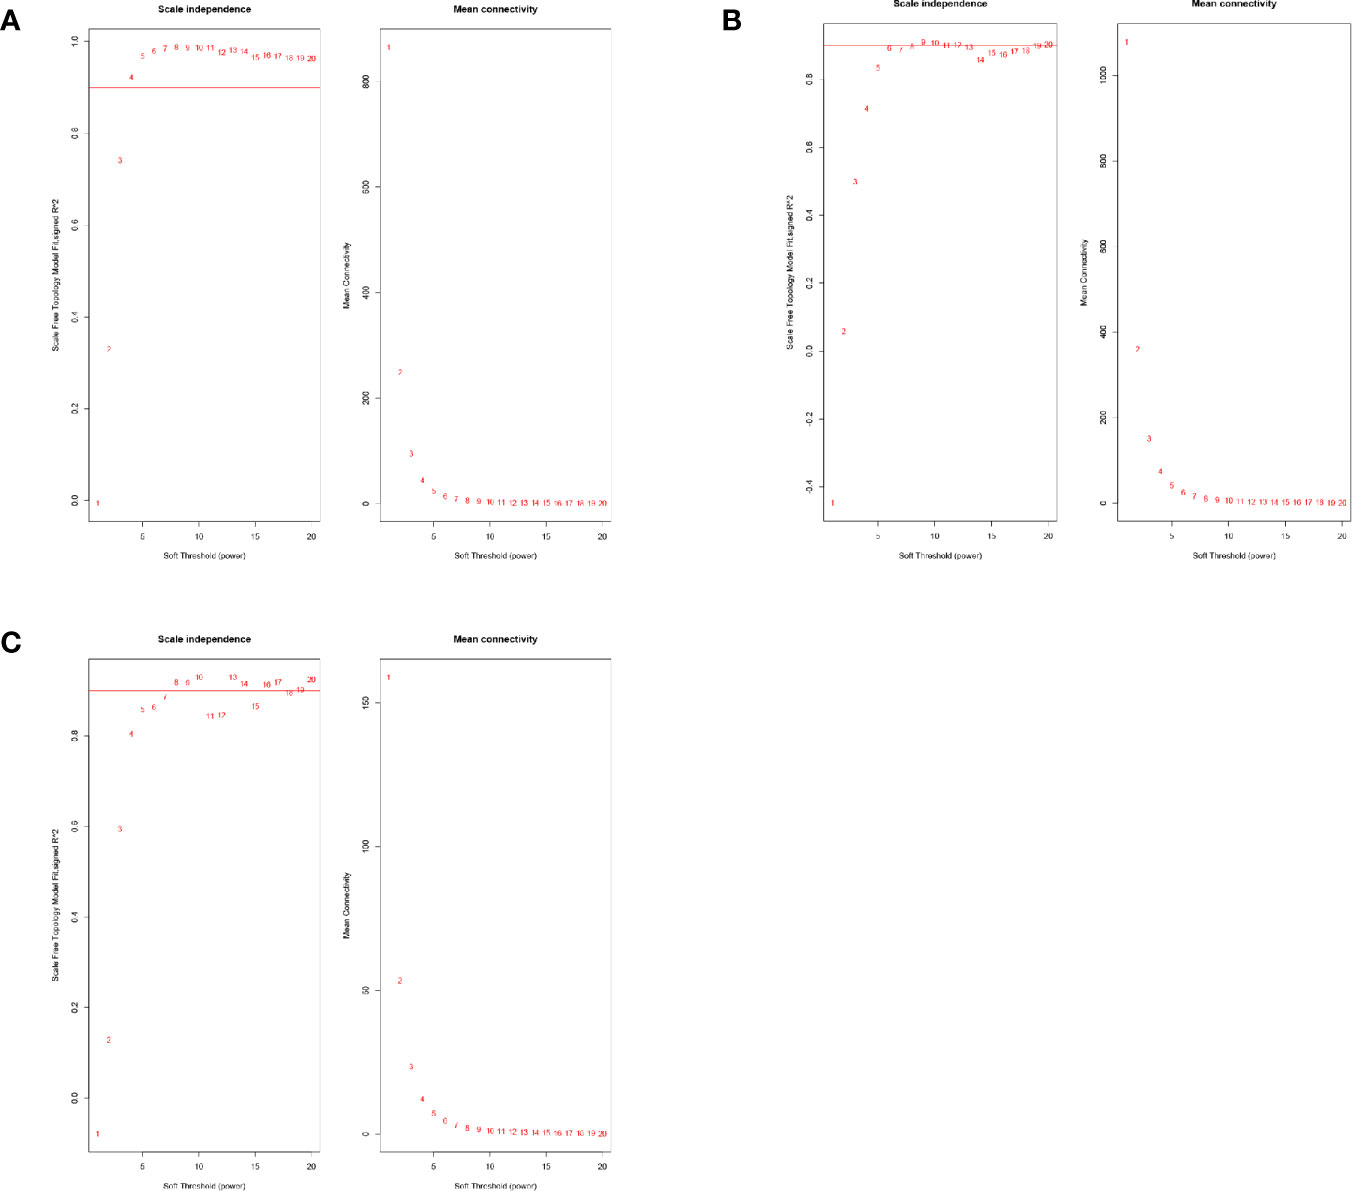
Figure 1 (A) The power value selection of lncRNA co-expression networks. (B) The power value selection of mRNA co-expression networks. (C) The power value selection of miRNA co-expression networks.
A total of 29 modules were identified from the lncRNA co-expression network. Seventeen mRNA modules from the mRNA co-expression network and 8 miRNA modules from miRNA co-expression network are shown in Figure 2. In the module-trait correlation analysis, the lncRNA module, MEred, the mRNA module, MEgreen, and the miRNA module, MEred, are the modules that are most correlated to the radiotherapy response of patients (Figure 3). The genes in these three modules are highly related to radiotherapy response in LGG.
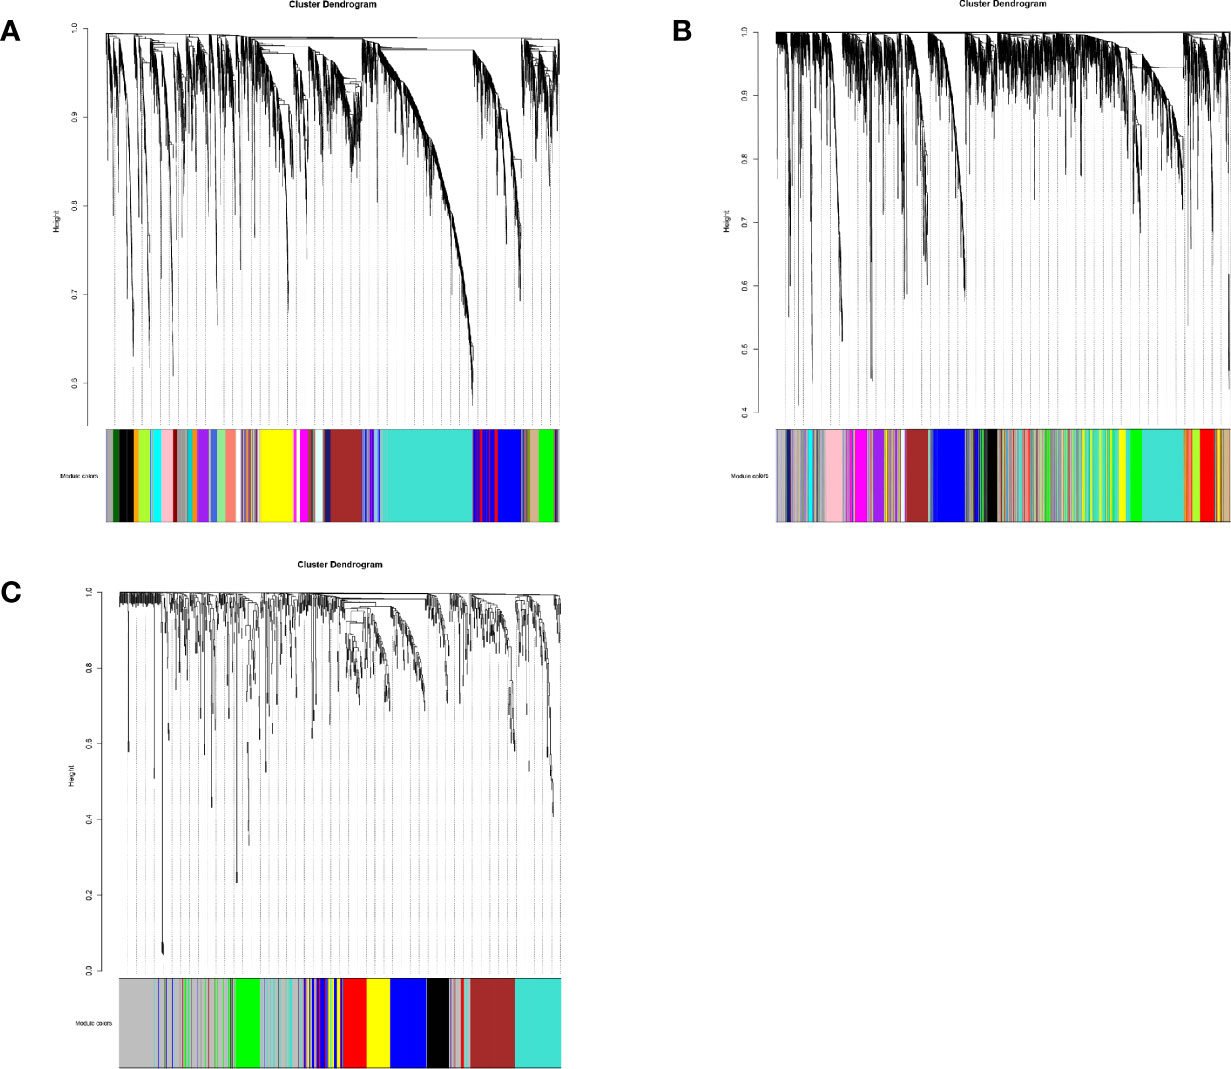
Figure 2 (A) The cluster dendrogram of lncRNA co-expression network. (B) The cluster dendrogram of mRNA co-expression network. (C) The cluster dendrogram of miRNA co-expression network.
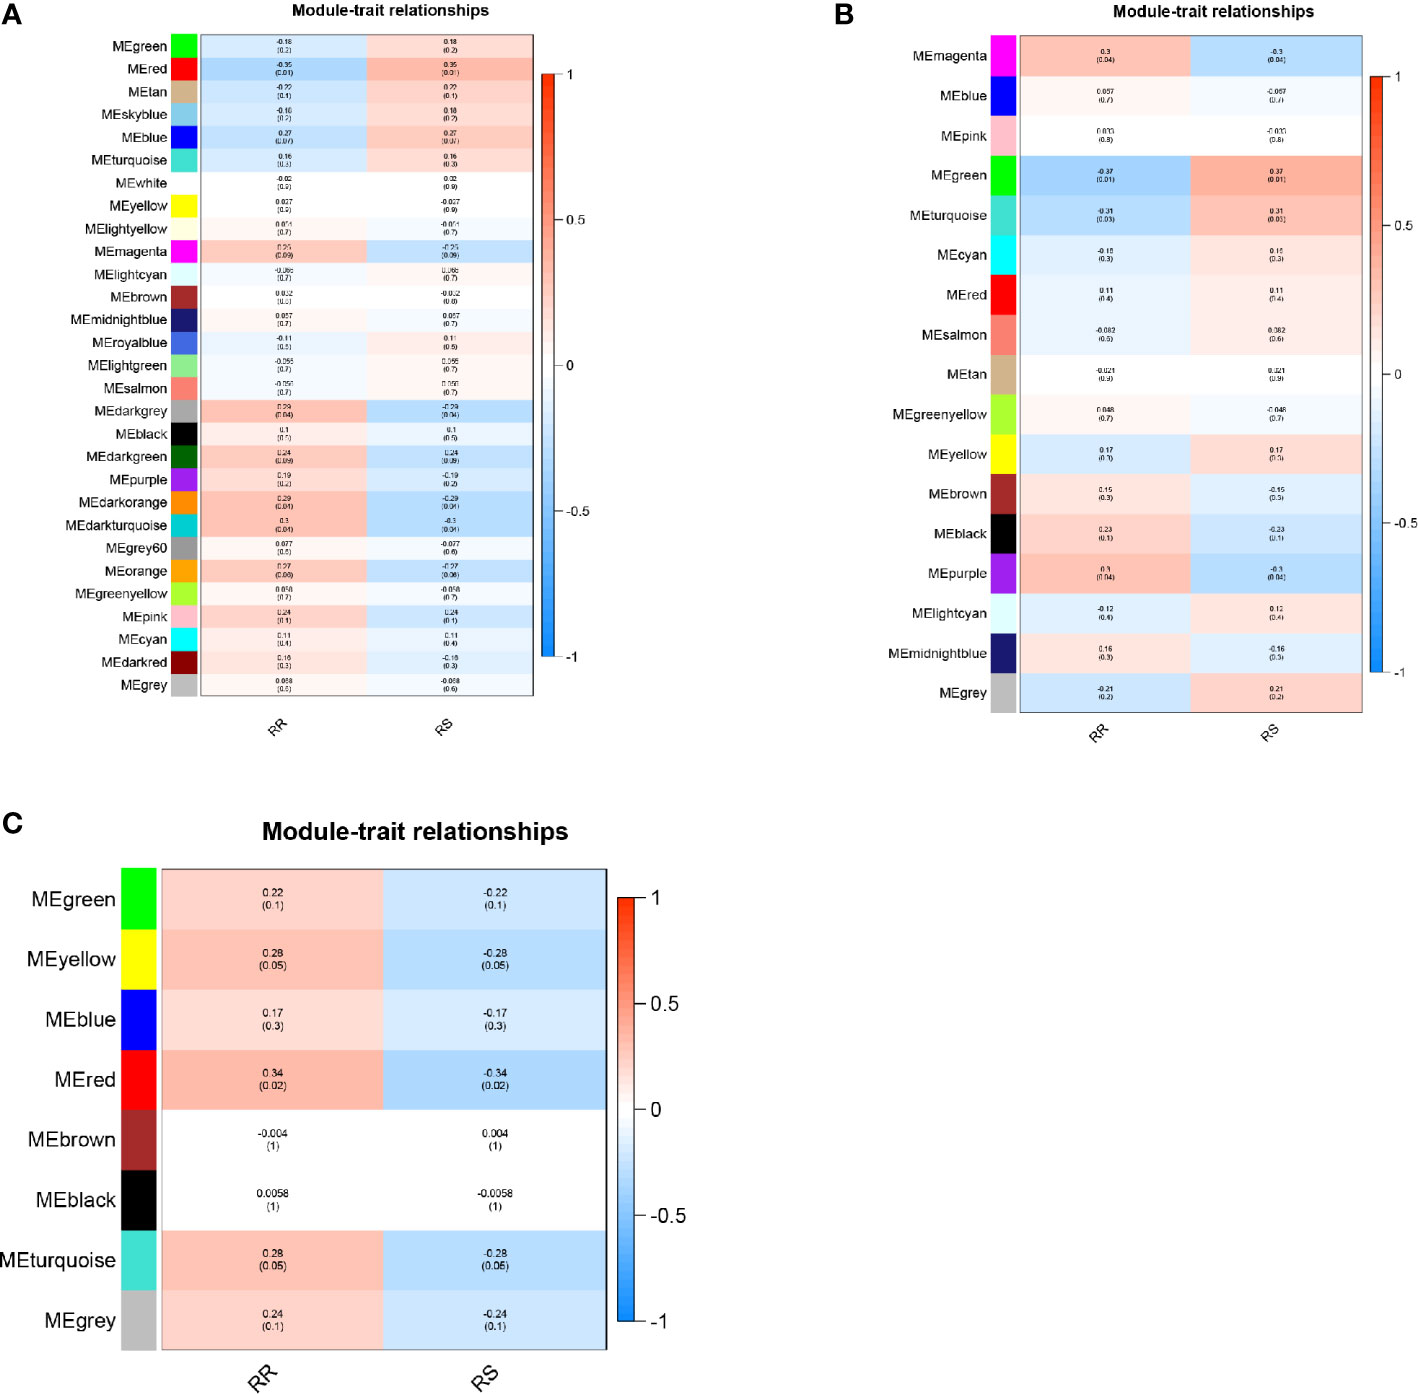
Figure 3 (A) Module‐trait relationship of lncRNA co-expression network. (B) Module‐trait relationship of mRNA co-expression network. (C) Module‐trait relationship of miRNA co-expression network.
Using the Lncbase database, 3142 lncRNA-miRNA interaction pairs were predicted by lncRNA in MEred. Among those, 32 lncRNA-miRNA interaction pairs were related to 21miRNA in module MEgreen. MiRDB and mirTarBase were used to predict the target mRNAs of the 21miRNAs. There were 21 and 53 interaction pairs between miRNA and mRNA found in the miRDB and miRTarBase, respectively. The miRNA-mRNA predictions were combined and 19 lncRNAs, 20 miRNAs, and 61 mRNAs were included in the ceRNA network (Figure 4).

Figure 4 Sankey diagram of ceRNA network.
A total of 56 GO terms were identified from 61 target mRNAs. The target mRNAs in ceRNA were primary associated with GO terms such as translational inhibition, negative regulation of ubiquitin-dependent protein catabolic process, and positive regulation of translation (Figure 5). The most significant KEGG pathway that the target mRNA was associated with was the ribosome pathway (Figure 6).
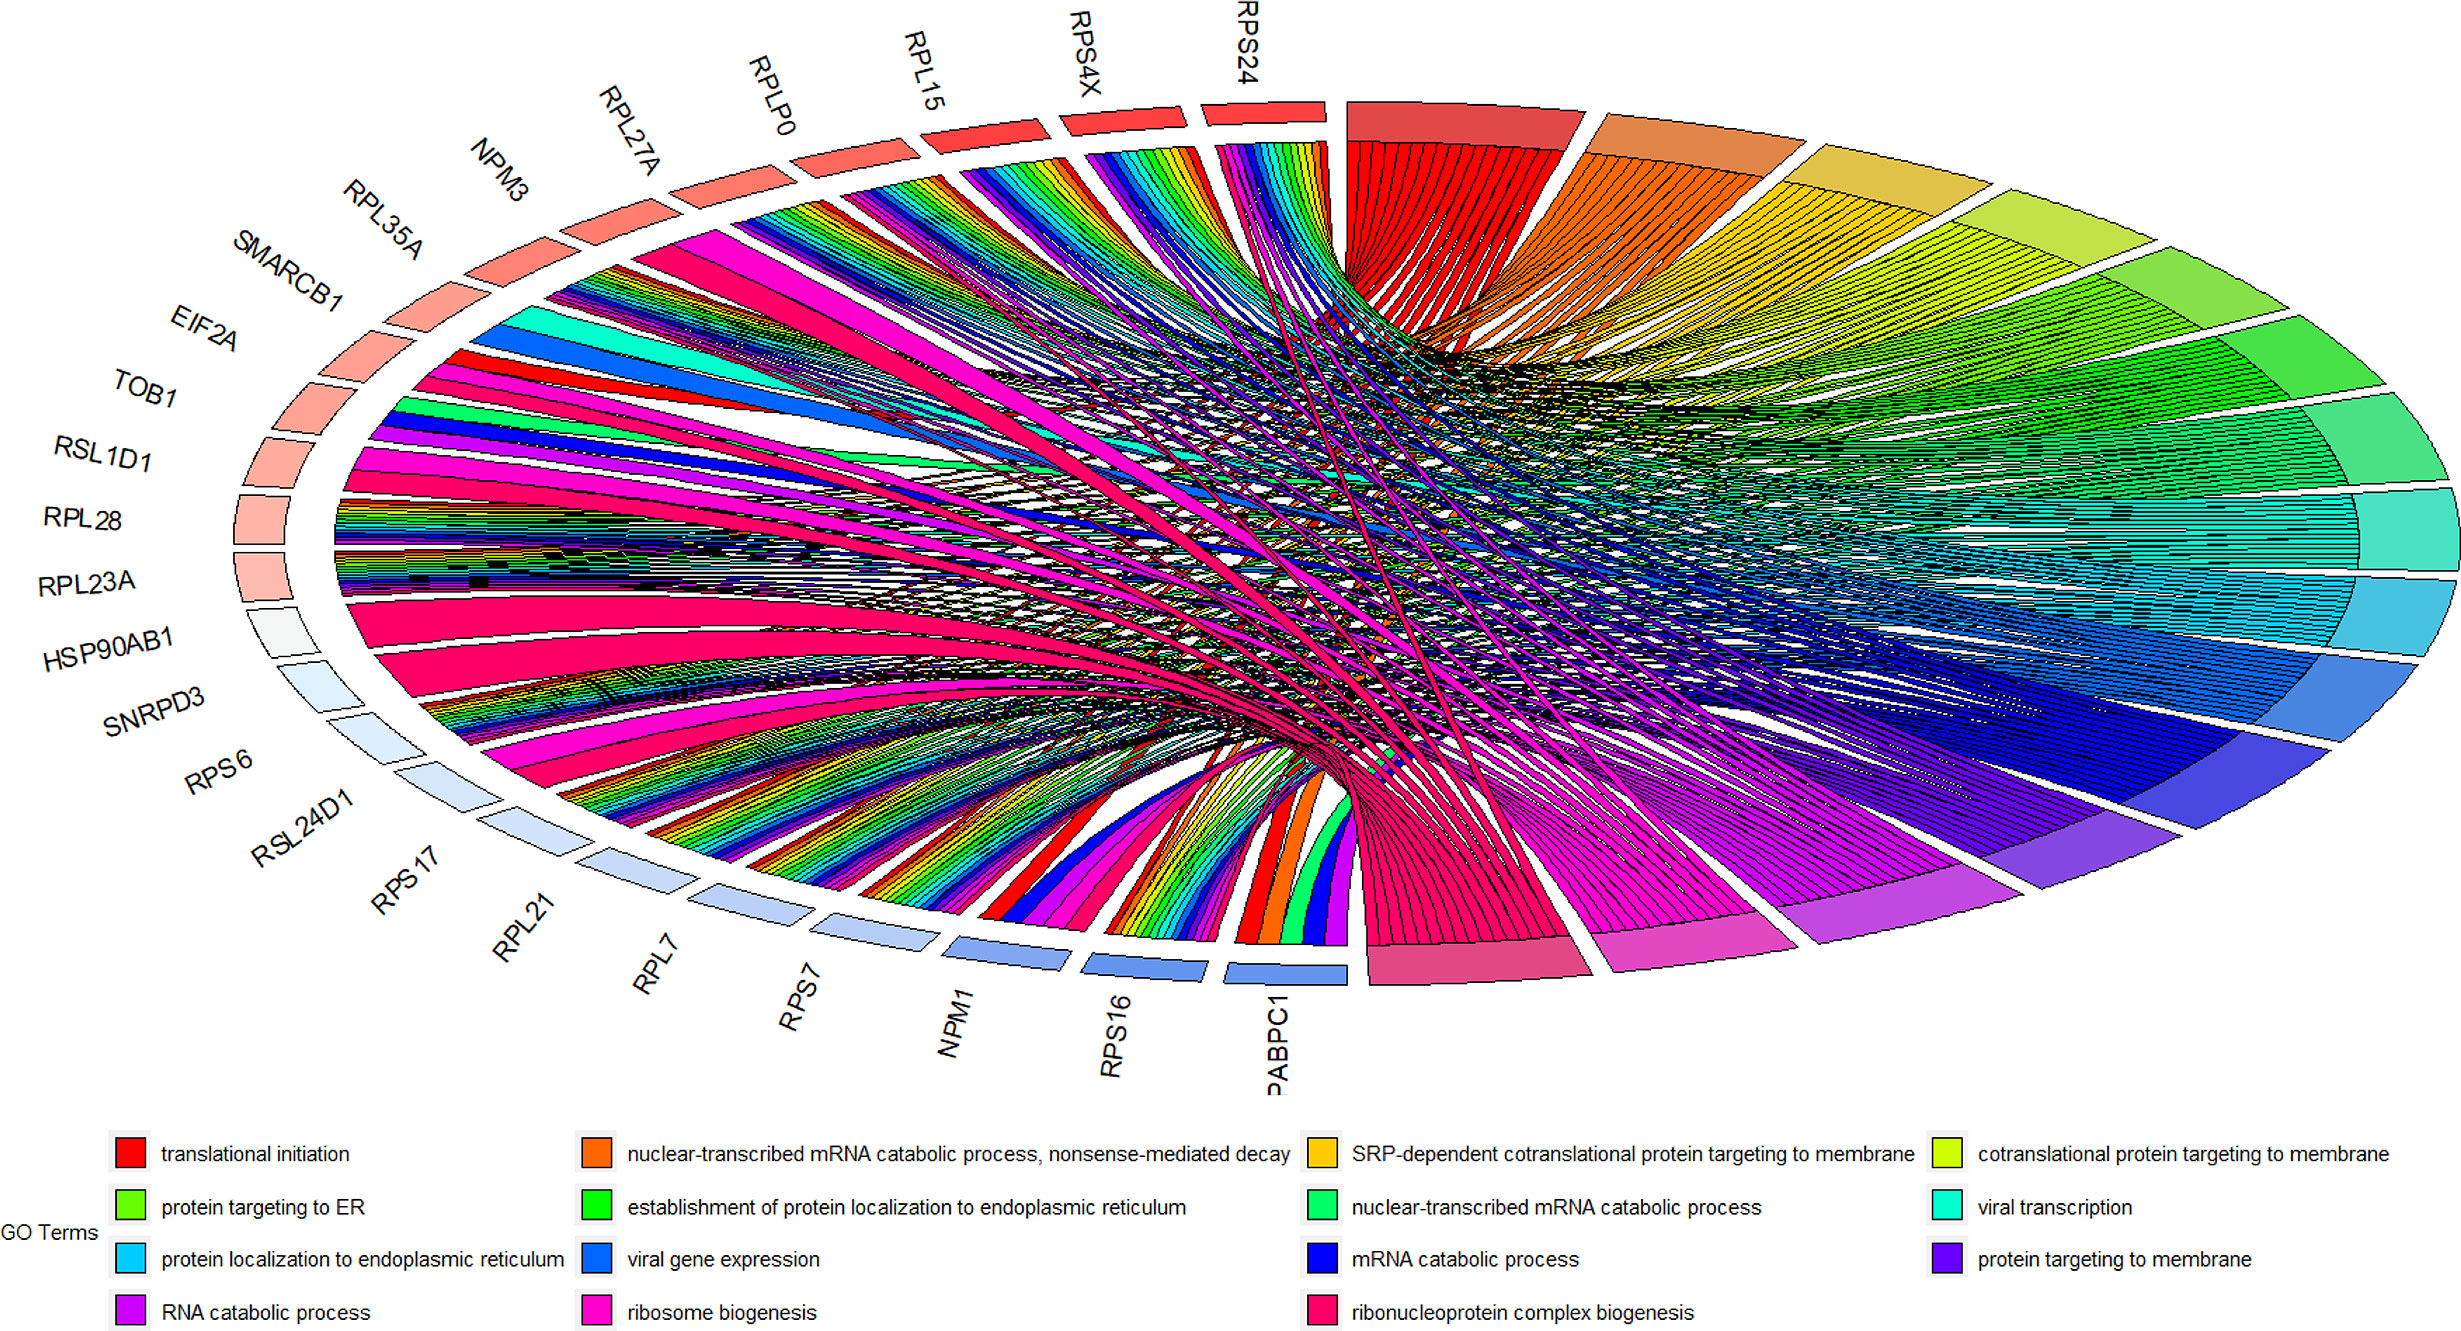
Figure 5 GO terms of 61 target mRNAs in ceRNA network.
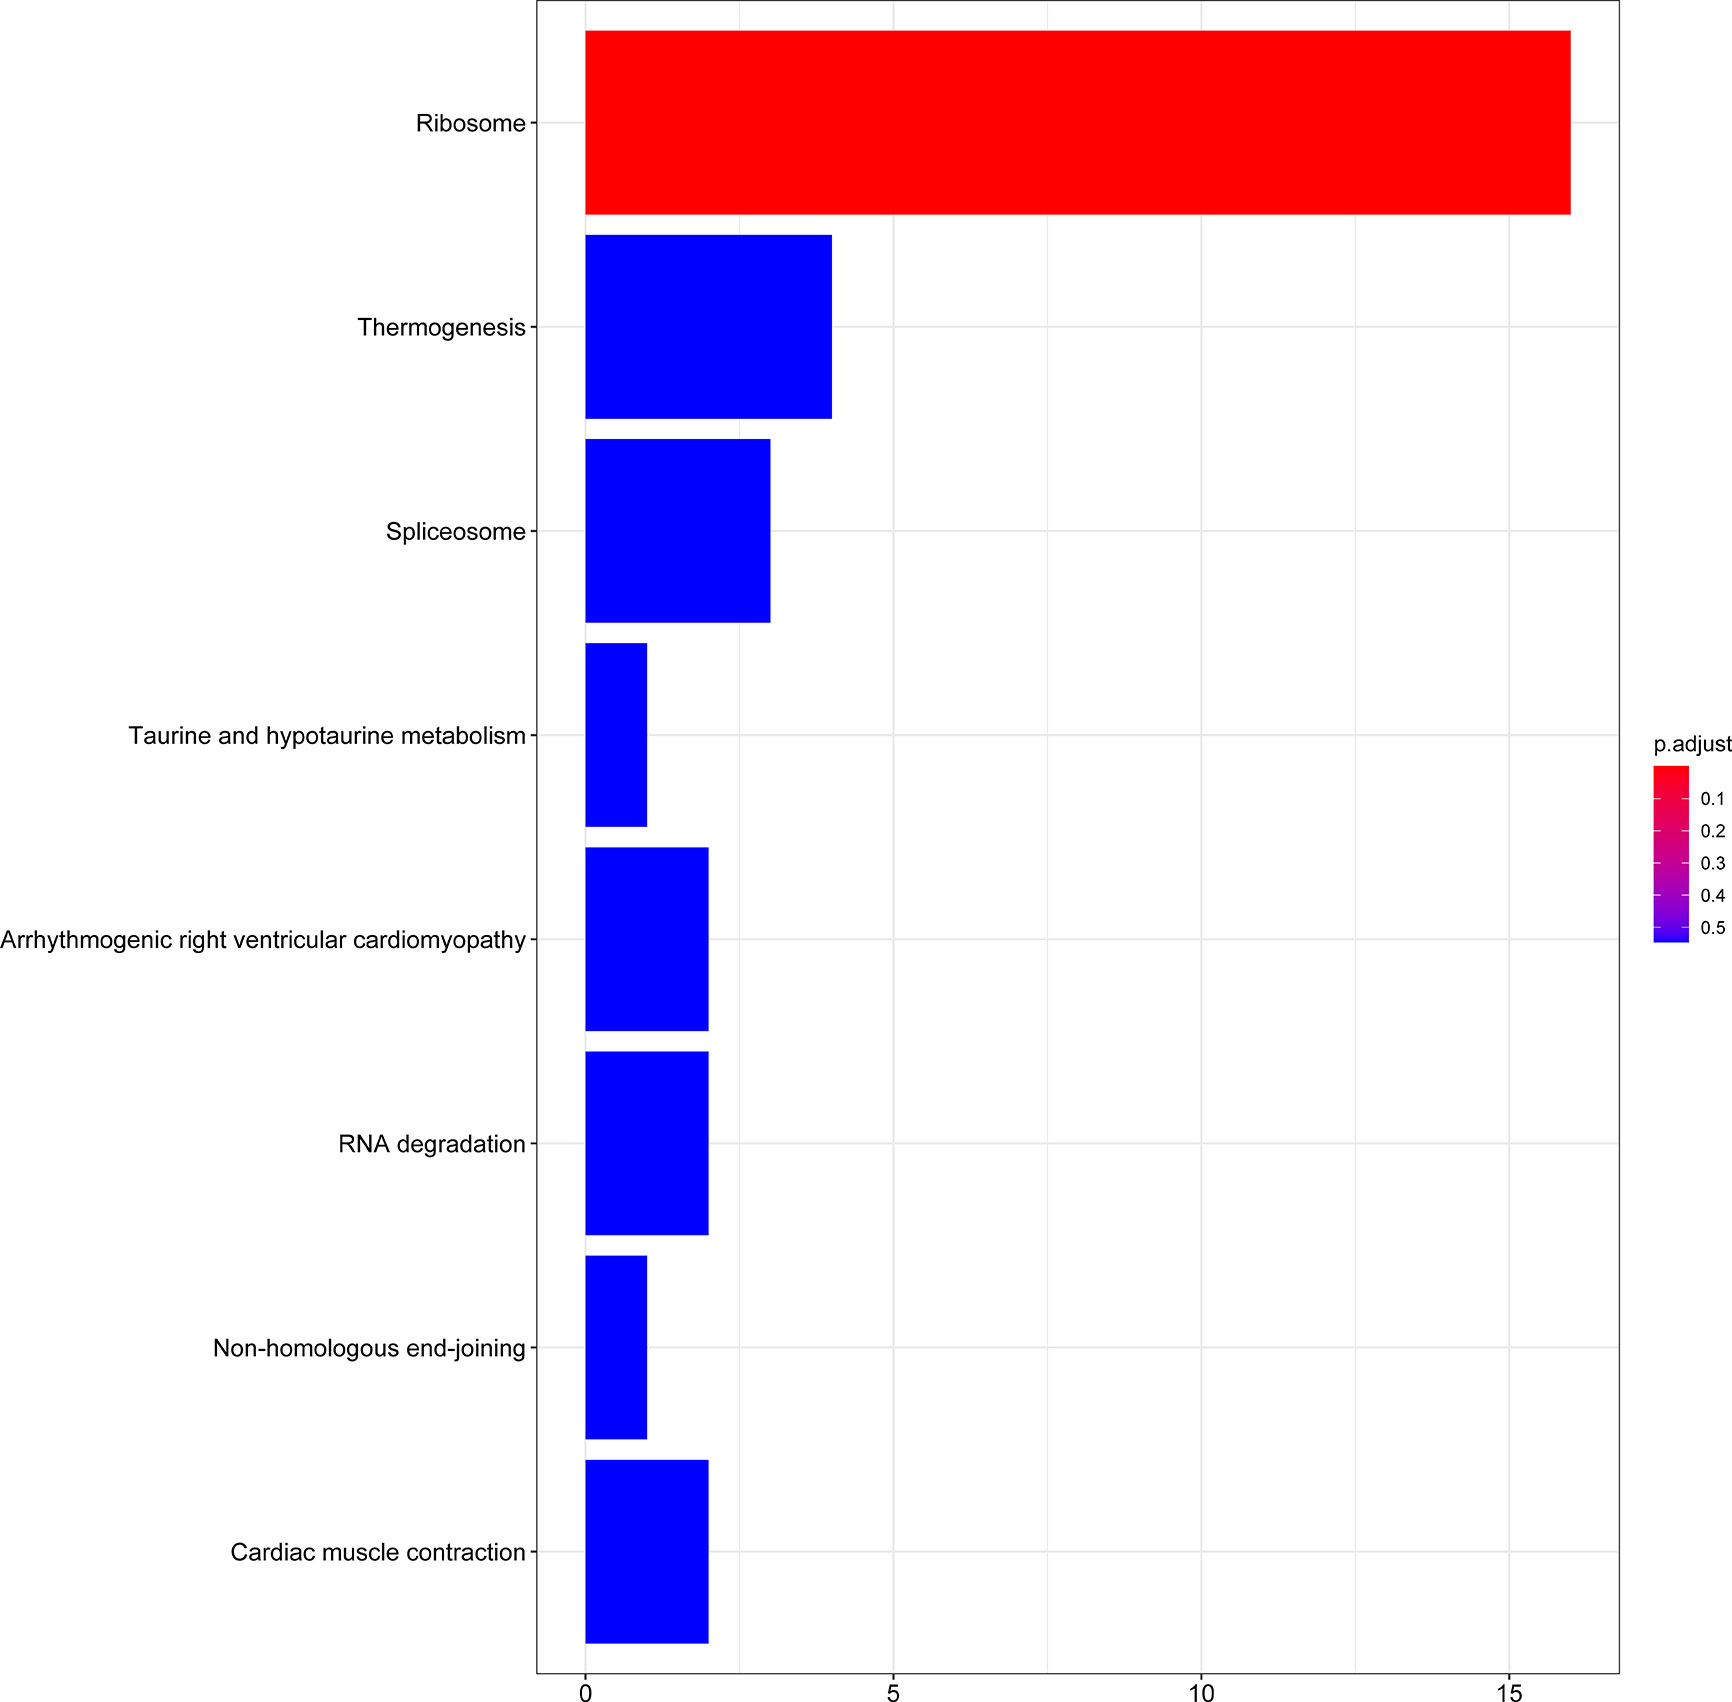
Figure 6 KEGG enrichment analysis of 61 target mRNAs.
After the calculation of GS and MM, 13 lncRNAs, 28 miRNAs, and 74 mRNAs were selected as hub genes. Results from the survival analysis (Table 2) indicated that DRAIC was the most significant lncRNA affecting the overall survival (OS) of patients who had received radiotherapy. The group with high lncRNA DRAIC expression showed a significantly better overall survival than that with low lncRNA DRAIC expression (p < 0.0001) (Figure 7).
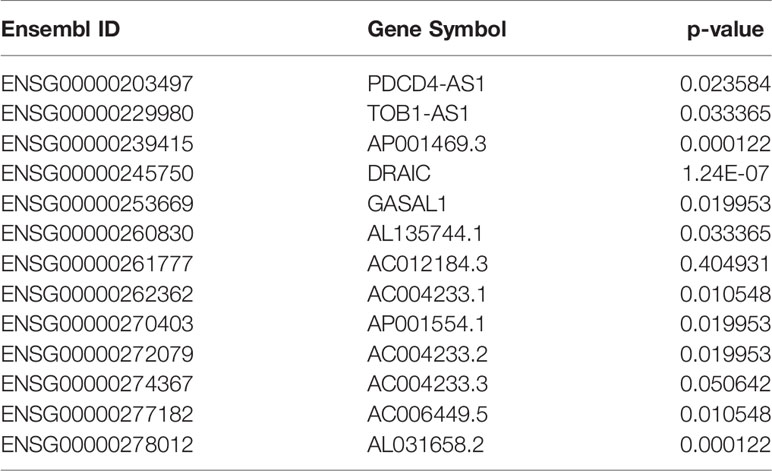
Table 2 Survival analysis results of hub lncRNAs.
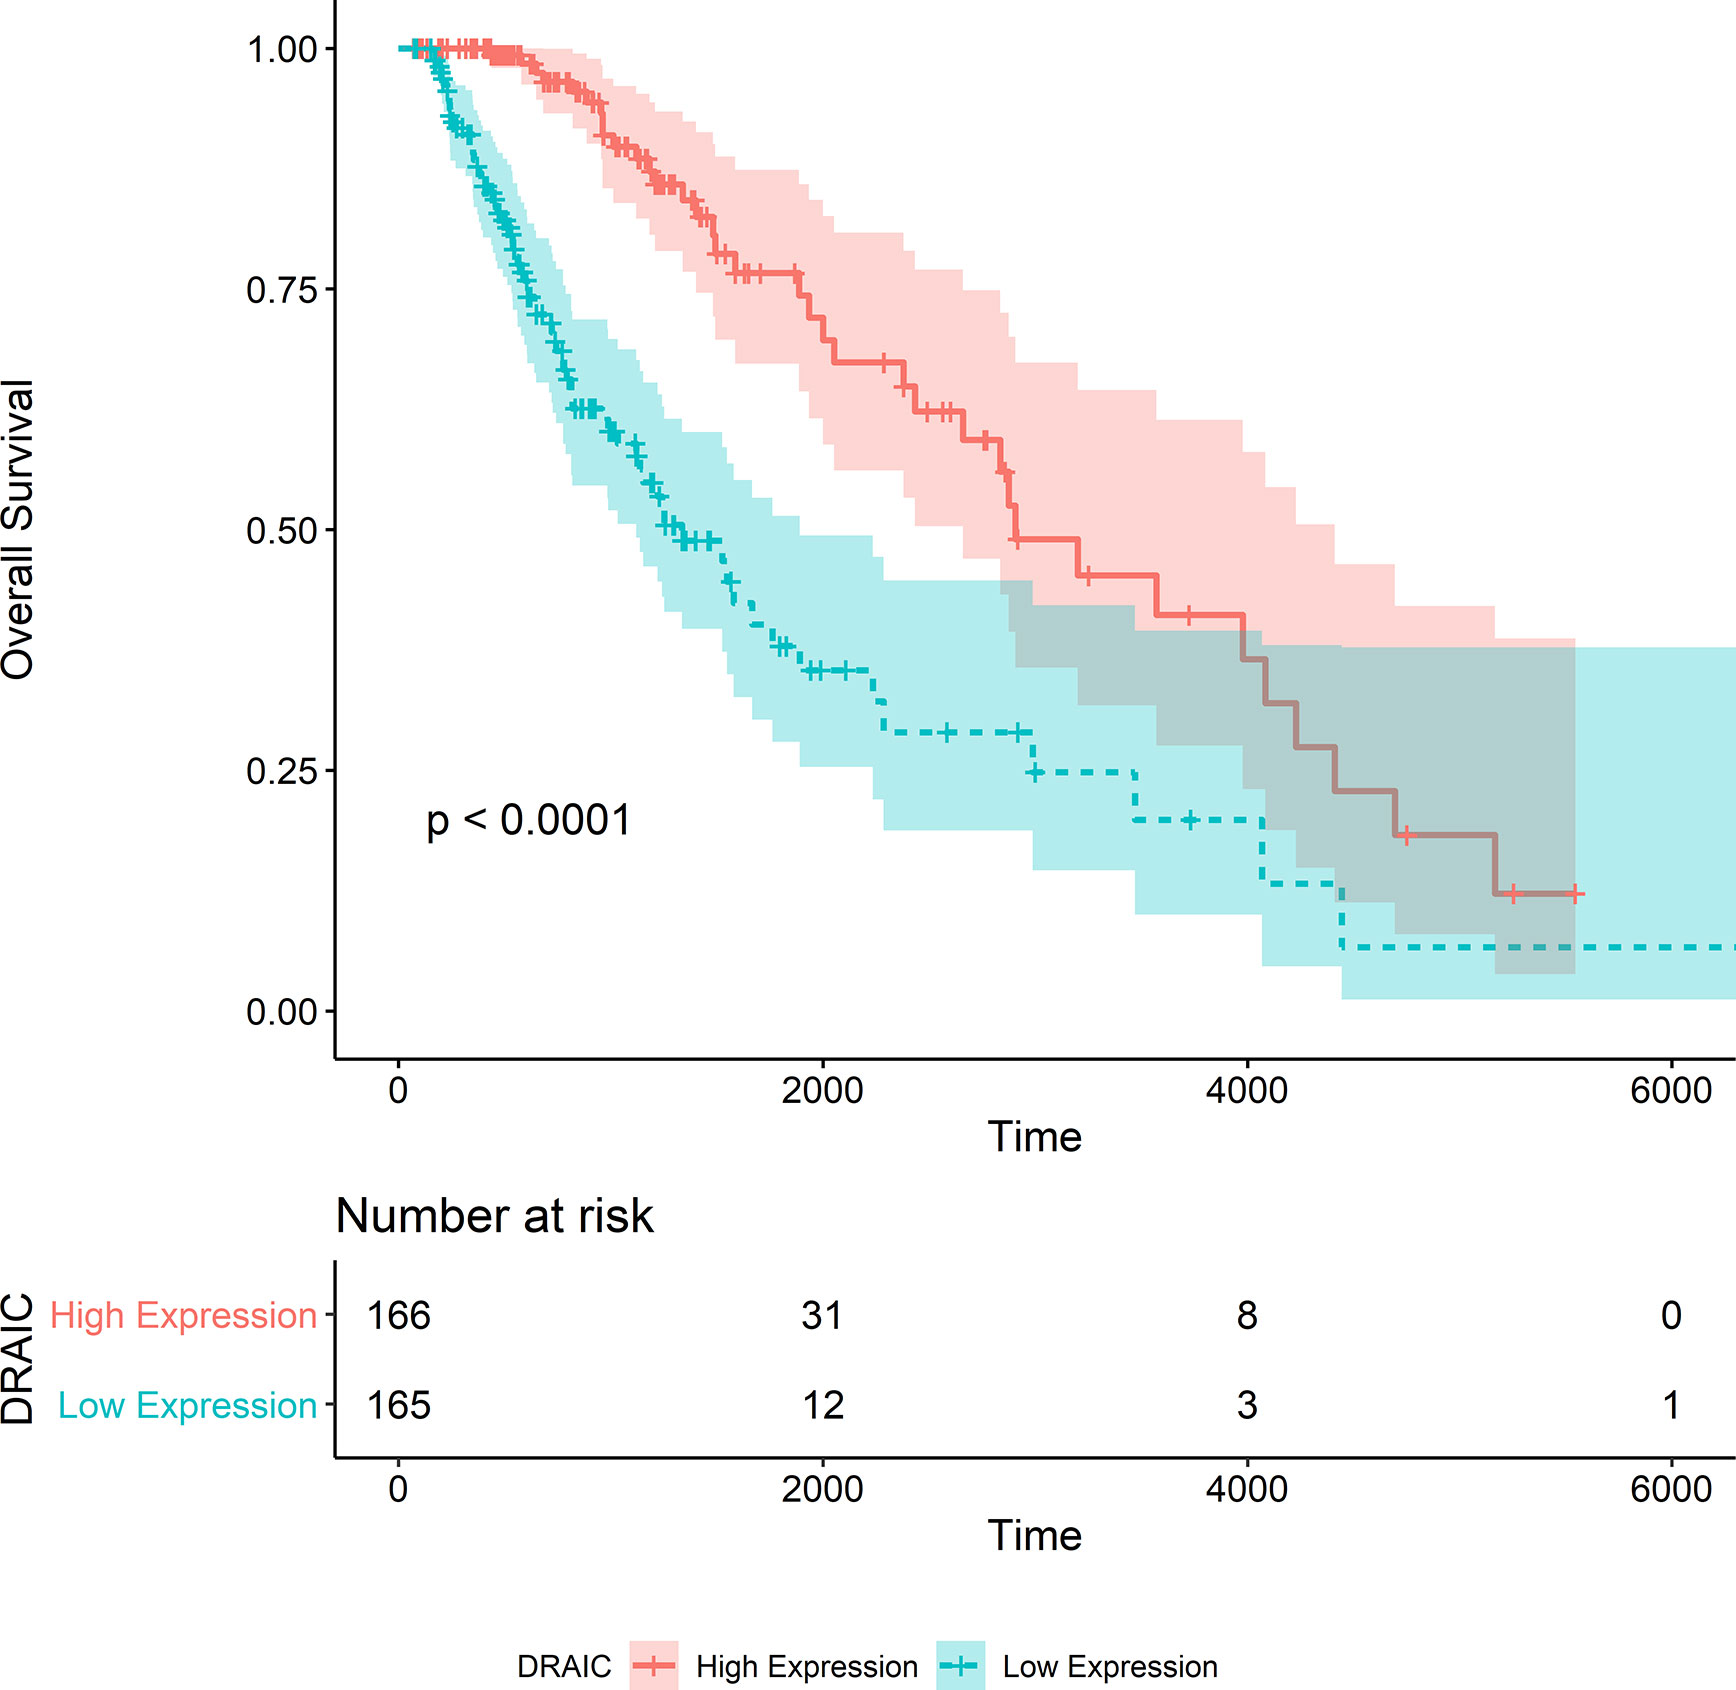
Figure 7 Kaplan-Merier survival curve of overall survival in the TCGA-LGG dataset.
We also noticed that the group with high lncRNA DRAIC expression level exhibited better progression-free survival than that with the low expression level of lncRNA DRAIC (p < 0.0001) (Figure 8).
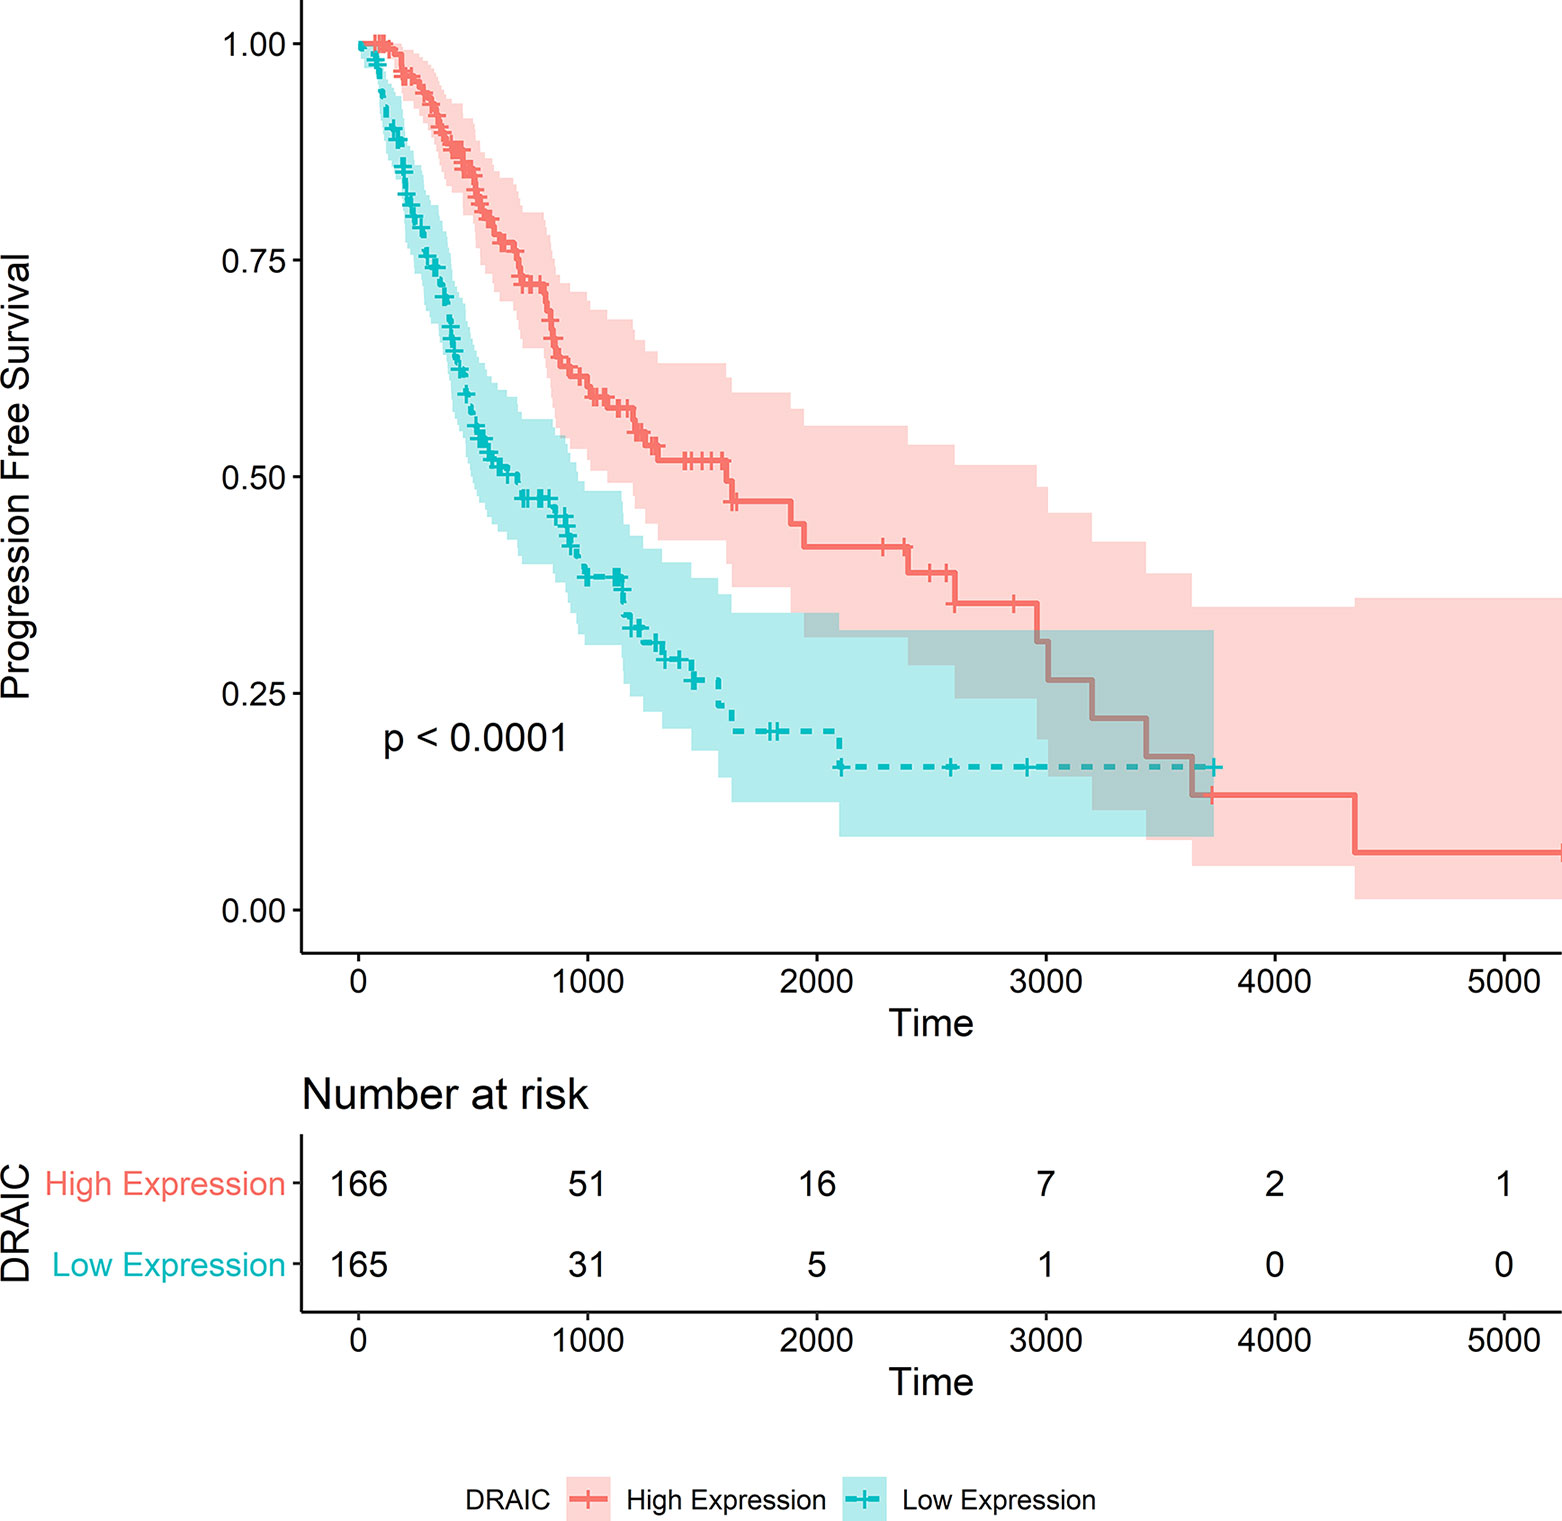
Figure 8 Kaplan‐Meier survival curve of progression free survival in the TCGA-LGG dataset.
Two CGGA datasets were used as independent datasets to validate the relationship between the expression level of lncRNA DRAIC and the OS of patients with LGG. From the CGGA325 dataset, we extracted the data of 137 patients with WHO grade II and III tumors with survival follow-up greater than 30 days who had received radiation therapy. We also extracted the data of 308 patients from the CGGA693 dataset based on similar criteria.
The OS data of patients with high DRAIC expression obtained from the CGGA325 dataset was significantly better than those of patients in the low expression group (p<0.0001) (Figure 9). Although the long-term survival of patients was not significantly better in the DRAIC high expression group, the OS and five-year survival were significantly better than that in the DRAIC low expression group in the CGGA693 dataset (p=0.0013) (Figure 10).
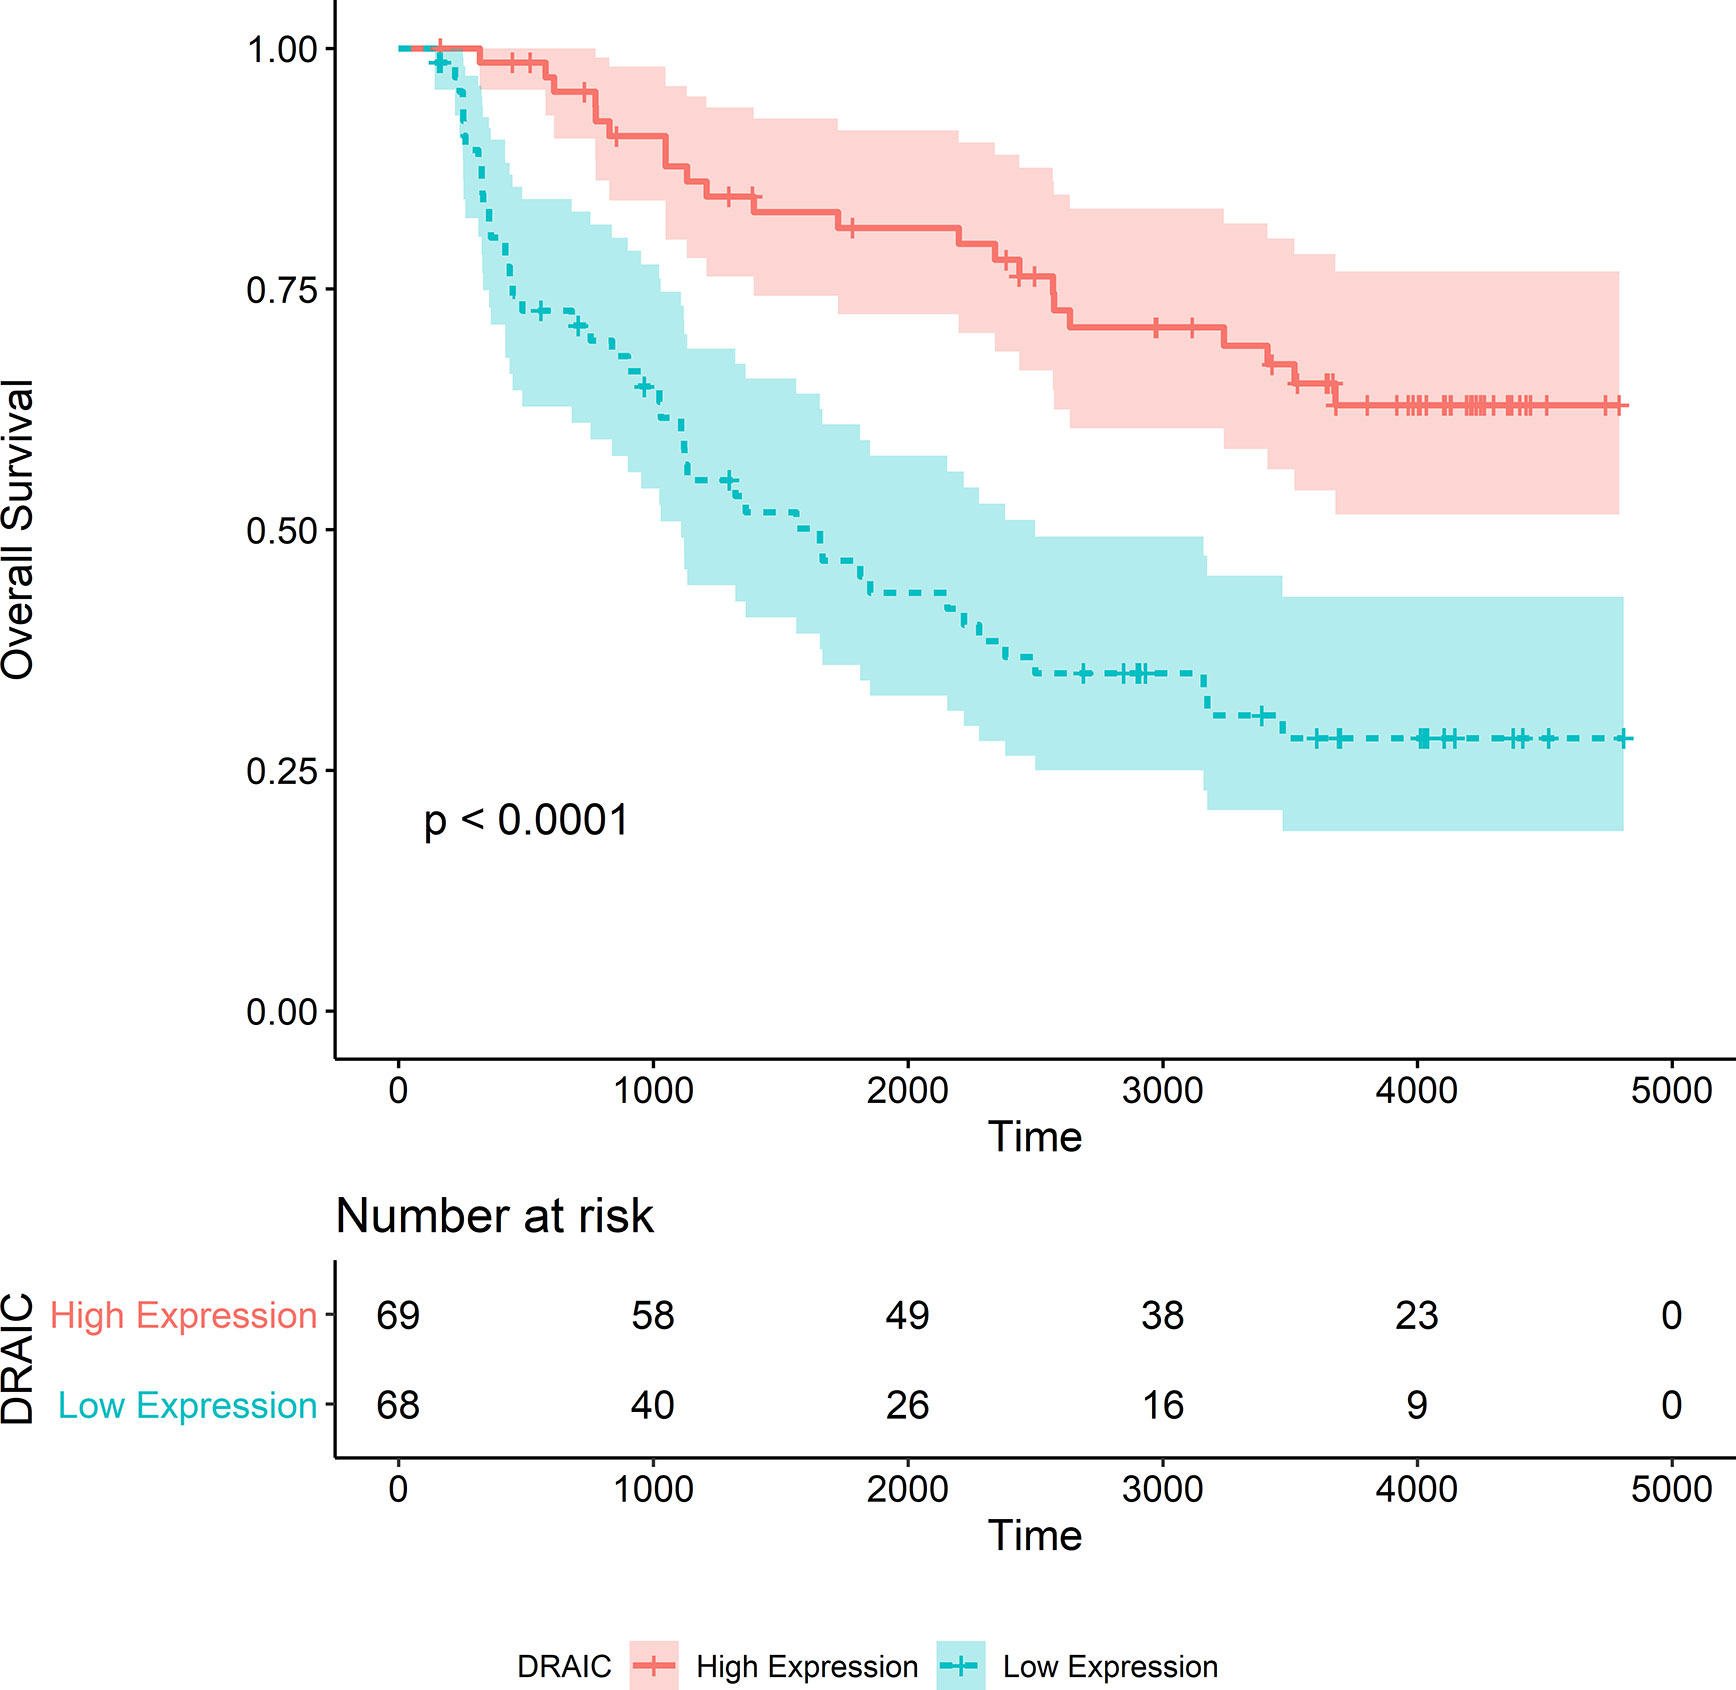
Figure 9 Kaplan-Merier survival curve of overall survival in the CGGA325 dataset.
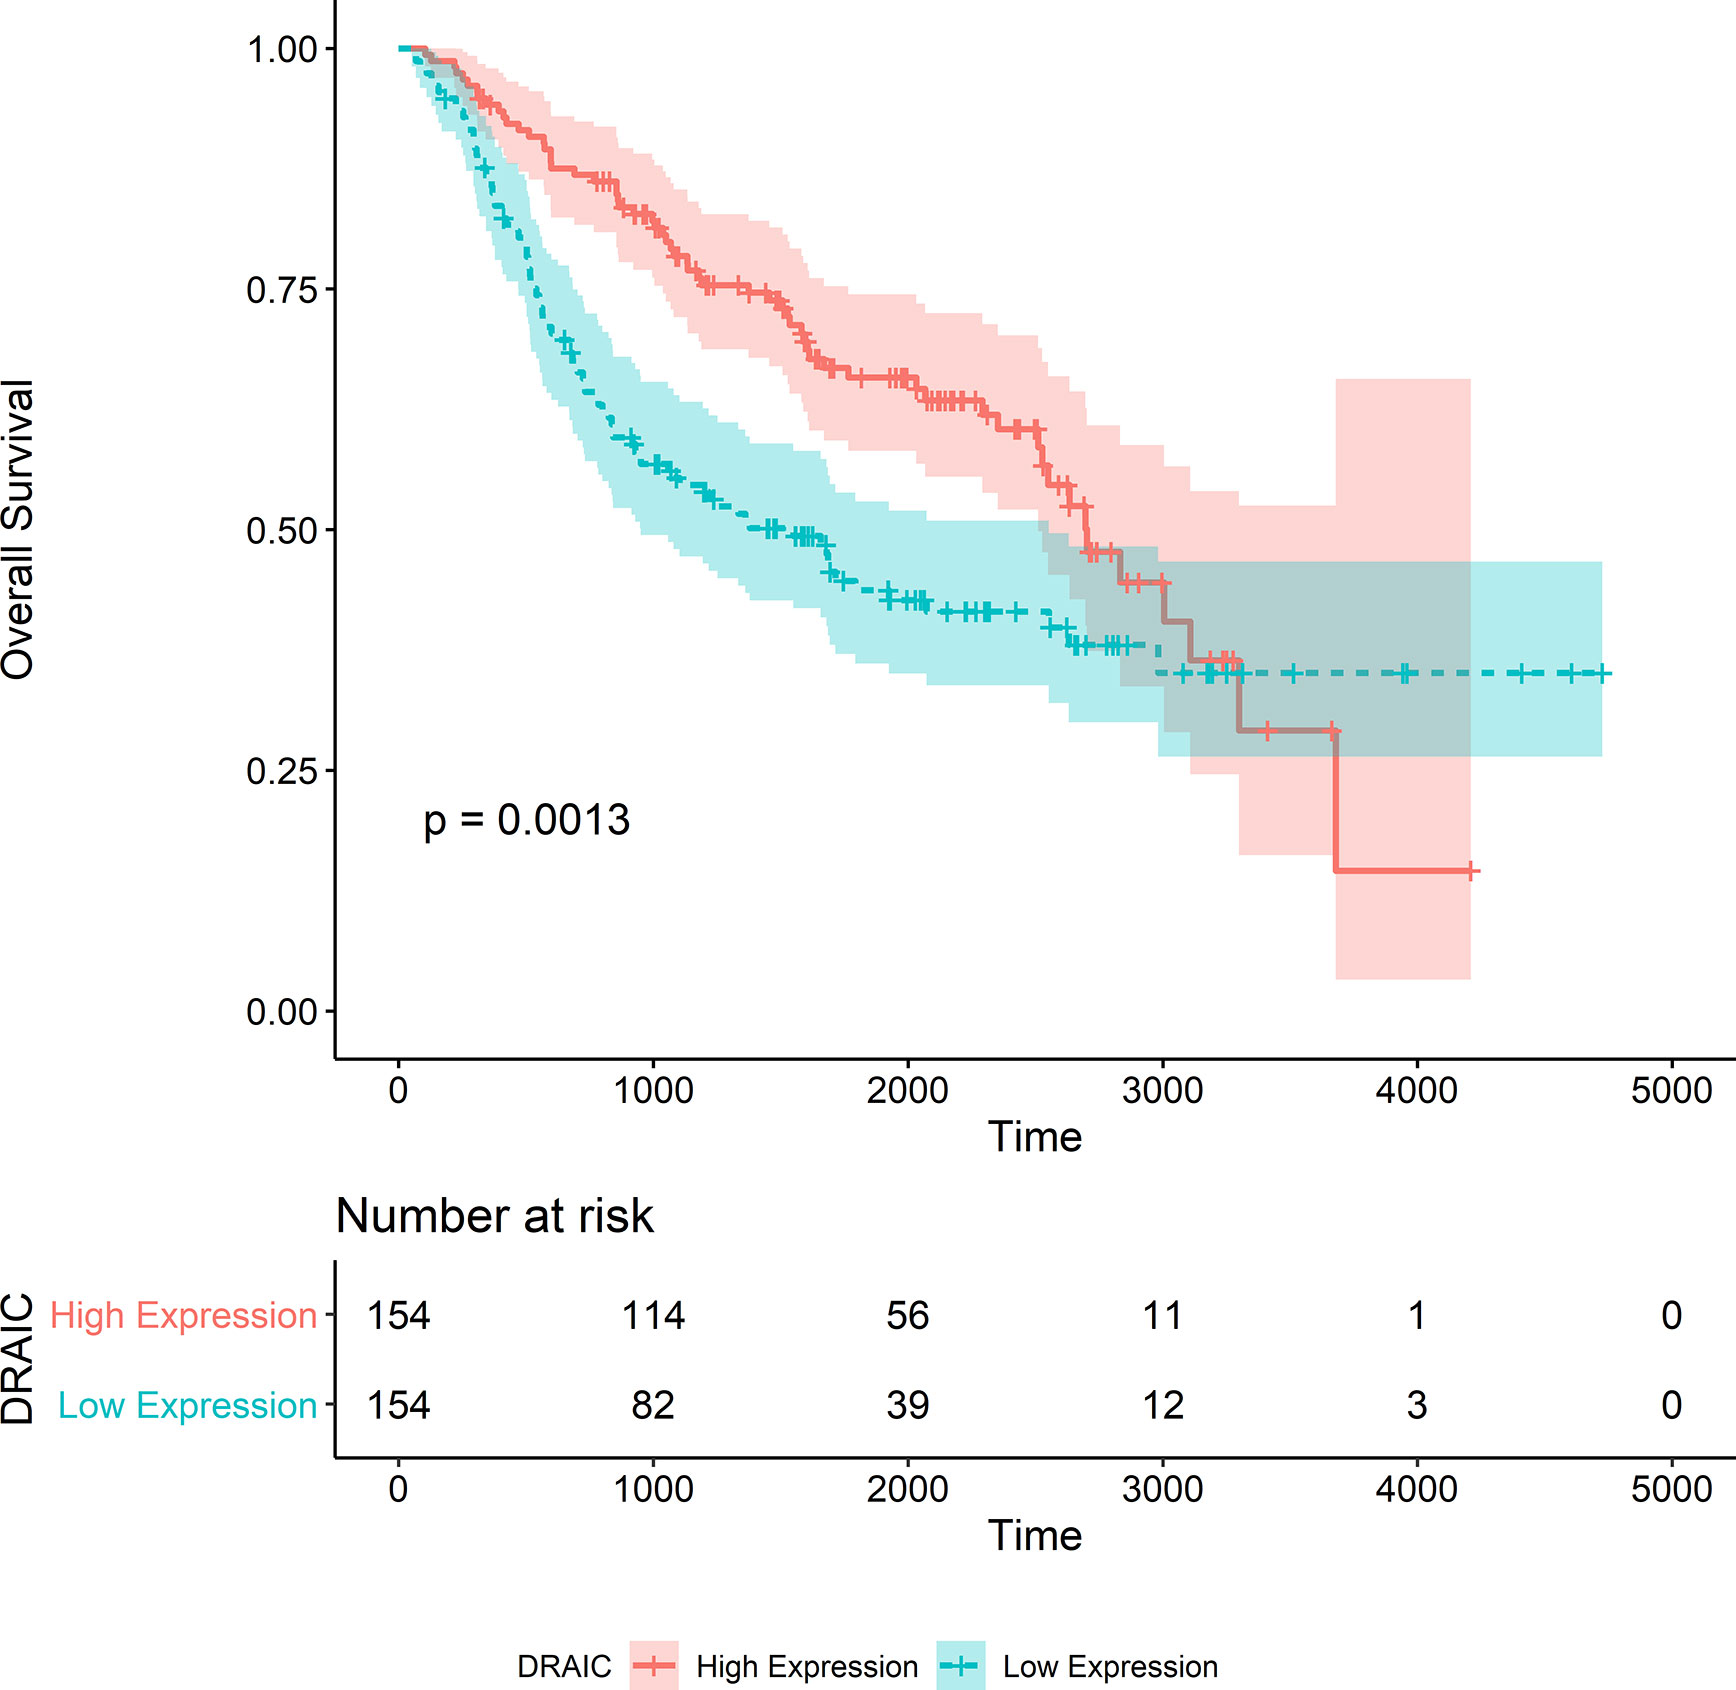
Figure 10 Kaplan-Merier survival curve of overall survival in the CGGA693 dataset.
Chi-square test was used to evaluate the relationship between DRAIC expression and levels of the traditional biomarkers in the CGGA datasets. We found that the expression level of lncRNA DRAIC was highly correlated with IDH mutation and 1p/19q codeletion. In both CGGA datasets, the DRAIC high expression group had more 1p/19q codeletion and IDH1 mutations compared to those in the low expression group. However, lncRNA DRAIC expression was not related to MGMT methylation (Tables 3 and 4).

Table 3 Relationship between lncRNA DRAIC expression and 1p/19q, IDH mutation, and MGMT methylation in CGGA325 dataset.
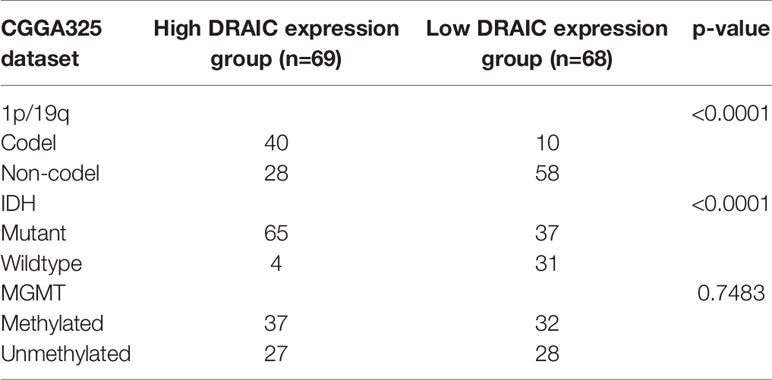
Table 4 Relationship between lncRNA DRAIC expression and 1p/19q, IDH mutation, and MGMT methylation in CGGA693 dataset.
The response of patients who receive radiotherapy for tumors varies widely. Radiotherapy induces several effects including double-strand breaks (DSB) in the DNA, DNA damage repair, and the generation of oxygen radicals by the ionizing radiation (32, 33). The sensitivity of individuals to radiotherapy varies widely and depends on several factors. Each patient responds differently and the nature of the response to radiotherapy is highly dependent on the genetic makeup (34, 35). Radiotherapy sensitivity has been one of the most important topics of research in radiation oncology for a long time. However, few studies have focused on the regulation of radiosensitivity at the post-transcriptional level. Molecular biomarkers, such as IDH1 and IDH2 mutation (36–39) and 1p19q codeletion (40, 41), have been used to predict the prognoses of patients with LGG. The molecular mechanism involved in the regulation of radiation response in patients with LGGs is still undefined and, to date, there is no effective or reliable biomarker that can be used to determine the prognosis of patients undergoing radiotherapy.
In this study, for the first time, we systematically investigated the mechanism of ceRNA regulation in the radiosensitivity of LGG based on RNA-seq data and database predictions. Consequently, a lncRNA was identified as a biomarker that could be effective in predicting the prognosis of patients after radiotherapy.
After obtaining data from TCGA-LGG, we categorized patients into different groups based on their short-term response of their primary tumor to radiotherapy. Although the TCGA-LGG project did not provide details of surgical resection, we believe that for low-grade gliomas, even if maximum resection is performed (e.g., gross total resection), some microscopic lesions may still be present. These residual microscopic lesions may still have the potential for local recurrence and distal metastasis. This is one of the reasons why lower-grade gliomas are treated using radiotherapy after surgery. However, patients may still present differently after postoperative radiotherapy, and some patients may develop local recurrence and distant metastases (42). Therefore, TCGA takes into consideration not only the imaging performance of the lesion before and after radiotherapy but also new tumor events when assessing the response to radiotherapy. Complete response is defined as the disappearance of all target lesions after receiving radiotherapy without the formation of new lesions for at least 4 weeks. Also, by reviewing the survival and follow-up data of patients in the CR group, we found that the majority of patients in the CR group had no new tumor events during their long-term follow-up. Therefore, we believe that TCGA is accurate in assessing the recovery of patients and the efficacy of the treatment modality, and our practice of using the short-term response to radiotherapy in TCGA to group patients is reasonable.
Normally, the RNA-seq studies involve gene analyses to identify genes related to the trait. All gene expression levels are analyzed using differential gene expression analysis and the differentially expressed genes (DEGs) are selected based on a foldchange threshold. However, the foldchange threshold is not the ideal choice in biology research as there is no significant difference in the function of a gene with expression levels a little higher or lower than the foldchange threshold. Therefore, in this study, we chose WGCNA analysis to discover the important genes that are involved in the radiosensitivity in LGG. The WGCNA algorithm avoids the problem of threshold by using a soft threshold. In WGCNA analysis, the correlation coefficient of all genes is taken as the power of n, the coefficient distribution conforms to the scale-free network, and the genes are classified into different modules based on the mode of expression. Genes in the same module exhibit highly similar expression. The distribution pattern of nodes in the scale-free network corresponds to the mode of action of genes and has a biological significance, which is the advantage of using the WGCNA algorithm.
Using WGCNA analysis, we observed that the most relevant modules of lncRNA and mRNA were positively correlated with radiosensitivity and the most relevant module of miRNA was negatively correlated with radiosensitivity. These findings were consistent with the competitive binding mechanism of ceRNA. In the gene function enrichment analysis, we noticed that most of the functions of the target mRNAs in the ceRNA network were highly concentrated in the ribosomal pathway. Currently, the role of ribosomes in the response of tumor cells to ionizing radiation has not been elucidated in the field of gene research pertaining to radiosensitivity.
We noticed that lncRNA DRAIC had the most significant effect in predicting the prognosis of patients after receiving radiotherapy; lncRNA DRAIC has been shown to inhibit the progression of prostate cancer by interacting with IκB kinase (IKK) and inhibiting NF-κB activity (43). Activation of NF-κB is associated with the radiosensitivity of gliomas (44–46). DRAIC might be the key lncRNA involved in the radiosensitivity regulation of LGG. Studies report that DRAIC can be a biomarker to predict prognosis in many malignancies (47). However, there is no direct evidence to confirm the involvement of lncRNA DRAIC in the regulation of radiosensitivity in LGG; therefore, further studies are warranted.
To further strengthen the conclusions based on the data obtained from TCGA dataset, we performed independent validation of the OS in patients who underwent radiotherapy. To this effect, we used two CGGA datasets to validate DRAIC as a biomarker of the response to radiotherapy. The conclusions obtained based on both CGGA datasets were similar to those derived from TCGA, which indicated that patients in the high DRAIC expression group would achieve better OS after radiation therapy compared to those in the low-expression group. Furthermore, we noticed that in the CGGA datasets, IDH mutation and 1p/19q codeletion status were highly correlated with lncRNA DRAIC expression. Previous studies have shown that IDH mutation and 1p/19q codeletion are related to the radiosensitivity of gliomas (48–50). IDH mutation and 1p/19q codeletion increase the radiosensitivity of gliomas. These results are in agreement with our findings that lncRNA DRAIC can be used as a potentially suitable biomarker to determine radiosensitivity in patients.
Our study has some limitations. Although the number of patients who were included in this study based on their specific response to radiotherapy is justified and adequate for WGCNA analysis, additional samples may help increase the confidence levels of our findings. In vivo and in vitro studies (such as knockdown/knockout of DRAIC and molecular functional tests) can help further corroborate the conclusions of our study. This will be the focus of our subsequent study.
Publicly available datasets were analyzed in this study. These data can be found here: https://portal.gdc.cancer.gov/repository, http://www.cgga.org.cn/download.jsp.
Study conception and design: ZL, ZT, and DY. Real data and analysis: ZL, SC, and JG. Drafting of the manuscript: ZL, SC, JG, YT, and JC. All authors contributed to the article and approved the submitted version.
This work was supported in part by the National Natural Science Foundation of China (81773541), funded from the Priority Academic Program Development of Jiangsu Higher Education Institutions at Soochow University, the State Key Laboratory of Radiation Medicine and Protection (GZK1201919) to ZT; a project by the Second Affiliated Hospital of Soochow University (XKTJ-RC202007), Scientific Research Program for Young Talents of China National Nuclear Corporation (51003), Suzhou Science and Education Project (KJXW2017010), The Natural Science Foundation of Jiangsu Province (BK20180195), the National Natural Science Foundation of China (81902715) to SC; National Natural Science Foundation of China (U1967220 and 81872552) to JC; Jiangsu Provincial Key Project in Research and Development of Advanced Clinical Technique (BL2018657) to YT; and the Natural Science Foundation of Jiangsu Province (BK2016), National Natural Science Foundation of China (11475125), and The Starting Research Fund from the Soochow University (Q412600711) to DY. The funding body did not play any roles in the design of the study and collection, analysis, and interpretation of data and in writing the manuscript.
The authors declare that the research was conducted in the absence of any commercial or financial relationships that could be construed as a potential conflict of interest.
The Supplementary Material for this article can be found online at: https://www.frontiersin.org/articles/10.3389/fonc.2021.622880/full#supplementary-material
1. Ostrom QT, Bauchet L, Davis FG, Deltour I, Fisher JL, Langer CE, et al. The epidemiology of glioma in adults: A state of the science review. Neuro Oncol (2014) 16(7):896–913. doi: 10.1093/neuonc/nou087
2. Cancer Genome Atlas Research Network, Brat DJ, Verhaak RG, Aldape KD, Yung WK, Salama SR, et al. Comprehensive, Integrative Genomic Analysis of Diffuse Lower- Grade Gliomas The Cancer Genome Atlas Research Network*. N Engl J Med (2015) 372(26):2481–98. doi: 10.1056/NEJMoa1402121.Comprehensive
3. Scaringi C, De Sanctis V, Minniti G, Enrici M. Temozolomide-Related Hematologic Toxicity. Oncol Res Treat (2013) 36:444–9. doi: 10.1159/000353752
4. Sengupta S, Marrinan J, Frishman C, Sampath P. Impact of Temozolomide on Immune Response during Malignant Glioma Chemotherapy. Clin Dev Immunol (2012) 2012:831090. doi: 10.1155/2012/831090
5. Bourne TD, Schiff D. Update on molecular findings, management and outcome in low-grade gliomas. Nat Rev Neurol (2010) 6(12):695–701. doi: 10.1038/nrneurol.2010.159
6. Domina EA, Philchenkov A, Dubrovska A. Individual response to ionizing radiation and personalized radiotherapy. Crit Rev Oncog (2018) 23:69–92. doi: 10.1615/CritRevOncog.2018026308
7. Douw L, Klein M, Fagel SSAA, van den Heuvel J, Taphoorn MJB, Aaronson NK, et al. Cognitive and radiological effects of radiotherapy in patients with low-grade glioma: long-term follow-up. Lancet Neurol (2009) 8(9):810–8. doi: 10.1016/S1474-4422(09)70204-2
8. Rudá R, Magliola U, Bertero L, Trevisan E, Bosa C, Mantovani C, et al. Seizure control following radiotherapy in patients with diffuse gliomas: A retrospective study. Neuro Oncol (2013) 15:1739–49. doi: 10.1093/neuonc/not109
9. Cui C, Zhai D, Cai L, Duan Q, Xie L, Yu J. Long noncoding rna heih promotes colorectal cancer tumorigenesis via counteracting mir-939-mediated transcriptional repression of Bcl-Xl. Cancer Res Treat (2018) 50(3):992–1008. doi: 10.4143/crt.2017.226
10. He C, Wang X, Luo J, Ma Y, Yang Z. Long Noncoding RNA Maternally Expressed Gene 3 Is Downregulated, and Its Insufficiency Correlates With Poor-Risk Stratification, Worse Treatment Response, as Well as Unfavorable Survival Data in Patients With Acute Myeloid Leukemia. Technol Cancer Res Treat (2020) 19(5):1–8. doi: 10.1177/1533033820945815
11. Shen SN, Li K, Liu Y, Yang CL, He CY, Wang HR. Down-regulation of long noncoding RNA PVT1 inhibits esophageal carcinoma cell migration and invasion and promotes cell apoptosis via microRNA-145-mediated inhibition of FSCN1. Mol Oncol (2019) 13(12):2554–73. doi: 10.1002/1878-0261.12555
12. Jing H, Qu X, Liu L, Xia H. A novel long noncoding rna (LncRNA), LL22NC03-N64E9.1, promotes the proliferation of lung cancer cells and is a potential prognostic molecular biomarker for lung cancer. Med Sci Monit (2018) 24:4317–23. doi: 10.12659/MSM.908359
13. Wang Q, Liu L, Zhang S, Ming Y, Liu S, Cheng K, et al. Long noncoding RNA NEAT1 suppresses hepatocyte proliferation in fulminant hepatic failure through increased recruitment of EZH2 to the LATS2 promoter region and promotion of H3K27me3 methylation. Exp Mol Med (2020) 52(3):461–72. doi: 10.1038/s12276-020-0387-z
14. Zhang J, Li W. Long noncoding RNA CYTOR sponges miR-195 to modulate proliferation, migration, invasion and radiosensitivity in nonsmall cell lung cancer cells. Biosci Rep (2018) 38(6):1–12. doi: 10.1042/BSR20181599
15. Chen L, Ren P, Zhang Y, Gong B, Yu D, Sun X. Long non-coding RNA GAS5 increases the radiosensitivity of A549 cells through interaction with the miR-21/PTEN/Akt axis. Oncol Rep (2020) 43(3):897–907. doi: 10.3892/or.2020.7467
16. Hu X, Jiang H, Jiang X. Downregulation of lncRNA ANRIL inhibits proliferation, induces apoptosis, and enhances radiosensitivity in nasopharyngeal carcinoma cells through regulating miR-125a. Cancer Biol Ther (2017) 18(5):331–8. doi: 10.1080/15384047.2017.1310348
17. Salmena L, Poliseno L, Tay Y, Kats L, Pandolfi PP. A ceRNA hypothesis: The rosetta stone of a hidden RNA language? Cell (2011) 146:353–8. doi: 10.1016/j.cell.2011.07.014
18. Zheng P, Yin Z, Wu Y, Xu Y, Luo Y, Zhang TC. LncRNA HOTAIR promotes cell migration and invasion by regulating MKL1 via inhibition miR206 expression in HeLa cells. Cell Commun Signal (2018) 16(1):1–15. doi: 10.1186/s12964-018-0216-3
19. Wu M, Huang Y, Chen T, Wang W, Yang S, Ye Z, et al. LncRNA MEG3 inhibits the progression of prostate cancer by modulating miR-9-5p/QKI-5 axis. J Cell Mol Med (2019) 23(1):29–38. doi: 10.1111/jcmm.13658
20. Langfelder P, Horvath S. Fast R functions for robust correlations and hierarchical clustering. J Stat Software (2012) 46(11):1–17. doi: 10.18637/jss.v046.i11
21. Langfelder P, Horvath S. WGCNA: An R package for weighted correlation network analysis. BMC Bioinf (2008) 9:559. doi: 10.1186/1471-2105-9-559
22. Dobin A, Davis CA, Schlesinger F, Drenkow J, Zaleski C, Jha S, et al. STAR: Ultrafast universal RNA-seq aligner. Bioinformatics (2013) 29(1):15–21. doi: 10.1093/bioinformatics/bts635
23. Li B, Dewey CN. RSEM: Accurate transcript quantification from RNA-seq data with or without a reference genome. BMC Bioinformatics (2011) 12:323. doi: 10.1186/1471-2105-12-323
24. Bao Z-S, Chen H-M, Yang M-Y, Zhang C-B, Yu K, Ye W-L, et al. RNA-seq of 272 gliomas revealed a novel, recurrent PTPRZ1-MET fusion transcript in secondary glioblastomas. Genome Res (2014) 24:1765–73. doi: 10.1101/gr.165126.113
25. Zhao Z, Meng F, Wang W, Wang Z, Zhang C, Jiang T. Comprehensive RNA-seq transcriptomic profiling in the malignant progression of gliomas. Sci Data (2017) 4:170024. doi: 10.1038/sdata.2017.24
26. Wang Y, Qian T, You G, Peng X, Chen C, You Y, et al. Localizing seizure-susceptible brain regions associated with low-grade gliomas using voxel-based lesion-symptom mapping. Neuro Oncol (2015) 17:282–8. doi: 10.1093/neuonc/nou130
27. Liu X, Li Y, Qian Z, Sun Z, Xu K, Wang K, et al. A radiomic signature as a non-invasive predictor of progression-free survival in patients with lower-grade gliomas. NeuroImage Clin (2018) 20:1070–7. doi: 10.1016/j.nicl.2018.10.014
28. Brunson J. ggalluvial: Layered Grammar for Alluvial Plots. J Open Source Software (2020) 5(49):2017. doi: 10.21105/joss.02017
29. Yu G, Wang LG, Han Y, He QY. ClusterProfiler: An R package for comparing biological themes among gene clusters. Omi A J Integr Biol (2012) 16(5):284–7. doi: 10.1089/omi.2011.0118
30. Walter W, Sánchez-Cabo F, Ricote M. GOplot: An R package for visually combining expression data with functional analysis. Bioinformatics (2015) 31(17):2912–4. doi: 10.1093/bioinformatics/btv300
31. Therneau TM, Grambsch PM. The Cox Model. In: Modeling Survival Data: Extending the Cox Model. Statistics for Biology and Health. New York, NY: Springer (2000). doi: 10.1007/978-1-4757-3294-8_3.
32. Hall EJ, Giaccia AJ. Radiobiology for the radiologist. Philadelphia: Wolters Kluwer Health/Lippincott Williams & Wilkins (2012).
33. Santivasi WL, Xia F. Ionizing radiation-induced DNA damage, response, and repair. Antioxid Redox Signal (2014) 21(2):251–9. doi: 10.1089/ars.2013.5668
34. Young A, Berry R, Holloway AF, Blackburn NB, Dickinson JL, Skala M, et al. RNA-seq profiling of a radiation resistant and radiation sensitive prostate cancer cell line highlights opposing regulation of DNA repair and targets for radiosensitization. BMC Cancer (2014) 14:808. doi: 10.1186/1471-2407-14-808
35. Begg AC. Predicting response to radiotherapy: Evolutions and revolutions. Int J Radiat Biol (2009) 85:825–36. doi: 10.1080/09553000903184366
36. Turcan S, Rohle D, Goenka A, Walsh LA, Fang F, Yilmaz E, et al. IDH1 mutation is sufficient to establish the glioma hypermethylator phenotype. Nature (2012) 483:479–83. doi: 10.1038/nature10866
37. Sturm D, Witt H, Hovestadt V, Khuong-Quang DA, Jones DTW, Konermann C, et al. Hotspot Mutations in H3F3A and IDH1 Define Distinct Epigenetic and Biological Subgroups of Glioblastoma. Cancer Cell (2012) 22:425–37. doi: 10.1016/j.ccr.2012.08.024
38. Lu C, Ward PS, Kapoor GS, Rohle D, Turcan S, Abdel-Wahab O, et al. IDH mutation impairs histone demethylation and results in a block to cell differentiation. Nature (2012) 483:474–8. doi: 10.1038/nature10860
39. Bai H, Harmanci AS, Erson-Omay EZ, Li J, Coşkun S, Simon M, et al. Integrated genomic characterization of IDH1-mutant glioma malignant progression. Nat Genet (2015) 48:59–66. doi: 10.1038/ng.3457
40. Tang L, Deng L, Bai HX, Sun J, Neale N, Wu J, et al. Reduced expression of DNA repair genes and chemosensitivity in 1p19q codeleted lower-grade gliomas. J Neurooncol (2018) 139:563–71. doi: 10.1007/s11060-018-2915-4
41. Huang SP, Chan YC, Huang SY, Lin YF. Overexpression of PSAT1 gene is a favorable prognostic marker in lower-grade gliomas and predicts a favorable outcome in patients with IDH1 mutations and chromosome 1p19q codeletion. Cancers (Basel) (2020) 12(1):1–15. doi: 10.3390/cancers12010013
42. Im JH, Hong JB, Kim SH, Choi J, Chang JH, Cho J. Recurrence patterns after maximal surgical resection and postoperative radiotherapy in anaplastic gliomas according to the new 2016 WHO classification. Sci Rep (2018) August 2017):1–9. doi: 10.1038/s41598-017-19014-1
43. Saha S, Kiran M, Kuscu C, Chatrath A, Wotton D, Mayo MW, et al. Long noncoding RNA DRAIC inhibits prostate cancer progression by interacting with IKK to inhibit NF-κB activation. Cancer Res (2020) 80:950–63. doi: 10.1158/0008-5472.CAN-19-3460
44. You R, Liu Y-P, Lin D-C, Li Q, Yu T, Zou X, et al. Clonal mutations activate the NF-kB pathway to promote recurrence of nasopharyngeal carcinoma. Cancer Res (2019) 79:5930–43. doi: 10.1158/0008-5472.CAN-18-3845
45. Bhat KPL, Balasubramaniyan V, Vaillant B, Ezhilarasan R, Hummelink K, Hollingsworth F, et al. Mesenchymal Differentiation Mediated by NF-κB Promotes Radiation Resistance in Glioblastoma. Cancer Cell (2013) 24:331–46. doi: 10.1016/j.ccr.2013.08.001
46. Hou Y, Liang H, Rao E, Zheng W, Huang X, Deng L, et al. Non-canonical NF-κB Antagonizes STING Sensor-Mediated DNA Sensing in Radiotherapy. Immunity (2018) 49:490–503.e4. doi: 10.1016/j.immuni.2018.07.008
47. Sakurai K, Reon BJ, Anaya J, Dutta A. The lncRNA DRAIC/PCAT29 locus constitutes a tumor-suppressive nexus. Mol Cancer Res (2015) 13:828–38. doi: 10.1158/1541-7786.MCR-15-0016-T
48. Molenaar RJ, Botman D, Smits MA, Hira VV, van Lith SA, Stap J, et al. Radioprotection of IDH1-mutated cancer cells by the IDH1-mutant inhibitor AGI-5198. Cancer Res (2015) 75:4790–802. doi: 10.1158/0008-5472.CAN-14-3603
49. Wang Y, Wild AT, Turcan S, Wu WH, Sigel C, Klimstra DS, et al. Targeting therapeutic vulnerabilities with PARP inhibition and radiation in IDH-mutant gliomas and cholangiocarcinomas. Sci Adv (2020) 6:eaaz3221. doi: 10.1126/sciadv.aaz3221
50. Dittmann LM, Danner A, Gronych J, Wolter M, Stühler K, Grzendowski M, et al. Downregulation of PRDX1 by promoter hypermethylation is frequent in 1p/19q-deleted oligodendroglial tumours and increases radio-and chemosensitivity of Hs683 glioma cells in vitro. Oncogene (2012) 31:3409–18. doi: 10.1038/onc.2011.513
Keywords: The Cancer Genome Atlas, low-grade glioma, bioinformatics, long non-coding RNA, radiosensitivity
Citation: Li Z, Cai S, Li H, Gu J, Tian Y, Cao J, Yu D and Tang Z (2021) Developing a lncRNA Signature to Predict the Radiotherapy Response of Lower-Grade Gliomas Using Co-expression and ceRNA Network Analysis. Front. Oncol. 11:622880. doi: 10.3389/fonc.2021.622880
Received: 10 November 2020; Accepted: 15 January 2021;
Published: 09 March 2021.
Edited by:
Haotian Zhao, New York Institute of Technology, United StatesReviewed by:
Ibrahim Abdelrahim Qaddoumi, St. Jude Children’s Research Hospital, United StatesCopyright © 2021 Li, Cai, Li, Gu, Tian, Cao, Yu and Tang. This is an open-access article distributed under the terms of the Creative Commons Attribution License (CC BY). The use, distribution or reproduction in other forums is permitted, provided the original author(s) and the copyright owner(s) are credited and that the original publication in this journal is cited, in accordance with accepted academic practice. No use, distribution or reproduction is permitted which does not comply with these terms.
*Correspondence: Zaixiang Tang, dGFuZ3p4QHN1ZGEuZWR1LmNu; Dong Yu, eXVkb25nQHN1ZGEuZWR1LmNu
Disclaimer: All claims expressed in this article are solely those of the authors and do not necessarily represent those of their affiliated organizations, or those of the publisher, the editors and the reviewers. Any product that may be evaluated in this article or claim that may be made by its manufacturer is not guaranteed or endorsed by the publisher.
Research integrity at Frontiers
Learn more about the work of our research integrity team to safeguard the quality of each article we publish.