
94% of researchers rate our articles as excellent or good
Learn more about the work of our research integrity team to safeguard the quality of each article we publish.
Find out more
ORIGINAL RESEARCH article
Front. Oncol., 07 May 2021
Sec. Cancer Imaging and Image-directed Interventions
Volume 11 - 2021 | https://doi.org/10.3389/fonc.2021.614052
This article is part of the Research TopicRadiomics-Based Tumor Phenotyping in Precision MedicineView all 44 articles
 ZhiYuan Zhang1,2,3†
 LiJun Shen1,2,3†Yan Wang1,2,3†
 Jiazhou Wang1,2,3Hui Zhang1,2,3
 Fan Xia1,2,3JueFeng Wan1,2,3
 Zhen Zhang1,2,3*
Background and Purpose: Locally advanced rectal cancer (LARC) is a heterogeneous disease with little information about KRAS status and image features. The purpose of this study was to analyze the association between T2 magnetic resonance imaging (MRI) radiomics features and KRAS status in LARC patients.
Material and Methods: Eighty-three patients with KRAS status information and T2 MRI images between 2012.05 and 2019.09 were included. Least absolute shrinkage and selection operator (LASSO) regression was performed to assess the associations between features and gene status. The patients were divided 7:3 into training and validation sets. The C-index and the average area under the receiver operator characteristic curve (AUC) were used for performance evaluation.
Results: The clinical characteristics of 83 patients in the KRAS mutant and wild-type cohorts were balanced. Forty-two (50.6%) patients had KRAS mutations, and 41 (49.4%) patients had wild-type KRAS. A total of 253 radiomics features were extracted from the T2-MRI images of LARC patients. One radiomic feature named X.LL_scaled_std, a standard deviation value of scaled wavelet-transformed low-pass channel filter, was selected from 253 features (P=0.019). The radiomics-based C-index values were 0.801 (95% CI: 0.772-0.830) and 0.703 (95% CI: 0.620-0.786) in the training and validation sets, respectively.
Conclusion: Radiomics features could differentiate KRAS status in LARC patients based on T2-MRI images. Further validation in a larger dataset is necessary in the future.
Colorectal cancer (CRC) is one of the most prevalent cancers worldwide, and locally advanced rectal cancer (LARC) shows strong heterogeneity in real-world medical practice. The best treatment strategy for LARC patients still depends on the findings of further clinical trials.
KRAS mutation status has a strong relationship with the prognosis of CRC patients. In rectal cancer patients, KRAS mutant (KRAS-mut) patients have a worse prognosis (1), which emphasizes the importance of detecting KRAS status for prognostic evaluation and treatment strategy selection. Among metastatic CRC patients, RAS mutation is a negative predictive biomarker for treatment with epidermal growth factor receptor (EGFR) antibody therapies such as cetuximab and panitumumab (2). The role of KRAS status in stage III CRC patients is still being investigated. Years ago, researchers held the position that KRAS status was not associated with worse overall survival (OS) or disease-free survival (DFS) (3). With follow-up data maturing and treatments evolving, more studies are challenging this opinion based on the findings that KRAS-mut patients have worse OS and DFS (4, 5). Notably, most of these studies were conducted in CRC patients, and the number of patients with KRAS mutations was limited because their main research objective was immune-related biomarkers. As a result, the effect of targeted therapy in LARC patients remains unclear. From limited clinical trials, KRAS status was shown to be a significant predictor in multivariate analysis, and KRAS-mut patients had a worse response to neoadjuvant radiochemotherapy with worse OS than KRAS wild-type (KRAS-wild) patients (1, 6–8). Hence, information on KRAS mutation status has great meaning for physicians in predicting patient response to neoadjuvant chemotherapy and prognosis in practical medical treatment.
Because physicians will choose a targeted treatment strategy for metastatic CRC patients depending on KRAS status, efforts to obtain KRAS status from radiological images have been ongoing for years. To avoid invasive operations, an increasing number of studies on KRAS status and radiological image characteristics have been reported. For decades, several kinds of studies have been conducted on computed tomography (CT) (9)-based, positron emission tomography-CT (PET-CT) (10–17)-based and magnetic resonance imaging (MRI) (18)-based texture features to assess the relationships between genetic mutations and CRC metastatic rectal cancer patients (19). However, the results remain unstable and conflicting, and it is still unfortunate that the effects various radiological technologies remain unknown. Moreover, LARC patients are quite different from metastatic CRC patients in terms of treatment strategies and biological characteristics, especially the KRAS status. Therefore, specific studies on LARC patients deserve more attention.
Radiomics is a rapidly developing image acquisition and analysis technology that is used in various kinds of medical evaluations, especially in the diagnosis and prognosis of patients as well as the classification of different genotypes (20–22). As the first study focused on LARC patients, this study aimed to investigate whether MRI radiomics can predict KRAS status in LARC patients.
A retrospective study of 83 LARC patients was performed. All patients had undergone an MRI examination of the primary tumor and RAS mutation analysis from our center. The inclusion criteria were as follows: (1) the primary tumor was proven to be rectal adenocarcinoma by biopsy; (2) MRI images could be acquired from our image database; and (3) clinical and treatment information could be acquired from our database. This study was approved by the Institutional Review Board of Fudan University Shanghai Cancer Center.
The primary tumor was imaged in a 3.0 Tesla (T) MRI (Signa Horizon, GE Medical Systems, Milwaukee, WI) using a phased-array body coil. The standard imaging protocol consisted of a sagittal T2-weighted (T2W) fast spin-echo image and an oblique axial thin-section T2W image, which was used for contouring the primary tumor.
In RAS mutation analysis, tumor tissue was extracted from patients’ primary tumor sites by rectal biopsy or surgical resection, with formalin-fixed paraffin-embedded (FFPE) primary tumor sections produced using the QIAamp DNA FFPE Tissue Kit (Qiagen, Dusseldorf, Germany.). Mutations in KRAS (exons 2, 3, and 4), NRAS (exons 2, 3, and 4), and BRAF (V600E) were analyzed by the amplification refractory mutation system (AmoyDx Co., Xiamen, China) of samples from pathologic examination.
Regions of interest (ROIs) were distinguished from axial thin-section T2WI images and segmented by two experienced radiation oncologists (4 and 7 years of experience) in MIM software. The gross tumor was included in image delineation, and the air inside the rectum was carefully excluded.
The DICOM images and structure were sent to MATLAB (Math Works Inc.) for radiomics feature calculation and analysis. A total of 253 features were extracted from the ROI images. The features included grey features, texture features, shape features, fractal dimension features, and wavelet features. The detailed algorithm of these features was described by an updated quantitative radiomics standard from Alex (23).
Clinical and radiomics features were extracted from the clinical database and DICOM images of the patients. For clinical features, the chi-square test was performed to compare the differences between two cohorts based on KRAS status. For features from T2WI images, the least absolute shrinkage and selection operator (LASSO) regression algorithm was performed for predictive feature selection and model establishment. The LASSO algorithm is a widely used method for the dimensionality reduction of high-dimensional data in artificial intelligence research and radiomics studies. Selected radiomics features were calculated for the radiomics score (rad-score) based on linear regression in the training cohort, and the formula was used in the validation cohort for rad-score calculation.
The distribution of continuous numeric data was affirmed by the Shapiro-Wilk test. The comparison of continuous numeric data was ascertained by the Kolmogorov-Smirnov test, and categorical data were compared by the chi-square test. The area under the curve (AUC) was used to depict the predictive accuracy of the model. The training set and validation set were divided according to a 7:3 ratio, and the concordance index (C-index) was presented for the result. The C-index can calculate the concordance of the model prediction and actual condition, whose value equals the AUC of the receiver operator characteristic (ROC) curve. And the decision curve analysis (DCA) was also applied. The best cut-off value was based on Youden’s index. A p-value <0.05 (z-value of 1.96) was considered statistically significant.
The packages involved in our research were listed as follow: tableone, MASS for table on creation, caret, lattice, dplyr, glmnet for data analysis and model building, ggplot2, pROC and rmda were used for result visualization and DCA analysis.
The summary profile of this research was shown in Figure 1. A total of 83 LARC patients were included in this study. Fifty-one (61.4%) of these patients were male, and the median age was 55 years, with a range of 29 to 87 years. Among all the patients, 74 (89.2%) were in stage III, and 7 (8.4%) patients were managed with a watch and wait (W&W) strategy. Seventy-six (91.6%) patients received neoadjuvant chemoradiation therapy, and 71 (87.7%) patients underwent surgery. For mutation status, 41 (49.4%) patients had mutations in the KRAS gene, and 2 (97.6%) patients had mutations in the NRAS and BRAF genes. The detailed characteristics are displayed in Table 1.
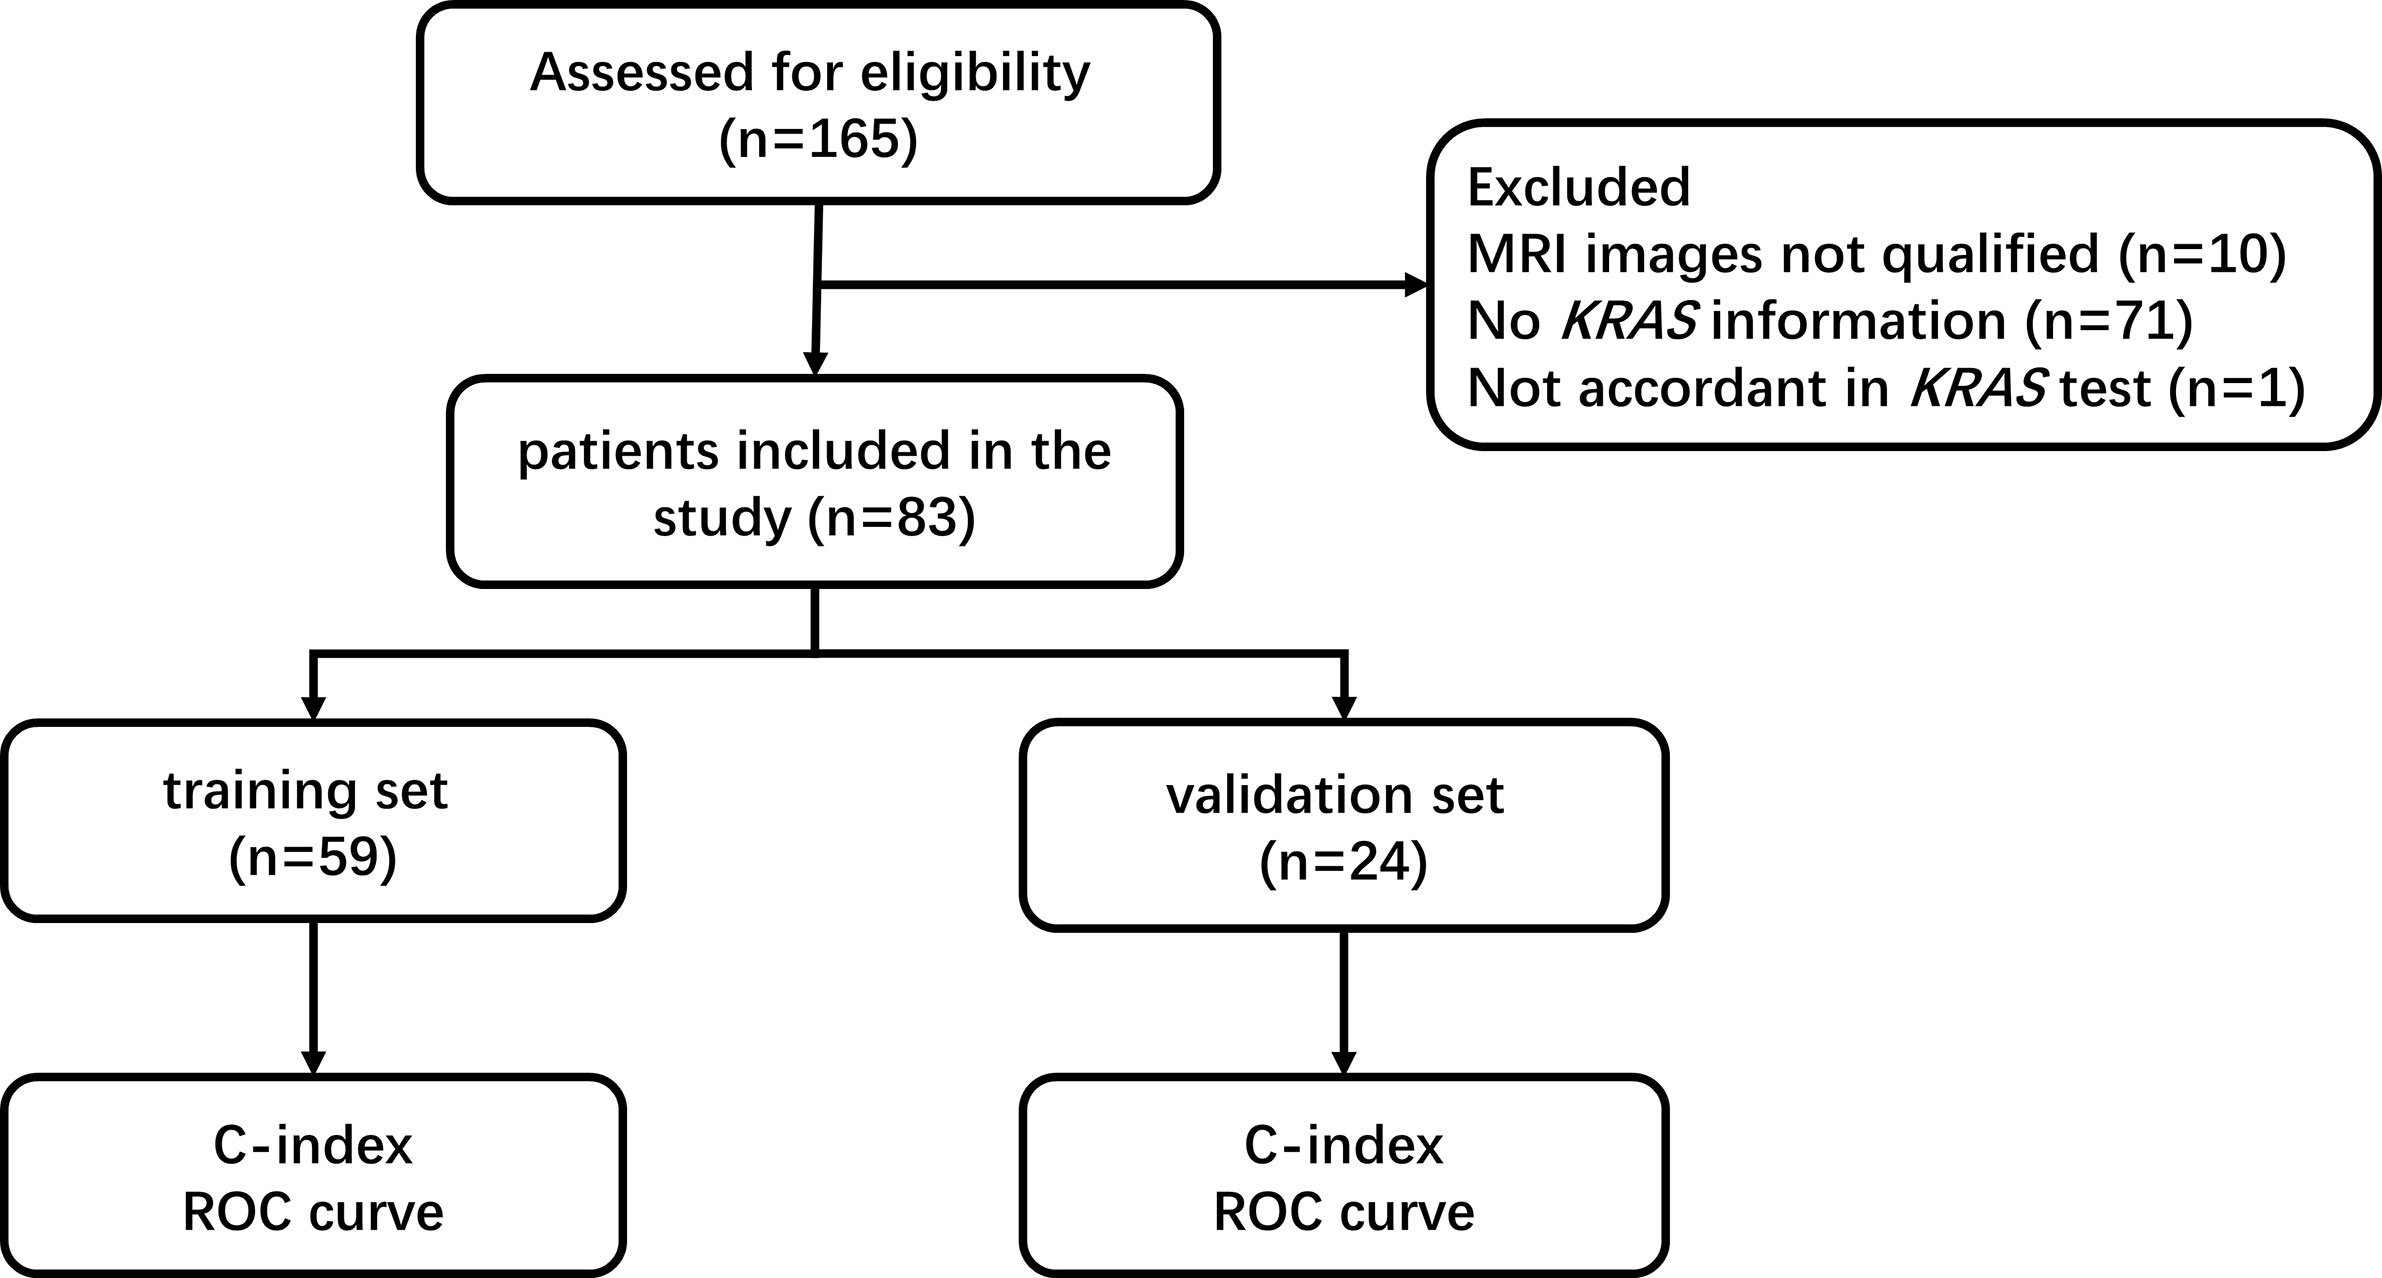
Figure 1 Flow chart of the study.
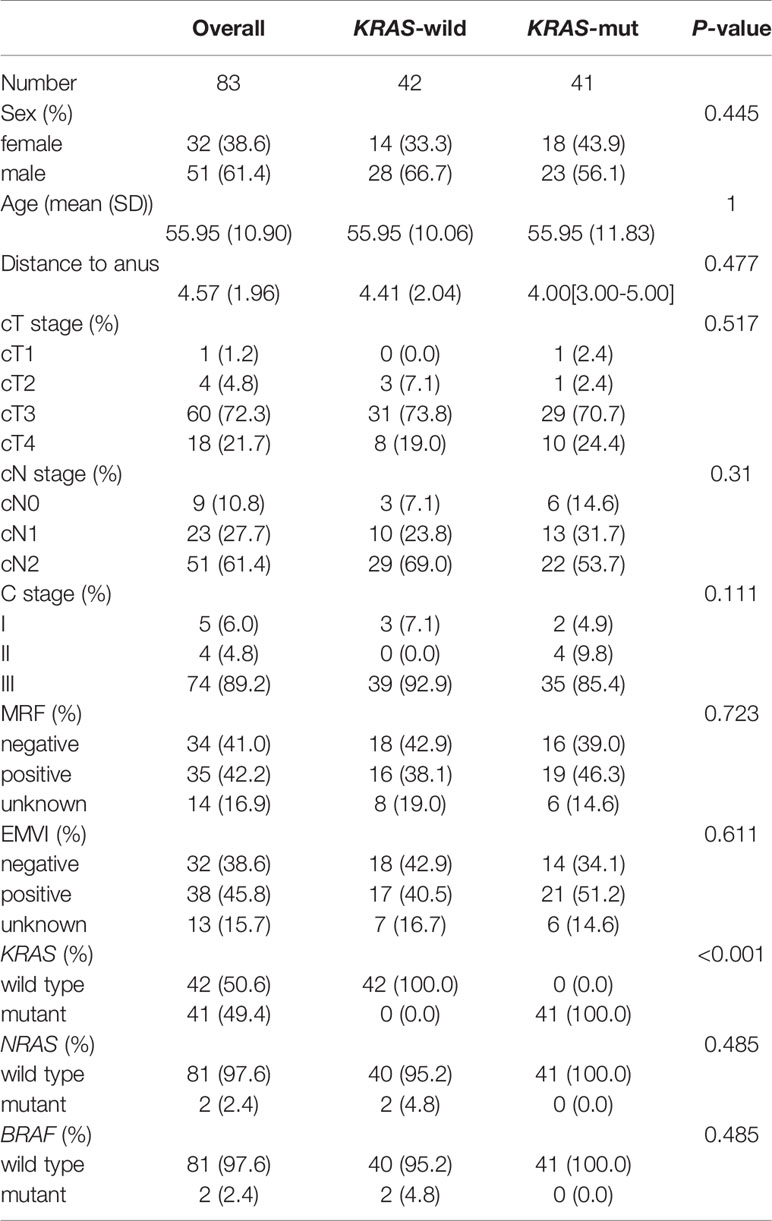
Table 1 Demographic and clinical characteristics of the KRAS-mut and KRAS-wild populations.
The patients were divided into two categories based on KRAS status. For the overall clinical features, no obvious baseline differences were observed between the two cohorts (the details are displayed in Tables 1 and 2).
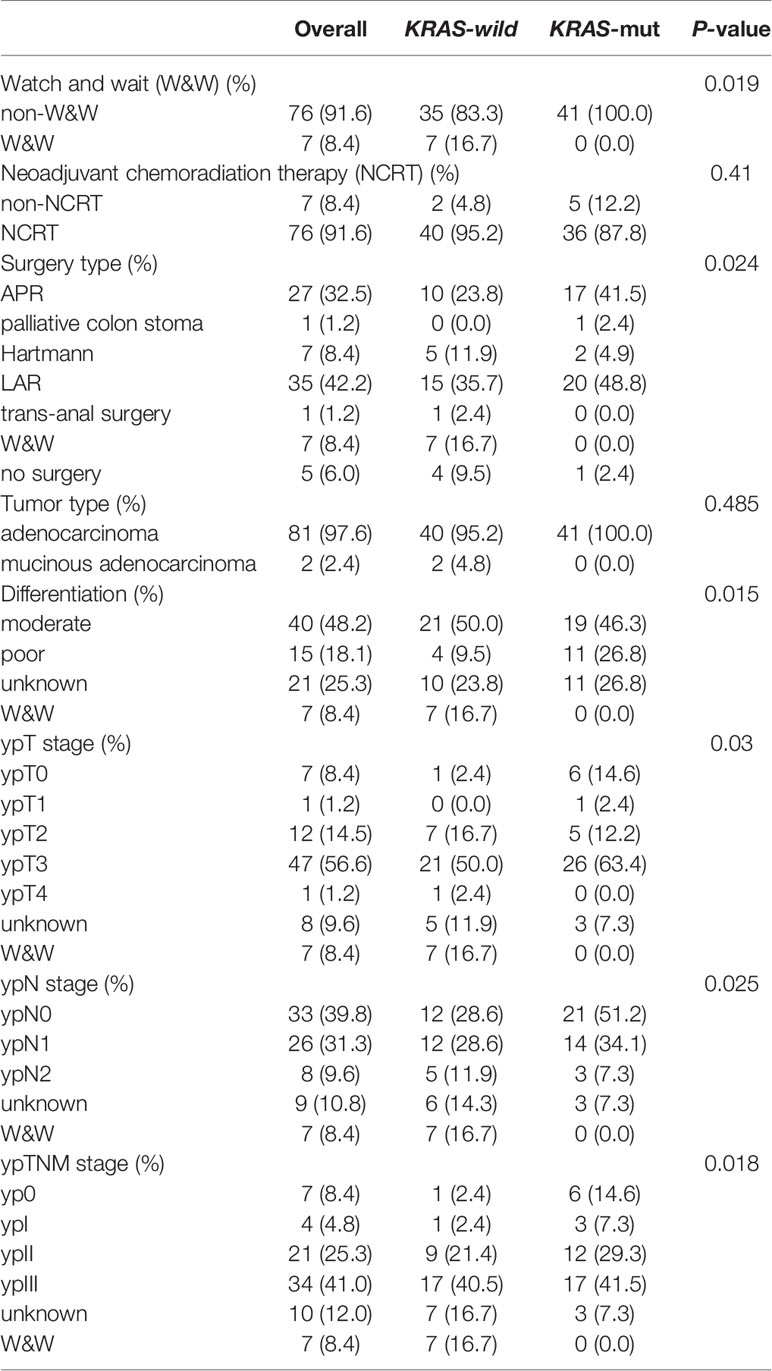
Table 2 Patient treatments and pathological characteristics.
After regression, one radiomic predictor was selected from 253 texture features. This feature is listed in Table 3. Figure 2 presents the tuning parameter (λ) and the coefficient of LASSO regression. Figure 2 presents the distribution of the selected parameter, X.LL_scaled_std, which is the standard deviation value of the scaled wavelet-transformed low-pass channel filter.
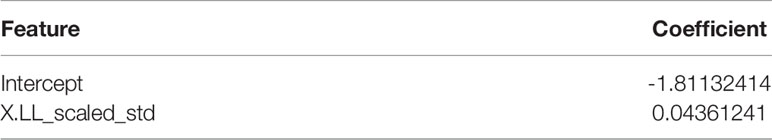
Table 3 Radiomics feature.
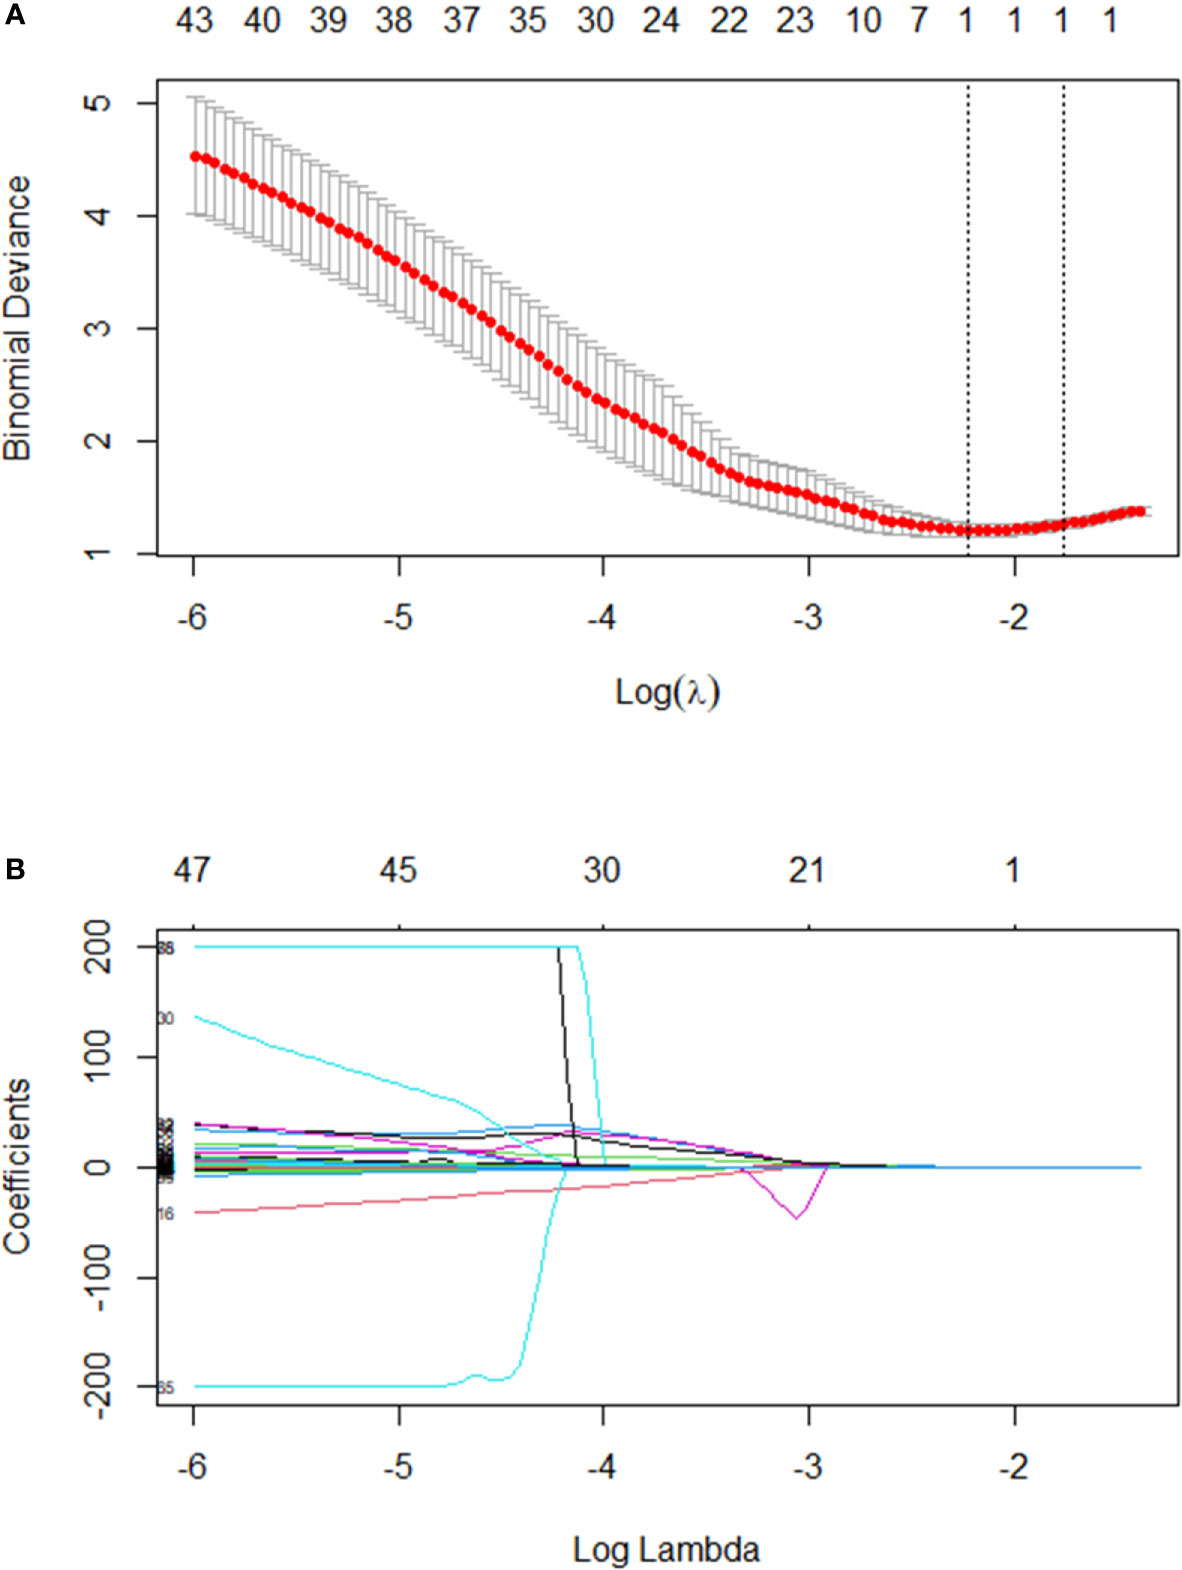
Figure 2 (A) Text features were selected by the LASSO regression model. The performance of the radiomics signature was assessed by the ROC curve and C-index. Tuning parameter (λ) selection used ten-fold cross-validation via the minimum criteria. The optimal value was calculated by the minimum criteria and the 1-standard error of the minimum criteria (the 1-SE criteria). A λ of 0.1782 with log(λ) - 1.75562 was chosen. (B) A LASSO coefficient profile plot was produced against the log(λ) sequence. In addition, one radiomics feature was selected.
Based on the random selection of KRAS-mut and KRAS-wild patients, 59 (70%) patients were distributed to the training set, and 24 (30%) patients were distributed to the validation set. In the training set, there was no significant difference in the baseline information obtained based on the KRAS status cohort, but some differences appeared after neoadjuvant chemoradiation therapy according to the curative effect, as the ypTNM stage. In the validation set, no obvious differences were observed between the two cohorts. Detailed information is shown in Tables 1, 2 and 4.
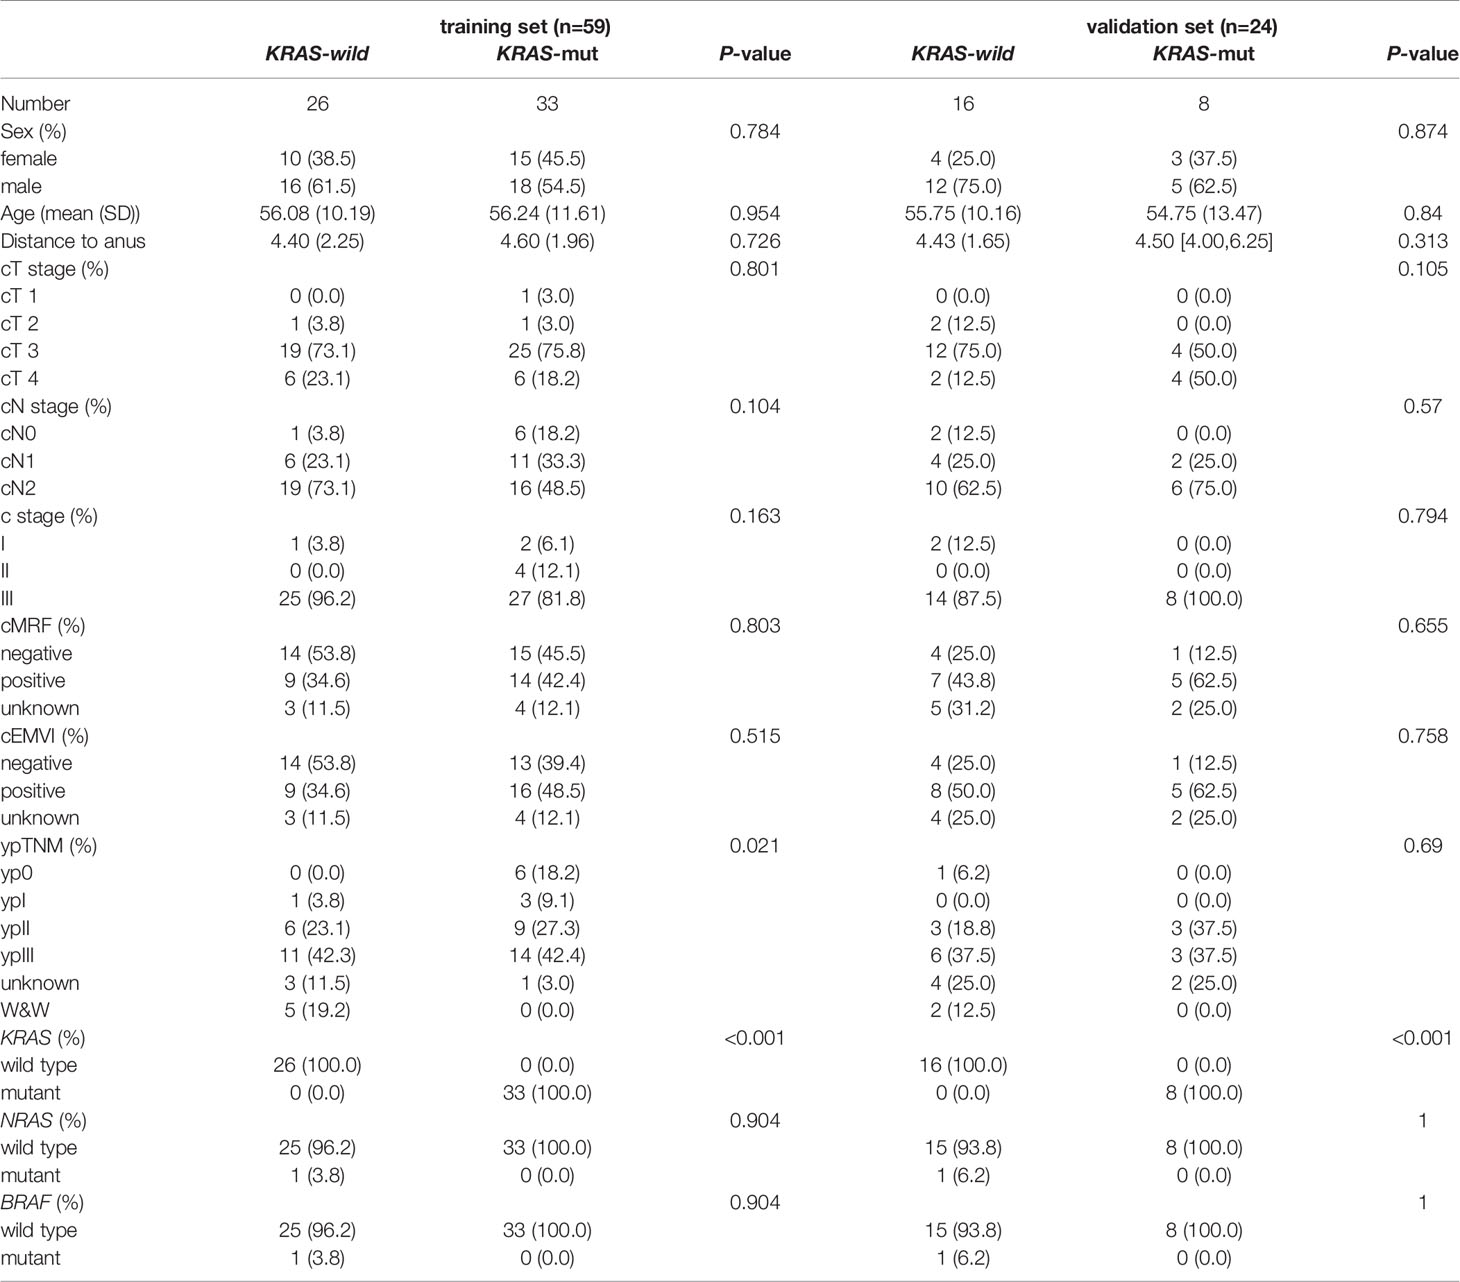
Table 4 Characteristics of patients in the training set and validation set.
In the training set, the predictive model achieved a C-index of 0.801 (95% confidence interval (CI) 0.772-0.830) based on 59 patients’ radiomic image data. The sensitivity and specificity for differentiating tumors with mutant KRAS status from those with wild-type status were 64% and 85.3%, respectively, based on the cut-off value of 0.452. In the validation set, this model achieved a C-index of 0.703 (95% CI 0.620-0.786), which was shown in Figure 3. The sensitivity and specificity for differentiation were 43.8% and 100%, respectively, based on the cut-off value of 0.365. The detailed information was listed in Table 5. The predictive effect of the radiomics model showed a stable performance in both the training set and validation set of LARC patients.
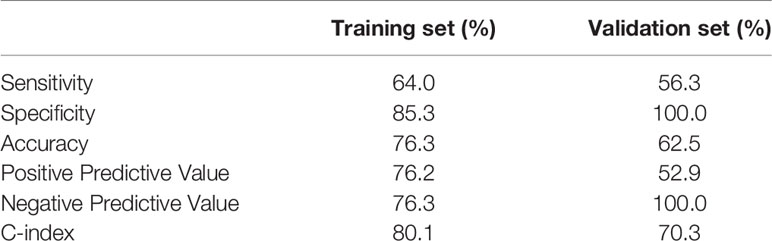
Table 5 Information of prediction performance.
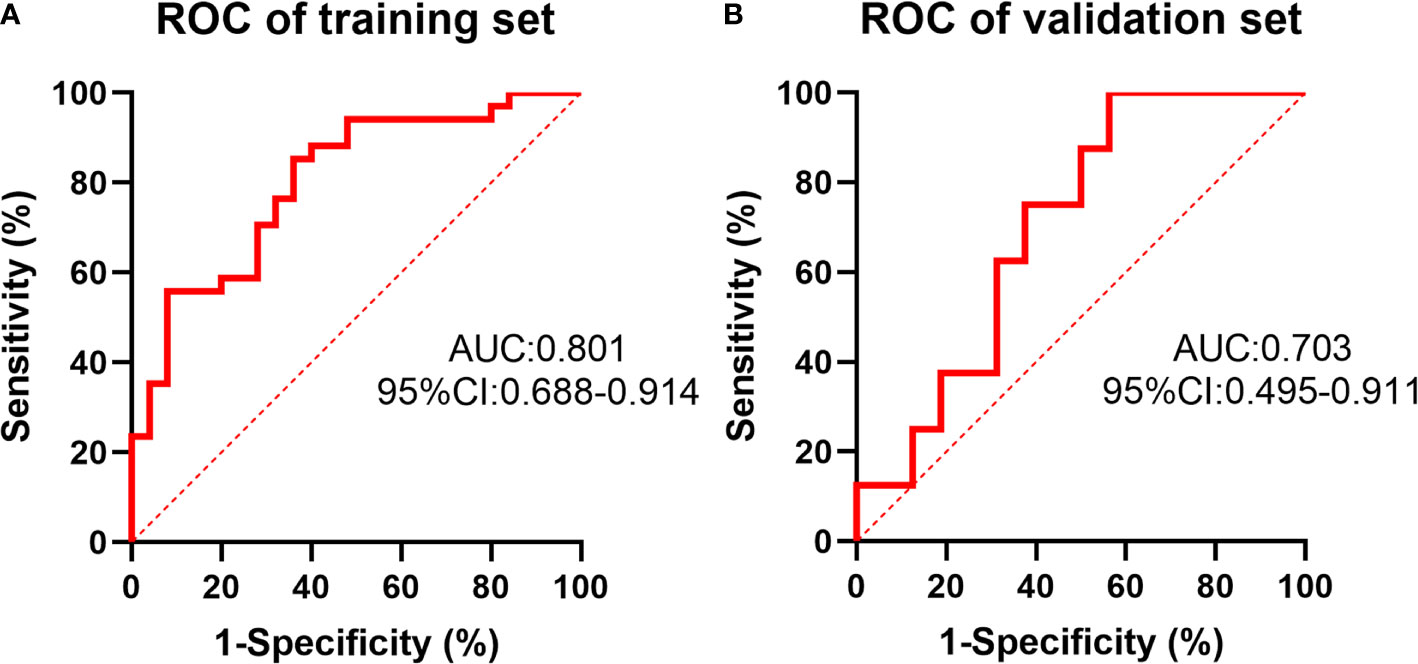
Figure 3 The receiver operating characteristic (ROC) curve of the prediction of KRAS status by the radiomics model in the training set (A) and validation set (B).
The specific values from the predictive model are listed in Supplementary 1. The distributions of patient KRAS status and predictive values are shown in Figure 4, which shows that patients with high prediction values had KRAS-mut status based on our prediction.
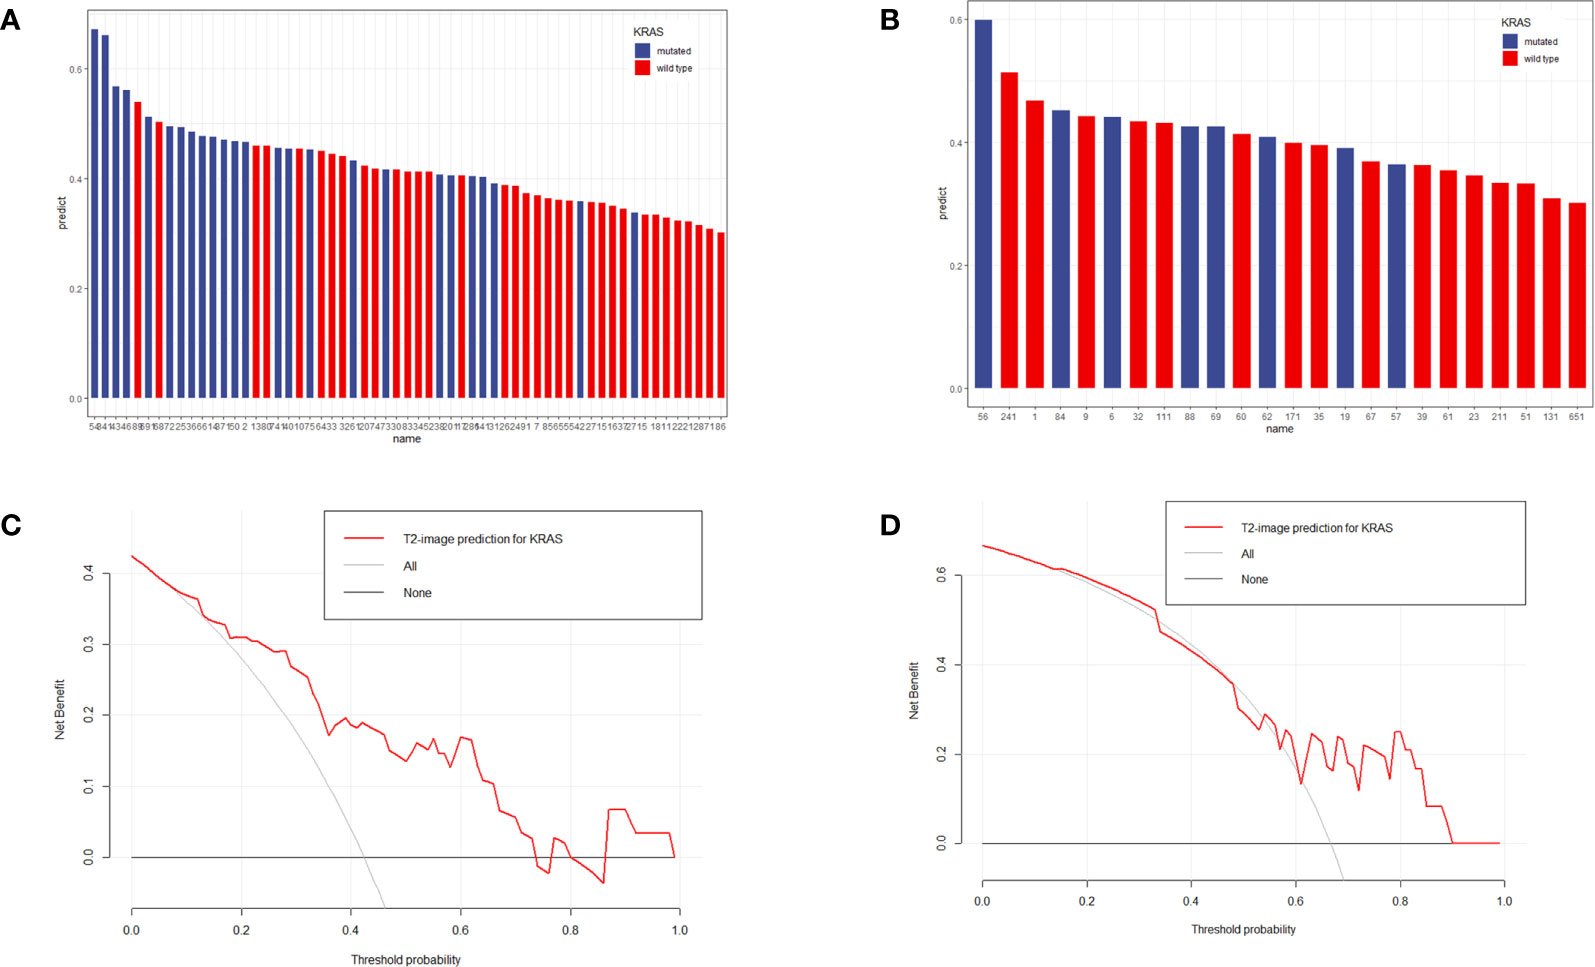
Figure 4 Distribution of prediction values in KRAS-mut and KRAS-wild patients in the training set (A) and validation set (B). The y-axis measures the calculation value of the radiomic model. The blue columns represent actual KRAS-mut patients, and the red columns represent actual KRAS-wild patients. A higher column represents a higher value calculated by the model. According to the image, KRAS-mut patients more frequently obtained higher values than KRAS-wild patients. (C, D) represented the DCA analysis for the training set and validation set.
With years of development of targeted therapy, the targeted therapy strategy based on KRAS status has changed substantially. According to the treatment recommendation of the European Society for Medical Oncology (24), KRAS status is a negative predictive marker for anti-EGFR treatment selection. For LARC patients, even the anti-EGFR strategy did not have improved effects on KRAS wild-type patients in some clinical trials (6, 25); KRAS status still plays a role as a treatment effect biomarker, and LARC patients with the mutation have worse progression-free survival (PFS) (26). Based on the accumulation of evidence on LARC treatments in patients with different KRAS statuses, some clinical trials still present a promising curative effect. A pathological complete response (pCR) rate of 60% was achieved from neoadjuvant radiotherapy combined with capecitabine and sorafenib in KRAS-mut patients in phase II clinical trial (27). This finding hints that the determination of KRAS status is still important in LARC patients.
Nevertheless, the crucial role of KRAS has been reported for years, and the result of gene status can be revealed by only biopsy samples from colonoscopy or surgery in medical practice. Our research aims to detect KRAS status by radiomic to provide earlier information on gene expression as a noninvasive medical practice for patients.
To explore the value of radiomic features, we choose the T2-MRI images for radiomic features selection. As the treatments involving, MRI images have become the necessary tool for cancer staging. Because MRI images have the excellent ability for lymph node recognition, for neoadjuvant treatment selection, LARC patients are recommended to receive MRI examination at first diagnosis (28). Except for the great accessibility of MRI images, compared to other radiological tools, MRI images can also provide distinct tissue contrast for biological information and tumor border delineation.
We have found the value of X.LL_scaled_std, which can differentiate KRAS status with the best performance. This value was calculated to describe the standard deviation of the scaled wavelet-transformed low-pass channel filter. From the result, the higher value was observed in the KRAS mutant cohort. This deviation, as a value that can not detect visually, performed the heterogeneity of the ROI images. Previous research also revealed that higher heterogeneity can be observed in KRAS mutant tumor images, and they also found some value implied the shape characteristic of the tumor, not in our research (29). We believe that the morphological heterogeneity correlated to image reader strongly and tumor stage closely, which needs more researches to determine the delineation standard of ROI, and the role of shape will be clear.
Based on the value we found, the effect of our model is also comparable to other studies based on T2-images in rectal cancer. The prediction based on our research yielded a C-index of 0.703 (95% CI 0.620-0.786), Cui and his colleague got the AUC of 0.682 (95% CI 0.569–0.794) with 0.714 (95% CI 0.602–0.827) in their validation sets (29), and 0.886 from one dataset of oh and his colleagues (30). The researches based on T2-MRI images got a similar ability in the prediction of KRAS status, and some other studies have also focused on the same topic.
From the view of PET-CT, Pierre et al. assessed PET-CT for standardized uptake value (SUV), maximum SUV (SUVmax), mean SUV, skewness, SUV standard deviation, and SUV coefficient of variation (SUVcov). Both SUVcov and SUVmax showed an AUC of 0.65 (17). PET-CT is a great instrument for metabolic demonstration, and some studies presented a relationship between glucose metabolism and RAS status (31). In Pierre’s research, SUVmax was the most distinct parameter for KRAS status; in patients with KRAS mutations, SUVmax presented a higher latitude of elevation. However, these data did not reveal the same correlation between SUVmax and KRAS status (12, 13). SUVcov was also a latent parameter for KRAS recognition in the PET-CT results. Even though the predictive efficacy of treatment based on SUVcov baseline has been shown for neoadjuvant rectal cancer treatment (32), the whole PET-CT parameters show a low sensitivity and specificity of 0.66 (95% CI 0.60–0.73) and 0.67 (95% CI 0.62–0.72) (14), respectively. In summary, PET-CT is a direct demonstration of tumor metabolism but still cannot uncover the strong relationship between the parameters of SUV and KRAS status based on the current evidence.
In addition to studies on PET-CT, some researchers have also focused on CT images and gene characteristics. Lei Yang (9) tried to use CT-based radiomics signatures to predict gene mutations. In their study, five feature sets were extracted from the primary set that was established for model building. The five feature sets included the shape set, grey-level histogram feature set, grey-level co-occurrence matrix feature set, grey-level run-length matrix feature set, and overall feature set. For the validation of the CT-based model, the accuracy of the validation cohort was 0.750 (95% CI, 0.623-0.845), with a sensitivity of 0.686 and a specificity of 0.857. The value of radiomics was highly related to genetic mutations, with P<0.001 and odds ratio (OR) 11.18 (95% CI, 2.88-43.46) in the validation cohort.
Most of these studies focused on CRC patients, and some studies focused on rectal cancer for further research. Yang tried to differentiate KRAS status by CT-based radiomics signatures, and the AUC was 0.829 in the validation set (9). Xu summarized the KRAS-related features in rectal cancer. The mean values of six texture parameters were significantly higher in the KRAS-mut group than in the KRAS-wild group. The AUC values of the texture features ranged from 0.703 to 0.813 and used T2-MRI radiomics to predict KRAS status, and they had an accuracy of 81.7% for the decision tree (18). However, the sample size of their research was 60, and 12% of patients were stage IV (M1), so it is limited in sample size and cohort consistency.
LARC patients have specific clinical characteristics, and T2-MRI radiomics features deserve more exploration based on the limited study focus on such technology.
Our study also has some limitations. First, external validation needs to be performed in the future to consolidate the results. Second, in addition to radiomics, deep learning and other artificial intelligence technologies could be used in image data analysis and model establishment, which may further improve the results. Third, more MRI images with latent bio-information, for example, enhanced sequence and DWI can be achieved for further exploration with KRAS status, which may increase the predictive precision.
To summarize, our study focused on the exploration of the relationship between T2-MRI and KRAS status in LARC patients. We present the strong value of radiomics in the prediction of KRAS status before neoadjuvant chemoradiation therapy and provide a non-invasive method for further targeted therapy strategy selection.
The original contributions presented in the study are included in the article/Supplementary Material. Further inquiries can be directed to the corresponding author.
The studies involving human participants were reviewed and approved by the ethics committee of the Shanghai Cancer Center.
ZZ and LS contributed to conception and design. YW and ZZ collected the data. ZZ analyze and interpreted of data. All authors listed have made a substantial, direct, and intellectual contribution to the work and approved it for publication.
Shanghai Committee of Science and Technology Fund (19DZ1930902) and Xuhui District Artificial Intelligence Medical Hospital Cooperation Project (2020-009).
The authors declare that the research was conducted in the absence of any commercial or financial relationships that could be construed as a potential conflict of interest.
The Supplementary Material for this article can be found online at: https://www.frontiersin.org/articles/10.3389/fonc.2021.614052/full#supplementary-material
LARC, locally advanced rectal cancer; MRI, magnetic resonance imaging; CT, computed tomography; PET-CT, positron emission tomography-CT; LASSO, least absolute shrinkage and selection operator; AUC, area under the receiver operator characteristic curve; ROC, receiver operator characteristic; DCA, decision curve analysis; CRC, colorectal cancer; KRAS-mut, KRAS mutant; KRAS-wild, KRAS wild-type; OS, overall survival; DFS, disease-free survival; ROI, Region of interest.
1. Dai D, Wang Y, Zhu L, Jin H, Wang X. Prognostic value of KRAS mutation status in colorectal cancer patients: a population-based competing risk analysis. PeerJ (2020) 8:e9149. doi: 10.7717/peerj.9149
2. Van Cutsem E, Cervantes A, Adam R, Sobrero A, Van Krieken JH, Aderka D, et al. ESMO consensus guidelines for the management of patients with metastatic colorectal cancer. Ann Oncol (2016) 27(8):1386–422. doi: 10.1093/annonc/mdw235
3. Ogino S, Meyerhardt JA, Irahara N, Niedzwiecki D, Hollis D, Saltz LB, et al. KRAS mutation in stage III colon cancer and clinical outcome following intergroup trial CALGB 89803. Clin Cancer Res (2009) 15(23):7322–9. doi: 10.1158/1078-0432.CCR-09-1570
4. Sperlich A, Balmert A, Doll D, Bauer S, Franke F, Keller G, et al. Genetic and immunological biomarkers predict metastatic disease recurrence in stage III colon cancer. BMC Cancer (2018) 18(1):998. doi: 10.1186/s12885-018-4940-2
5. Taieb J, Shi Q, Pederson L, Alberts S, Wolmark N, Van Cutsem E, et al. Prognosis of microsatellite instability and/or mismatch repair deficiency stage III colon cancer patients after disease recurrence following adjuvant treatment: results of an ACCENT pooled analysis of seven studies. Ann Oncol Off J Eur Soc Med Oncol (2019) 30(9):1466–71. doi: 10.1093/annonc/mdz208
6. Sclafani F, Gonzalez D, Cunningham D, Hulkki Wilson S, Peckitt C, Giralt J, et al. RAS mutations and cetuximab in locally advanced rectal cancer: results of the EXPERT-C trial. Eur J Cancer (Oxford Engl 1990) (2014) 50(8):1430–6. doi: 10.1016/j.ejca.2014.02.002
7. Dewdney A, Cunningham D, Tabernero J, Capdevila J, Glimelius B, Cervantes A, et al. Multicenter randomized phase II clinical trial comparing neoadjuvant oxaliplatin, capecitabine, and preoperative radiotherapy with or without cetuximab followed by total mesorectal excision in patients with high-risk rectal cancer (EXPERT-C). J Clin Oncol (2012) 30(14):1620–7. doi: 10.1200/JCO.2011.39.6036
8. Chow OS, Kuk D, Keskin M, Smith JJ, Camacho N, Pelossof R, et al. KRAS and Combined KRAS/TP53 Mutations in Locally Advanced Rectal Cancer are Independently Associated with Decreased Response to Neoadjuvant Therapy. Ann Surg Oncol (2016) 23(8):2548–55. doi: 10.1245/s10434-016-5205-4
9. Yang L, Dong D, Fang M, Zhu Y, Zang Y, Liu Z, et al. Can CT-based radiomics signature predict KRAS/NRAS/BRAF mutations in colorectal cancer? Eur Radiol (2018) 28(5):2058–67. doi: 10.1007/s00330-017-5146-8
10. Oner AO, Budak ES, Yildirim S, Aydin F, Sezer C. The value of (18)FDG PET/CT parameters, hematological parameters and tumor markers in predicting KRAS oncogene mutation in colorectal cancer. Hell J Nucl Med (2017) 20(2):160–5. doi: 10.1967/s002449910557
11. Lv Y, Wang X, Liang L, Wang L, Lu J. SUVmax and metabolic tumor volume: surrogate image biomarkers of KRAS mutation status in colorectal cancer. Oncol Targets Ther (2019) 12:2115–21. doi: 10.2147/ott.S196725
12. Kawada K, Toda K, Nakamoto Y, Iwamoto M, Hatano E, Chen F, et al. Relationship Between 18F-FDG PET/CT Scans and KRAS Mutations in Metastatic Colorectal Cancer. J Nucl Med (2015) 56(9):1322–7. doi: 10.2967/jnumed.115.160614
13. Krikelis D, Skoura E, Kotoula V, Rondogianni P, Pianou N, Samartzis A, et al. Lack of association between KRAS mutations and 18F-FDG PET/CT in Caucasian metastatic colorectal cancer patients. Anticancer Res (2014) 34(5):2571–9.
14. Kim SJ, Pak K, Kim K. Diagnostic performance of F-18 FDG PET/CT for prediction of KRAS mutation in colorectal cancer patients: a systematic review and meta-analysis. Abdom Radiol (NY) (2019) 44(5):1703–11. doi: 10.1007/s00261-018-01891-3
15. Chen SW, Chiang HC, Chen WT, Hsieh TC, Yen KY, Chiang SF, et al. Correlation between PET/CT parameters and KRAS expression in colorectal cancer. Clin Nucl Med (2014) 39(8):685–9. doi: 10.1097/rlu.0000000000000481
16. Cho A, Jo K, Hwang SH, Lee N, Jung M, Yun M, et al. Correlation between KRAS mutation and (18)F-FDG uptake in stage IV colorectal cancer. Abdom Radiol (NY) (2017) 42(6):1621–6. doi: 10.1007/s00261-017-1054-2
17. Lovinfosse P, Koopmansch B, Lambert F, Jodogne S, Kustermans G, Hatt M, et al. (18)F-FDG PET/CT imaging in rectal cancer: relationship with the RAS mutational status. Br J Radiol (1063) 2016) 89:20160212. doi: 10.1259/bjr.20160212
18. Xu Y, Xu Q, Ma Y, Duan J, Zhang H, Liu T, et al. Characterizing MRI features of rectal cancers with different KRAS status. BMC Cancer (2019) 19(1):1111. doi: 10.1186/s12885-019-6341-6
19. Oh JE, Kim MJ, Lee J, Hur BY, Kim B, Kim DY, et al. Magnetic Resonance-Based Texture Analysis Differentiating KRAS Mutation Status in Rectal Cancer. Cancer Res Treat (2020) 52(1):51–9. doi: 10.4143/crt.2019.050
20. Rizzo S, Petrella F, Buscarino V, De Maria F, Raimondi S, Barberis M, et al. CT Radiogenomic Characterization of EGFR, K-RAS, and ALK Mutations in Non-Small Cell Lung Cancer. Eur Radiol (2016) 26(1):32–42. doi: 10.1007/s00330-015-3814-0
21. Lv J, Zhang H, Ma J, Ma Y, Gao G, Song Z, et al. Comparison of CT radiogenomic and clinical characteristics between EGFR and KRAS mutations in lung adenocarcinomas. Clin Radiol (2018) 73(6):590. doi: 10.1016/j.crad.2018.01.009
22. Lambin P, Leijenaar RTH, Deist TM, Peerlings J, de Jong EEC, van Timmeren J, et al. Radiomics: the bridge between medical imaging and personalized medicine. Nat Rev Clin Oncol (2017) 14(12):749–62. doi: 10.1038/nrclinonc.2017.141
23. Zwanenburg A, Vallières M, Abdalah MA, Aerts HJWL, Andrearczyk V, Apte A, et al. The Image Biomarker Standardization Initiative: Standardized Quantitative Radiomics for High-Throughput Image-based Phenotyping. Radiology (2020) 295(2):328–38. doi: 10.1148/radiol.2020191145
24. Van Cutsem E, Cervantes A, Adam R, Sobrero A, Van Krieken JH, Aderka D, et al. ESMO consensus guidelines for the management of patients with metastatic colorectal cancer. Ann Oncol (2016) 27(8):1386–422. doi: 10.1093/annonc/mdw235
25. Erben P, Ströbel P, Horisberger K, Popa J, Bohn B, Hanfstein B, et al. KRAS and BRAF mutations and PTEN expression do not predict efficacy of cetuximab-based chemoradiotherapy in locally advanced rectal cancer. Int J Radiat Oncol Biol Phys (2011) 81(4):1032–8. doi: 10.1016/j.ijrobp.2010.06.043
26. Sclafani F, Wilson SH, Cunningham D, Gonzalez De Castro D, Kalaitzaki E, Begum R, et al. PIK3CA and TP53 mutations in a large prospective series of locally advanced rectal cancer patients. Int J Cancer (2020) 146(1):94–102. doi: 10.1002/ijc.32507
27. von Moos R, Koeberle D, Schacher S, Hayoz S, Winterhalder RC, Roth A, et al. Neoadjuvant radiotherapy combined with capecitabine and sorafenib in patients with advanced KRAS-mutated rectal cancer: A phase I/II trial (SAKK 41/08). Eur J Cancer (Oxford England: 1990) (2018) 89:82–9. doi: 10.1016/j.ejca.2017.11.005
28. Glynne-Jones R, Wyrwicz L, Tiret E, Brown G, Rodel C, Cervantes A, et al. Rectal cancer: ESMO Clinical Practice Guidelines for diagnosis, treatment and follow-up. Ann Oncol (2017) 28(suppl_4):iv22–40. doi: 10.1093/annonc/mdx224
29. Cui Y, Liu H, Ren J, Du X, Xin L, Li D, et al. Development and validation of a MRI-based radiomics signature for prediction of KRAS mutation in rectal cancer. Eur Radiol (2020) 30(4):1948–58. doi: 10.1007/s00330-019-06572-3
30. Oh JE, Kim MJ, Lee J, Hur BY, Kim B, Kim DY, et al. Magnetic Resonance-Based Texture Analysis Differentiating KRAS Mutation Status in Rectal Cancer. Cancer Res Treat (2020) 52(1):51–9. doi: 10.4143/crt.2019.050
31. Meijer TWH, Looijen-Salamon MG, Lok J, van den Heuvel M, Tops B, Kaanders JHAM, et al. Glucose and glutamine metabolism in relation to mutational status in NSCLC histological subtypes. Thorac Cancer (2019) 10(12):2289–99. doi: 10.1111/1759-7714.13226
Keywords: radiomic, KRAS, prediction, local advanced rectal cancer, magnetic resonance imaging
Citation: Zhang Z, Shen L, Wang Y, Wang J, Zhang H, Xia F, Wan J and Zhang Z (2021) MRI Radiomics Signature as a Potential Biomarker for Predicting KRAS Status in Locally Advanced Rectal Cancer Patients. Front. Oncol. 11:614052. doi: 10.3389/fonc.2021.614052
Received: 05 October 2020; Accepted: 18 March 2021;
Published: 07 May 2021.
Edited by:
Bo Gao, Affiliated Hospital of Guizhou Medical University, ChinaReviewed by:
Tianye Niu, Georgia Institute of Technology, United StatesCopyright © 2021 Zhang, Shen, Wang, Wang, Zhang, Xia, Wan and Zhang. This is an open-access article distributed under the terms of the Creative Commons Attribution License (CC BY). The use, distribution or reproduction in other forums is permitted, provided the original author(s) and the copyright owner(s) are credited and that the original publication in this journal is cited, in accordance with accepted academic practice. No use, distribution or reproduction is permitted which does not comply with these terms.
*Correspondence: Zhen Zhang, emhlbl96aGFuZ0BmdWRhbi5lZHUuY24=
†These authors have contributed equally to this work
Disclaimer: All claims expressed in this article are solely those of the authors and do not necessarily represent those of their affiliated organizations, or those of the publisher, the editors and the reviewers. Any product that may be evaluated in this article or claim that may be made by its manufacturer is not guaranteed or endorsed by the publisher.
Research integrity at Frontiers
Learn more about the work of our research integrity team to safeguard the quality of each article we publish.