
94% of researchers rate our articles as excellent or good
Learn more about the work of our research integrity team to safeguard the quality of each article we publish.
Find out more
ORIGINAL RESEARCH article
Front. Oncol. , 26 March 2021
Sec. Cancer Imaging and Image-directed Interventions
Volume 11 - 2021 | https://doi.org/10.3389/fonc.2021.610338
This article is part of the Research Topic Innovations in Imaging for Early Diagnosis and Monitoring for Patients with Gastrointestinal Cancer View all 29 articles
 Siye Liu1
 Xiaoping Yu1*
 Songhua Yang1
 Pingsheng Hu1
 Yingbin Hu2
 Xiaoyan Chen3
 Yilin Li3
 Zhe Zhang1
 Cheng Li1
 Qiang Lu1
Objective: To establish and validate a radiomics nomogram based on the features of the primary tumor for predicting preoperative pathological extramural venous invasion (EMVI) in rectal cancer using machine learning.
Methods: The clinical and imaging data of 281 patients with primary rectal cancer from April 2012 to May 2018 were retrospectively analyzed. All the patients were divided into a training set (n = 198) and a test set (n = 83) respectively. The radiomics features of the primary tumor were extracted from the enhanced computed tomography (CT), the T2-weighted imaging (T2WI) and the gadolinium contrast-enhanced T1-weighted imaging (CE-TIWI) of each patient. One optimal radiomics signature extracted from each modal image was generated by receiver operating characteristic (ROC) curve analysis after dimensionality reduction. Three kinds of models were constructed based on training set, including the clinical model (the optimal radiomics signature combining with the clinical features), the magnetic resonance imaging model (the optimal radiomics signature combining with the mrEMVI status) and the integrated model (the optimal radiomics signature combining with both the clinical features and the mrEMVI status). Finally, the optimal model was selected to create a radiomics nomogram. The performance of the nomogram to evaluate clinical efficacy was verified by ROC curves and decision curve analysis curves.
Results: The radiomics signature constructed based on T2WI showed the best performance, with an AUC value of 0.717, a sensitivity of 0.742 and a specificity of 0.621. The radiomics nomogram had the highest prediction efficiency, of which the AUC was 0.863, the sensitivity was 0.774 and the specificity was 0.801.
Conclusion: The radiomics nomogram had the highest efficiency in predicting EMVI. This may help patients choose the best treatment strategy and may strengthen personalized treatment methods to further optimize the treatment effect.
Rectal cancer is one of the major causes of cancer-related mortality in the world, with a local recurrence rate of up to 30% related to the surgical technique (1). Local recurrence and metastasis are the main causes of death in patients with rectal cancer, and there is much evidence that extramural venous invasion (EMVI) is an independent predictor of local tumor recurrence, ectopic nodules, distant metastasis and overall mortality (2–4). Therefore, the early identification of EMVI is of great significance for the selection of treatment strategies.
At present, pathological examination is still the gold standard for evaluating the EMVI status of rectal cancer, but the pathological EMVI status can only be obtained after surgery, which is not conducive to early treatment decisions before surgery. Besides, preoperative neoadjuvant therapy may lead to the underestimation of EMVI status in postoperative pathological examination (5). In recent years, studies have shown that preoperative imaging can improve the prognosis of rectal cancer (6). Due to the advantages of high spatial resolution, magnetic resonance imaging (MRI) is an excellent imaging method to detect the adverse prognostic factors of rectal cancer, and it is a promising and repeatable technique for the identification of EMVI. Several studies have shown that MRI has medium to high sensitivity and specificity in detecting EMVI compared with pathological evaluation (7–9). However, it should be noted that MRI may not be able to correctly identify the invasion of small extramural and intramural vessels, which leads to the low sensitivity of conventional MRI in the evaluation of EMVI (10, 11). On the other hand, computed tomography (CT) can assess the entire abdomen, pelvis and chest, allowing for local staging and distant metastasis evaluation (12, 13). Accordingly, modern CT techniques are better suited than MRI to search for the local tumor extent and distant metastases in the same imaging session (14). It is well known that EMVI is associated with disease recurrence, especially in patients with distant metastasis to the liver (15). Therefore, to some extent, preoperative CT may help identify EMVI indirectly. However, the sensitivity of CT for identifying EMVI was low due to its low resolution in soft tissue (16).
Radiomics is a noninvasive and relatively cost-effective image evaluation technology (17, 18). At present, radiomics technology has been widely used in the field of rectal cancer for tumor staging, prognosis evaluation and metastasis prediction (19). However, to our knowledge, only Yu et al. have focused on predicting EMVI based on radiomics (20). But their results showed that their radiomics model had poor stability and low sensitivity, which may be resulted from their small amount of data and defects in the modeling method. In fact, predictive and prognostic models are an important part of radiology (21), and highly accurate and reliable models are needed to improve decision support in clinical practice. Machine learning can be helpful in this respect (22). Therefore, we hypothesized that a radiomics model constructed based on machine learning can improve the prediction accuracy of EMVI, thus enhancing the application of noninvasive and cost-effective radiomics in the preoperative prediction of EMVI.
The main purpose of this study was to construct and validate a radiomics nomogram using machine learning to provide a convenient and quick tool to accurately predict preoperative EMVI in clinical practice.
This retrospective study was approved by the ethics committee of our institution, and informed consent was not required. A total of 281 patients who underwent radical resection of rectal cancer from April 2012 to May 2018 were included in this study, and their preoperative clinical and imaging data were retrospectively analyzed. The inclusion criteria were as follows: (1) pathologically confirmed non-mucinous rectal adenocarcinoma after surgery, and (2) completed baseline MRI and CT examinations before surgery. The exclusion criteria were as follows: (1) received preoperative antitumor treatment for rectal cancer, (2) incomplete clinical, pathological or imaging data, or (3) poor quality of CT or MRI images. All patients were grouped into a training set (n = 198; between April 2012 and May 2016) and a test set (n = 83; between June 2016 and April 2018) at a ratio of 7:3. The training set was used to build the radiomics nomogram, and the test set was used for model validation.
All patients were examined by abdominal CT and pelvic (rectum) MRI within 1 week before surgical operation. All MRI examinations were performed with a 3.0-T MRI scanner (Discovery 750W®, GE Healthcare, Waukesha, WI). The MRI sequences included high-resolution T2-weighted imaging (T2WI) (transverse, coronal and sagittal), T1-weighted imaging (T1WI) (transverse), diffusion-weighted imaging (DWI) (transverse) and gadolinium contrast-enhanced T1WI (CE-T1WI) (transverse) sequences. For venous phase CE-T1WI, the contrast agent gadodiamide (Omniscan®, GE Medical System, NJ) was intravenously administered at a dose of 0.1 mmol/kg of body weight with a flow rate of 3.5 ml/s using a power injector, followed by a bolus injection of 20 ml of normal saline. Plain and enhanced CT images were obtained using a 256-detector row CT scanner (Revolution Xtream®, GE Healthcare, Waukesha, WI). For enhanced CT imaging, the injection rate of the contrast medium (Omnipaque® 350, GE Medical System, NJ) was 2.5 ml/s, and the scan was performed after a 50-s delay. The specific scanning parameters are provided in the additional materials.
Pathological reports were retrieved and reviewed to obtain EMVI status. Two experienced pathologists (pathologist A and pathologist B, both of whom had experience of more than 10 years in the diagnosis of rectal cancer and were blinded to the CT and MRI data) independently extracted the EMVI status from the report. The pathological definition of EMVI is the presence of tumor tissue in the endothelium-lined lumen, which is surrounded by smooth muscle edges or contains red blood cells (23). If there was conflicting information between the EMVI assessment and other descriptions in the pathological or surgical report, the two pathologists would discuss the case and reach a consensus. Finally, 125 EMVI-positive cases and 156 EMVI-negative cases were identified.
To distinguish pathological EMVI, we defined the EMVI status evaluated by MRI as mrEMVI. A five-point scoring system was used for the assessment of mrEMVI (2, 8). The details of scoring from 0 to 4 are described in the supporting materials. A score of 0-2 was defined as mrEMVI-negative, and a score of 3-4 was defined as mrEMVI-positive.
Region of interest (ROI) segmentation was performed on CT and MRI images by ITK-SNAP software (http://www.itksnap.org). For CT, segmentation was based on venous phase–enhanced images. While for MRI, segmentation was based on T2WI and CE-T1WI. The above segmentation was manually completed by two experienced radiologists (radiologist A and radiologist B, with experience of 5 and 12 years in tumor imaging, respectively) who were blinded to the pathological information. Then, the segmented image was imported into quantitative Analysis Kit (AK, version 1.2, GE Healthcare) for image preprocessing, including resampling the image to a 1 × 1 × 1 mm3 voxel size and standardizing the image gray level to a scale of 1 to 32 to eliminate the influence of anisotropy on the extracted features (24). The image gray-scale intensity level was discretized and normalized by down-sampling each image to 32 bins to reduce image noise. Using such fixed values and number of bins the image gray range was divided into equally spaced intervals. Therefore, the bin size and intensity resolution of the discretized volumes depended on the gray-scale value (i.e., four bin sizes for each gray-level). Then, 378 radiomics features were extracted from the preprocessed images of each mode, including histogram features, Form Factor features, gray level co-occurrence matrix (GLCM) features, run-length matrix (RLM) features and gray level size zone matrix (GLSZM) features. These features have been shown to be characteristic of cancer heterogeneity and may reflect changes in image structure (18). Details of the features are provided in the additional materials. In addition, to ensure the robustness of the extracted features, we used the most effective feature among different radiologists for manual segmentation. The Spearman rank correlation test was used to calculate the correlation coefficient (CC) of each feature between feature set A (from radiologist A) and feature set B (from radiologist B). Features with CC > 0.8 were considered robust features (25). The feature values in this study were the average values of feature set A and feature set B.
The existence of a “curse of dimensionality” usually makes data simplification or feature selection necessary to obtain meaningful results from pattern recognition analysis (26). Therefore, it is necessary to reduce the dimensionality of the extracted robust features. The process of dimensionality reduction consists of two steps. First, the minimum redundancy maximum correlation (mRMR) algorithm was used to reduce the dimensionality of the robust features of the training set. The purpose of the maximum correlation program is to select features that are most relevant to the EMVI state. At the same time, the minimum redundancy process ensures minimum redundancy between the selected features to obtain the optimal features with a high correlation and a low redundancy (27). After that, the least absolute shrinkage and selection operator (LASSO) algorithm was used to select the features for constructing the radiomics signature from the best feature sets. Finally, logistic regression was used to construct the radiomics signature. In addition, to quantify the accuracy of the signature constructed by different modes (enhanced CT, T2WI and CE-T1WI), we calculated the EMVI-positive probability score of each case using the radiomics formula of the training set, which was defined as the rad score. Moreover, a receiver operating characteristic (ROC) curve was used to visualize the experimental results using data from the test set, and the area under the curve (AUC) values of the training and test sets were calculated to quantify the prediction performance of the radiomics signature. In addition, to further select the optimal radiomics signature, we used the DeLong test to compare the performance of signatures from different modes.
The clinical characteristics of the training set, including gender, age, tumor location, carcinoembryonic antigen (CEA), degree of pathological differentiation, and mrEMVI, were analyzed by stepwise logistic regression to select the independent clinical predictors of EMVI. According to the best radiomics signature selected by the DeLong test, different joint models were built using support vector machine (SVM) combined with each independent predictor. SVM is a kind of supervised learning model that is commonly used in pattern recognition, classification and regression analysis. In recent years, it has been successfully applied to the diagnosis, prognosis prediction and treatment of various diseases (28).
To compare the performance of each model, we use the ROC curve to evaluate the performance of the model in the training set and used the data of the test set for verification. Finally, the optimal model was selected to generate a visual radiomics nomogram. The Hosmer-Lemeshow test was used to analyze the goodness of fit of the nomogram. The calibration curve was used to measure the consistency between the predicted EMVI probability and the EMVI probability. In addition, to evaluate the clinical efficacy of the nomogram, we used the nomogram to calculate the prediction score of EMVI for each patient. Taking the best cutoff value corresponding to the Youden index threshold of the ROC curve of training set as the classification point (29), all patients were divided into a low-risk group and a high-risk group according to the prediction score, and the number of patients with EMVI-positive between the two groups was compared.
All statistical analyses in the present study were performed with SPSS (version 25.0), R 3.5.1 and Python 3.5.6. The Kolmogorov–Smirnov test was used for the normality testing of the measurement data. The normally distributed data were evaluated using the independent sample t-test, whereas the nonnormally distributed data were evaluated using the Mann–Whitney U test. The differences between categorical variables were tested by the chi-square test. ICC estimates and their 95% confident intervals were calculated using SPSS statistical package version 25 based on a mean-rating (k = 2), absolute-agreement, 2-way mixed-effects model. A two-tailed p-value < 0.05 was regarded as significantly different.
The research flow chart is shown in Figure 1. There were no significant differences in any of clinical features between the training and test sets, as shown in Table 1. There were significant differences in lymph node metastasis and mrEMVI between patients who were EMVI-negative and patients who were EMVI-positive in the training and test sets. See Table 2 for details.
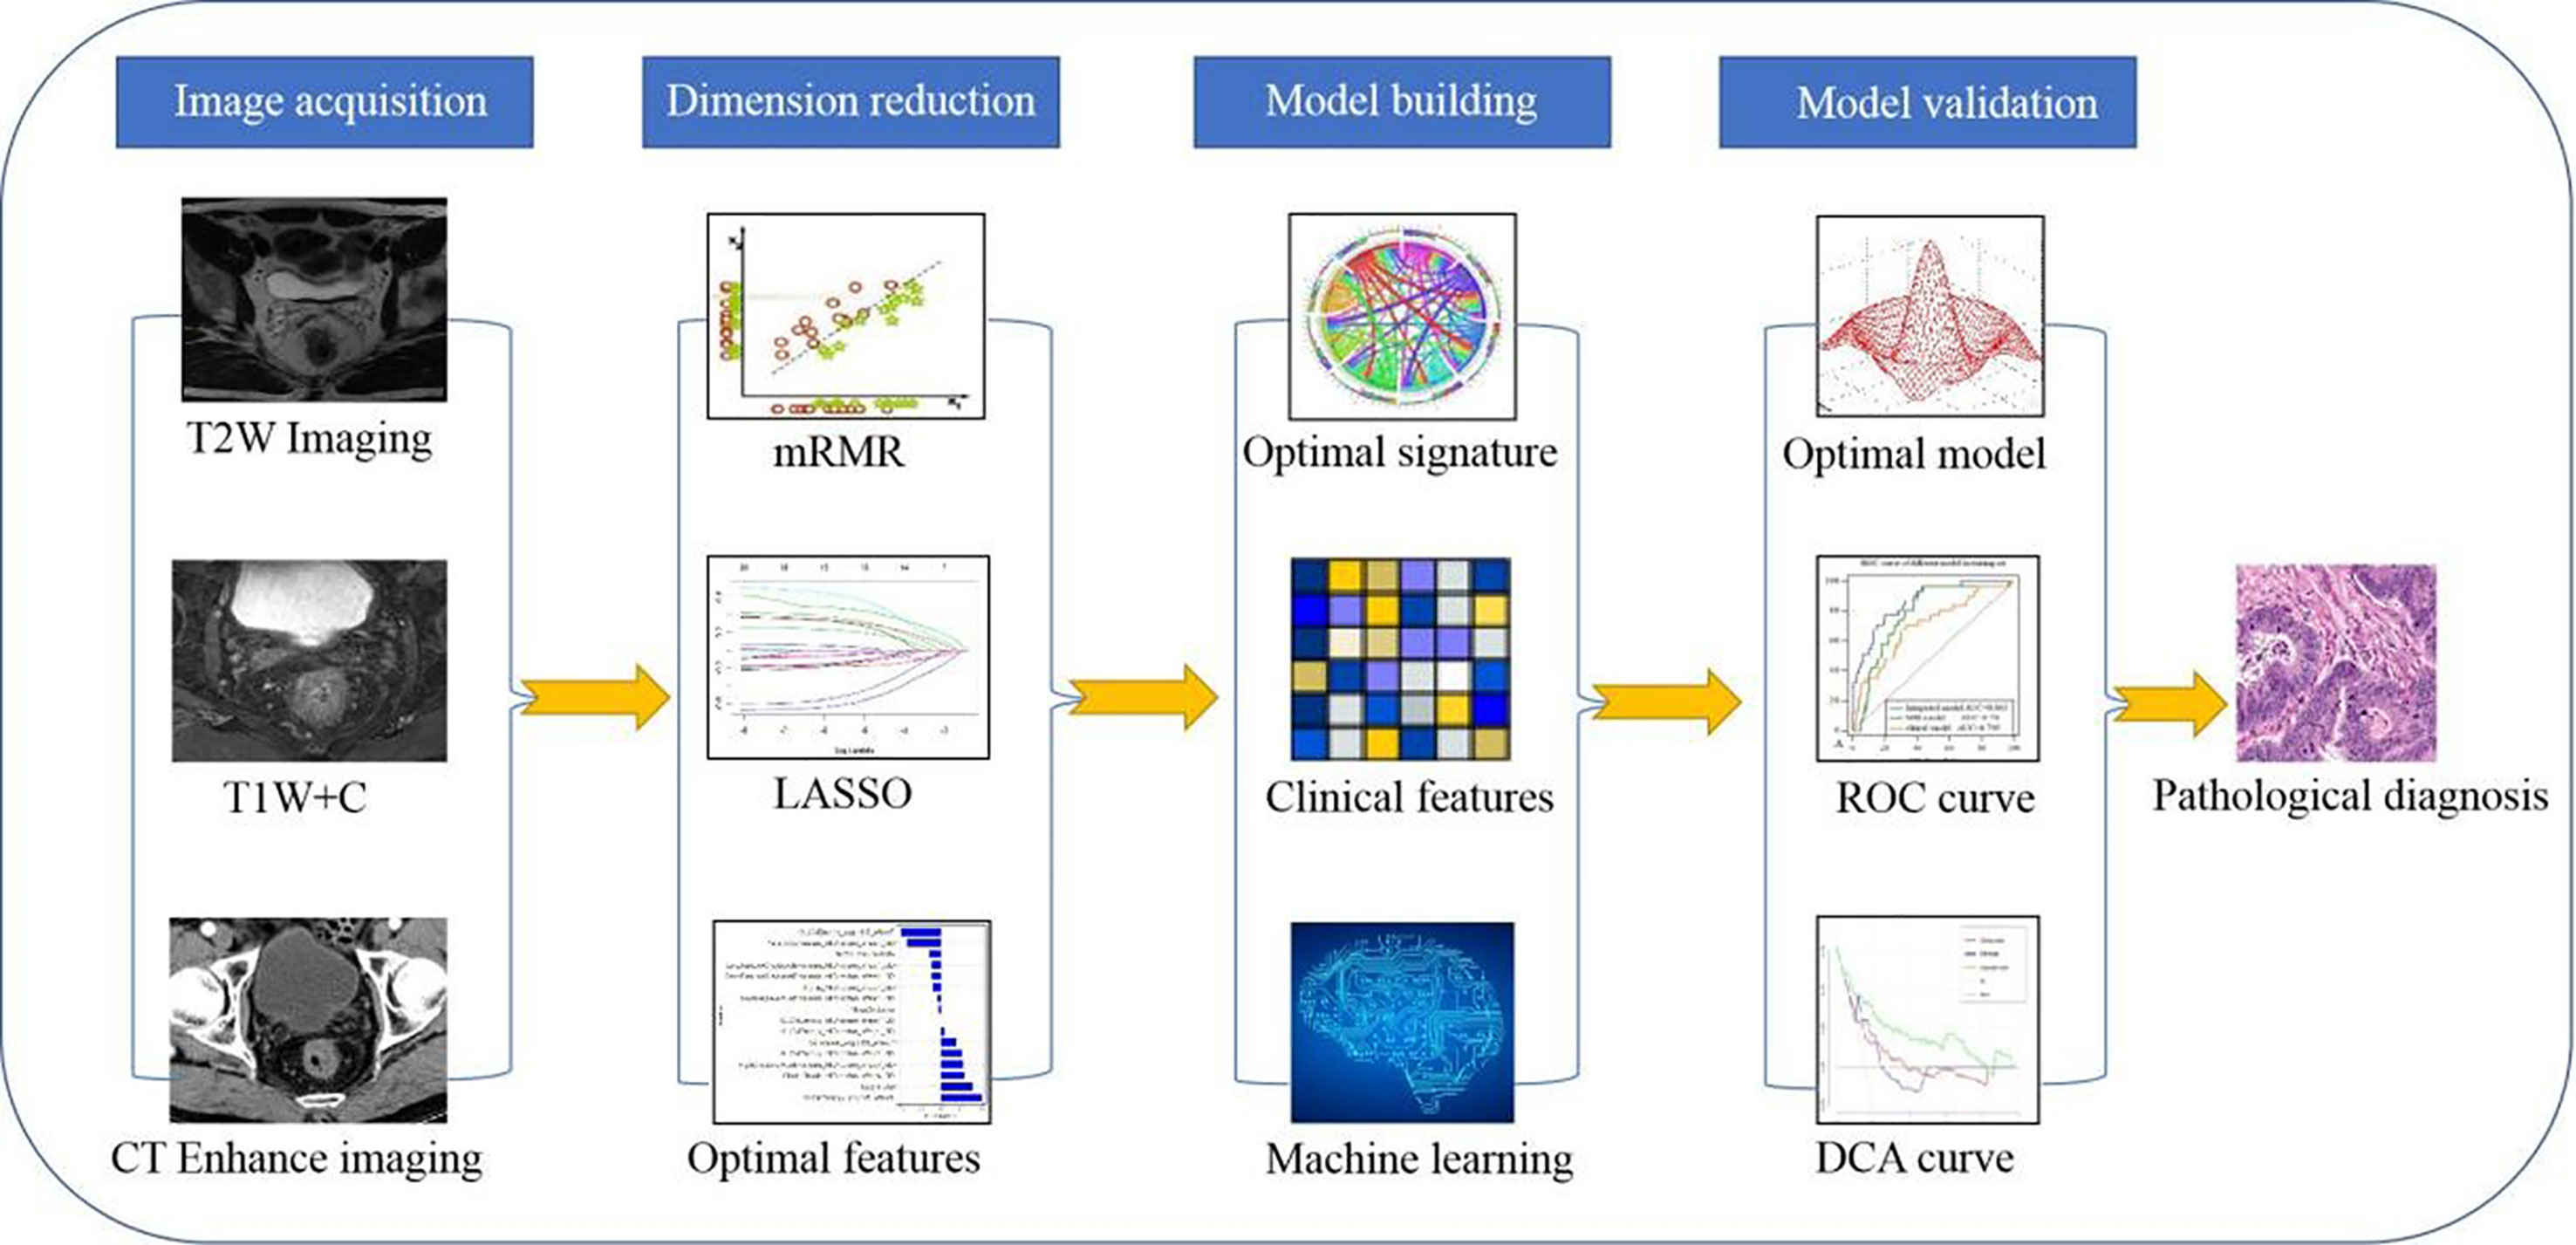
Figure 1 Research flow chart of the radiomics model.
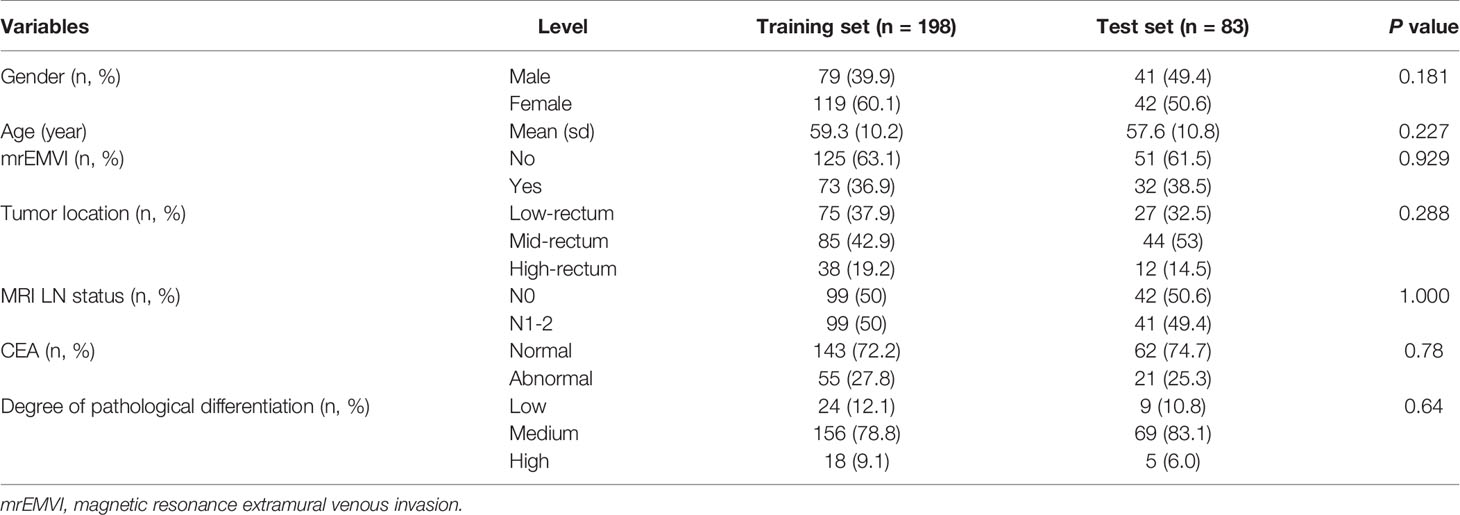
Table 1 Descriptive statistics of the two sets.
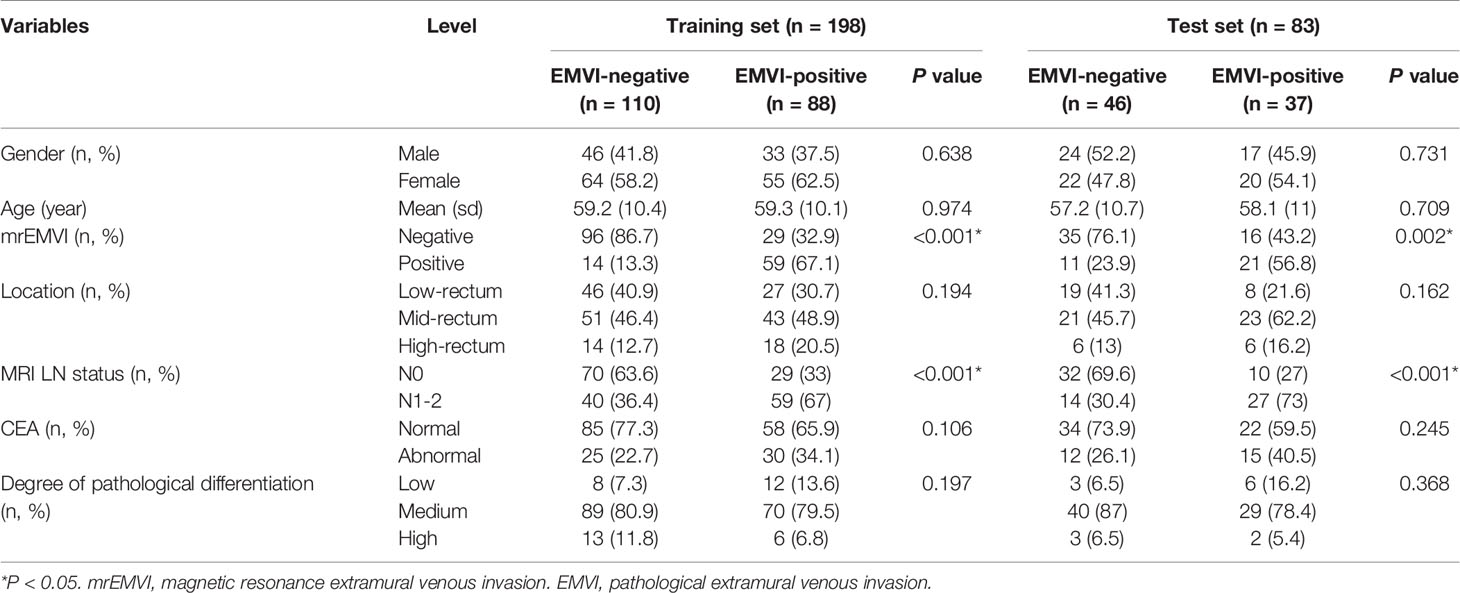
Table 2 Clinical characteristics of the training and test sets.
As is shown in Figure 2, the remaining 16, 20 and 19 features after dimensionality reduction were extracted from enhanced CT, T2WI and CE-T1WI images respectively. The performance of the radiomics signature based on these features both in the training set and in the test set are as shown in Figure 3. The DeLong test showed that there was no significant difference in the AUC values among the three radiomics signatures in the training set and the test set (P > 0.05). Therefore, we selected the signature constructed by T2WI as the optimal signature for the construction of the joint model. Acquiring T2WI image can avoid both radiation damage and medical risk caused by contrast medium. In addition, the rad score was calculated based on each signature model in the training set and test set, and there were significant differences in the rad score between the EMVI-positive and EMVI-negative groups (P < 0.05), as shown in Figure 4. Details of the construction of the radiomics signature can be found in the supporting materials.
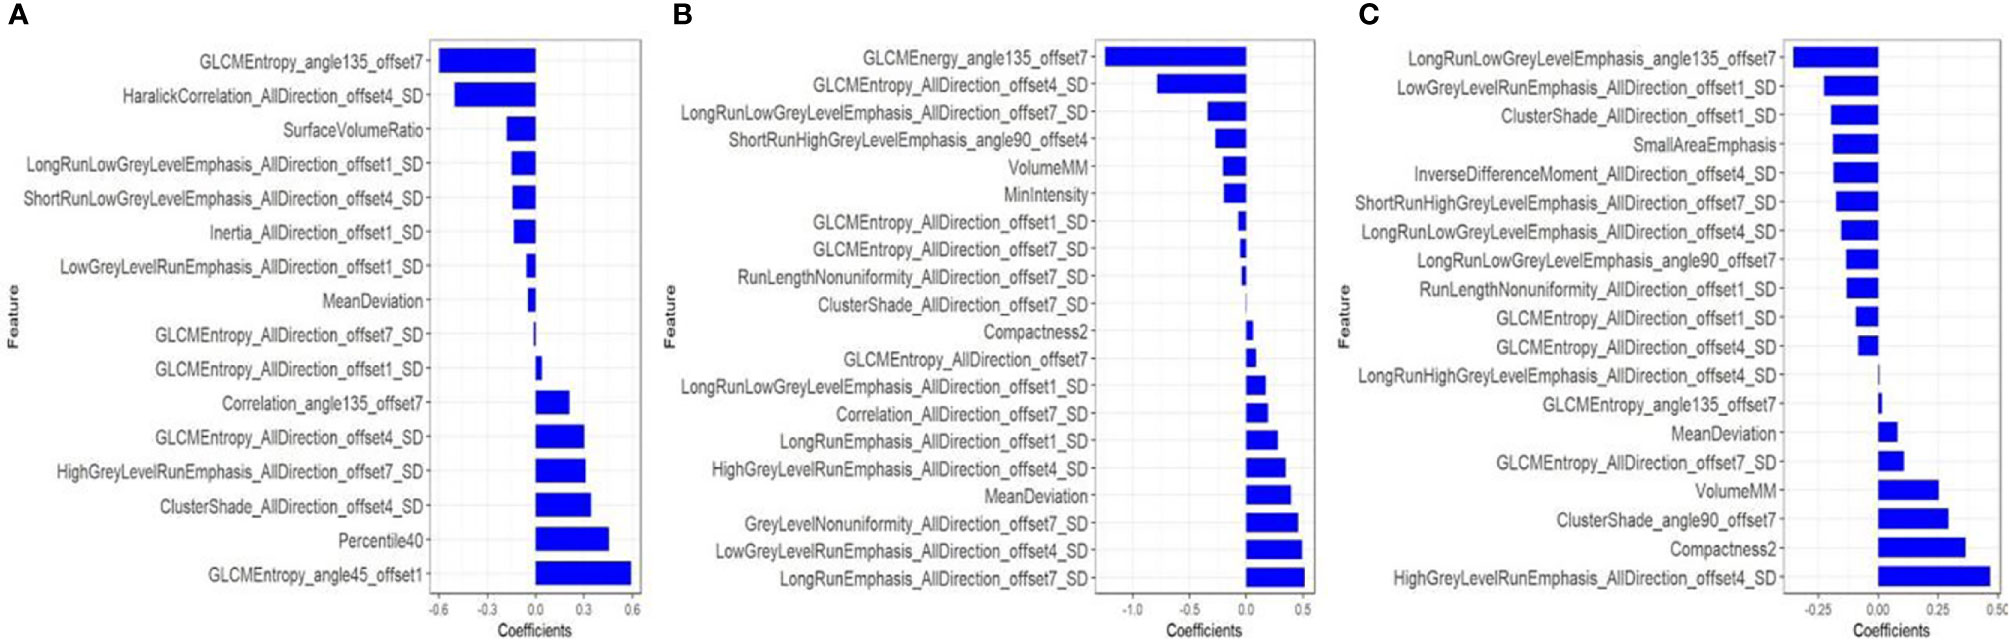
Figure 2 After dimensionality reduction by mRMR and LASSO, 16, 20 and 19 radiomics features were finally selected from CT-enhanced images (A), T2WI (B) and CE-T1WI (C) to construct a radiomics signature. The blue bar indicates the weight value of the radiomics features.
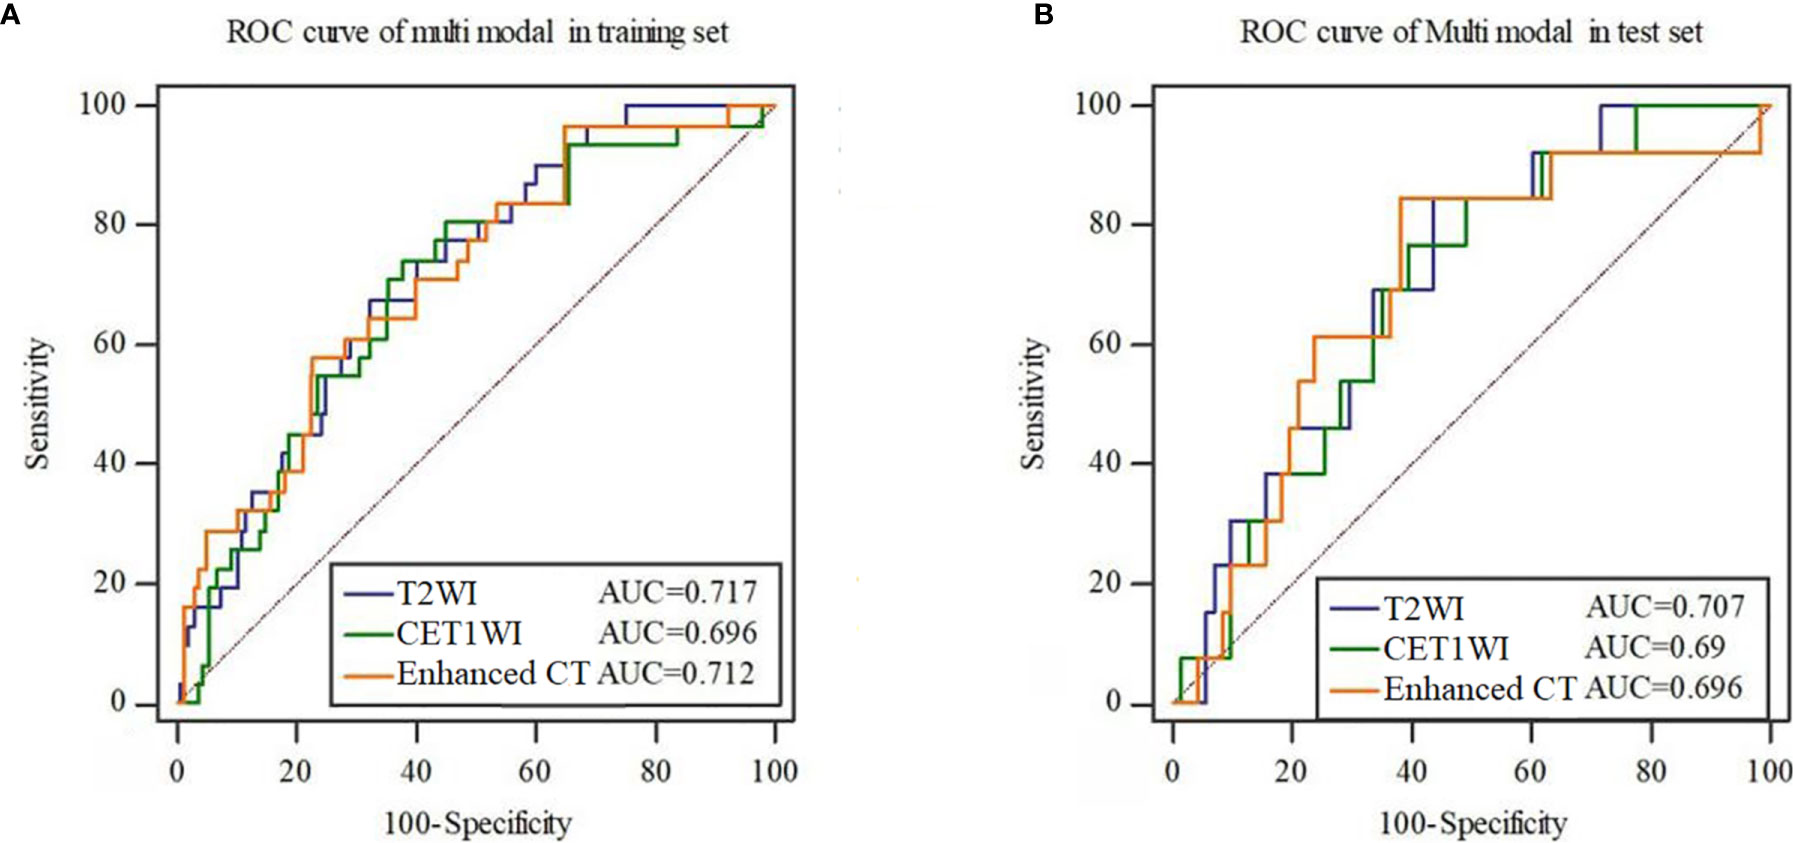
Figure 3 ROC curves of the radiomics signature constructed by each mode in the training set (A) and test set (B).
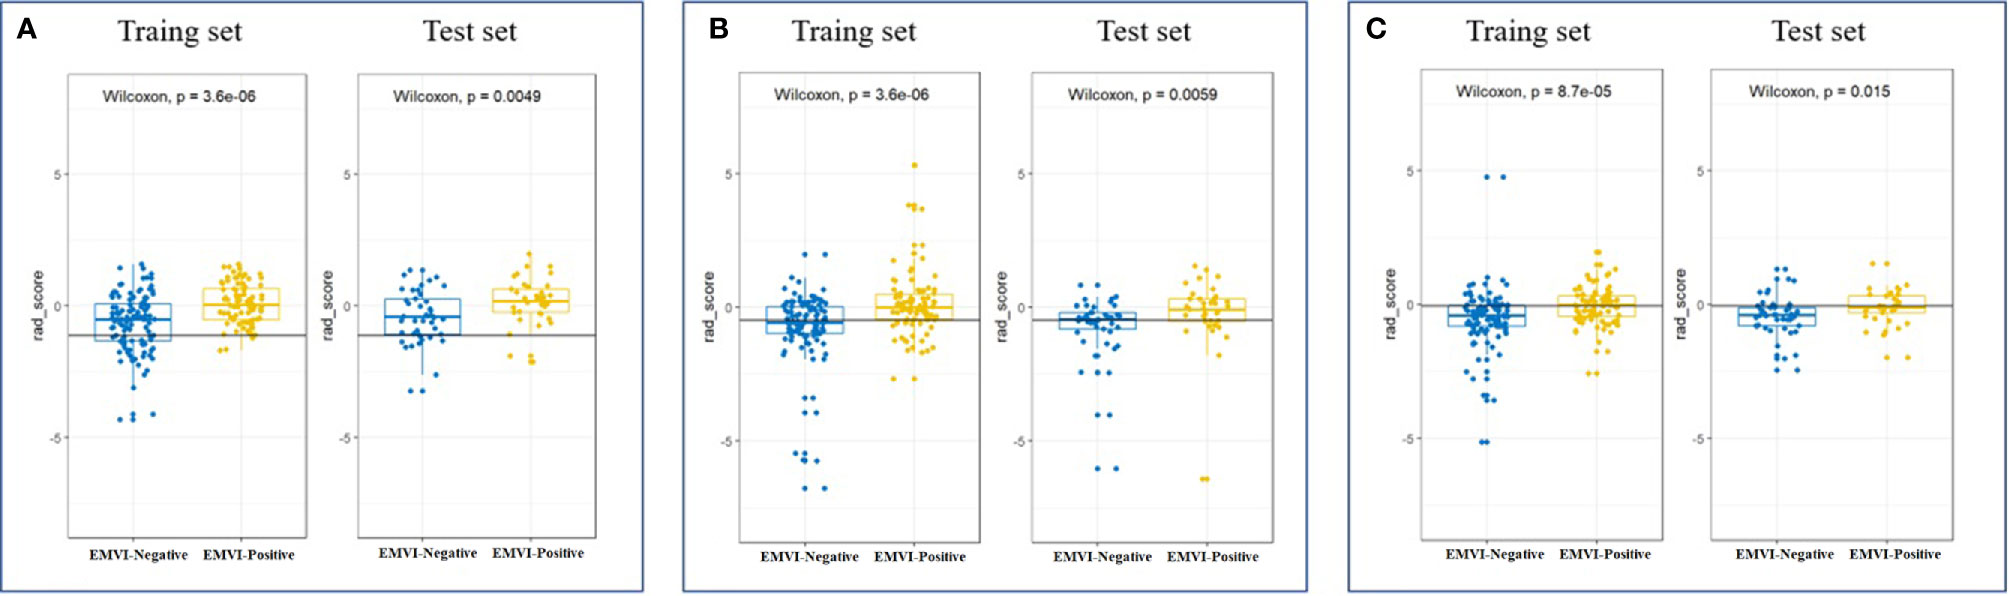
Figure 4 Scatter plot between EMVI-negative (blue dots) and EMVI-positive (yellow dots) rad scores calculated by radiomics signatures constructed by T2WI (A), CE-T1WI (B) and CT-enhanced images (C) in the training and test sets.
Stepwise logistic regression analysis showed that mrEMVI, degree of pathological differentiation and radiomics signature were independent predictors of EMVI, as shown in Table 3. Three models were constructed, including the clinical model (the optimal radiomics signature combining with the degree of pathological differentiation), the MRI model (the optimal radiomics signature combining with the mrEMVI status) and the integrated model (the optimal signature radiomics combining with both the degree of pathological differentiation and the mrEMVI status). The ROC curve showed that the AUC value of the integrated model was higher than those of other models and independent predictors in the training and test sets. The DeLong test showed that there was significant difference in the AUC values of the integrated model between MRI model and Clinical model in training set (P = 0.0129 and 0.0007), and in the test set, there were also significant differences (P = 0.0462 and 0.0159). Therefore, the radiomics nomogram was based on the integrated model, as shown in Figures 5 and 6A and Table 4. Finally, the Hosmer-Lemeshow test showed that the performance of the nomogram was not significantly different between the training and testing sets (P > 0.05). The calibration curve showed that the nomogram had better prediction performance (Figures 6B, C) and decision curve analysis (DCA) showed that the nomogram had the best clinical net benefit compared with the other models in the overall dataset (Figure 6D). Based on the classification value of the nomogram (cutoff = 0.463), the number of EMVI-positive cases in the low-risk group and the high-risk group was significantly different (Figure 6E).
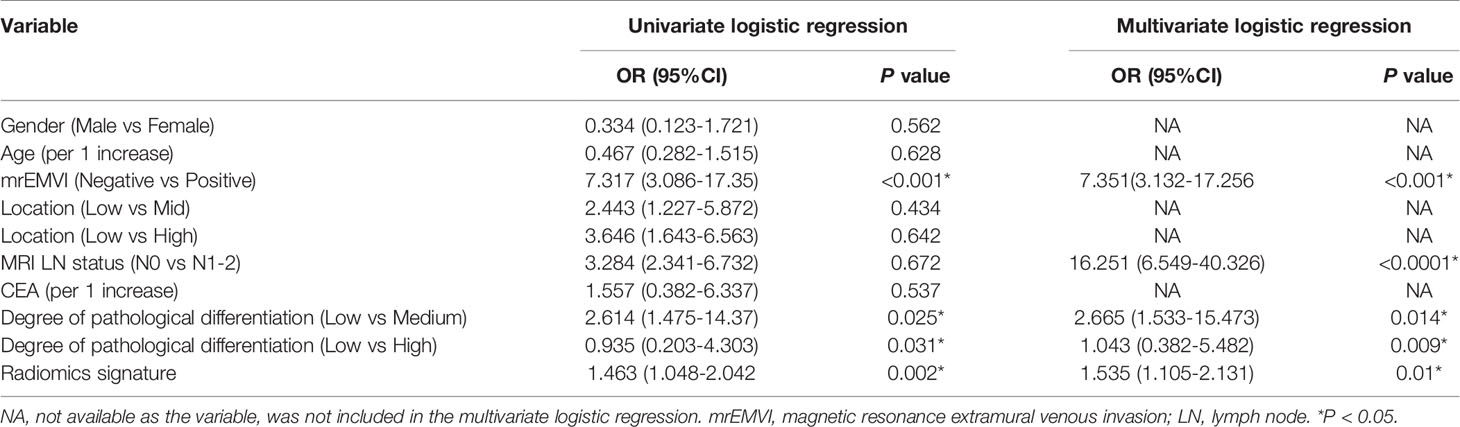
Table 3 Stepwise logistic regression analysis of EMVI prediction.
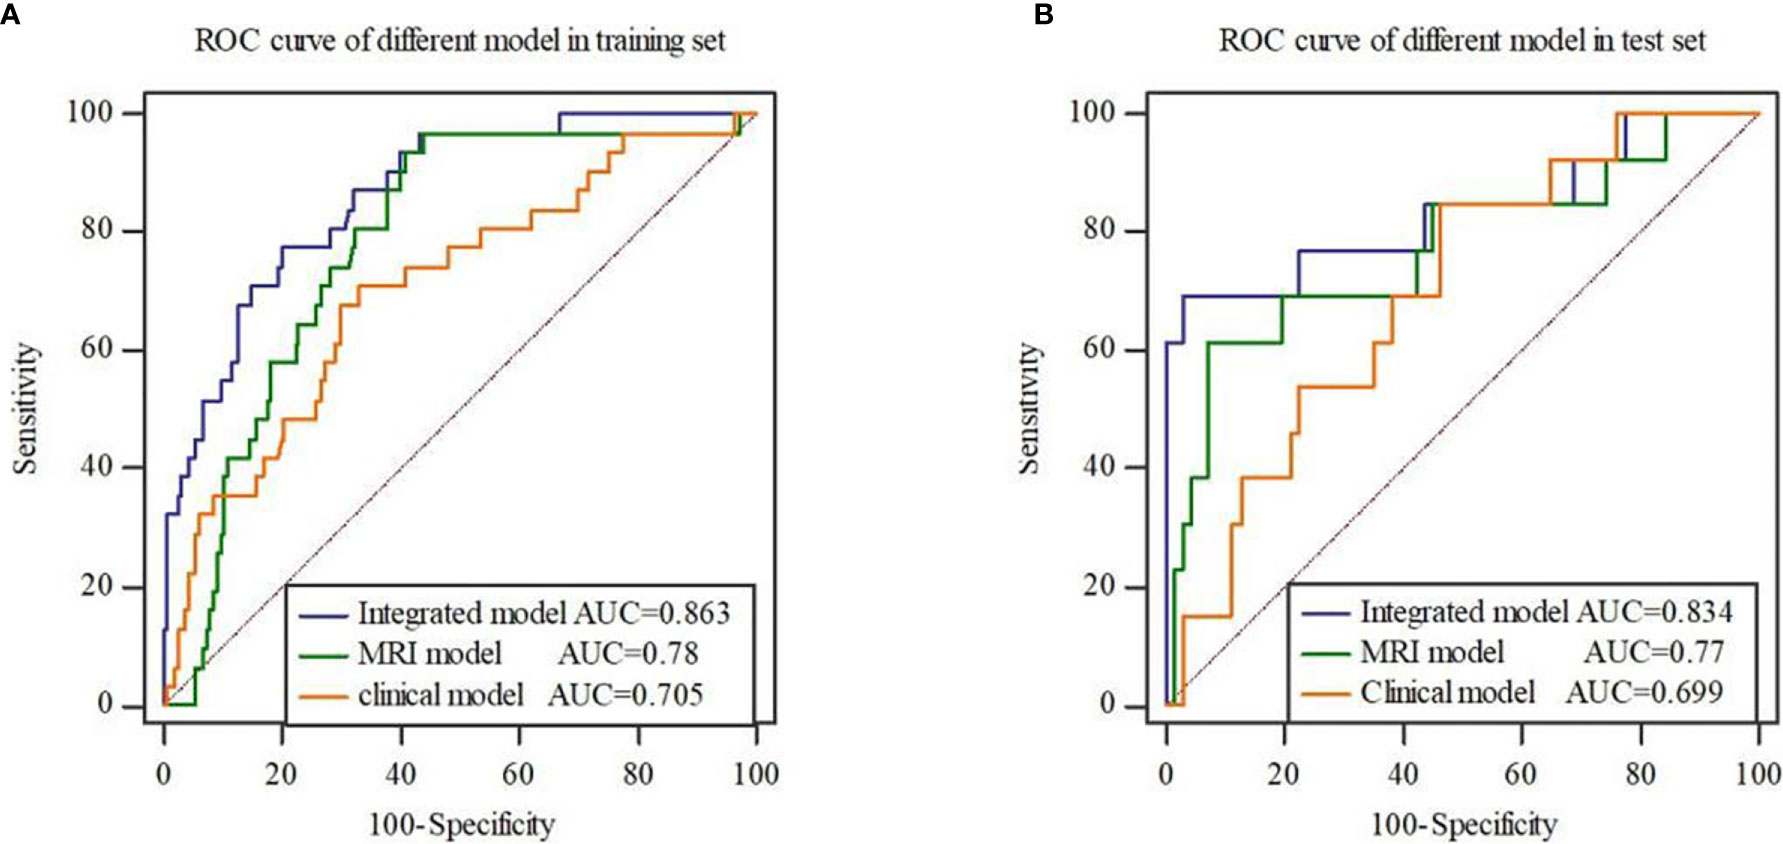
Figure 5 ROC curves of three models in the training set (A) and test set (B). The results show that the integrated model has the highest AUC value.
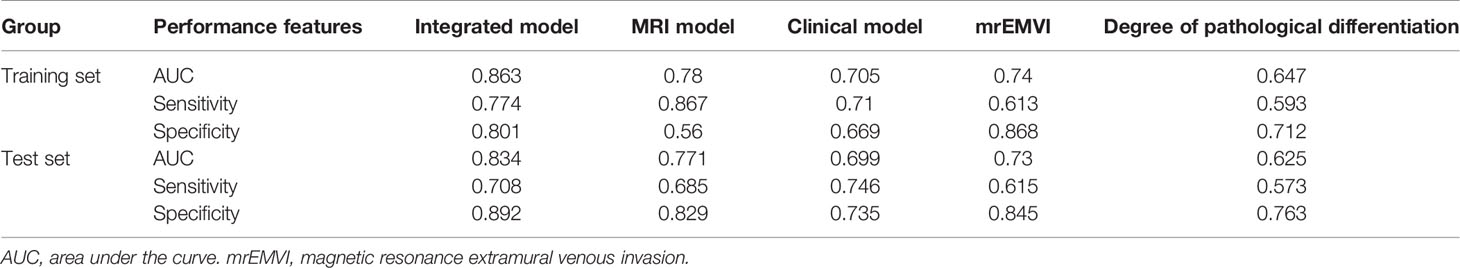
Table 4 Diagnostic efficacy of different models and independent clinical predictors.
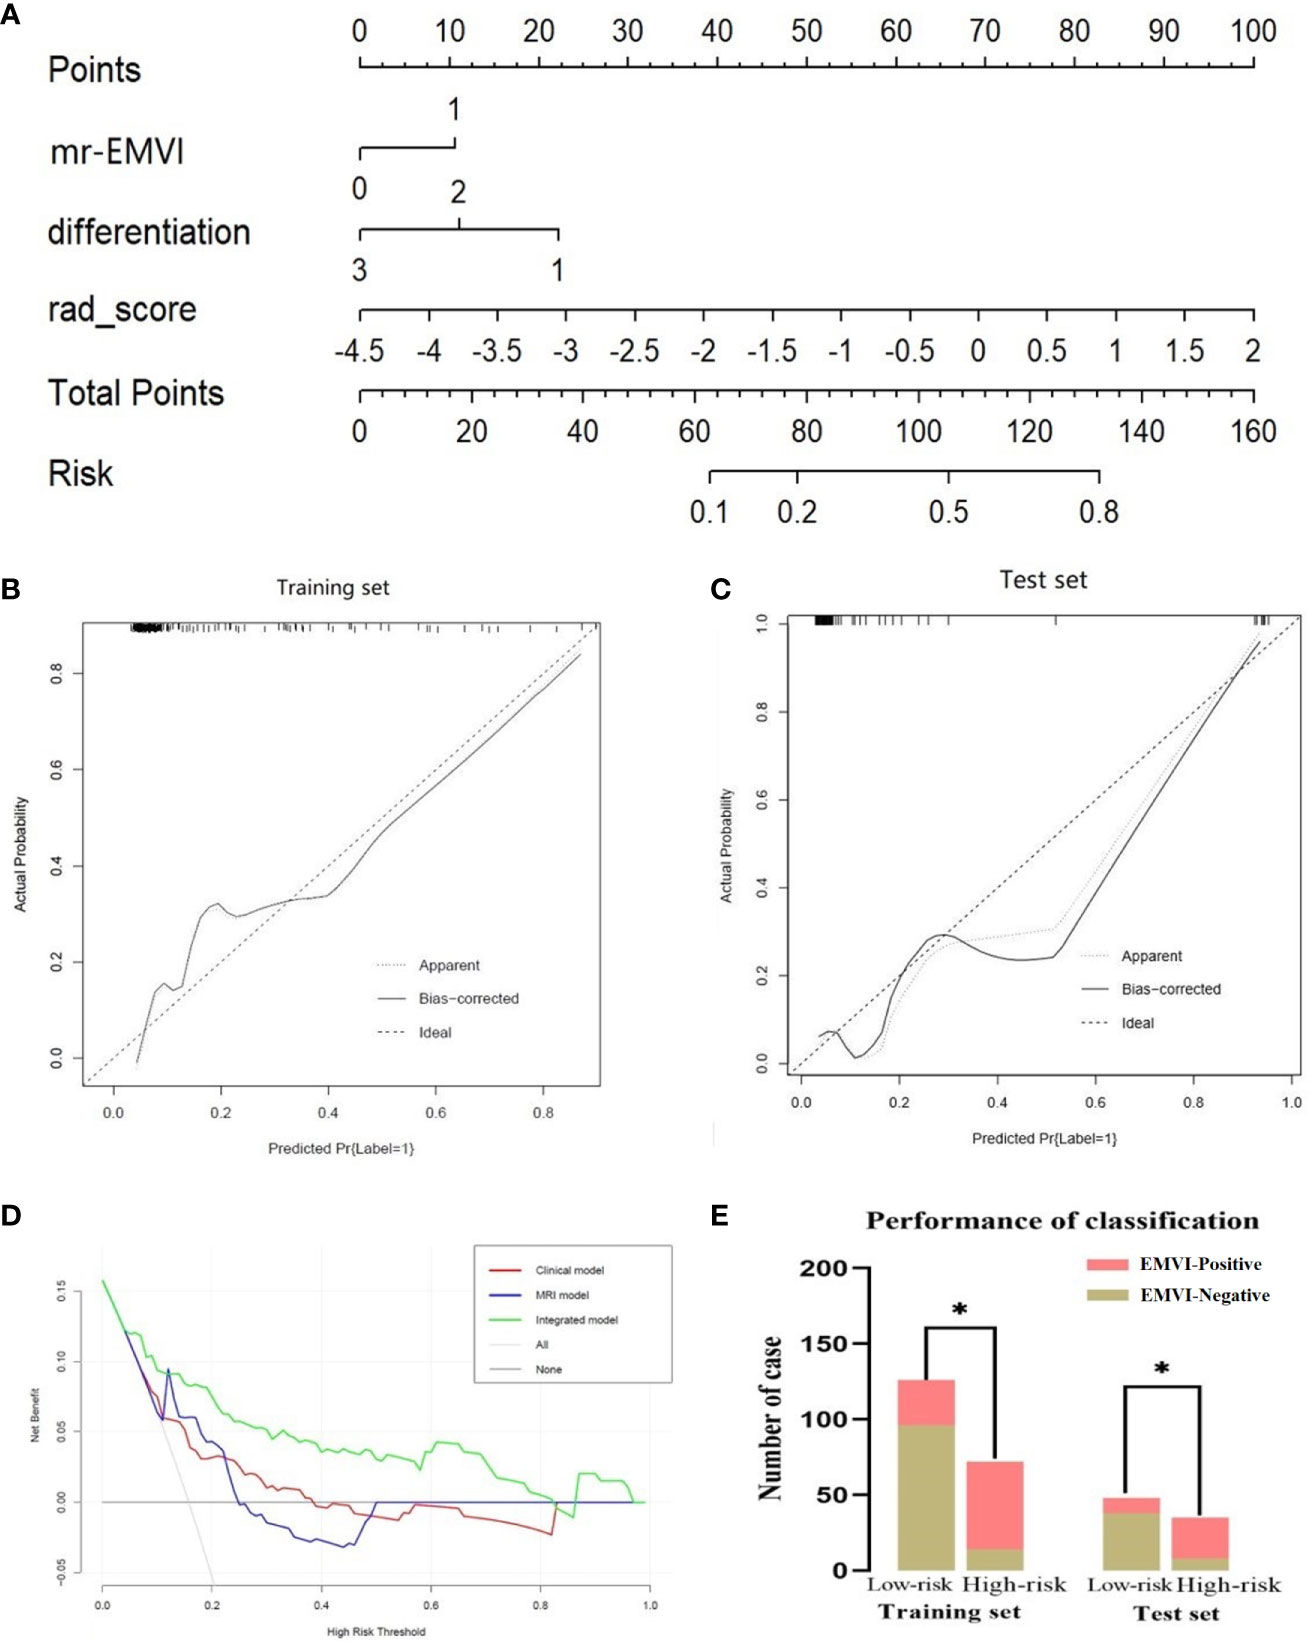
Figure 6 Radiomics nomogram for detecting EMVI (A). In the nomogram, a vertical line was drawn according to the value of the rad score to determine the corresponding value of points. The points of mrEMVI and differentiation stage can also be determined in the same way. The total points were the sum of the three points above. Finally, a vertical line was drawn according to the value of the total points to determine the probability of EMVI. The calibration curve of the radiomics nomogram for EMVI in the training set (B) and test set (C). A dashed line indicated the reference line where an ideal nomogram would lie. A dotted line indicated the performance of the nomogram, while the solid line indicated bias correction in the nomogram. DCA curve (D) for the integrated model, MRI model and clinical model predicting EMVI in the dataset. The graphs showed that the integrated model had the greatest net benefit. The risk classification performance of the integrated model in the training and test set (E). *P < 0.05.
In this study, our results showed that there was no significant difference in the diagnostic performance of EMVI by three radiomics signatures based on CT-enhanced images, T2WI and CE-T1WI. T2WI is not involved in radiation damage and contrast-induced medical risk. Therefore, T2WI-based radiomics signature was selected in the present study to combine with clinical and mrEMVI data to build the radiomics nomogram. Our results also showed that the nomogram has the best predictive performance of the models. In view of the noninvasive and low-cost characteristics of radiomics technology, this may provide a new quantifiable tool for the preoperative evaluation of EMVI status.
In the diagnosis and treatment of rectal cancer, CT is mainly used for screening tumor metastasis, especially in the diagnosis of liver and lung metastases (30). However, due to the low signal-to-noise ratio of CT and the lack of ideal soft tissue resolution, there are great limitations in the visual evaluation of EMVI by CT (31). In this study, radiomics technology based on CT images can be used for EMVI evaluation, implying the advantages of radiomics technology (32). T2WI shows great performance in EMVI evaluation in rectal cancer (10) for its high resolution of soft tissue. Similarly, the radiomics signature based on T2WI showed the highest AUC value in this study. Although some prior studies have shown that CE-T1WI can display vascular structure and improve the diagnostic performance of EMVI for rectal cancer (33), there were no statistically significant differences observed between CE-T1WI and T2WI using radiomics signature for evaluation of EMVI in this study, which indicated that high-resolution T2WI may be more suitable for radiomics analysis than the CE-T1WI in predicting EMVI considering the cost, convenience and safety. In general, T2WI is more suitable for the radiomics analysis of rectal cancer, which may improve the clinical evaluation of EMVI.
The radiomics nomogram obtained in this study also shows superior performance in predicting EMVI. Our results are better than those of Brown et al, reporting that the sensitivity and specificity of conventional MRI for EMVI detection were 62% and 88% respectively (34), which may be benefit from the diagnostic performance of the radiomics signature, mrEMVI and clinical features. Previous studies have confirmed that the ability of mrEMVI was at least as good as that of routine histopathology (5). Resembly, our study showed that mrEMVI had higher diagnostic efficiency of EMVI than that of the radiomics signature, though the sensitivity of mrEMVI was significantly lower. Sohn et al. reported that the sensitivity of MRI in the evaluation of EMVI was only 28.2% (8), as the smallest vessel diameter that 3.0-T MRI can distinguish is 3 mm. Theoretically speaking, even if high-resolution T2WI is used, it is difficult to identify vessels with a diameter less than 3 mm (10, 35). In fact, it is very difficult to identify vessels on MRI, and it is usually necessary to compare different sequences at the same level in addition to intravenously using gadolinium contrast agent to confirm whether it is a vessel. Even if it can be confirmed as a blood vessel, many cases do not show the typical imaging features of vascular lumen expansion, irregular shape or the “flow empty” signal in the blood vessel replaced by the tumor signal. Therefore, even experienced radiologist can easily miss these atypical cases. However, the radiomics nomogram can be used to quantitatively evaluate EMVI through the radiomics analysis of primary tumors. In this process, only the delineation of the tumor area is through visual evaluation, which is obviously more accurate and easier than the all visual evaluation. Therefore, the radiomics technology has greater clinical advantages compared with the traditional visual assessment.
Compared to the same type of research by Yu et al. (20), the diagnostic efficiency of the nomogram in the training set was lower than that of the radiomics nomogram constructed in their study (AUC = 0.904), while the diagnostic efficiency of the nomogram in the test set was higher than that of theirs (AUC = 0.812), which indicated better stability of our nomogram. This may be caused by the different radiomics signature. In their study, the nomogram was constructed by the radiomics signature based on dynamic contrast-enhanced MRI. While in our research, the radiomics signature was on the basis of T2WI images. In fact, the use of contrast medium may affect the choice of radiomics features. The different doses of contrast medium and the permeability of tissue microvessels, which were related to the image enhancement effect (36), would change the distribution of pixels and then affect the stability of the whole model. In addition, Maxiao et al. (37) found that the radiomics model constructed by SVM had the best performance of the different machine learning methods in evaluating preoperative pathological features. Thus, the model generated by SVM in our study was more stable than that of Yu et al, which was built by logistic regression. In addition, the previous studies have shown that the accuracy of CT based super physiological vein diameter for predicting EMVI is 0.83 (38), which is equivalent to the accuracy of nomogram for identifying EMVI. However, compared with CT radiation damage, nomogram may be more suitable for clinical practice. Aysegul et al. Used changes in dimensions of superior recurrent vein (SRV) and inferior median vein (IMV) and ADC values were used to predict EMVI (39), and the AUC values were 0.851.0.893 and 0.664, respectively. Although the diagnostic efficiency of IMV was higher than that of the nomogram, but these indexes were based on CT examination, while the ADC value based on MRI examination was significantly lower than that of our nomogram. In fact, functional imaging such as DWI could not improve the efficiency of MRI in EMVI detection (35).
There were some limitations in this research. First, this study was retrospectively. However, eligible patients were consecutively retrieved from a prospective database that included all patients with rectal cancer in our hospital. Second, our data are limited to a single center study, so our results may not be extended to other medical centers. In the future, multicenter studies are needed to further verify the results of this study. Finally, this study did not analyze the correlation between the radiomics features and clinical features and lacked the interpretability of the radiomics features. In the future, we will further clarify the interpretability of the radiomics features.
In conclusion, T2WI-based radiomics technology was superior to CT and CE-TIWI in predicting the EMVI status in rectal cancer. At the same time, the radiomics nomogram combined with clinical features and mrEMVI was a convenient and noninvasive tool to predict the EMVI status accurately.
The raw data supporting the conclusions of this article will be made available by the authors, without undue reservation.
The studies involving human participants were reviewed and approved by the medical ethics committee of Hunan Cancer Hospital. Written informed consent for participation was not required for this study in accordance with the national legislation and the institutional requirements.
All authors listed have made a substantial, direct, and intellectual contribution to the work and approved it for publication.
This study was supported by the Provincial Key Clinical Specialty (Medical Imaging) Development Program from Health and Family Planning Commission of Hunan Province, China (contract grant number: 2015/43) , by Cancer Research Program of National Cancer Center (Grant Number: NCC2017A19), and by Nature Science Fund of Hunan Province, China (Project Number: 2020JJ4052).
The authors declare that the research was conducted in the absence of any commercial or financial relationships that could be construed as a potential conflict of interest.
We would like to thank Peipei Pang for her kind support in the analyzed and interpreted the data of this work.
The Supplementary Material for this article can be found online at: https://www.frontiersin.org/articles/10.3389/fonc.2021.610338/full#supplementary-material
1. Stewart DB, Dietz DW. Total mesorectal excision: what are we doing? Clin Colon Rectal Surg (2007) 20(3):190–202. doi: 10.1055/s-2007-984863
2. Nougaret S, Reinhold C, Mikhael HW, Rouanet P, Bibeau F, Brown G. The use of MR imaging in treatment planning for patients with rectal carcinoma: have you checked the “DISTANCE”? Radiology (2013) 268(2):330–44. doi: 10.1148/radiol.13121361
3. Liu L, Liu M, Yang Z, He W, Wang Z, Jin E. Correlation of MRI-detected extramural vascular invasion with regional lymph node metastasis in rectal cancer. Clin Imag (2016) 40(3):456–60. doi: 10.1016/j.clinimag.2016.01.007
4. McClelland D, Murray GI. A Comprehensive Study of Extramural Venous Invasion in Colorectal Cancer. PLoS One (2015) 10(12):e0144987. doi: 10.1371/journal.pone.0144987
5. Messenger DE, Driman DK, Kirsch R. Developments in the assessment of venous invasion in colorectal cancer: implications for future practice and patient outcome. Hum Pathol (2012) 43(7):965–73. doi: 10.1016/j.humpath.2011.11.015
6. D’Souza N, Shaw A, Lord A, Balyasnikova S, Abulafi M, Tekkis P, et al. Assessment of a Staging System for Sigmoid Colon Cancer Based on Tumor Deposits and Extramural Venous Invasion on Computed Tomography. JAMA Netw Open (2019) 2(12):e1916987. doi: 10.1001/jamanetworkopen.2019.16987
7. Chand M, Bhangu A, Wotherspoon A, Stamp GWH, Swift RI, Chau I, et al. EMVI-positive stage II rectal cancer has similar clinical outcomes as stage III disease following pre-operative chemoradiotherapy. Ann Oncol (2014) 25(4):858–63. doi: 10.1093/annonc/mdu029
8. Sohn B, Lim JS, Kim H, Myoung S, Choi J, Kim NK, et al. MRI-detected extramural vascular invasion is an independent prognostic factor for synchronous metastasis in patients with rectal cancer. Eur Radiol (2015) 25(5):1347–55. doi: 10.1007/s00330-014-3527-9
9. Smith NJ, Barbachano Y, Norman AR, Swift RI, Abulafi AM, Brown G. Prognostic significance of magnetic resonance imaging-detected extramural vascular invasion in rectal cancer. Br J Surg (2008) 95(2):229–36. doi: 10.1002/bjs.5917
10. Ale Ali H, Kirsch R, Razaz S, Jhaveri A, Thipphavong S, Kennedy ED, et al. Extramural venous invasion in rectal cancer: overview of imaging, histopathology, and clinical implications. Abdom Radiol (NY) (2019) 44(1):1–10. doi: 10.1007/s00261-018-1673-2
11. Kim TH, Woo S, Han S, Suh CH, Vargas HA. The Diagnostic Performance of MRI for Detection of Extramural Venous Invasion in Colorectal Cancer: A Systematic Review and Meta-Analysis of the Literature. AJR Am J Roentgenol (2019) 213(3):575–85. doi: 10.2214/AJR.19.21112
12. Heo SH, Kim JW, Shin SS, Jeong YY, Kang HK. Multimodal imaging evaluation in staging of rectal cancer. World J Gastroenterol (2014) 20(15):4244–55. doi: 10.3748/wjg.v20.i15.4244
13. Dewhurst C, Rosen MP, Blake MA, Feig BW, Gage KL, Garcia EM, et al. ACR Appropriateness Criteria pretreatment staging of colorectal cancer. J Am Coll Radiol (2012) 9(11):775–81. doi: 10.1016/j.jacr.2017.02.012
14. Ahmetoğlu A, Cansu A, Baki D, Kul S, Cobanoğlu U, Alhan E, et al. MDCT with multiplanar reconstruction in the preoperative local staging of rectal tumor. Abdom Imag (2011) 36(1):31–7. doi: 10.1007/s00261-009-9591-y
15. Chand M, Siddiqui MR, Swift I, Brown G. Systematic review of prognostic importance of extramural venous invasion in rectal cancer. World J Gastroenterol (2016) 22(4):1721–6. doi: 10.3748/wjg.v22.i4.1721
16. Dighe S, Blake H, Koh MD, Swift I, Arnaout A, Temple L, et al. Accuracy of multidetector computed tomography in identifying poor prognostic factors in colonic cancer. Br J Surg (2010) 97(9):1407–15. doi: 10.1002/bjs.7096
17. Lambin P, Rios-Velazquez E, Leijenaar R, Carvalho S, van Stiphout RG, Granton P, et al. Radiomics: extracting more information from medical images using advanced feature analysis. Eur J Cancer (2012) 48(4):441–6. doi: 10.1016/j.ejca.2011.11.036
18. Aerts HJ, Velazquez ER, Leijenaar RT, Parmar C, Grossmann P, Carvalho S, et al. Decoding tumour phenotype by noninvasive imaging using a quantitative radiomics approach. Nat Commun (2014) 5:4644. doi: 10.1038/ncomms5644
19. Horvat N, Bates DDB, Petkovska I. Novel imaging techniques of rectal cancer: what do radiomics and radiogenomics have to offer? A literature review. Abdom Radiol (NY) (2019) 44(11):3764–74. doi: 10.1007/s00261-019-02042-y
20. Yu X, Song W, Guo D, Liu H, Zhang H, He X, et al. Preoperative Prediction of Extramural Venous Invasion in Rectal Cancer: Comparison of the Diagnostic Efficacy of Radiomics Models and Quantitative Dynamic Contrast-Enhanced Magnetic Resonance Imaging. Front Oncol (2020) 10:459. doi: 10.3389/fonc.2020.00459
21. Kumar V, Gu Y, Basu S, Berglund A, Eschrich SA, Schabath MB, et al. Radiomics: the process and the challenges. Magn Reson Imag (2012) 30(9):1234–48. doi: 10.1016/j.mri.2012.06.010
22. Giraud P, Giraud P, Gasnier A, El Ayachy R, Kreps S, Foy JP, et al. Radiomics and Machine Learning for Radiotherapy in Head and Neck Cancers. Front Oncol (2019) 9:174. doi: 10.3389/fonc.2019.00174
23. Talbot IC, Ritchie S, Leighton MH, Hughes AO, Bussey HJ, Morson BC. The clinical significance of invasion of veins by rectal cancer. Br J Surg (1980) 67(6):439–42. doi: 10.1002/bjs.1800670619
24. Sun R, Limkin EJ, Vakalopoulou M, Dercle L, Champiat S, Han SR, et al. A radiomics approach to assess tumour-infiltrating CD8 cells and response to anti-PD-1 or anti-PD-L1 immunotherapy: an imaging biomarker, retrospective multicohort study. Lancet Oncol (2018) 19(9):1180–91. doi: 10.1016/S1470-2045(18)30413-3
25. Wu J, Aguilera T, Shultz D, Gudur M, Rubin DL, Loo BW Jr, et al. Early-Stage Non-Small Cell Lung Cancer: Quantitative Imaging Characteristics of (18)F Fluorodeoxyglucose PET/CT Allow Prediction of Distant Metastasis. Radiology (2016) 281(1):270–8. doi: 10.1148/radiol.2016151829
26. Ashburner J. Computational anatomy with the SPM software. Magn Reson Imag (2009) 27(8):1163–74. doi: 10.1016/j.mri.2009.01.006
27. Mukaka MM. Statistics corner: A guide to appropriate use of correlation coefficient in medical research. Malawi Med J (2012) 24(3):69–71. doi: 10.2166/wh.2012.000
28. Orrù G, Pettersson-Yeo W, Marquand AF, Sartori G, Mechelli A. Using Support Vector Machine to identify imaging biomarkers of neurological and psychiatric disease: a critical review. Neurosci Biobehav Rev (2012) 36(4):1140–52. doi: 10.1016/j.neubiorev.2012.01.004
29. Fluss R, Faraggi D, Reiser B. Estimation of the Youden Index and its associated cutoff point. Biom J (2005) 47(4):458–72. doi: 10.1002/bimj.200410135
30. Numminen K, Isoniemi H, Halavaara J, Tervahartiala P, Makisalo H, Laasonen L, et al. Preoperative assessment of focal liver lesions: multidetector computed tomography challenges magnetic resonance imaging. Acta Radiol (2005) 46(1):9–15. doi: 10.1080/02841850510016108
31. Ippolito D, Drago SG, Franzesi CT, Fior D, Sironi S. Rectal cancer staging: Multidetector-row computed tomography diagnostic accuracy in assessment of mesorectal fascia invasion. World J Gastroenterol (2016) 22(20):4891–900. doi: 10.3748/wjg.v22.i20.4891
32. Lambin P, Leijenaar RTH, Deist TM, Peerlings J, de Jong EEC, van Timmeren J, et al. Radiomics: the bridge between medical imaging and personalized medicine. Nat Rev Clin Oncol (2017) 14(12):749–62. doi: 10.1038/nrclinonc.2017.141
33. Liu L, Yang L, Jin E, Wang Z, Yang Z. Effect of gadolinium contrast-enhanced T1-weighted magnetic resonance imaging for detecting extramural venous invasion in rectal cancer. Abdom Radiol (NY) (2016) 41(9):1736–43. doi: 10.1007/s00261-016-0740-9
34. Brown G, Radcliffe AG, Newcombe RG, Dallimore NS, Bourne MW, Williams GT. Preoperative assessment of prognostic factors in rectal cancer using high-resolution magnetic resonance imaging. Br J Surg (2003) 90(3):355–64. doi: 10.1002/bjs.4034
35. Ahn JH, Kim SH, Son JH, Jo SJ. Added value of diffusion-weighted imaging for evaluation of extramural venous invasion in patients with primary rectal cancer. Br J Radiol 2019 (2019) 92(1096):20180821. doi: 10.1259/bjr.20180821
36. Duan C, Kallehauge JF, Bretthorst GL, Tanderup K, Ackerman JJ, Garbow JR. Are complex DCE-MRI models supported by clinical data? Magn Reson Med (2017) 77(3):1329–39. doi: 10.1002/mrm.26189
37. Ma X, Shen F, Jia Y, Xia Y, Li Q, Lu J. MRI-based radiomics of rectal cancer: preoperative assessment of the pathological features. BMC Med Imag (2019) 19(1):86. doi: 10.1186/s12880-019-0392-7
38. Wu CC, Lee RC, Chang CY. Prediction of lymphovascular invasion in rectal cancer by preoperative CT. AJR Am J Roentgenol (2013) 201(5):985–92. doi: 10.2214/AJR.12.9657
Keywords: rectal cancer, extramural venous invasion, radiomics, magnetic resonance imaging, computed tomography, prediction
Citation: Liu S, Yu X, Yang S, Hu P, Hu Y, Chen X, Li Y, Zhang Z, Li C and Lu Q (2021) Machine Learning-Based Radiomics Nomogram for Detecting Extramural Venous Invasion in Rectal Cancer. Front. Oncol. 11:610338. doi: 10.3389/fonc.2021.610338
Received: 25 September 2020; Accepted: 11 March 2021;
Published: 26 March 2021.
Edited by:
Stephen J. Pandol, Cedars Sinai Medical Center, United StatesReviewed by:
Zhenyu Shu, Zhejiang Provincial People’s Hospital, ChinaCopyright © 2021 Liu, Yu, Yang, Hu, Hu, Chen, Li, Zhang, Li and Lu. This is an open-access article distributed under the terms of the Creative Commons Attribution License (CC BY). The use, distribution or reproduction in other forums is permitted, provided the original author(s) and the copyright owner(s) are credited and that the original publication in this journal is cited, in accordance with accepted academic practice. No use, distribution or reproduction is permitted which does not comply with these terms.
*Correspondence: Xiaoping Yu, eXV4aWFvcGluZ0BobmNhLm9yZy5jbg==
Disclaimer: All claims expressed in this article are solely those of the authors and do not necessarily represent those of their affiliated organizations, or those of the publisher, the editors and the reviewers. Any product that may be evaluated in this article or claim that may be made by its manufacturer is not guaranteed or endorsed by the publisher.
Research integrity at Frontiers
Learn more about the work of our research integrity team to safeguard the quality of each article we publish.