- 1Medical Big Data Research Center, Medical Innovation Research Division of Chinese People's Liberation Army General Hospital, Beijing, China
- 2Faculty of Medicine, Macau University of Science and Technology, Macau, China
- 3National Engineering Laboratory for Medical Big Data Application Technology, Chinese People's Liberation Army General Hospital, Beijing, China
- 4Department of Hematology, Chinese People's Liberation Army General Hospital, Beijing, China
- 5Research Center for Translational Medicine Laboratory, Medical Innovation Research Division of Chinese People's Liberation Army General Hospital, Beijing, China
- 6Hepatobiliary Surgery Center, The Fifth Medical Center of Chinese People's Liberation Army General Hospital, Beijing, China
- 7Department of Hematology, Peking University, Third Hospital, Beijing, China
Background: Acute myeloid leukemia (AML) is a heterogeneous disease of the hematopoietic system, for which identification of novel molecular markers is potentially important for clinical prognosis and is an urgent need for treatment optimization.
Methods: We selected C-type lectin domain family 11, member A (CLEC11A) for study via several public databases, comparing expression among a variety of tumors and normal samples as well as different organs and tissues. To investigated the relationship between CLEC11A expression and clinical characteristics, we derived an AML cohort from The Cancer Genome Atlas (TCGA); we also investigated the Bloodspot and HemaExplorer databases. The Kaplan-Meier method and log-rank test were used to evaluate the associations between CLEC11A mRNA expression, as well as DNA methylation, and overall survival (OS), event-free survival (EFS), and relapse-free survival (RFS). DNA methylation levels of CLEC11A from our own 28 de novo AML patients were assessed and related to chemotherapeutic outcomes. Bioinformatics analysis of CLEC11A was carried out using public databases.
Results: Multiple public databases revealed that CLEC11A expression was higher in leukemia. The TCGA data revealed that high CLEC11A expression was linked with favorable prognosis (OS p-value = 2e-04; EFS p-value = 6e-04), which was validated in GSE6891 (OS p-value = 0; EFS p-value = 0; RFS p-value = 2e-03). Methylation of CLEC11A was negatively associated with CLEC11A expression, and high CLEC11A methylation level group was linked to poorer prognosis (OS p-value = 1e-02; EFS p-value = 2e-02). Meanwhile, CLEC11A hypermethylation was associated with poor induction remission rate and dismal survival. Bioinformatic analysis also showed that CLEC11A was an up-regulated gene in leukemogenesis.
Conclusion: CLEC11A may be used as a prognostic biomarker, and could do benefit for AML patients by providing precise treatment indications, and its unique gene pattern should aid in further understanding the heterogeneous AML mechanisms.
Introduction
AML is a heterogeneous clonal disorder featured by the accumulation of somatic genetic alterations in hematopoietic progenitor cells, changing normal mechanisms of self-renewal (1, 2), cell proliferation, and differentiation (3) with a highly variable prognosis and a high mortality rate (4, 5). At present, diagnosis and prognosis of AML are based primarily on morphology, immunophenotype (6), chromosome karyotype (7), and molecular features (8) according to the NCCN Guidelines (9).
Clinical and genetic prognostic markers are crucial in the evaluation of AML patients and in guiding rational management (2, 5). The detection of select cytogenetic markers serves as the strongest predictive marker for determining prognostic subgroups in AML (10, 11). Recent discoveries also have shed light on the important role of dysregulated transcription and epigenetic mechanisms in the pathogenesis of AML (12–15). Several studies have reported that the expression of different panels of genes that include CLEC11A is associated with clinical outcome in patients with AML (16, 17). In our previous study on the prognosis of AML, a panel of 12 methylated genes that included CLEC11A was found with hyper-differentially promoter methylated regions for prognosis in AML (18). CLEC11A (also known as P47, SCGF, LSLCL, and CLECSF3) is located on human chromosome 19 (19q13.33) and encodes a member of the C-type lectin superfamily (https://www.ncbi.nlm.nih.gov/gene/6320). Previous studies revealed that aberrant methylation and expression of CLEC11A were linked with the prognosis of pancreatic cancer, lung cancer, and thoracic malignant tumor (19, 20). CLEC11A has high expression in bone marrow and is a stem cell growth factor functioning within the hematopoietic microenvironment, and playing an important role in the control of cellular differentiation (21). High expression of CLEC11A in plasma has been used as an indicator of hematopoietic recovery and is associated with hemoglobin levels in patients following bone marrow transplantation (22, 23). The CLEC11A expression level is associated with clinical and biological prognostic outcomes in childhood acute lymphoblastic leukemia (16, 24, 25). Previous studies have also validated CLEC11A as a novel regulator and candidate therapeutic target of multiple myeloma SET domain (MMSET)-related myeloma (16, 26, 27). These outcomes indicated that CLEC11A plays a vital role in hematopoietic regulation. However, the precise prognostic value of CLEC11A in AML still remains unclear. This study shows that CLEC11A is a prognostic biomarker that may serve as an indicator for clinical recommendations.
Methods
Public Databases
Public data on CLEC11A expression, methylation, and related patient clinical data were selected from several databases as follows: (1) Oncomine database (www.oncomine.org): The Oncomine database is an online platform including microarrays from various sources, usually cancer-related, and contains many “multi-arrays.” It can figure out gene expression signatures, gene set modules, and so on (28). (2) Tumor IMmune Estimation Resource (TIMER) (https://cistrome.shinyapps.io/timer/): TIMER is a comprehensive resource for systematic analysis of immune infiltrates across diverse cancer types, whose DiffExp module allows users to study the differential expression between tumor and adjacent normal tissues for any gene of interest across all TCGA tumors. Users can identify genes that are up- or downregulated in the tumors compared to normal tissues for each cancer type, as displayed in gray columns when normal data are available (29). (3) The Human Protein Atlas (HPA) (https://www.proteinatlas.org): HPA has provided an integrated platform for researchers to study protein localization and expression in human organs, tissues, and cells. The centerpiece of the HPA is its unique antibody collection for mapping the entire human proteome by immunohistochemistry and immunocytochemistry (30). (4) Gene Expression Omnibus (GEO; http://www.ncbi.nlm.nih.gov/geo/): Gene Expression Omnibus is a public repository including microarray and sequencing genomic dataset (31). In this study, we studied a GEO cohort (GSE9476, 38 healthy donors, 26 AML patients), and the relationship between CLEC11A expression and the Kaplan-Meier survival analysis in AML analyzed via the TCGA data was further validated via a GEO database (GSE6891); (5) The Cancer Genome Atlas (TCGA) (https://tcga-data.nci.nih.gov/tcga/): The Cancer Genome Atlas is a public-funded landmark program that seeks to catalog and discover major cancer-causing genomic alterations to create a comprehensive “atlas” of cancer genomic profiles (32). In outline, we obtained gene expression data of mRNA and promoter methylation from TCGA, severally, which contributed 163 non-M3 de novo AML patients for mRNA gene expression, including 149 cases with both mRNA expression and DNA methylation data. We sorted 163 samples by mRNA expression values and subdivided into low and high groups by CLEC11A expression median value. The low-group contained 82 samples and the high-group contained 81 samples. The relationship of CLEC11A expression, methylation, and survival was analyzed. (6) BloodSpot (http://servers.binf.ku.dk/bloodspot/): BloodSpot is a database of gene expression profiles and transcriptional programs for healthy and malignant hematopoiesis. The function of BloodSpot is to provide an expression plot of genes in healthy and cancerous hematopoietic cells at specific differentiation stages (33). HemaExplorer database (http://servers.binf.ku.dk/hemaexplorer): The HemaExplorer is a curated database of processed mRNA Gene expression profiles (GEPs) that provides an easy display of gene expression in hematopoietic cells (34).
MethylC-Capture Sequencing of AML Patients
In this study, a total of 28 patients with de novo AML were enrolled in the study, visiting our hematology department from August 2014 to December 2017. For these patients, clinical information and DNA samples from bone marrow (BM) were collected and obtained. DNA methylation of CLEC11A was detected by methylC-capture sequencing (MCC-Seq) and analyzed with the remission rate of chemotherapy in patients. The definition of induction remission followed the revised recommendations of the International Working Group (35), and complete remission (CR) meant BM blasts <5%, blasts without Auer rods, the absence of extramedullary disease, a neutrophil count >1 × 10⁹/L and a platelet count ≥100 × 109/L. More detailed methods about the MCC-Seq and chemotherapy regimens are provided in our previous study (18). The research programme was authorized by the ethics committee of the General Hospital of Chinese People’s Liberation Army.
Bioinformatics Analysis of CLEC11A
Between low and high CLEC11A mRNA expression groups, hierarchical clustering based on RNA expression levels were carried out and visualized by heat map and volcano plots using the data from TCGA. Gene ontology (GO) annotations of functional enrichment of overlapped genes (top twenty modules) was developed by Metascape (http://metascape.org/). The genes interacting with CLEC11A were also investigated in STRING (https://string-db.org/).
Statistical Analyses
The prognostic endpoints used in this study were overall survival (OS), event-free survival (EFS), and relapse-free survival (RFS). OS was defined as the time from date of diagnosis to death; EFS was defined as the time from date of diagnosis to removal from the study caused by the absence of complete remission, relapse, or death; and RFS was identified from the first complete response (CR) to relapse, the last follow-up, or death. In the Oncomine database, the statistical cutoff values were a p-value threshold of 1 × 10⁻⁴, a fold-change of 2, and a gene rank threshold of top 10%. In TIMER, the distributions of gene expression levels were displayed using box plots, with statistical significance of differential expression evaluated using the Wilcoxon test (with a statistical cutoff of p < 0.05). For the correlation between CLEC11A expression levels and clinical characteristics, we applied Fisher’s exact test and the Wilcoxon rank-sum test to categorical and continuous variables, respectively. The Kaplan-Meier method and log-rank test were performed to evaluate the relationship between CLEC11A expression and prognosis (OS, EFS, and RFS). Multivariate analyses were performed by Cox proportional hazards models joining together several potentially independent prognostic factors (i.e., patient’s age, WBC, mutations of NPM1, CEBPA, TP53, or FLT3). The OS and EFS of the 163 samples from TCGA database were analyzed using the “forestplot” R package to present the p-value, HR, and 95% CI of each variable. R software was conducted to plot the nomogram and predict the 1-year, 2-year, and 3-year OS and EFS nomogram. In this article, a two-sided p-value < 0.05 was considered statistically significant.
Results
High Expression of CLEC11A in AML
We used the Oncomine database to analyze the variations in CLEC11A mRNA levels in different tumors and normal tissues of multiple cancer types. This analysis showed that CLEC11A expression was higher in breast, colorectal, gastric, pancreatic cancers and leukemia, lymphoma, sarcoma tumors than in normal tissues (Figure 1A).
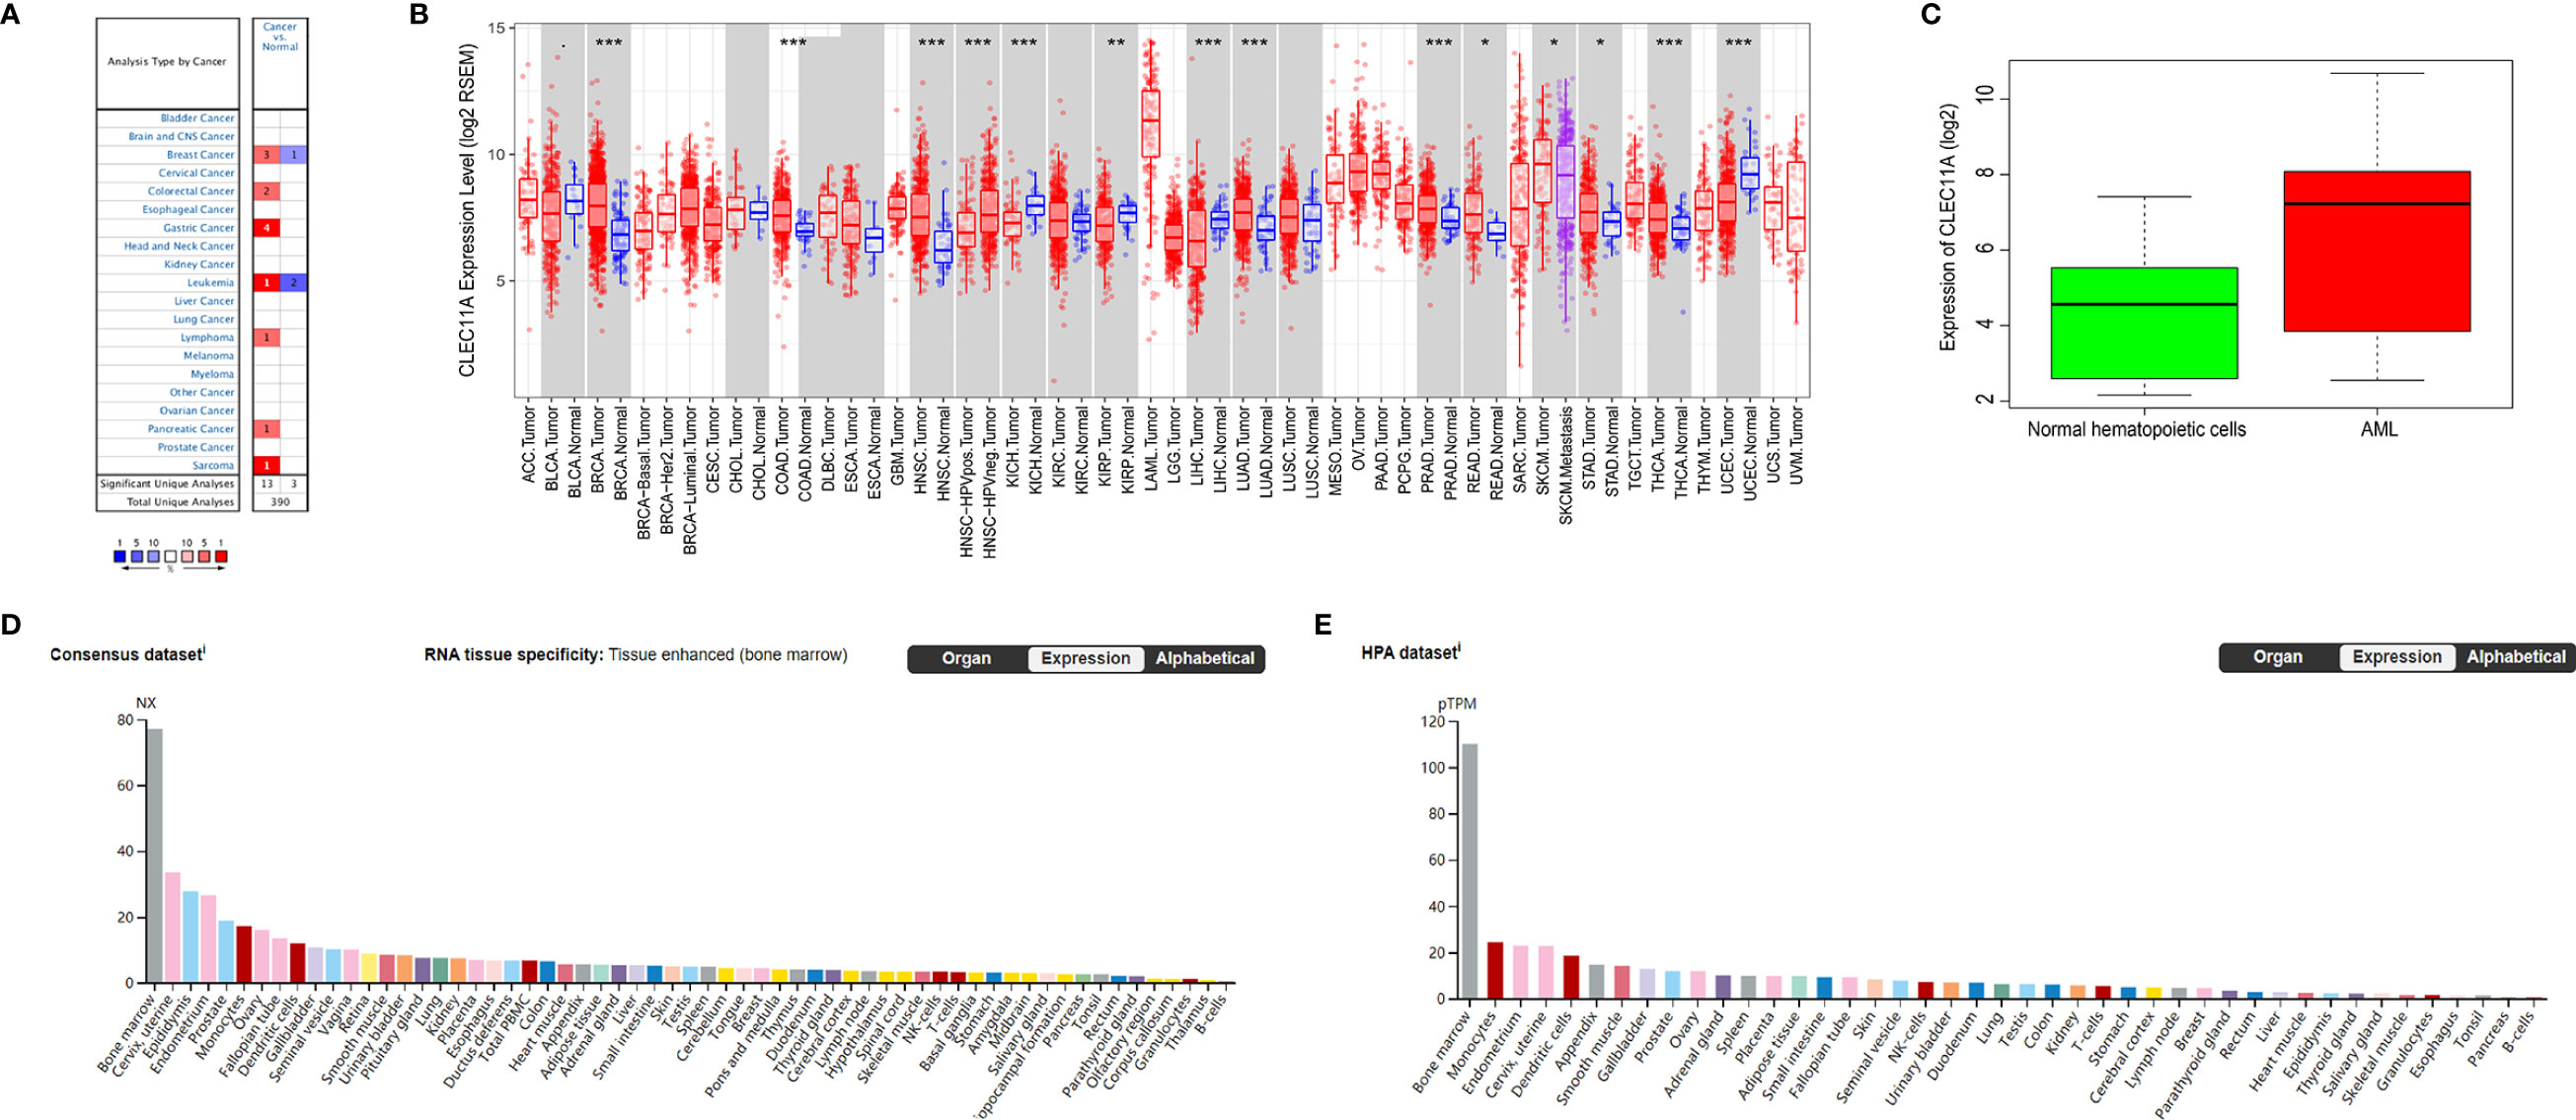
Figure 1 (A) CLEC11A expression levels in different tumors and normal tissues of multiple cancer types in the Oncomine database. (B) The differential expression between the tumor and adjacent normal tissues for CLEC11A across all TCGA tumors via TIMER. (C) Comparing CLEC11A expressions in AML and normal hematopoietic cells in GSE9476. (D, E) RNA expression overview of CLEC11A in different organs in the Consensus dataset and HPA dataset. *, p<0.05. **, p<0.01. ***, p<0.001.
To further explore CLEC11A expression in human cancers, we examined CLEC11A expression in TCGA. The differential expression between the tumor and normal tissues for CLEC11A is shown in Figure 1B in all TCGA tumors. It was obvious that CLEC11A expression in AML was the highest among all the tumors and normal tissues. Furthermore, a cohort (GEO database, GSE9476) of AML and normal hematopoietic cells showed that CLEC11A expression was much higher in AML than in normal hematopoietic cells (p = 4.78e-04) (Figure 1C).
We also investigated the data in Consensus dataset and HPA dataset, and found that CLEC11A expression level in bone marrow was the highest among all the tissues (Figures 1D, E).
Differences of Clinical Features Between Low CLEC11A Expression Group and High Group
With TCGA data, we investigated the differences of some clinical characteristics between low CLEC11A expression group and high group. It revealed that FAB subtype M0, mutated genes RUNX1 and TP53, complex karyotype, and risk status all had statistically significant p-values (Table 1).
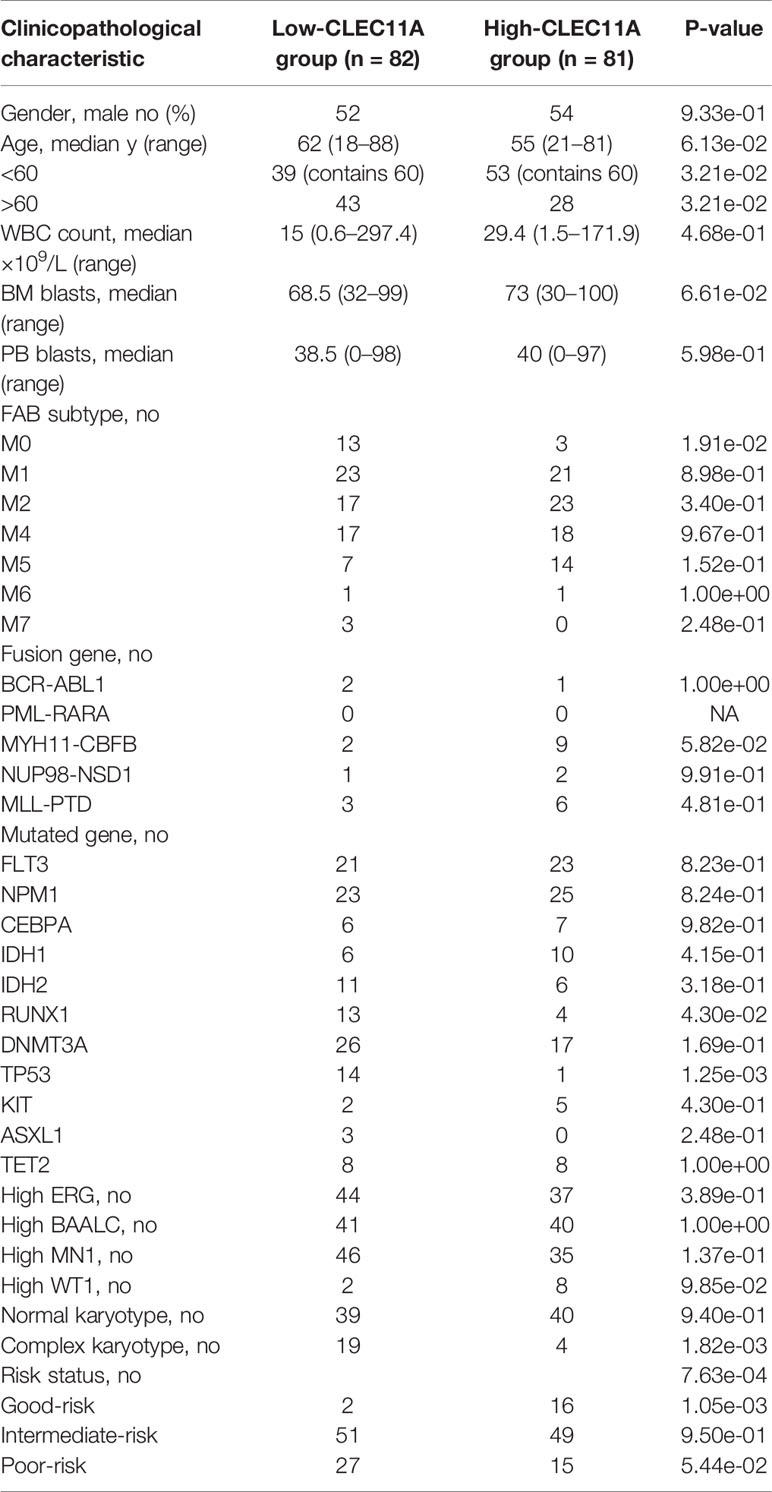
Table 1 Patients’ characteristics in the cohort of 163 TCGA patients according to CLEC11A expression level.
Further, BloodSpot and HemaExplorer database analysis found that the highest expression of CLEC11A was discovered in hematopoietic progenitor cells from granulocyte monocyte progenitors (GMP) and hematopoietic stem cells from promyelocyte from bone marrow (PM_BM) (Figures 2A, B). The results also showed significant differences in CLEC11A expression among various subtypes of AML (Figures 2C, D).
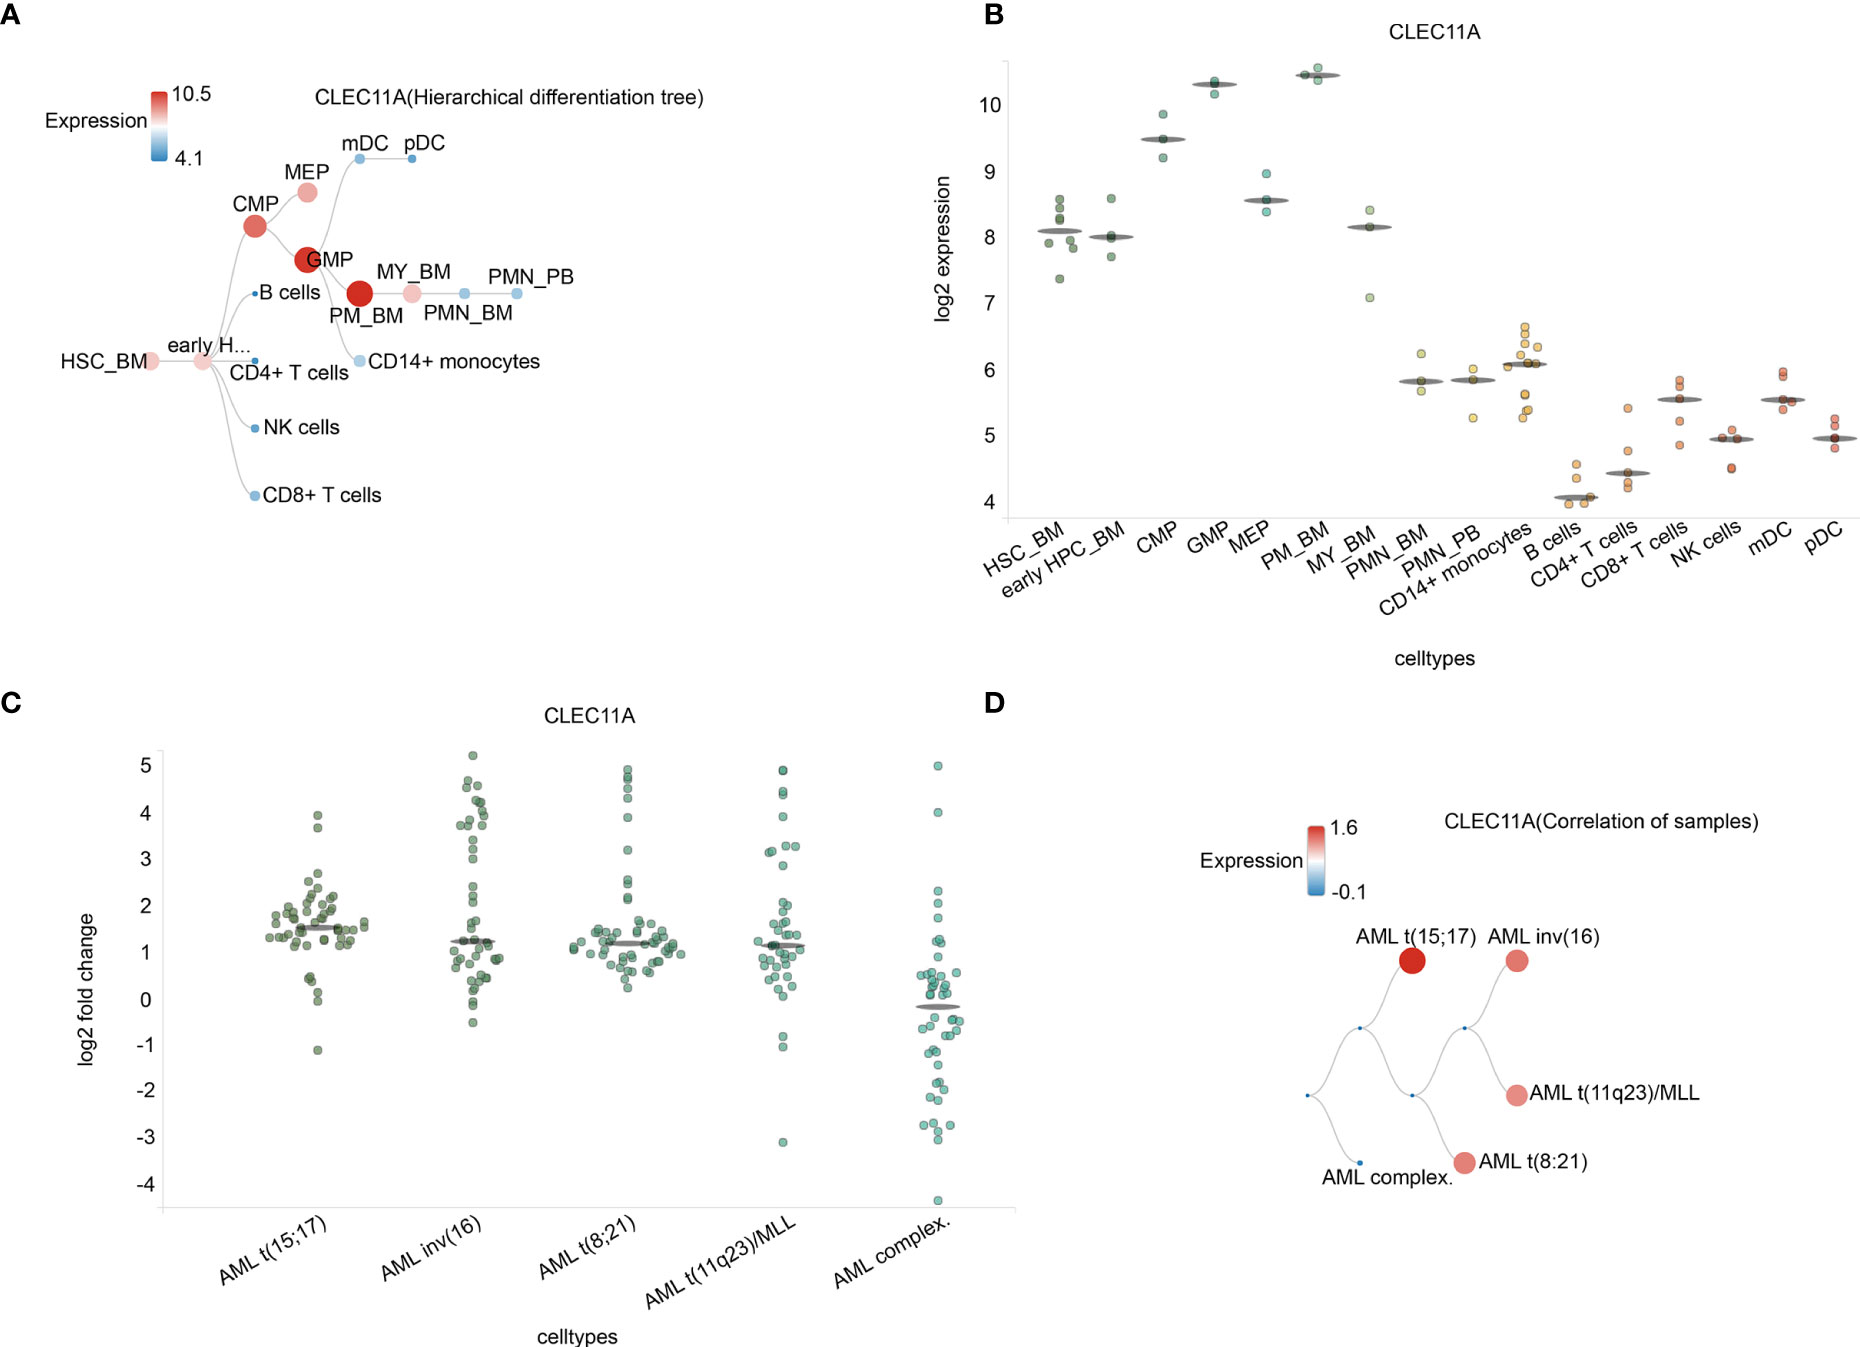
Figure 2 (A) Hierarchical difference tree about cell types with CLEC11A1 expression. (B) The expression of CLEC11A in a microarray in cell types. Horizontal lines represent the median expression for each class of cells. (C) Correlation of samples in different AML subtypes. (D) The expression of CLEC11A in different AML subtypes. Horizontal lines represent the median expression for each class of cell types. HSC_BM, Hematopoietic stem cells from bone marrow; early HPC_BM, Hematopoietic progenitor cells from bone marrow; CMP, Common myeloid progenitor cell; GMP, Granulocyte monocyte progenitors; MEP, Megakaryocyte-erythroid progenitor cell; PM_BM, Promyelocyte from bone marrow; MY_BM, Myelocyte from bone marrow; PMN_BM, Polymorphonuclear cells from bone marrow; PMN_PB, Polymorphonuclear cells from peripheral blood; B cells, CD19+ B cells; NK cells, CD56+ natural killer cells; mDC, CD11c+ myeloid dendritic cells; pDC, CD123+ plasmacytoid dendritic cells.
High CLEC11A Expression Is Associated With Favorable Survival in AML
Patient survival comparison was conducted between low and high CLEC11A expression groups in different datasets. The results showed that high CLEC11A expression was linked to better prognosis (OS p-value = 2e-04; EFS p-value = 6e-04) (Figures 3A, B). Meanwhile, the same conclusion was reached in the validation dataset (GSE6891, OS p-value = 0; EFS p-value = 0; RFS p-value = 2e-03) (Figures 3C–E).
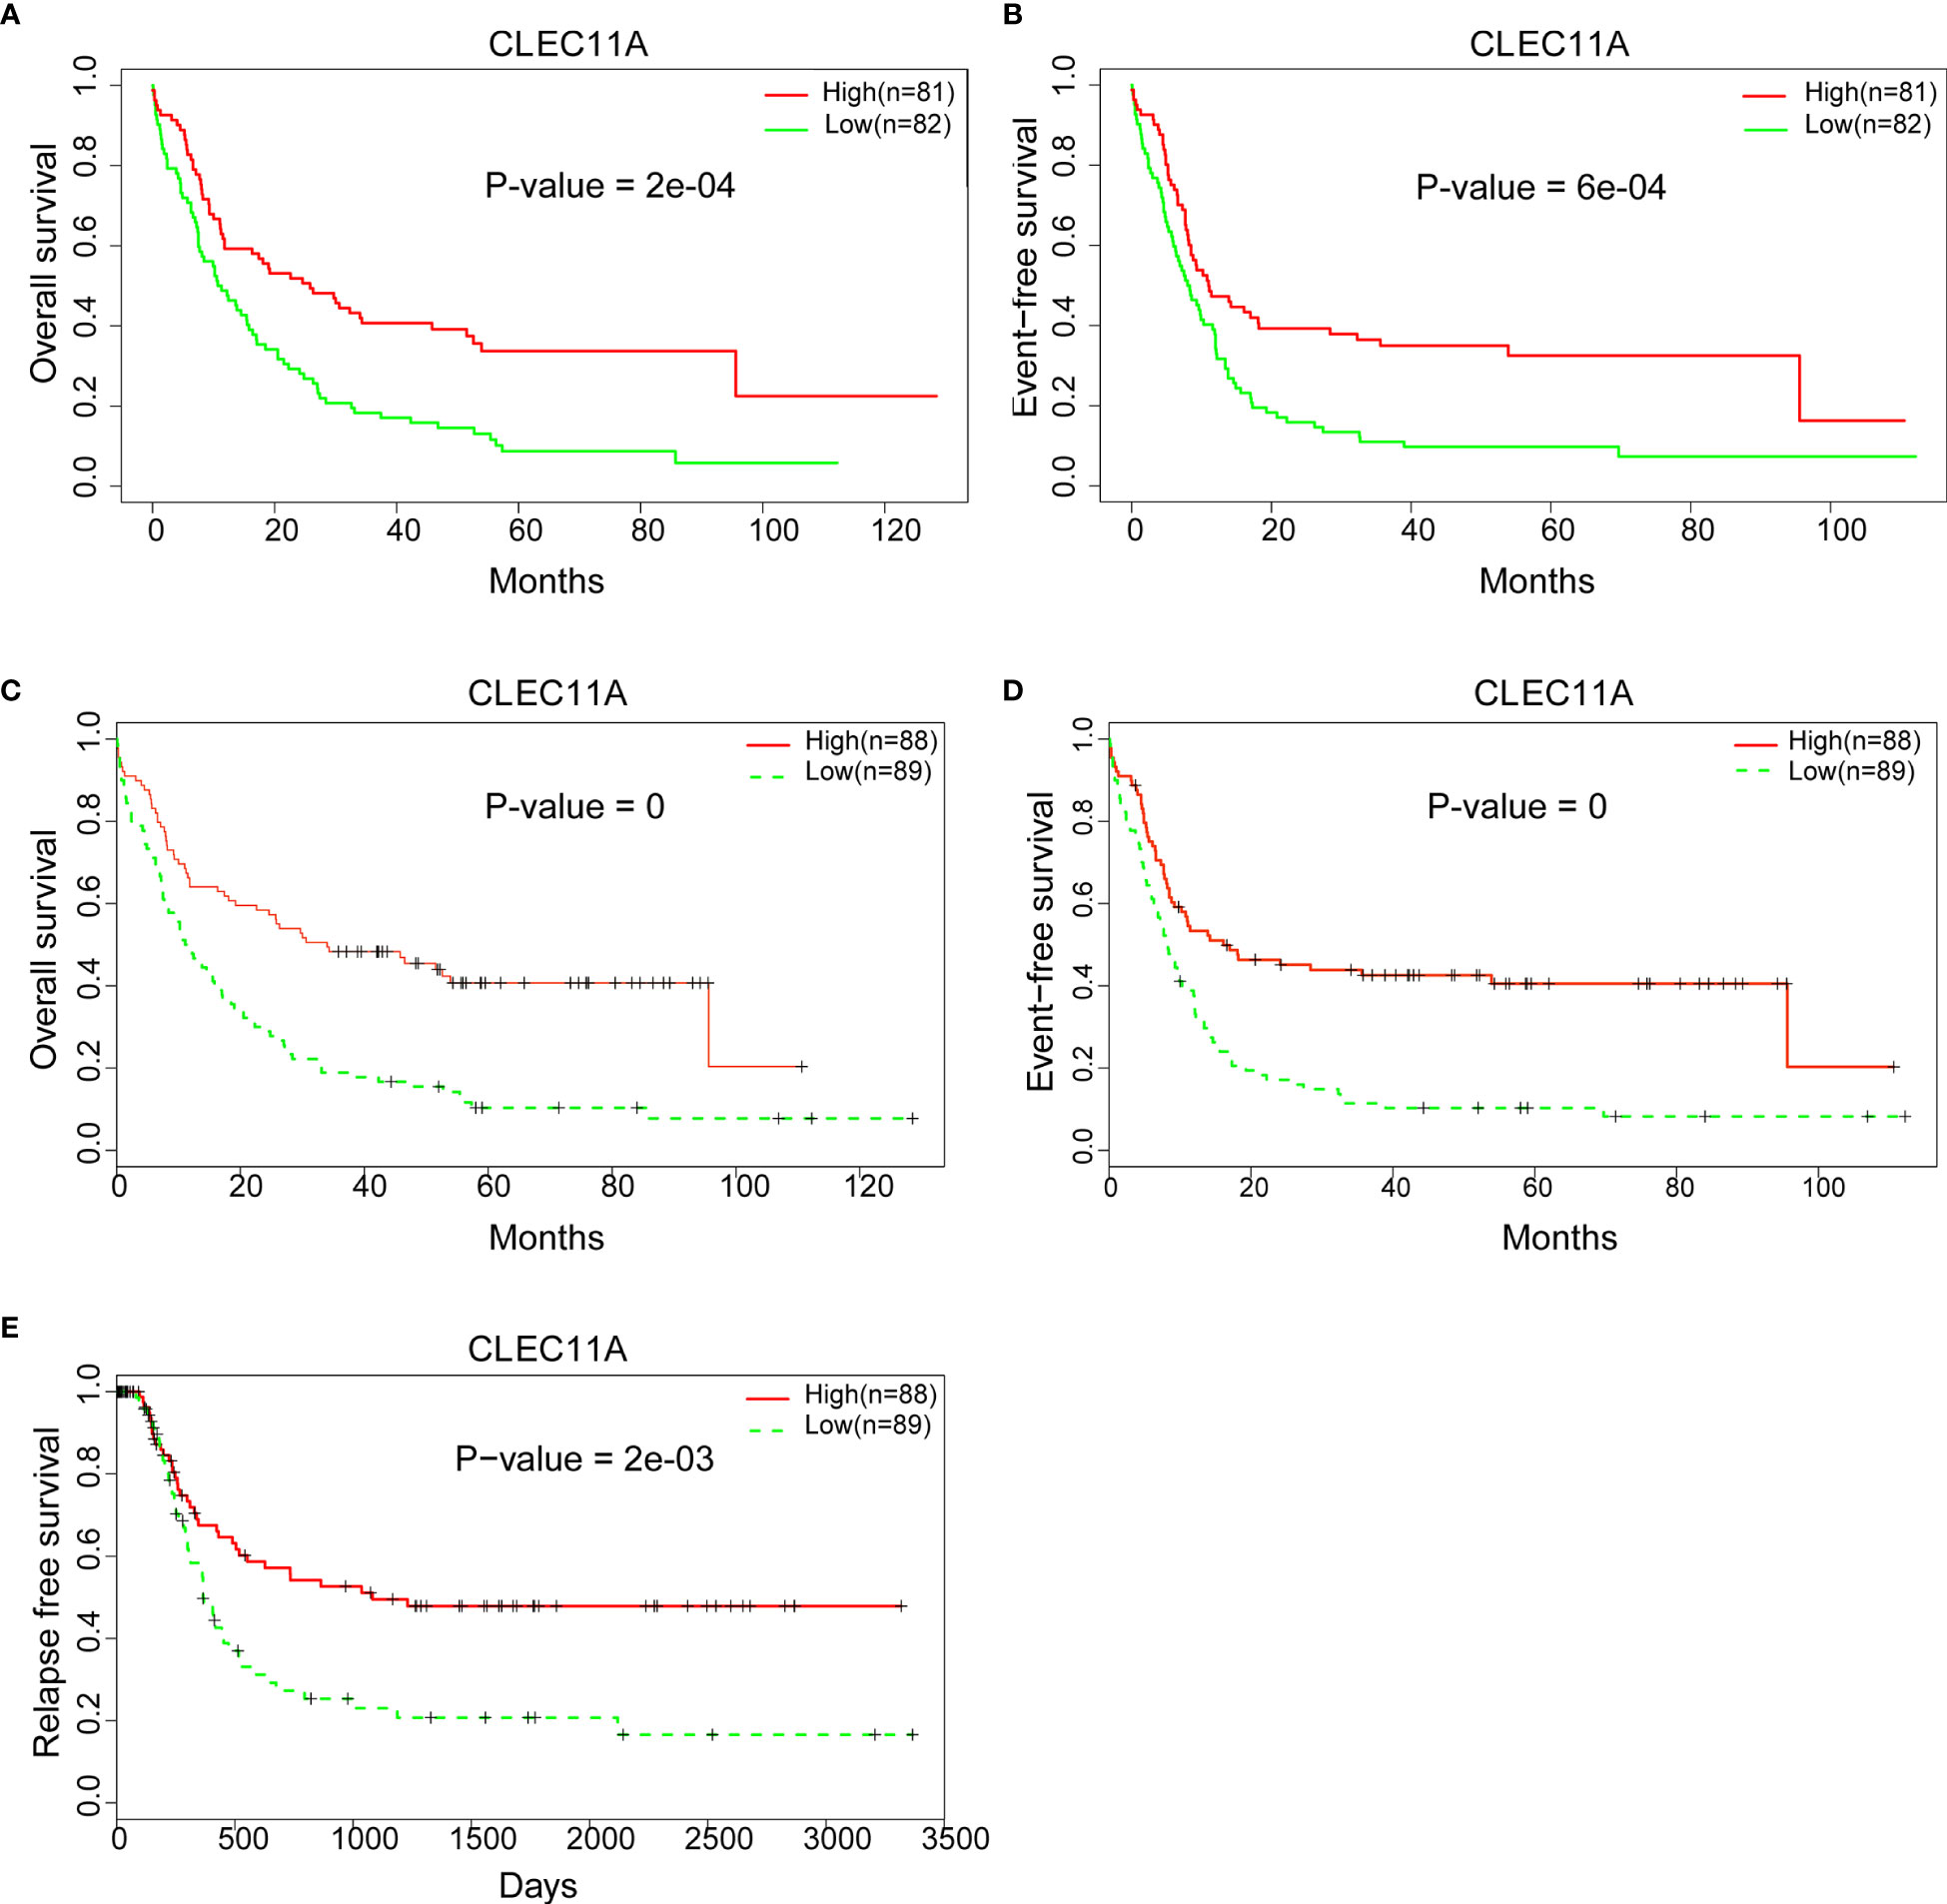
Figure 3 (A) Comparing the low and high expression of CLEC11A with OS in the TCGA dataset. (B) Comparing the low and high expression of CLEC11A with EFS in TCGA dataset. (C) Comparing the low and high expression of CLEC11A with OS in GSE6891. (D) Comparing the low and high expression of CLEC11A with EFS in GSE6891. (E) Comparing the low and high expression of CLEC11A with RFS in GSE6891.
We further constructed forest plots and nomogram of OS and EFS from the 163 samples together with independent prognostic factors (i.e., patient age, WBC, mutations of NPM1, CEBPA, TP53, or FLT3, and expression of CLEC11A). The nomogram quantitatively and intuitively displayed the probability of 1-year, 2-year, and 3-year OS and EFS (Figures 4A, B). Forest plots of OS and EFS showed that the confidence interval of the CLEC11A effective quantity was to the left of the invalid line (Figures 4C, D), indicating that high CLEC11A expression was a protective factor. This conclusion was in agreement with the Cox regression analysis (Figures 3A–C).
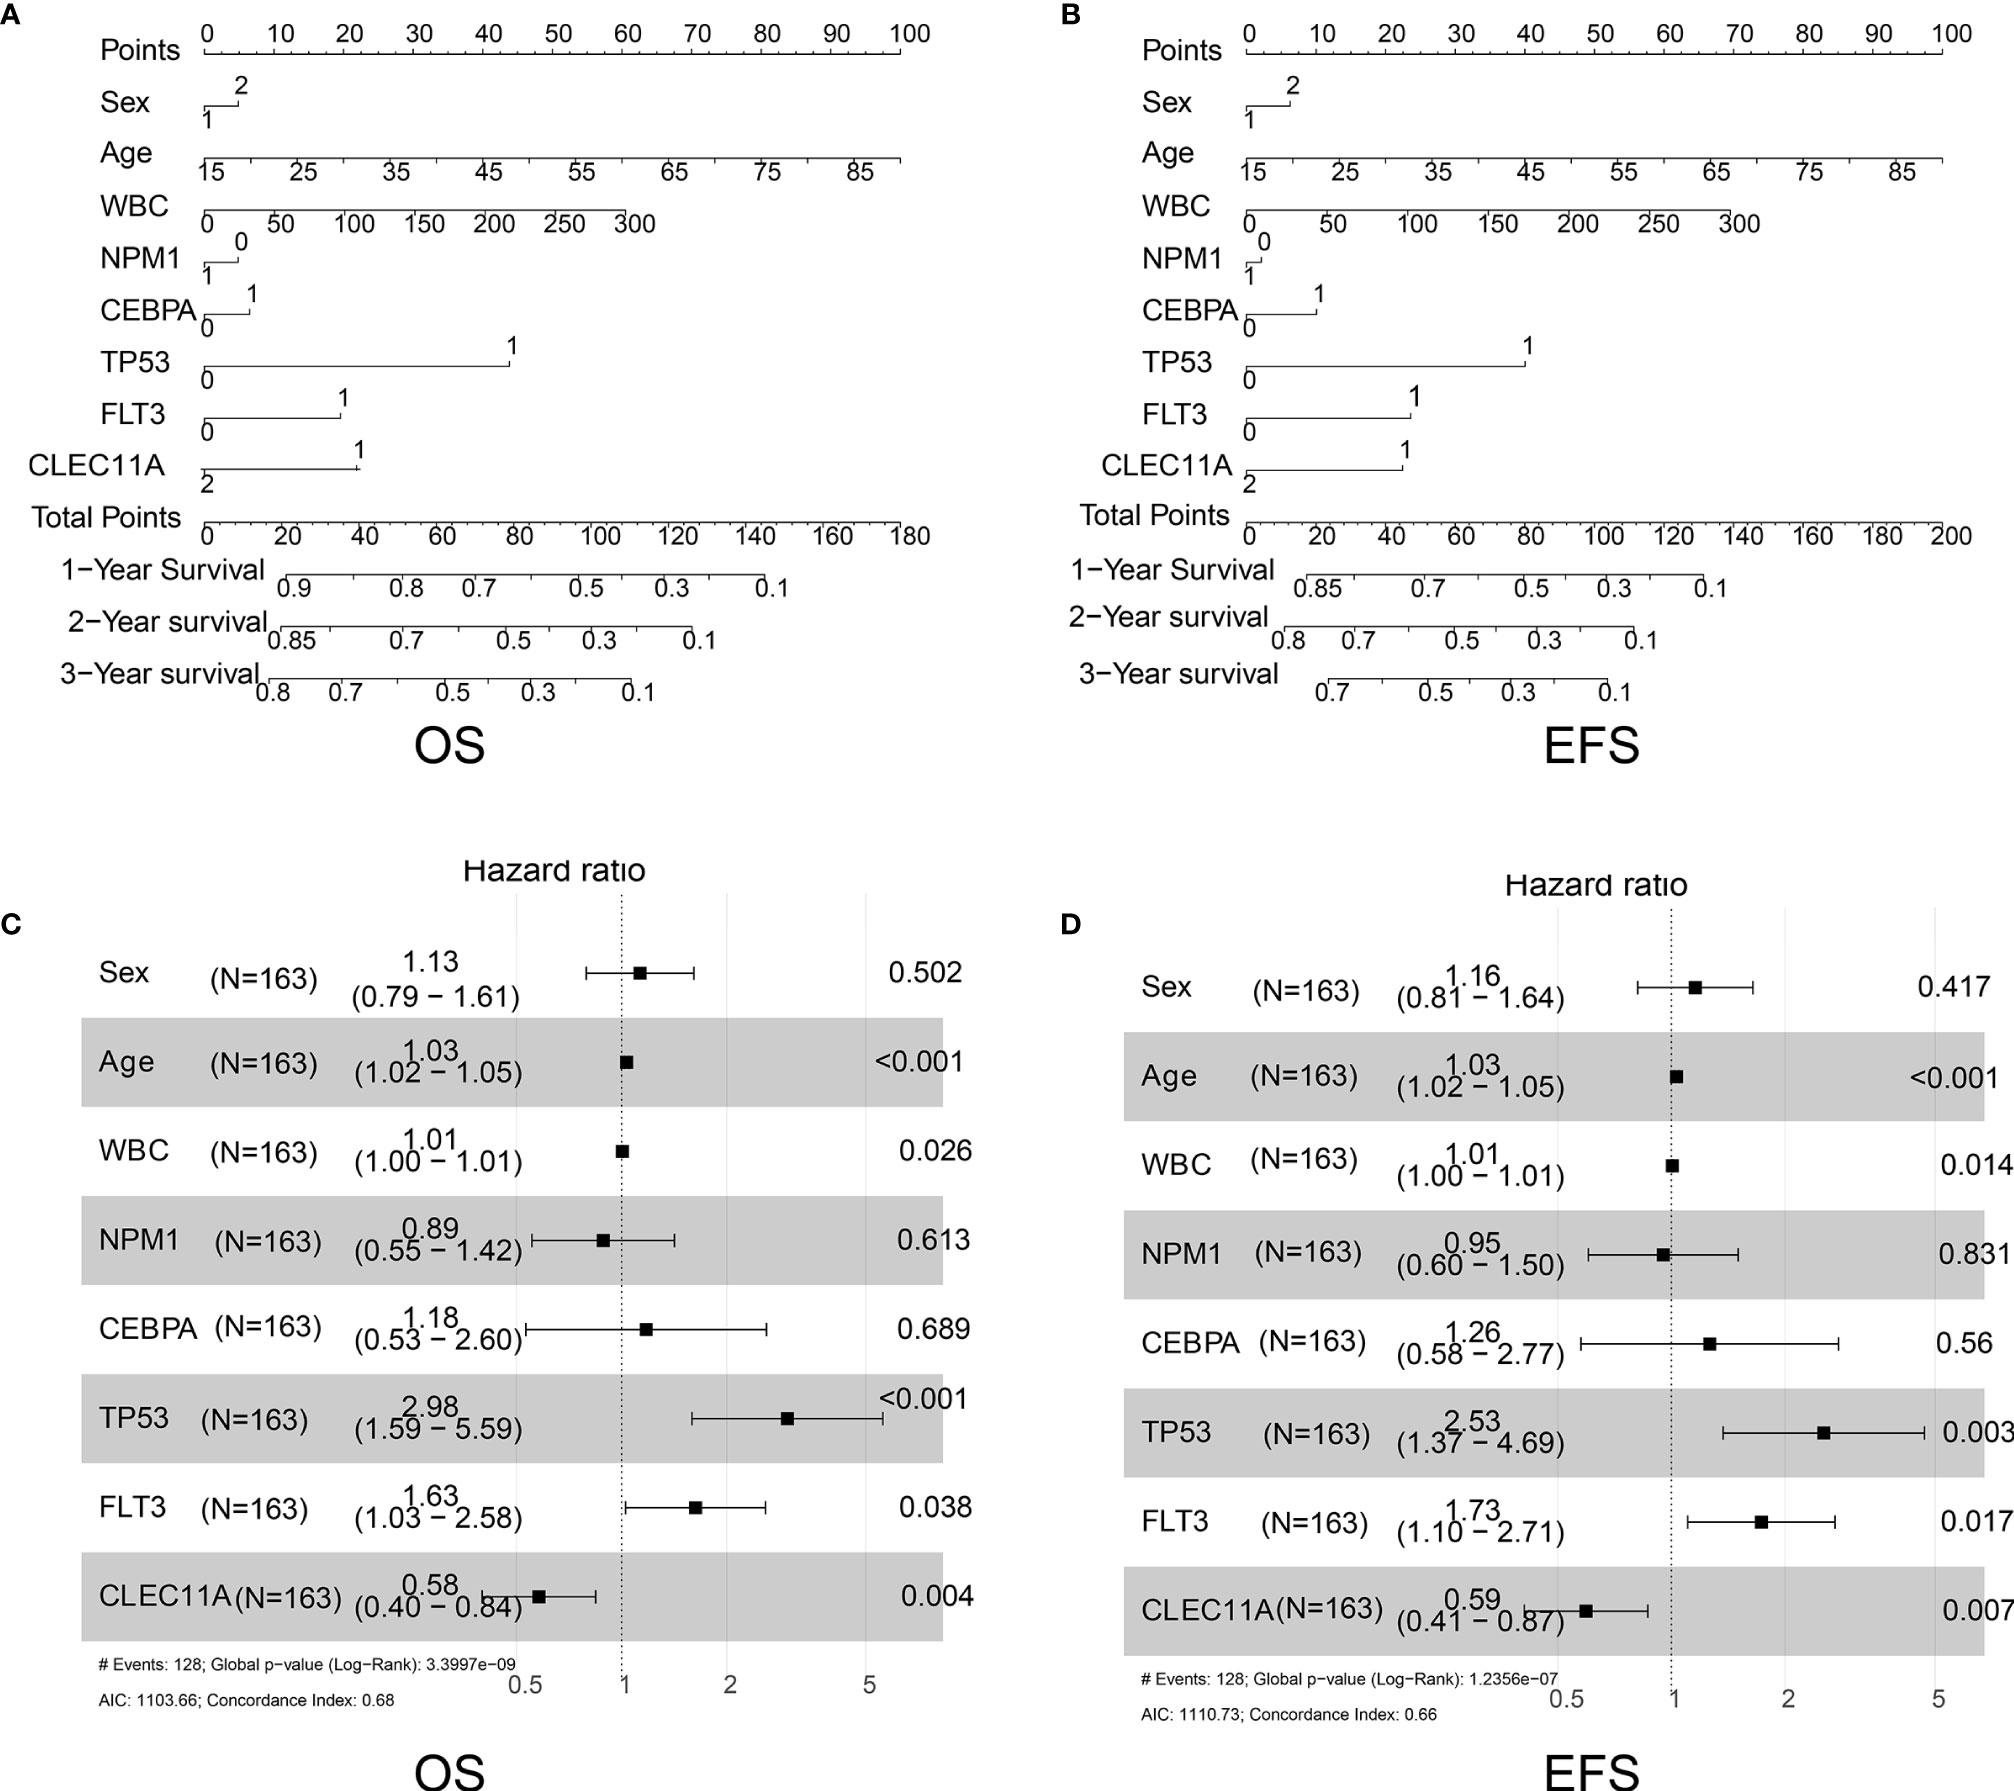
Figure 4 (A) Nomogram of OS in TCGA dataset. (B) Nomogram of EFS in TCGA dataset. (C) Forest plots of OS in TCGA dataset. (D) Forest plots of EFS in TCGA dataset.
CLEC11A DNA Methylation Level Is Associated With AML Induction Remission Rate and Survival
Subsequently, the relationship between the CLEC11A methylation level, namely the DNA methylation index (DMI) and mRNA expression (RPKM), was assessed using the DNA methylation and RNA Seq data for the 149 TCGA patients with de novo AML. This revealed a significant negative correlation between DMI and RPKM (r = −0.778, p < 0.001, Figure 5A). The DMI of CLEC11A was shown to significantly increase cytogenetic risk stratifications (p < 0.001), whereas the RPKM significantly decreased (p < 0.001) (Figure 5B).
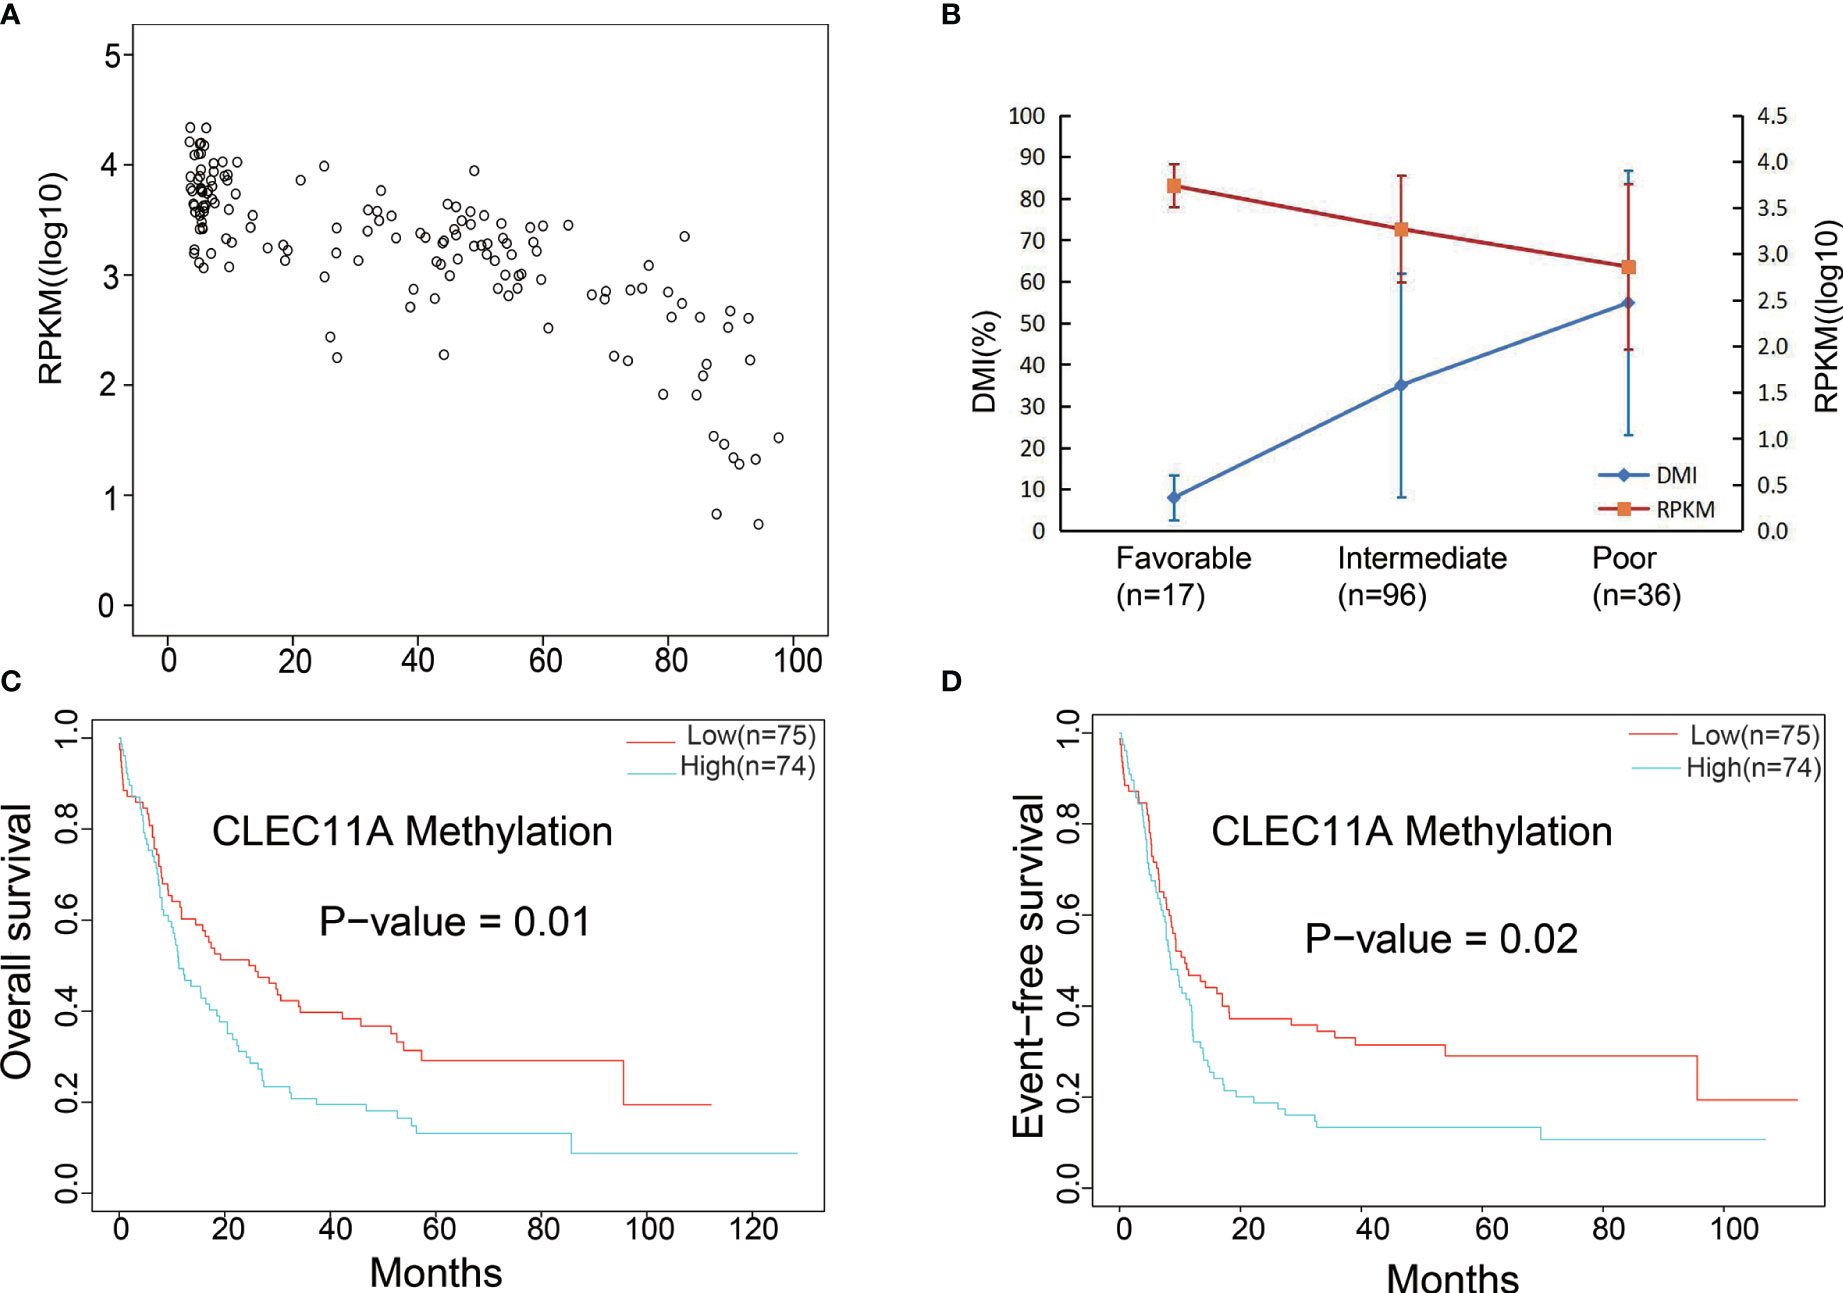
Figure 5 (A) Significant negative correlation between mRNA expression and DNA methylation data. (B) Gene expression levels and DNA methylation differences between each risk stratification were integrated to observe any relationship between methylation and expression. DMI (%), DNA methylation levels; RPKM, gene expression levels. (C) Comparing the low and high DNA methylation levels with OS in TCGA dataset. (D) Comparing the low and high DNA methylation levels with EFS in TCGA dataset.
The prognosis was compared between low and high CLEC11A DNA methylation levels groups. The results showed that high CLEC11A methylation levels group was linked to poorer prognosis (OS p-value = 1e-02; EFS p-value = 2e-02) (Figures 5C, D).
A total of 28 de novo AML patients in our center underwent retrospective detection of DNA methylation level of CLEC11A in bone marrow samples (33). The mean DMI of CLEC11A for patients in CR was less than that with none response (NR) (34.25 ± 5.88% vs. 46.30 ± 5.85%, p = 0.159). For the sake of further estimating the relationship between the regimen and CR, 28 patients were divided into a hypomethylation group (n = 14) and a hypermethylation group (n = 14) according to the median CLEC1A methylation level. In the 14 high-risk patients with hypermethylation, the CR rate of DCAG (including hypomethylating agents, decitabine) group (7/11, 63.6%) was better than that of the standard “7 + 3” group (1/3, 33.3%) (p = 0.538). In the 14 low-risk patients with hypomethylation, the CR rate of DCAG group was 75% (6/8) and that of the standard “7 + 3” group was 66.7% (4/6) (p = 1.000). These results suggested that CLEC11A hypermethylation was associated with a poor induction remission rate, but without a significant difference (8/14, 57.1% vs. 10/14, 71.4%, p = 0.695); these patients may benefit from a regimen including hypomethylating agents. The median OS for the high DMI and low DMI groups were 14.93 months and 23.8 months (p = 0.049), respectively, while the median DFS were 10.97 months and not defined (p = 0.395), respectively.
Heat Map, Volcano Plots, and Functional Enrichment
The analysis about CLEC11A-associated gene expression differential was performed to investigate the biological role of CLEC11A in the pathogenesis of leukemia by comparing the RNA expression levels of CLEC11A low expression group and high expression group. There were 207 upregulated and 179 downregulated genes associated with CLEC11A expression, both of which were presented in the expression heat map and volcano plots (Figures 6A, B). CLEC11A was seen in the heat map as an upregulated gene (Figure 6A). Functional enrichment showed that cytokine production and the negative regulation of cytokine secretion were relevant to CLEC11A (Figure 6C). We also analyzed the genes interacting with CLEC11A in STRING (Figure 6D).
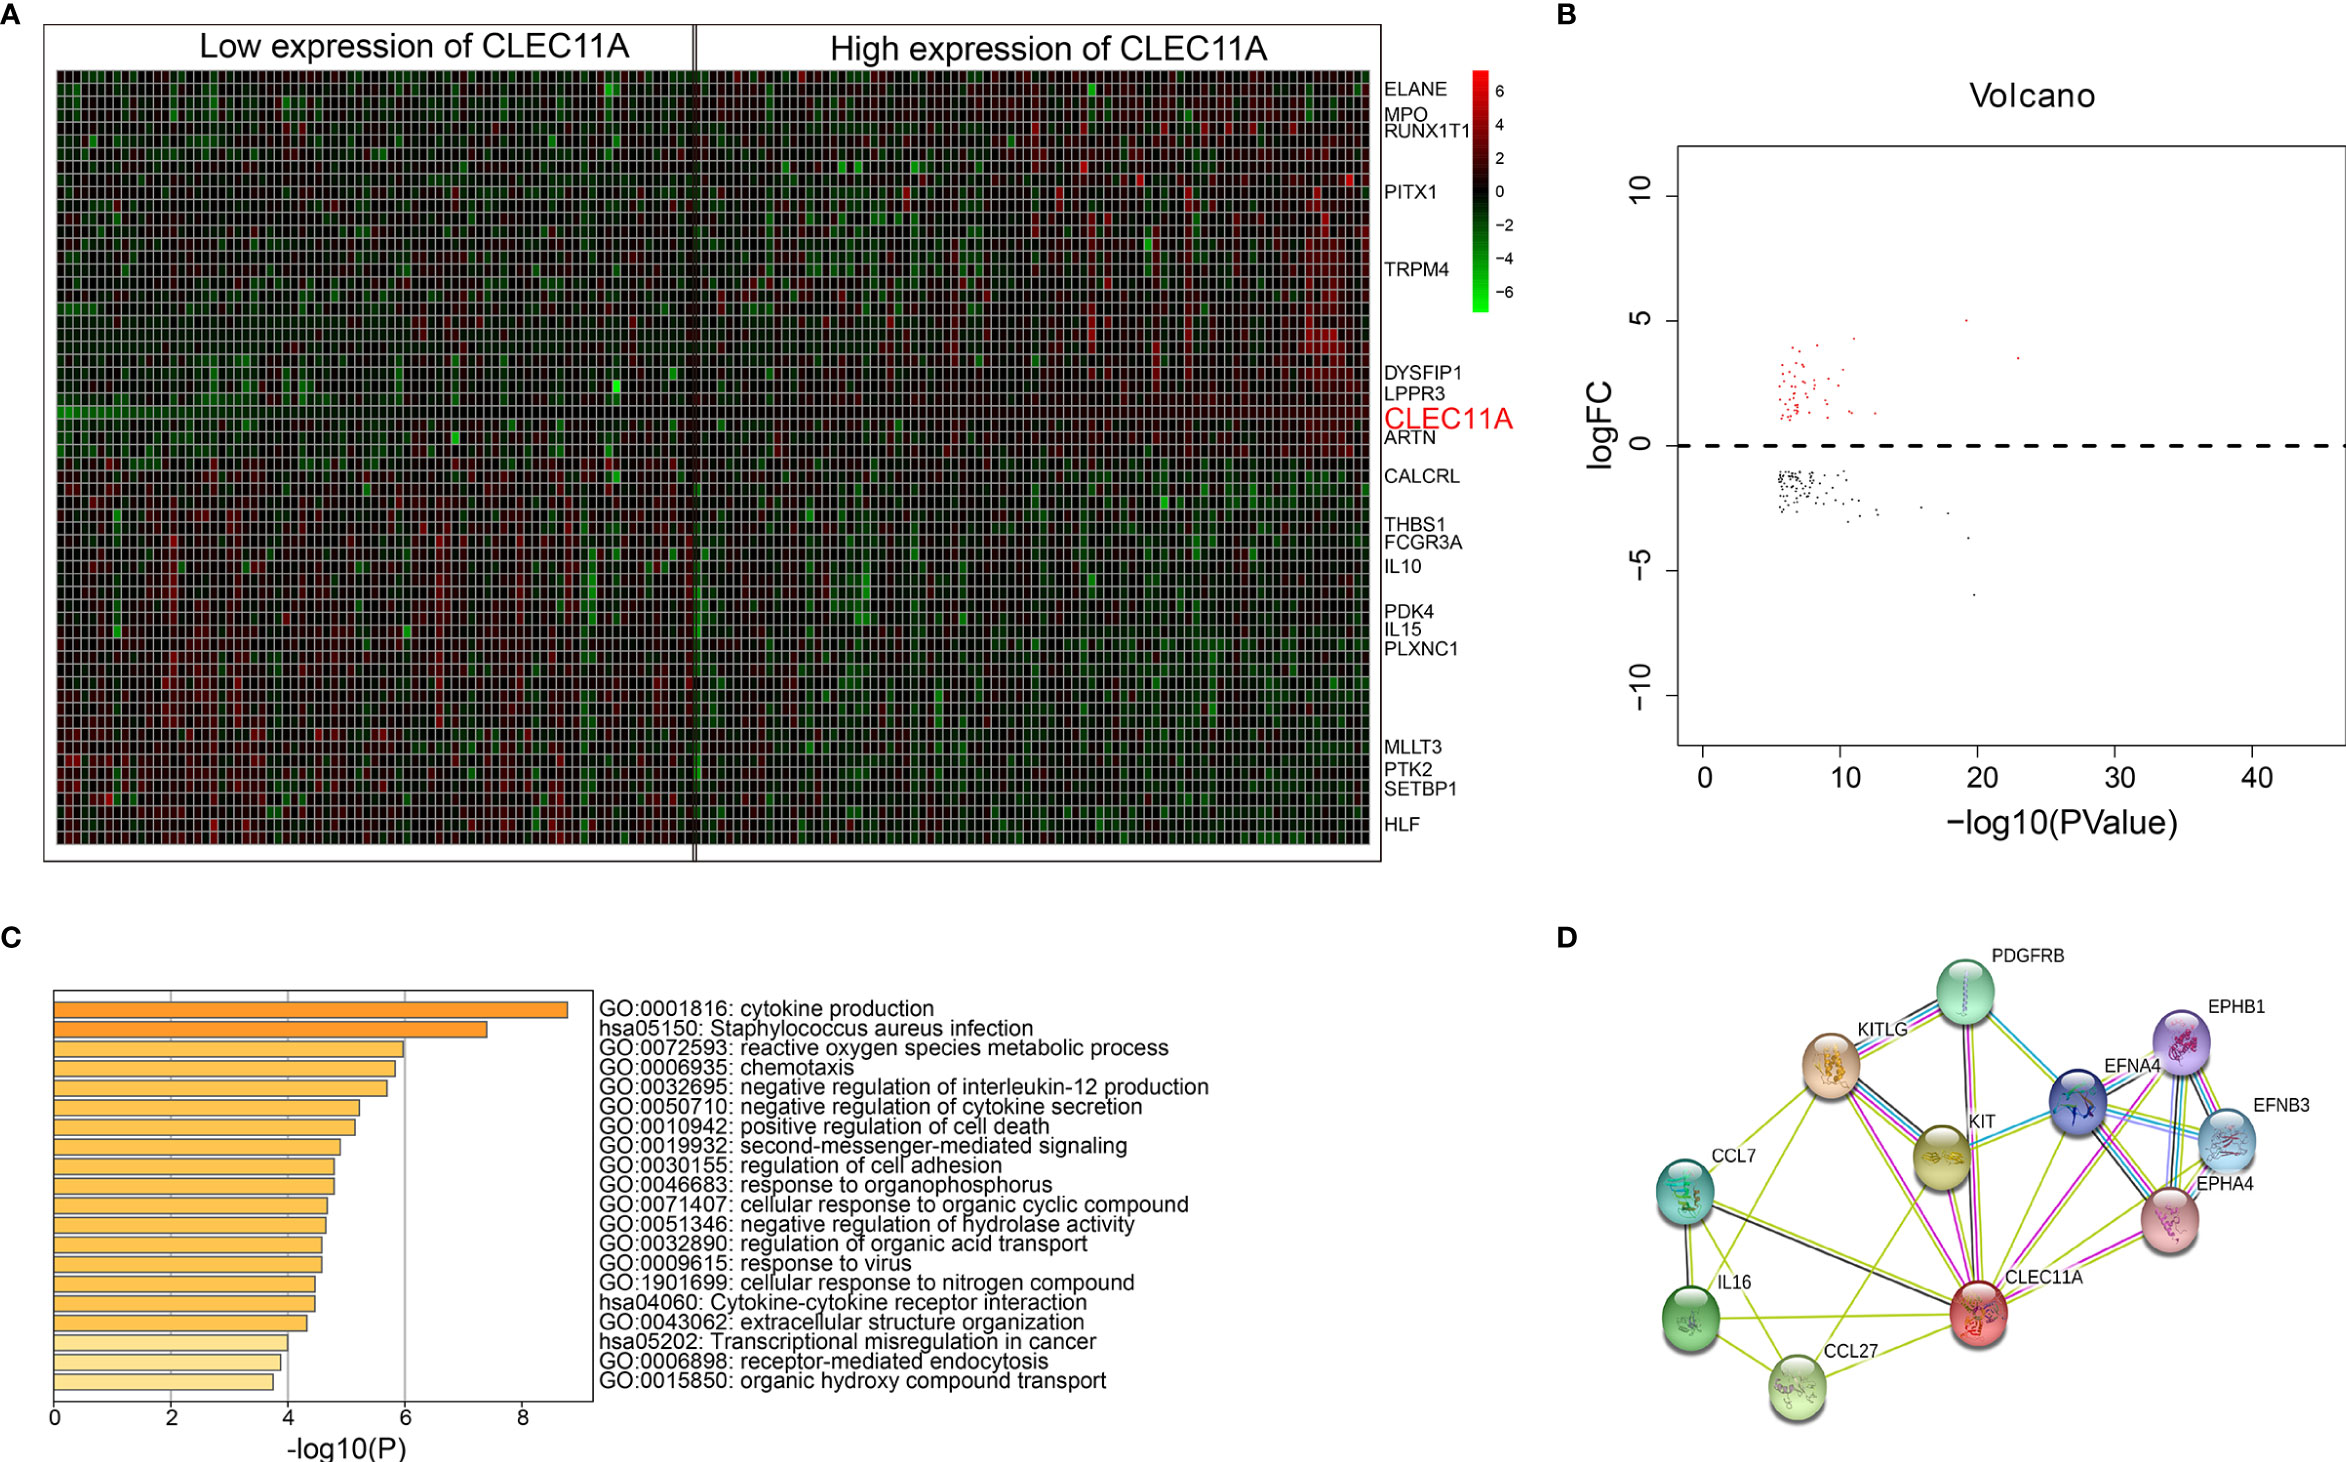
Figure 6 (A) Heat map for genes expression differential analysis between low and high CLEC11A expression of TCGA dataset. (B) Volcano plots for genes expression differential analysis between low and high groups of TCGA dataset. (C) Bar graph of enriched terms across enriched genes between low and high groups of the TCGA dataset, colored by p values. (D) Genes interacted with CLEC11A in STRING.
AML is a heterogeneous clonal disorder featured by the accumulation of somatic genetic alterations in hematopoietic progenitor cells, changing normal mechanisms
Discussion
AML is a heterogeneous clonal disorder featured by a clonal proliferation derived from primitive hematopoietic stem cells or progenitor cells (36). Immature malignant cells and fewer differentiated red blood cells, platelets, and white blood cells could be caused by abnormal differentiation of myeloid cells (36). Relapse remains the primary cause of treatment failure and mortality for AML patients (37). The clinical and genomic diversity of AML results in much of the difficulty in establishing a standard of care for relapsed AML (38). New management strategies are urgently needed for AML. Molecularly targeted agents will be a standard approach in induction and consolidation and serve as maintenance therapy after consolidation (39). Molecular testing plays a major role in AML (40) and is routinely performed as part of the diagnostic work-up. Our study provided direct evidence that high expression of CLEC11A predicted a favorable prognosis for AML. Firstly, CLEC11A expression in AML was obviously the highest among the multiple malignancies in TCGA via TIMER and significantly higher in AML tumors than normal tissues in GSE9476 (Figures 1B, C). Meanwhile, CLEC11A expression level in bone marrow was the highest among all the tissues in Consensus dataset and HPA dataset (Figure 1D). All these supported that CLEC11A was a significantly overexpressed gene in AML.
As for the clinical characteristics, patients with low CLEC11A expression were notably more than those with high CLEC11A expression in FAB M0 subtype compared with other subtypes, based on the TCGA cohorts (Table 1). Meanwhile, CLEC11A expression was statistically significantly associated with the mutated genes RUNX1 and TP53, complex karyotype, and risk status (Table 1). The BloodSpot and HemaExplorer database analyses found that the highest expression of CLEC11A was discovered in hematopoietic progenitor cells from granulocyte monocyte progenitors (GMP) and hematopoietic stem cells from promyelocyte from bone marrow (PM_BM), suggesting that CLEC11A was closely related to myeloid hematopoietic cells proliferation and differentiation (Figures 2A, B). These results demonstrated that CLEC11A was an early hematopoietic stimulator that might play an important role in the hematopoietic microenvironment of bone marrow (4, 21).
Several researches have studied on the expression and relationship of different gene panels with clinical outcomes in patients with AML (12, 13). Although CLEC11A was mentioned in these studies, the data used for analysis were only from TCGA datasets, and only the relationship between expression and clinical outcome was analyzed. Due to the different methods of analysis, the two studies obtained different gene panels and the former included six genes (TREML2, SLC7A11, NLRP2, DDIT4, LSP, and CLEC11A), while the latter included eight genes (TET3, S100A4, BATF, CLEC11A, PTP4A3, SPATS2L, SDHA, and ATOX1). Neither study focused on CLEC11A. Further, to better understand the correlation between CLEC11A expression and the prognosis of AML, the prognostic value of CLEC11A was confirmed in the independent group. A high level of CLEC11A expression was shown to be correlated with favorable OS and EFS in TCGA dataset (Figures 3A, B) and favorable RFS in GSE6891 (Figure 3C). Then we drew nomogram and forest plots of OS and EFS from the 163 samples of TCGA data (Figures 4A–D). This study demonstrated that CLEC11A was related to prognosis as a tumor suppressor gene. Moreover, in multivariable analyses including some known prognostic factors, high expression of CLEC11A was an independent factor for favorable OS and EFS (Figures 4C, D). Additionally, the nomogram showed a dramatic performance and clinical applicability (Figures 4A, B). All these results prove CLEC11A to be a potential biomarker, which might contribute to the precise prognosis and stratification of NCCN cytogenetically group in AML.
Moreover, CLEC11A DNA methylation also affected the levels of gene expression, and the methylation levels rose with increasing hazard ratio (HR) and poorer prognosis (Figures 5A, B). The application of demethylation drugs to inhibit the methylation of the CLEC11A gene is likely to be useful in treatment of AML. Additionally, DNA methylation was affected by the demethylating drug decitabine, and patients with higher CLEC11A methylation would be more suitable for DCAG therapy. Therefore, such a biomarker could be used to monitor cancer therapy with demethylating drugs that have shown promising results for AML.
The bioinformatics analysis indicated that CLEC11A was an upregulated gene (heat map, Figure 6A). Previous research showed that CLEC11A has a variety of biological activities and is mainly involved in cell proliferation and differentiation. Functional enrichment showed that cytokine production and the negative regulation of cytokine secretion were relevant to CLEC11A. Genes interacting with CLEC11A were also shown in STRING (Figure 6D). This study demonstrated that CLEC11A is an upregulated gene and might be crucial in the progress of leukemia.
The major limitation of the current study is that the results were mainly based on bioinformatics analysis of data in public databases. In the present study, we focused on the prognostic value of CLEC11A. We found and reported a phenomenon that high expression of CLEC11A predicts favorable prognosis in AML. Furthermore, the relationship between DNA methylation level and mRNA expression of CLEC11A was assessed, and the DNA methylation levels of CLEC11A of our own 28 de novo AML patients were detected and analyzed with chemotherapy. The relationship between methylation, expression, and prognosis has been initially presented by integrating the methylation, expression, survival, and chemotherapeutic efficacy, and it should be sufficient to draw a conclusion of the prognostic value of CLEC11A. We are also interested in the potential biological mechanism, and the relevant experiments are under investigation in our laboratory to verify the biological functions of CLEC11A. There are not enough results yet, so the experimental results are not given in this study and will be reported in future work.
Conclusions
In summary, our study provides evidence that CLEC11A expression is high in AML, and low CLEC11A expression and high DNA methylation were associated with poor prognosis. We draw the conclusion that CLEC11A is a prognostic biomarker in AML. We also found that CLEC11A was an upregulated gene in AML. We hoped that CLEC11A’s peculiar gene patterns will help us to further understand the heterogeneity mechanism of AML. It might be used to predict the AML prognosis and could guide the precise treatment in the future for AML patients.
Data Availability Statement
The original contributions presented in the study are included in the article/supplementary material. Further inquiries can be directed to the corresponding author.
Author Contributions
YL and CLY designed the study. CLY, JYZ and WG collected and interpreted the data. CLY and JYZ drafted the manuscript. YL, WG, LPD, YCL, MS, XDJ, LX and RLGW provided the expert consultations and clinical suggestions. YL and CLY revised the manuscript. All authors reviewed the final version of the manuscript. All authors contributed to the article and approved the submitted version.
Funding
This study was supported by National Natural Science Foundation of China (81800135 and 81902495), Medical Big Data and AI R&D Project of Chinese PLA General Hospital (2019MBD-001 and 2019MBD-025), National Key Research and Development Program of China (2017YFC0908400 and 2017YFC0908401).
Conflict of Interest
The authors declare that the research was conducted in the absence of any commercial or financial relationships that could be construed as a potential conflict of interest.
References
1. Pei S, Minhajuddin M, Adane B, Khan N, Stevens BM, Mack SC, et al. AMPK/FIS1-Mediated Mitophagy Is Required for Self-Renewal of Human AML Stem Cells. Cell Stem Cell (2018) 23(1):86–100.e6. doi: 10.1016/j.stem.2018.05.021
2. Papaemmanuil E, Gerstung M, Bullinger L, Gaidzik VI, Paschka P, Roberts ND, et al. Genomic Classification and Prognosis in Acute Myeloid Leukemia. N Engl J Med (2016) 374(23):2209–21. doi: 10.1056/NEJMoa1516192
3. Abhishek A, Parameswaran R, Yorleny V, Zhang K, Reshmi P. Hexosamine Biosynthetic Pathway (HBP) inhibition leads to AML cell differentiation and cell death. Mol Cancer Ther (2018) 17(10):2226–37. doi: 10.1158/1535-7163.MCT-18-0426
4. Perrin C, Bayle J, Bannwarth S, Michiels JF, Heudier P, Lefebvre JC, et al. Expression of LSLCL, a new C-type lectin, is closely restricted, in bone marrow, to immature neutrophils. Comptes Rendus l’Acad Des Sci Serie III Sci La Vie (2001) 324(12):1125–32. doi: 10.1016/s0764-4469(01)01392-0
5. Prada-Arismendy J, Arroyave JC, Röthlisberger S. Molecular biomarkers in acute myeloid leukemia. Blood Rev (2017) 31(1):63–76. doi: 10.1016/j.blre.2016.08.005
6. Chen X, Cherian S. Acute Myeloid Leukemia Immunophenotyping by Flow Cytometric Analysis. Clinics Lab Med (2017) 37(4):753–69. S0272271217300653. doi: 10.1016/j.cll.2017.07.003
7. Stölzel F, Mohr B, Kramer M, Oelschlägel U, Bochtler T, Berdel WE, et al. Karyotype complexity and prognosis in acute myeloid leukemia. Blood Cancer J (2016) 6(1):e386. doi: 10.1038/bcj.2015.114
8. Döhner H, Gaidzik VI. Impact of genetic features on treatment decisions in AML. Hematol Am Soc Hematol Educ Program (2011) 2011:36–42. doi: 10.1182/asheducation-2011.1.36
9. Tallman MS, Wang ES, Altman JK, Appelbaum FR, Bhatt VR, Bixby D, et al. Acute Myeloid Leukemia, Version 3.2019, NCCN Clinical Practice Guidelines in Oncology. J Natl Compr Cancer Netw JNCCN (2019) 17(6):721–49. doi: 10.6004/jnccn.2019.0028
10. Santos FP, Jones D, Qiao W, Cortes JE, Ravandi F, Estey EE, et al. Prognostic value of FLT3 mutations among different cytogenetic subgroups in acute myeloid leukemia. Cancer (2011) 117(10):2145–55. doi: 10.1002/cncr.25670
11. Sahin FI, Kizilkilic E, Bulakbasi T, Yilmaz Z, Boga C, Ozalp O, et al. Cytogenetic findings and clinical outcomes of adult acute myeloid leukaemia patients. Clin Exp Med (2007) 7(3):102. doi: 10.1007/s10238-007-0130-2
12. Wouters BJ, Delwel R. Epigenetics and approaches to targeted epigenetic therapy in acute myeloid leukemia. Blood (2016) 127(1):42–52. doi: 10.1182/blood-2015-07-604512
13. Berdasco M, Esteller M. Aberrant epigenetic landscape in cancer: how cellular identity goes awry. Dev Cell (2010) 19(5):698–711. doi: 10.1016/j.devcel.2010.10.005
14. Leygo C, Williams M, Jin HC, Chan MWY, Chu WK, Grusch M, et al. DNA Methylation as a Noninvasive Epigenetic Biomarker for the Detection of Cancer. Dis Markers (2017) 2017:3726595. doi: 10.1155/2017/3726595
15. Li Y, Xu Q, Lv N, Wang L, Zhao H, Wang X, et al. Clinical implications of genome-wide DNA methylation studies in acute myeloid leukemia. J Hematol Oncol (2017) 10(1):41. doi: 10.1186/s13045-017-0409-z
16. Zhao X, Li Y, Wu H. A novel scoring system for acute myeloid leukemia risk assessment based on the expression levels of six genes. Int J Mol Med (2018) 42(3):1495–507. doi: 10.3892/ijmm.2018.3739
17. Zhang Y, Xiao L. Identification and validation of a prognostic 8-gene signature for acute myeloid leukemia. Leuk Lymphoma (2020) 61(8):1981–8. doi: 10.1080/10428194.2020.1742898
18. Li Y, Zhao H, Xu Q, Lv N, Jing Y, Wang L, et al. Detection of prognostic methylation markers by methylC-capture sequencing in acute myeloid leukemia. Oncotarget (2017) 8(66):110444–59. doi: 10.18632/oncotarget.22789
19. Kisiel JB, Raimondo M, Taylor WR, Yab TC, Mahoney DW, Sun Z, et al. New DNA Methylation Markers for Pancreatic Cancer: Discovery, Tissue Validation, and Pilot Testing in Pancreatic Juice. Clin Cancer Res (2015) 21(19):4473–81. doi: 10.1158/1078-0432.ccr-14-2469
20. Levina V, Marrangoni AM, DeMarco R, Gorelik E, Lokshin AE. Drug-selected human lung cancer stem cells: cytokine network, tumorigenic and metastatic properties. PLoS One (2008) 3(8):e3077. doi: 10.1371/journal.pone.0003077
21. Hiraoka A, Sugimura A, Seki T, Nagasawa T, Ohta N, Shimonishi M, et al. Cloning, expression, and characterization of a cDNA encoding a novel human growth factor for primitive hematopoietic progenitor cells. Proc Natl Acad Sci U S A (1997) 94(14):7577–82. doi: 10.1073/pnas.94.14.7577
22. Ito C, Sato H, Ando K, Watanabe S, Yoshiba F, Kishi K, et al. Serum stem cell growth factor for monitoring hematopoietic recovery following stem cell transplantation. Bone Marrow Transplant (2003) 32(4):391–8. doi: 10.1038/sj.bmt.1704152
23. Keller CC, Ouma C, Ouma Y, Awandare GA, Perkins DJ. Suppression of a Novel Hematopoietic Mediator in Children with Severe Malarial Anemia. Infect Immun (2009) 77(9):3864–71. doi: 10.1128/IAI.00342-09
24. Silveira VS, Scrideli CA, Moreno DA, Yunes JA, Queiroz RG, Toledo SC, et al. Gene expression pattern contributing to prognostic factors in childhood acute lymphoblastic leukemia. Leuk Lymphoma (2013) 54(2):310–4. doi: 10.3109/10428194.2012.710330
25. Bhojwani D, Kang H, Moskowitz NP, Min DJ, Lee H, Potter JW, et al. Biologic pathways associated with relapse in childhood acute lymphoblastic leukemia: a Children’s Oncology Group study. Blood (2006) 108(2):711–7. doi: 10.1182/blood-2006-02-002824
26. Yue R, Shen B, Morrison SJ. Clec11a/osteolectin is an osteogenic growth factor that promotes the maintenance of the adult skeleton. eLife (2016) 5:e18782. doi: 10.7554/eLife.18782
27. Laganà A, Perumal D, Melnekoff D, Readhead B, Kidd BA, Leshchenko V, et al. Integrative network analysis identifies novel drivers of pathogenesis and progression in newly diagnosed multiple myeloma. Leukemia (2018) 32(1):120–30. doi: 10.1038/leu.2017.197
28. Wilson BJ, Giguère V. Identification of novel pathway partners of p68 and p72 RNA helicases through Oncomine meta-analysis. BMC Genomics (2007) 8:419. doi: 10.1186/1471-2164-8-419
29. Li T, Fan J, Wang B, Traugh N, Chen Q, Liu JS, et al. TIMER: a web server for comprehensive analysis of tumor-infiltrating immune cells. Cancer Res (2017) 77:e108–10. doi: 10.1158/0008-5472.CAN-17-0307
30. Thul PJ, Lindskog C. The human protein atlas: A spatial map of the human proteome. Protein Sci Publ Protein Soc (2018) 27(1):233–44. doi: 10.1002/pro.3307
31. Barrett T, Wilhite SE, Ledoux P, Evangelista C, Kim IF, Tomashevsky M, et al. NCBI GEO: archive for functional genomics data sets–update. Nucleic Acids Res (2013) 41(Database issue):D991. doi: 10.1093/nar/gks1193
32. Tomczak K, Czerwińska P, Wiznerowicz M. The Cancer Genome Atlas (TCGA): an immeasurable source of knowledge. Contemp Oncol (Poznan Poland) (2015) 19(1a):A68–77. doi: 10.5114/wo.2014.47136
33. Bagger FO, Sasivarevic D, Sohi SH, Laursen LG, Pundhir S, Sønderby CK, et al. BloodSpot: a database of gene expression profiles and transcriptional programs for healthy and malignant haematopoiesis. Nucleic Acids Res (2016) 44(D1):D917–24. doi: 10.1093/nar/gkv1101
34. Bagger FO, Rapin N, Theilgaard-Mönch K, Kaczkowski B, Thoren LA, Jendholm J, et al. HemaExplorer: a database of mRNA expression profiles in normal and malignant haematopoiesis. Nucleic Acids Res (2013) 41(Database issue):D1034–D9. doi: 10.1093/nar/gks1021
35. Creutzig U, Kaspers GJ. Revised recommendations of the International Working Group for diagnosis, standardization of response criteria, treatment outcomes, and reporting standards for therapeutic trials in acute myeloid leukemia. J Clin Oncol (2004) 22(16):3432–3. doi: 10.1200/jco.2004.99.116
36. Khwaja A, Bjorkholm M, Gale RE, Levine RL, Jordan CT, Ehninger G, et al. Acute myeloid leukaemia. Nat Rev Dis Primers (2016) 2:16010. doi: 10.1038/nrdp.2016.10
37. Megías-Vericat JE, Martínez-Cuadrón D, Sanz M, Montesinos P. Salvage regimens using conventional chemotherapy agents for relapsed/refractory adult AML patients: a systematic literature review. Ann Hematol (2018) 97(7):1115–53. doi: 10.1007/s00277-018-3304-y
38. Medeiros BC. Is there a standard of care for relapsed AML? Best Pract Res Clin Haematol (2018) 31(4):384–6. doi: 10.1016/j.beha.2018.09.006
39. Kayser S, Levis MJ. Advances in targeted therapy for acute myeloid leukaemia. Br J Haematol (2018) 180(4):484–500. doi: 10.1111/bjh.15032
Keywords: CLEC11A, acute myeloid leukemia, prognosis, biomarker, methylation, expression
Citation: Yin C, Zhang J, Guan W, Dou L, Liu Y, Shen M, Jia X, Xu L, Wu R and Li Y (2021) High Expression of CLEC11A Predicts Favorable Prognosis in Acute Myeloid Leukemia. Front. Oncol. 11:608932. doi: 10.3389/fonc.2021.608932
Received: 22 September 2020; Accepted: 04 January 2021;
Published: 02 March 2021.
Edited by:
Anjali Mishra, Sidney Kimmel Cancer Center, United StatesReviewed by:
Michael Diamantidis, University Hospital of Larissa, GreeceHouda Alachkar, University of Southern California, United States
Copyright © 2021 Yin, Zhang, Guan, Dou, Liu, Shen, Jia, Xu, Wu and Li. This is an open-access article distributed under the terms of the Creative Commons Attribution License (CC BY). The use, distribution or reproduction in other forums is permitted, provided the original author(s) and the copyright owner(s) are credited and that the original publication in this journal is cited, in accordance with accepted academic practice. No use, distribution or reproduction is permitted which does not comply with these terms.
*Correspondence: Yan Li, bGl5YW4wNDExMzQ2QDE2My5jb20=
†These authors have contributed equally to this work
 Chengliang Yin
 Junyan Zhang1,3†
 Wei Guan
 Ming Shen
 Xiaodong Jia
 Lu Xu
Lu Xu Yan Li