 Kaixuan Guo
 Cong Lai1,2†
 Kewei Xu
- 1Department of Urology, Sun Yat-sen Memorial Hospital, Sun Yat-sen University, Guangzhou, China
- 2Guangdong Provincial Key Laboratory of Malignant Tumor Epigenetics and Gene Regulation, Sun Yat-sen Memorial Hospital, Sun Yat-sen University, Guangzhou, China
Background: Prostate cancer (PCa) is one of the most prevalent cancers among males, and its mortality rate is increasing due to biochemical recurrence (BCR). Glycolysis has been proven to play an important regulatory role in tumorigenesis. Although several key regulators or predictors involved in PCa progression have been found, the relationship between glycolysis and PCa is unclear; we aimed to develop a novel glycolysis-associated multifactor prediction model for better predicting the prognosis of PCa.
Methods: Differential mRNA expression profiles derived from the Cancer Genome Atlas (TCGA) PCa cohort were generated through the “edgeR” package. Glycolysis-related genes were obtained from the GSEA database. Univariate Cox and LASSO regression analyses were used to identify genes significantly associated with disease-free survival. ROC curves were applied to evaluate the predictive value of the model. An external dataset derived from Gene Expression Omnibus (GEO) was used to verify the predictive ability. Glucose consumption and lactic production assays were used to assess changes in metabolic capacity, and Transwell assays were used to assess the invasion and migration of PC3 cells.
Results: Five glycolysis-related genes were applied to construct a risk score prediction model. Patients with PCa derived from TCGA and GEO (GSE70770) were divided into high-risk and low-risk groups according to the median. In the TCGA cohort, the high-risk group had a poorer prognosis than the low-risk group, and the results were further verified in the GSE70770 cohort. In vitro experiments demonstrated that knocking down HMMR, KIF20A, PGM2L1, and ANKZF1 separately led to less glucose consumption, less lactic production, and inhibition of cell migration and invasion, and the results were the opposite with GPR87 knockdown.
Conclusion: The risk score based on five glycolysis-related genes may serve as an accurate prognostic marker for PCa patients with BCR.
Introduction
Prostate cancer (PCa) is the second most common cause of male malignant tumors and the second leading cause of tumor-associated death in males worldwide (1, 2). According to statistics, there were 1.3 million new cases and 359,000 related deaths worldwide in 2018 (1, 3, 4). PCa with biochemical recurrence (BCR) was a critical lethal factor that frequently led to a poor prognosis and seriously threatened patient survival (5). Although the concept of personalized management of BCR patients has been greatly improved, a superficial understanding of the molecular mechanisms of the disease severely limits clinicians’ treatment strategies, resulting in increased mortality of patients with BCR (6). Hence, there is an urgent need to develop an instructive tool to accurately judge the prognosis of PCa.
Aberrant switching between oxidative phosphorylation (OXPHOS) and glycolysis plays a crucial regulatory role in tumorigenesis (7–10). Initially, glycolysis was considered as a manner of energy supply forced adopted in the hypoxic microenvironment caused by uncontrolled growth (11). Interestingly, cancer cells prefer to utilize aerobic glycolysis to obtain adenosine triphosphate (ATP) to satisfy the needs for uncontrolled proliferation even in conditions with sufficient oxygen. This unique metabolic signature termed Warburg effect has been demonstrated to exist in various solid tumors, including PCa (12–14). Recently, an increasing number of studies have reported that abnormal expression of glycolysis-related molecules have crucial roles in regulating chemotherapy resistance (15), immune response (16, 17), neuroendocrine differentiation (18), and growth and metastasis of PCa (19, 20), ultimately affecting its prognosis. Additionally, some researchers have successfully constructed prediction models derived from glycolysis-associated genes in liver cancer and colon cancer (4, 21). However, the actual relationship between glycolysis and PCa remains unclear and is worth further exploration. Herein, we hypothesized that a risk score prediction model based on glycolysis-related genes might have a strong ability to accurately judge the prognosis of PCa with BCR. We successfully identified and constructed a satisfactory signature composed of five glycolytic genes and verified it in the validation set. Furthermore, the molecular roles of the signature components in regulating malignant tumor behaviors were validated in vitro.
Materials and Methods
Collection of Prostate Cancer Data
PCa gene expression data (RNA-Seq) and the corresponding clinical data were downloaded from the TCGA database (https://portal.gdc.cancer.gov) and Gene Expression Omnibus (GEO: https://www.ncbi.nlm.nih.gov/geo/). With |log2(fold change)| >0.5 and false discovery rate (FDR) <0.05 as the standards (22), the data were standardized with the “edgeR” package of R software (version 3.6.3, https://www.r-project.org), and then differential expression analysis was performed. The glycolysis-related gene dataset was downloaded from GSEA (http://www.hmdb.ca). The same standard was used to analyze the differentially expressed glycolysis-related genes (DGRGs) between PCa and normal tissues. The relationships between pairs of genes were analyzed through GEPIA (http://gepia.cancer-pku.cn/).
Construction of a Risk-Scoring Model
Based on the DGRGs obtained from the above screening, univariate Cox regression analysis and LASSO regression analysis were used to screen the prognostic glycolysis-related genes. Then, a separate survival analysis was conducted for each gene to obtain DGRGs with statistically significant associations with survival. Based on the obtained prognosis-related DGRGs, LASSO regression analysis was used to calculate the risk coefficient (coefi) of each DGRG. Then, the sum of the product of the coefi values of all prognostic-related DGRGs and their expression (expri) values for each sample was calculated as the patient risk score (23). Using the median risk score as the cutoff point, patients were divided into high-risk and low-risk groups. Kaplan–Meier survival analysis was used to determine whether disease-free survival (DFS) was significantly different between high-risk and low-risk patients. Receiver operating characteristic (ROC) curve analysis was used to calculate the area under the curve (AUC) to evaluate the predictive performance of the risk-scoring model. Univariate Cox regression and multivariate Cox regression analyses were used to clarify the relationship between the risk score, age, TNM stage, Gleason score, and prognosis of PCa patients.
External Verification of the Risk-Scoring Model
The GEO dataset GSE70770 was used to verify the risk score model. Similar to the previous approach, the sum of the product of the coefi values of all prognostic-related DGRGs and their expression (expri) values for each sample was calculated as the patient risk score. Kaplan–Meier survival analysis was used to determine whether DFS was significantly different between high-risk and low-risk patients. ROC curve analysis was used to calculate the AUC to evaluate the predictive performance of the risk-scoring model.
Feature Set Enrichment Analysis
Gene ontology (GO) is widely used in the field of molecular biology and can effectively identify the biological attributes of samples according to high-throughput genetic data. Kyoto Encyclopedia of Genes and Genomes (KEGG) is a collection of high-throughput biological datasets related to genomes, cells, diseases, and signaling pathways. It is usually used to annotate a list of genes and signaling pathways related to a phenotype of interest. The R language package was used to perform GO function and KEGG enrichment analysis of DGRGs.
Cell Lines and Cell Culture
The human PCa cell line PC3 was purchased from the American Type Culture Collection (ATCC, VA, USA). PC3 cells were cultured in RPMI-1640 (Gibco, NY, USA) medium with 10% fetal bovine serum (FBS, BI, Israel), 100 U/ml penicillin, and 100 μg/ml streptomycin. The cells were cultured in an incubator with 5% CO 2 at 37°C.
RNA Interference
Small interfering RNA (siRNA) duplexes targeting the human HMMR, KIF20A, GPR87, PGM2L1, and ANKZF1 genes were synthesized and purified by GenePharma (Suzhou, China). PC3 cells (1 × 10⁵) were seeded in six-well plates and cultured to 50%–70% confluence, and transient transfection was performed with Lipofectamine iMAX (Invitrogen, USA) according to the manufacturer’s instructions. The validated oligo sequences of siRNAs are listed in Supplementary Table S1. The detailed procedure is available in Supplementary File 1.
Glycose Consumption and Lactic Acid Production
PC3 cells were digested after transient transfection with siRNA for 48 h, counted (1 × 10⁵), seeded in 12-well plates, and cultured until the cells adhered. The medium was replaced with fresh medium and the initial glucose and lactic acid concentrations were detected. After culturing for 24 h, the culture medium was collected and centrifuged for 15 min at 12,000 rpm at 4°C. A lactate assay kit (Nanjing, China) was used to measure the lactate concentration following the manufacturer’s instructions. The glucose concentration was tested with a glycose assay kit (Nanjing, China) according to the manufacturer’s instructions. Glucose consumption and lactate production within 24 h were calculated according to the difference between the initial and final concentrations according to a standard curve. The detailed procedure is available in Supplementary File 1.
Transwell Assay
Cells were harvested after transient transfection with siRNA for 48 h, and chambers (8-μm pore size, Costar) with or without Matrigel (BD Science, USA) were used for cell invasion assays or migration assays. Approximately 4 × 10⁴ cells (for the migration assay) or 6 × 10⁴ cells (for the invasion assay) were resuspended in 200 μl of serum-free medium and added to the upper chambers. A total of 600 μl of medium containing 10% FBS was placed into the lower chambers. After incubation for 24 h, the cells in the upper chamber were gently removed with cotton swabs, and cells on the lower surface were fixed with paraformaldehyde and stained with 0.1% crystal violet for 20 min at room temperature. Photographs were taken with a microscope (Olympus, Tokyo, Japan), and the cells were counted for analysis.
Statistical Analysis
All statistical analyses were accomplished with R software (packages: limma, GSVA, GSEABase, sparcl, pheatmap, estimate, ggpubr, e1071, preprocessCore, survival, glmnet, survminer, survivalROC, rms, foreign, timeROC, and ggplot2) and GraphPad Prism (version 7.03). The correlation was determined by Pearson correlation analysis. Chi-square tests and t-tests were utilized to compare clinical variables. Survival status was assessed by Cox regression analysis. DFS curves were generated by the Kaplan–Meier method and evaluated by the log-rank test. A two-tailed p < 0.05 was considered to indicate statistical significance.
Results
Initial Screening and Identification of Differentially Expressed Glycolysis-Related Genes
Transcriptome sequencing data and detailed clinical follow-up information derived from 498 PCa patients were downloaded from the TCGA. With screening thresholds of |log2(fold change)|>0.5 and FDR<0.05, the DGRG profile was generated through the “edgeR” R package (Supplementary Figures S1A, B). Then, five glycolysis or glycolysis pathway-related gene sets were obtained from GSEA (Supplementary Table S2). By analyzing the overlaps between the differential transcriptome expression profile and GSEA gene sets, DGRGs were identified (Figure 1A). Volcano and heatmaps showed the expression patterns of the DGRGs (Figures 1B, C).

Figure 1 Identification of differentially expressed glycolysis-related genes in prostate cancer cohort. (A) Venn diagram showed overlapping of TCGA and GEO70770 database. (B) Volcano plot of differentially expressed glycolysis-associated genes expressed mRNA. (C) Heatmap of the differentially expressed glycolysis-associated genes showing expression signature in patients with PCa.
Identifying Candidate Molecules Associated With the Prognosis of Prostate Cancer Patients
To fully understand the role of DGRGs in PCa patients, univariate Cox regression was carried out to preliminarily analyze this profile. The results indicated that 13 genes were significantly associated with the prognosis of PCa patients (Figure 2A). Considering the possibility of overfitting that affects the authenticity of the results, LASSO regression was applied to further screen glycolysis-related genes associated with patient prognosis among these 13 genes. The data showed that after optimization of penalty parameters, eight genes (HMMR, KIF20A, PGM2L1, ANKZF1, GPR87, ADH5, ADH1B, NUP210) were confirmed to be related to the prognosis of PCa patients (Figures 2B, C).
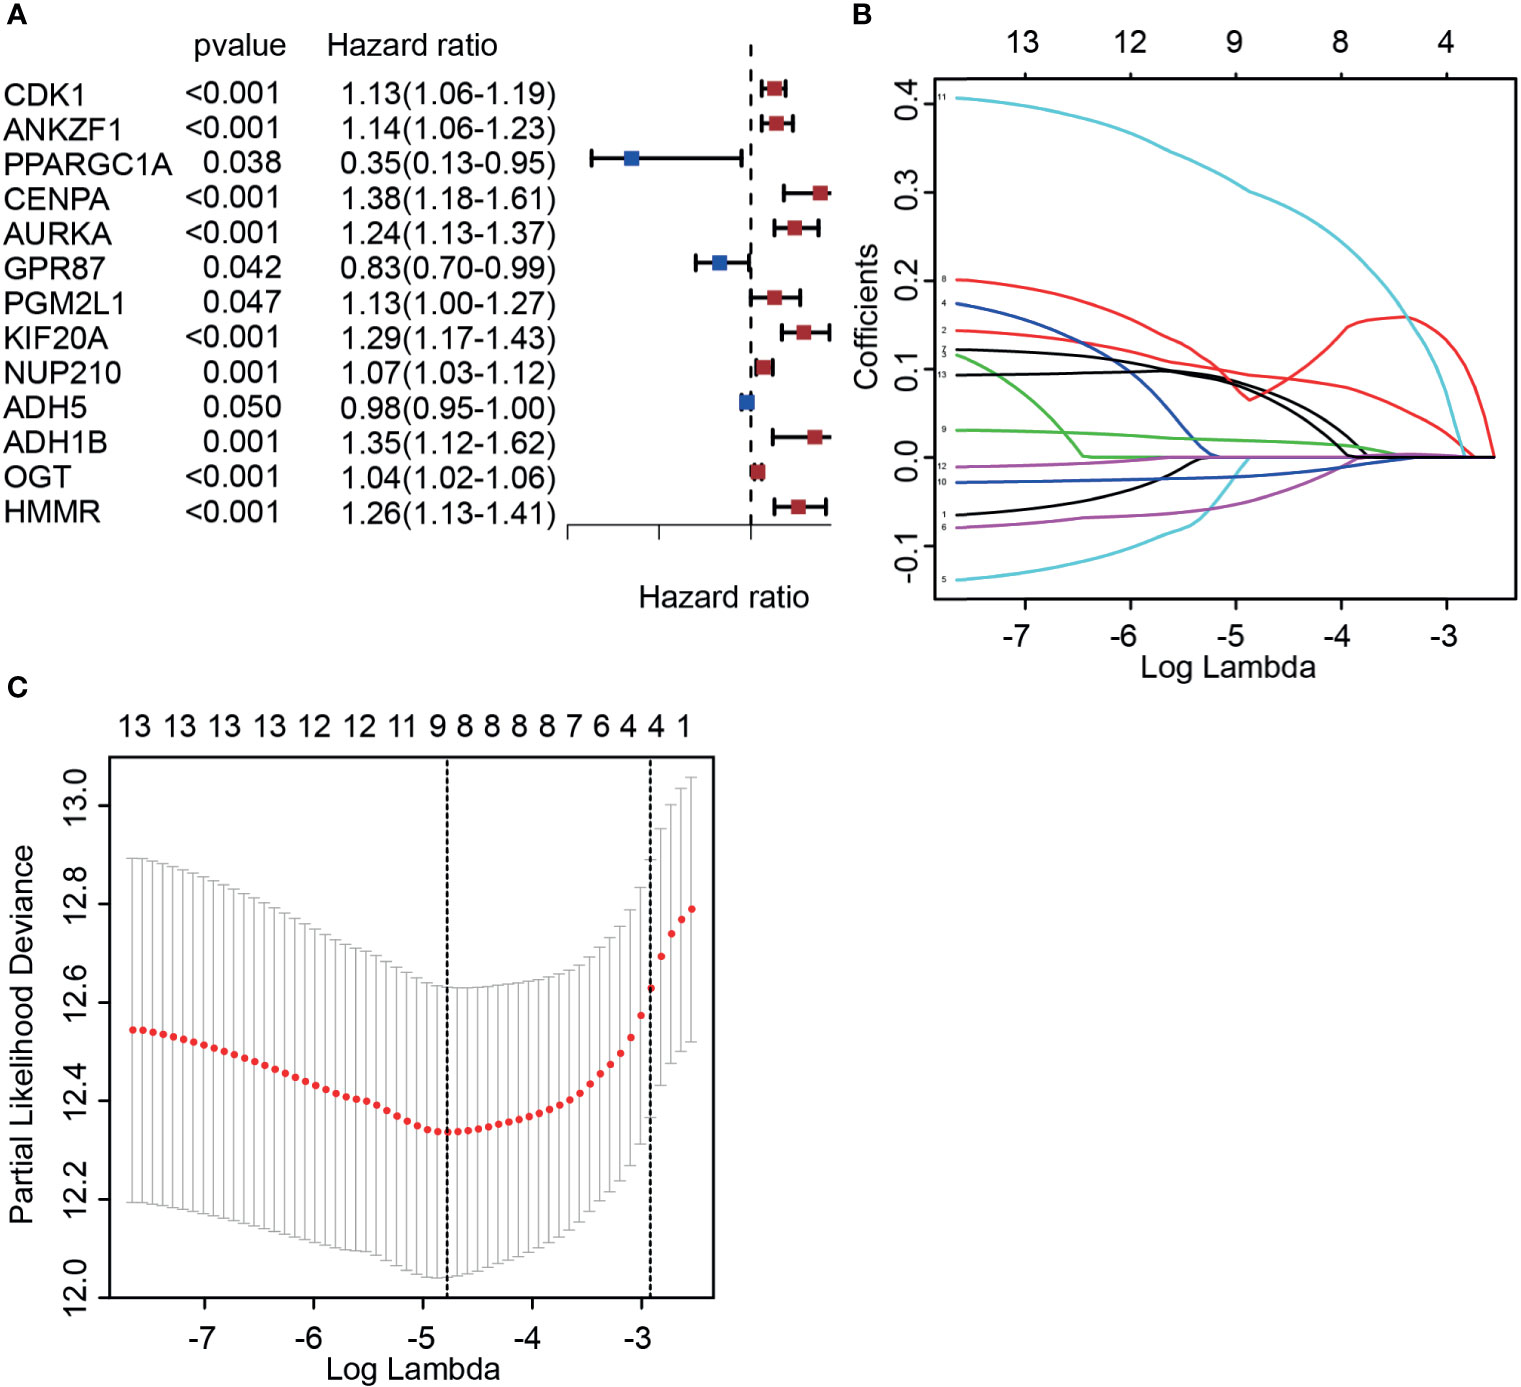
Figure 2 Identifying candidate molecules associated with the prognosis of prostate cancer patients. (A) Univariate Cox regression analysis of glycolysis-associated genes. (B, C) Determination of the best penalty value (−5 < λ < −4). LASSO regression of screening glycolysis-associated genes with patients’ prognosis.
Validation of the Expression and Prognosis of Candidate Molecules
We next aimed to further confirm the possible roles of these eight genes in PCa. Based on the PCa patient cohort derived from TCGA datasets, the expression and predictive ability of the eight glycolysis-related genes were tested. Consistent with previous results, the expression of four glycolysis-related genes (PGM2L1, ANKZF, KIF20A, and HMMR) was upregulated in cancer tissues compared with normal tissues (Figures 3A–D), and analysis of the DFS rate showed that high expression of these genes predicted a poor prognosis in the cancer group (p < 0.05) (Figures 3F–I). In addition, PCa patients with high expression of GPR87 had a longer survival time (Figures 3E, J), which indicated that it may act as a tumor suppressor. However, three glycolysis-related genes (ADH1B, ADH5, and NUP210) were significantly differentially expressed at the mRNA level in tumor tissues versus adjacent normal tissues (Supplementary Figures S2A–C) but were not significantly related to patient prognosis (p > 0.05) (Supplementary Figures S2D–F). Taking all the results into account, five DGRGs (HMMR, KIF20A, GPR87, PGM2L1, and ANKZF1) were subsequently used to construct a prediction model for PCa patients.
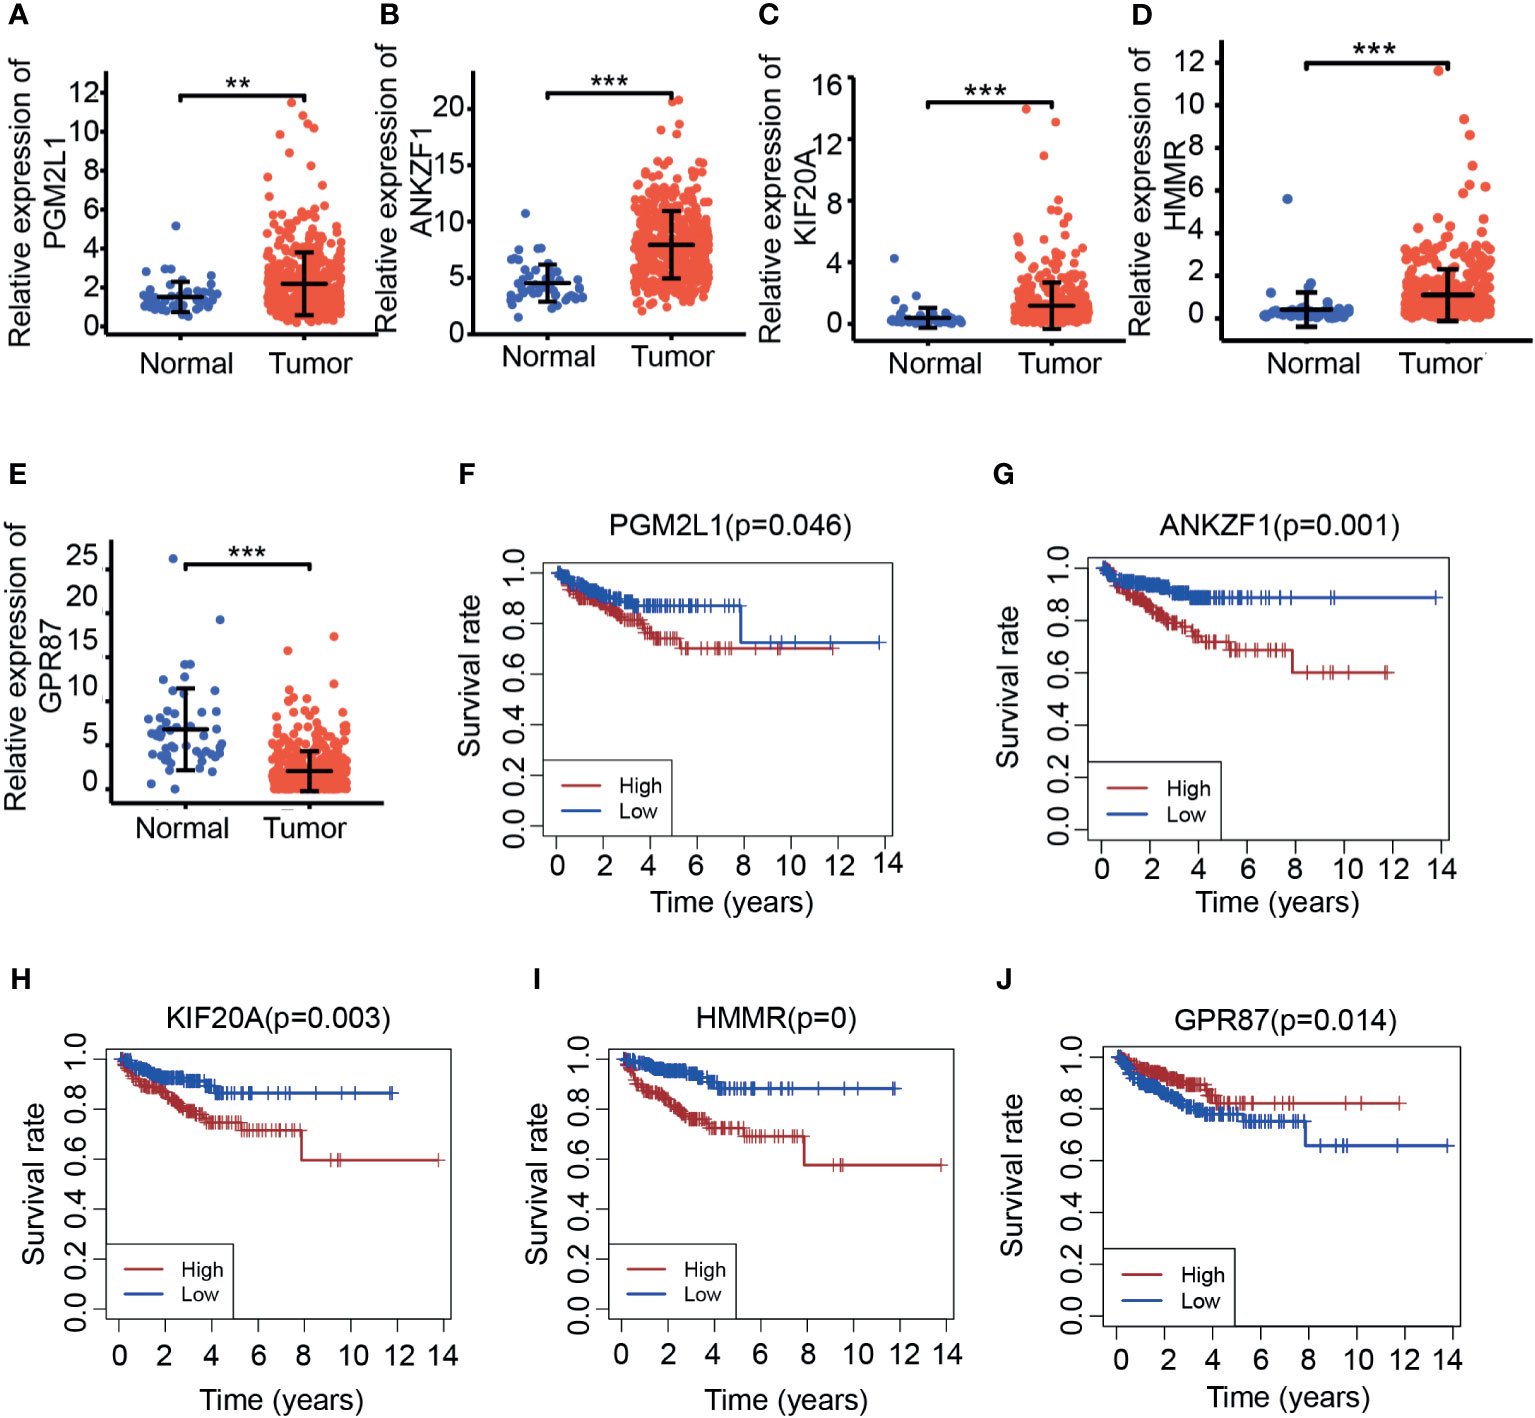
Figure 3 Investigation of the expression of candidate molecules based on TCGA. (A–E). Expression of PGM2L1 (A), ANKZF1 (B), KIF20A (C), HMMR (D), and GPR87 (E) in TCGA. **p < 0.01, ***p < 0.001. (F–J). Disease-free survival of PGM2L1 (F), ANKZF1 (G), KIF20A (H), HMMR (I), and GPR87 (J) in TCGA.
Construction of a Risk Score Model Based on Differentially Expressed Glycolysis-Related Genes
According to previous results, five genes were ultimately selected for the construction of the risk score model. Based on the expression (Expr) and coefficient value of each gene (Table 1), a prognostic model for predicting the survival time of each patient was developed as follows: . On the basis of the result for each patient, PCa patients in the TCGA cohort were divided into two groups (high-risk group and low-risk group) according to the median value. As expected, there were more deaths in the high-risk group than in the low-risk group (Figure 4A). This result implied that patients in the low-risk group had a better prognosis than those in the high-risk group, indicating the excellent predictive effect of this model. Next, to further confirm this result, DFS analysis was performed, and the Kaplan–Meier survival curves clearly showed that patients with a high-risk score had a poorer clinical outcome than those with a low-risk score (Figure 4B). In addition, we analyzed the five-gene signature in the high-risk and low-risk groups. As presented in Figure 4C, ANKZF1, PGM2L1, KIF20A, and HMMR were significantly upregulated in the high-risk group, and GPR87 was downregulated in the high-risk group. The time-dependent ROC curve showed that the AUC was 0.711 (Figure 4D). Some clinical factors, such as age, TNM stage, and Gleason score, are important factors for judging the prognosis of PCa. Thus, we explored whether the Gleason score, T stage, N stage, and risk score were independent predictors of PCa prognosis. Univariate and multivariate Cox regression analyses were carried out. The results demonstrated that T stage, Gleason score, and risk score were independent predictors of prognosis in patients with PCa (Figures 4E, F). Taken together, these findings showed that the risk score based on the signature of five glycolysis-related genes was an independent predictor of prognosis in patients with PCa.
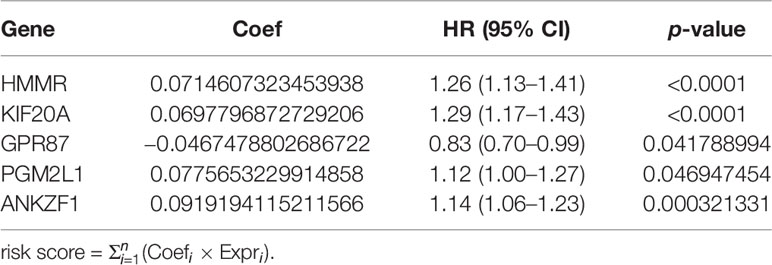
Table 1 The detailed information of five glycolysis-related genes for the prediction model.
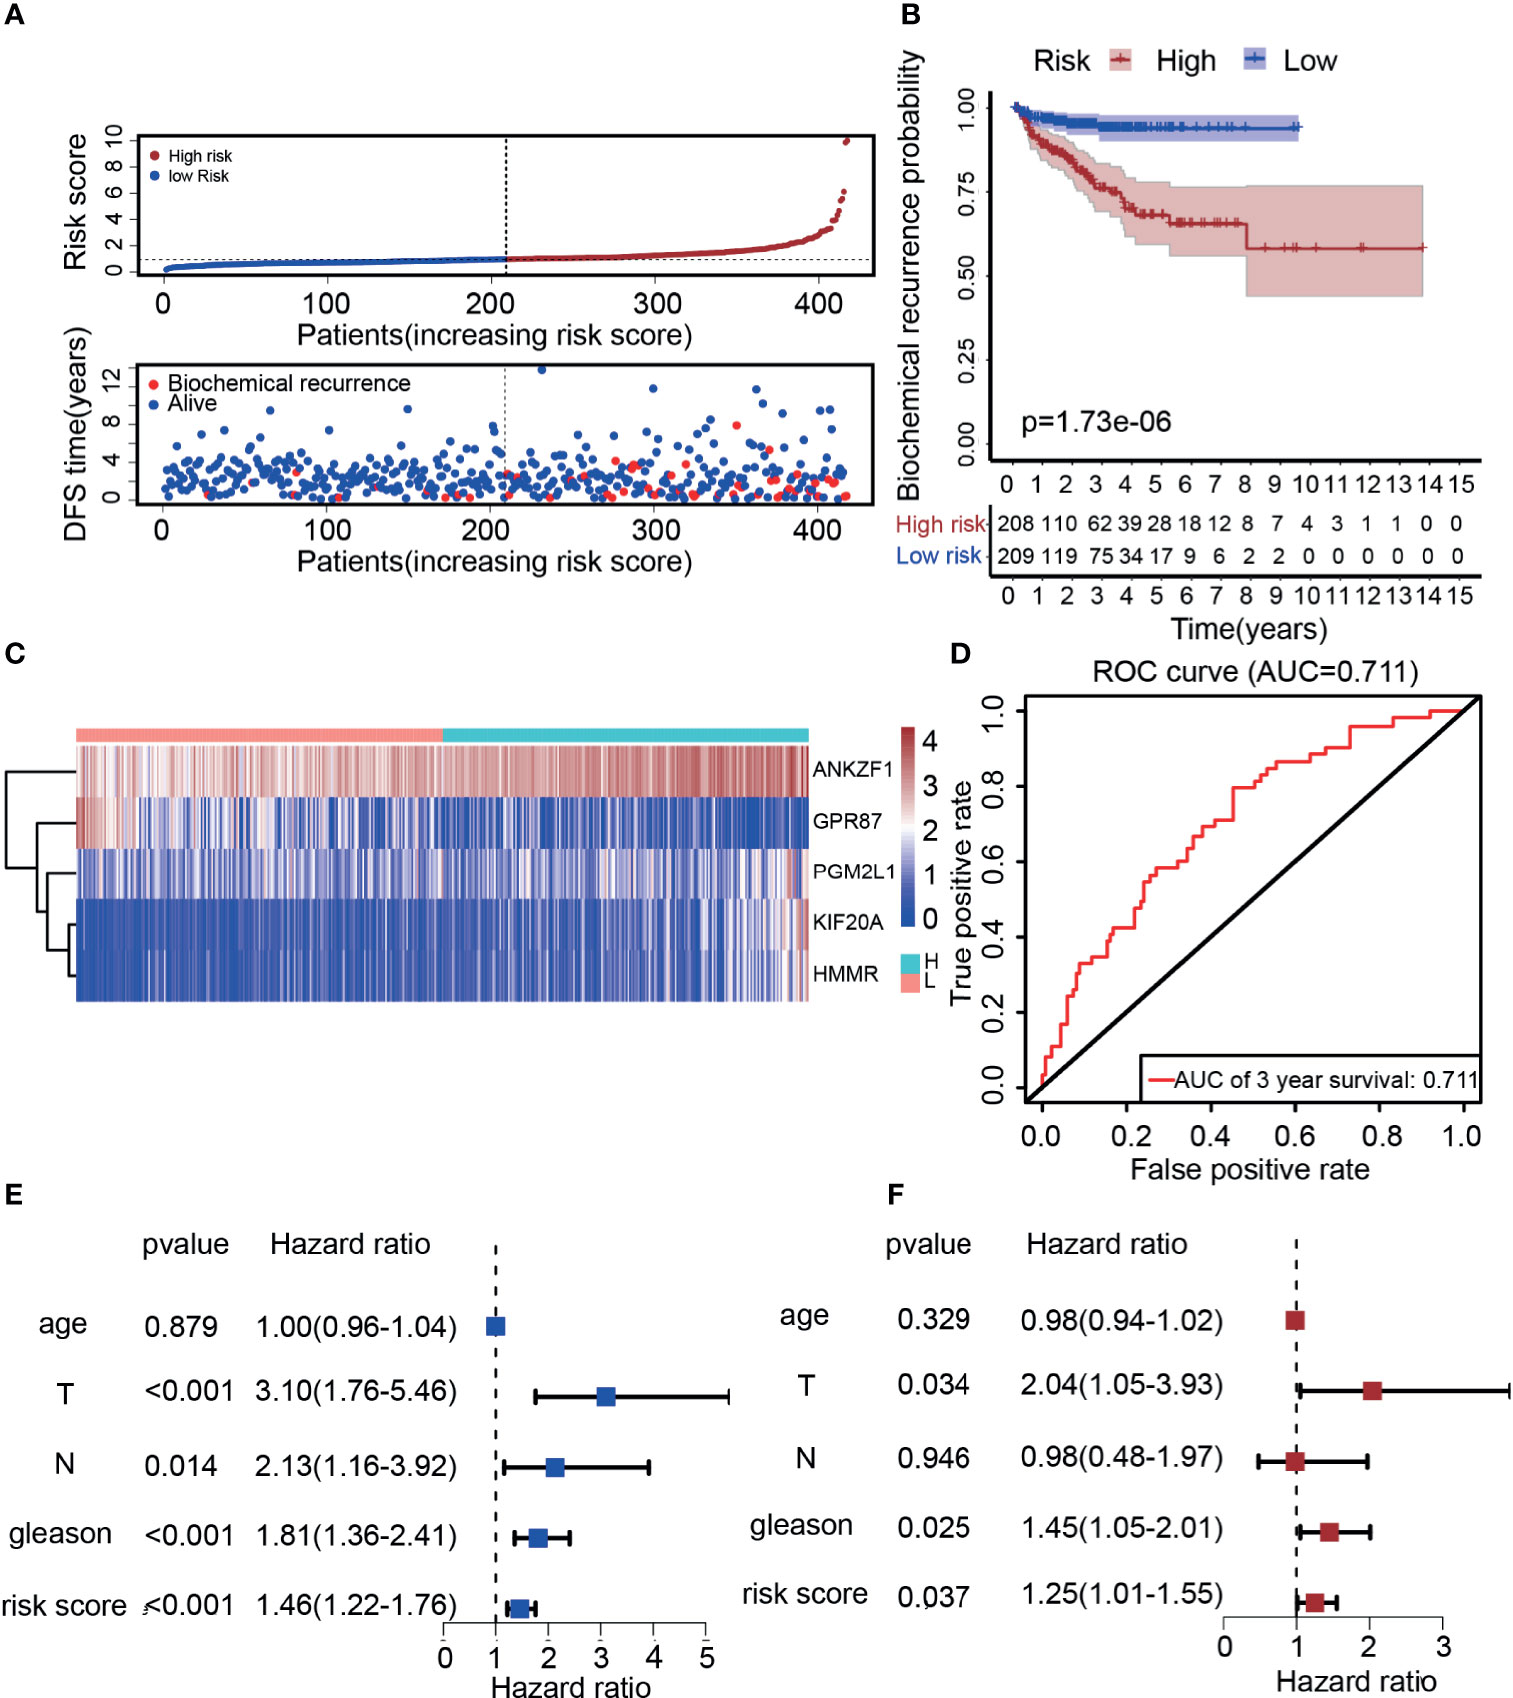
Figure 4 Construction of a risk score model based on five glycolysis-related genes. (A) The distribution of the five-mRNA risk score and survival status for each patient. (B) Kaplan–Meier curve of survival time in high-risk and low-risk group. (C) Expression of five glycolytic genes in the high-risk group and low-risk group based on TCGA. (D) ROC curves of the glycolysis-related signature for prediction of DFS of patients with PCa (AUC = 0.711). (E, F) Univariate and multivariate Cox regression analysis of clinical information (Age, T stage, N stage, Gleason score, and risk score).
External Dataset to Verify the Predictive Performance of the Risk Score Model
Previous data showed that the prediction model had a better predictive performance in the TCGA cohort, but it was unclear whether the prediction model has the ability to judge prognosis precisely in other cohorts. To this end, the GSE70770 dataset derived from the GEO was used to verify the predictive performance. The expression of these five genes was analyzed, and the results showed that HMMR, KIF20A, and ANKZF1 were upregulated in cancer tissues, while GPR87 was downregulated in cancer tissues, which were consistent with previous results (Supplementary Figures S3A–D). However, the expression of ANKZF1 showed no significant difference in cancer and normal tissues (Supplementary Figure S3E). Similarly, patients with PCa were classified into a high-risk group and a low-risk group according to the five-gene signature score for each patient. The mortality rate was notably increased in the high-risk group, suggesting that patients in the high-risk group had a poorer prognosis than those in the low-risk group (Figure 5A). DFS data also showed that the survival time was shorter in patients with high-risk scores than those with low-risk scores (Figure 5B). In addition, in the high-risk group, the expression of ANKZF1, PGM2L1, KIF20A, and HMMR were increased remarkably, while GPR87 was downregulated (Figure 5C). Based on the ROC curve, the AUC was 0.73, suggesting good predictive ability (Figure 5D).
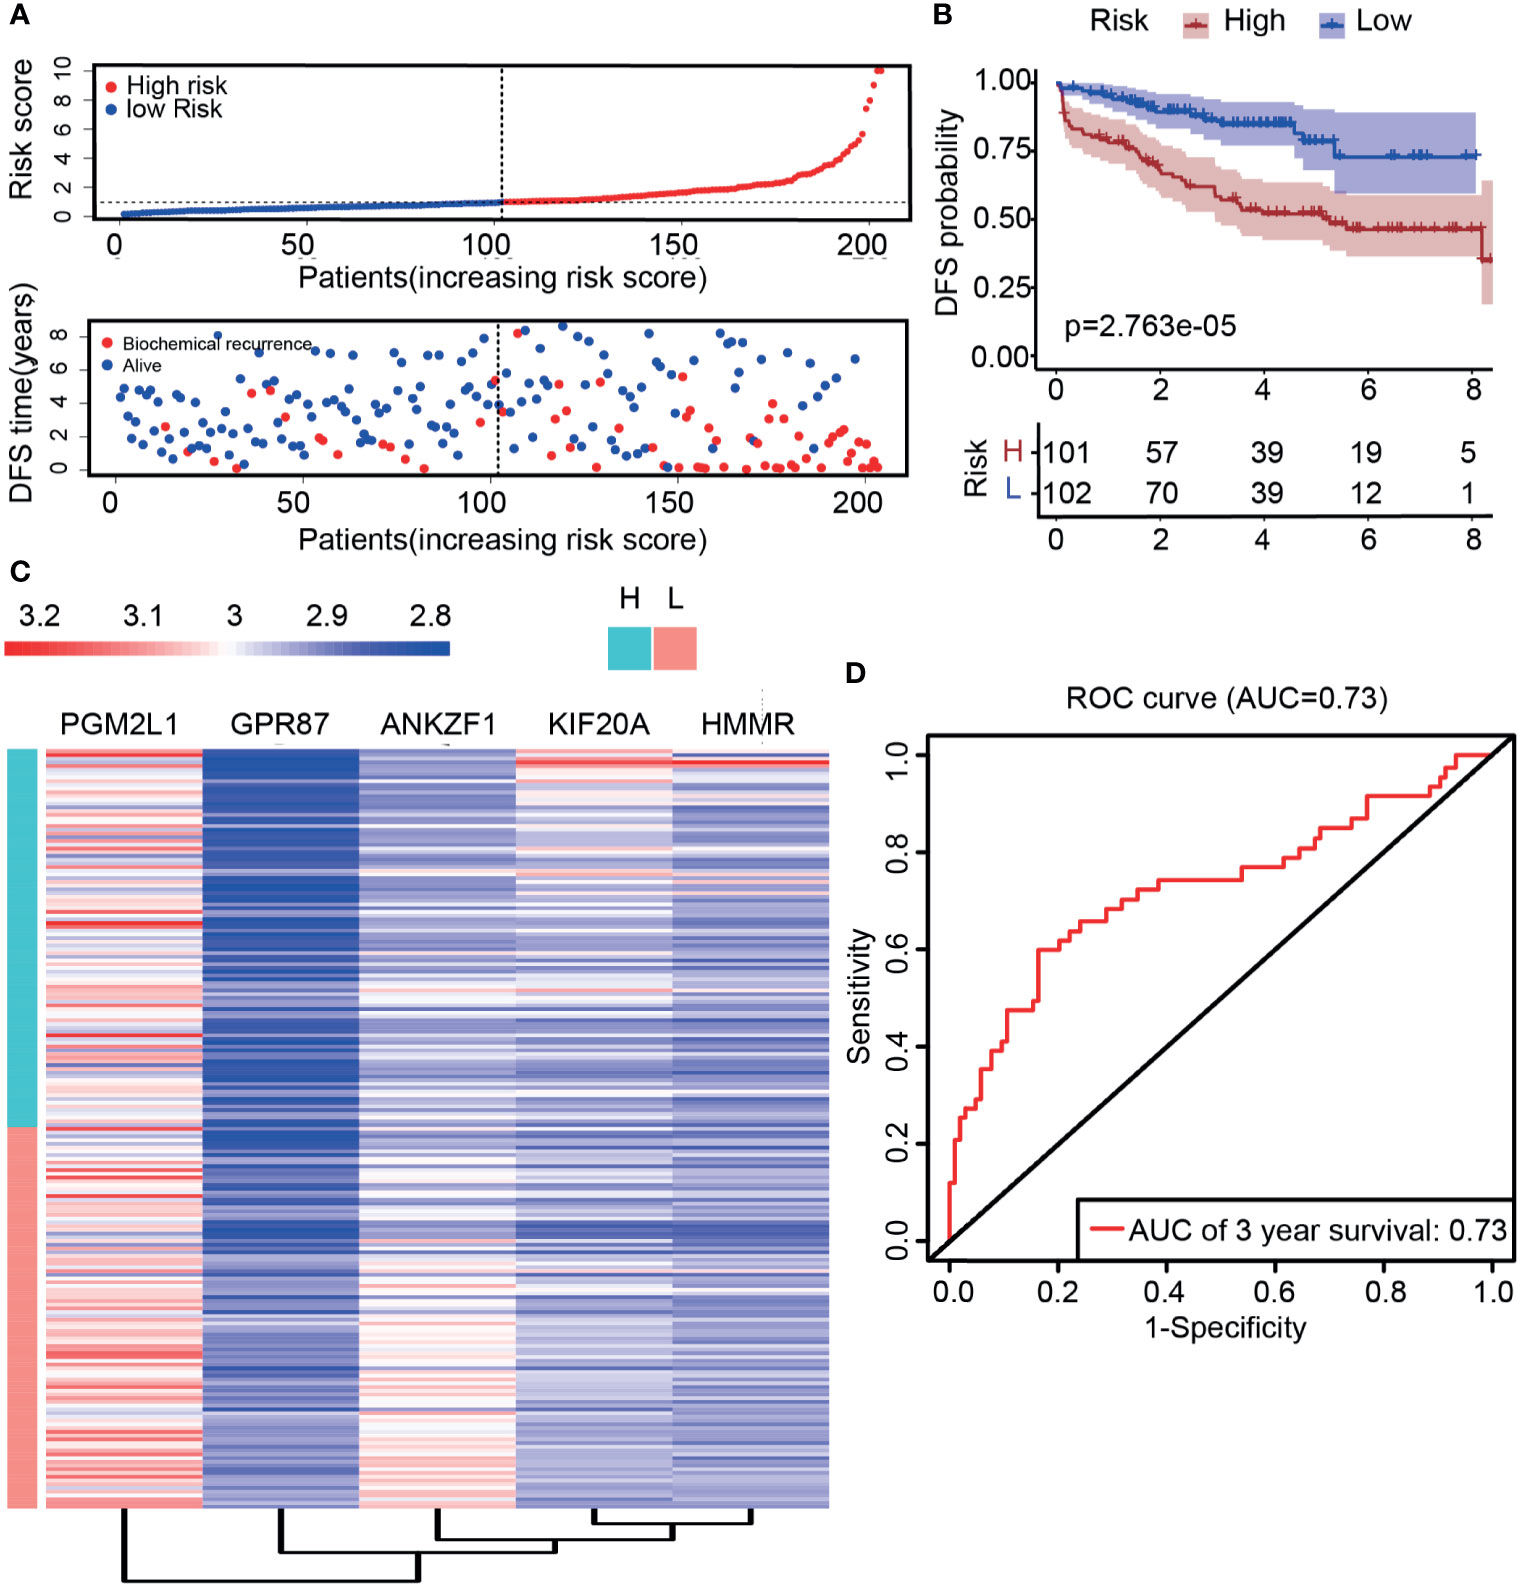
Figure 5 Validation of risk score through external data derived from the GEO dataset (GSE70770). (A) The distribution of the five-mRNA risk score and survival status for each patient. (B) Kaplan–Meier curve of survival time in high- and low-risk groups. (C) Expression of five glycolytic genes in the high-risk group and low-risk group based on GSE70770. (D) ROC curve of DFS (AUC = 0.73) in validation datasets.
Molecular Functions of the Five Genes in Glycose Consumption and Lactic Acid Production
Considering that these genes are derived from glycolytic gene sets, they are likely to exert biological functions through changing the metabolic pattern of tumor cells. Hence, glycose consumption assays and lactic acid production assays were subsequently adopted. SLC2A1, also known as glucose transporter Glut-1, is the vital factor for the first step of glucose uptake, and LDHA is the rate-limiting enzyme that catalyzes the production of lactic acid. They are both vital regulators involved in regulating development of malignancy (24, 25). Therefore, to validate the roles of these five genes in glucose metabolism, the correlations among the five genes and SLC2A1 or LDHA were assessed. The data showed that HMMR, GPR87, KIF20A, and PGM2L1 were positively correlated with SLC2A1 and that ANKZF1 was negatively correlated with SLC2A1 (Figures 6A, B and Supplementary Figures S4A–C). Similarly, HMMR, KIF20A, PGM2L1, and ANKZF1 were positively correlated with LDHA, whereas GPR87 had a negative correlation with LDHA (Figures 6D–F and Supplementary Figures S4D, E). To confirm the results, glucose consumption and lactic acid production were assessed after gene knockdown and knockdown efficiency confirmation (Supplementary Figures S5A–E); the results demonstrated that glucose consumption decreased markedly when KIF20A or PGM2L1 was knocked down (Figure 6C), while knockdown of HMMR, GPR87, and ANKZF1 did not induce a significant change (Supplementary Figure S6A). The lactic acid production data showed that the concentration of lactic acid increased when GPR87 expression decreased but markedly decreased after knockdown of KIF20A or HMMR (Figure 6G); furthermore, there were no significant changes with PGM2L1 or ANKZF1 knockdown (Supplementary Figure S6B). In summary, the glycolysis-related signature truly impacted the glycolysis process in PCa cells.
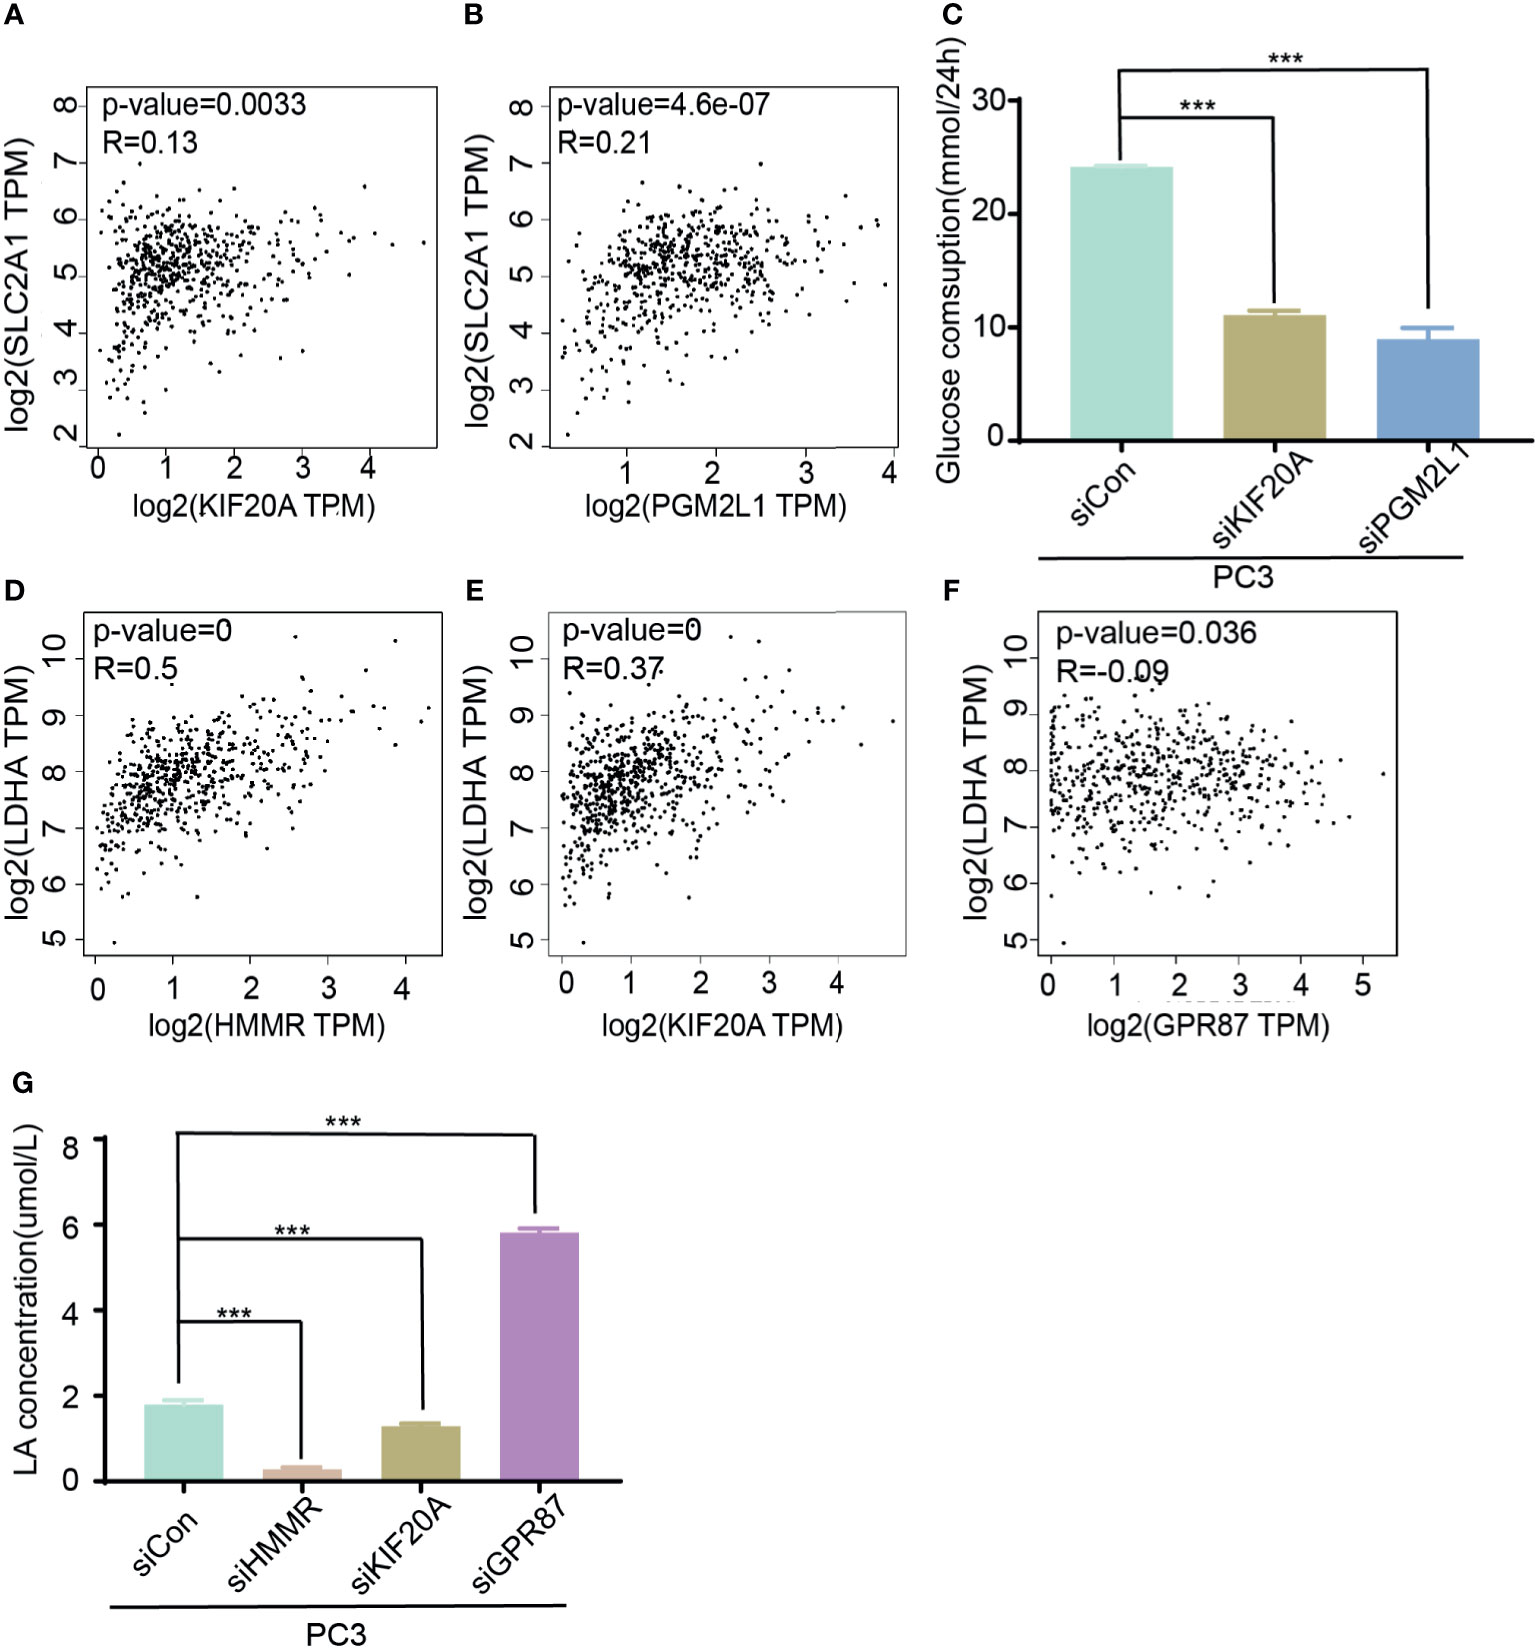
Figure 6 Molecular function of five genes in glycose consumption and lactic acid production. (A, B) Analysis of corrections of SLC2A1 with KIF20A (A) or PGM2L1 (B). (C) Detection of glucose consumption in control or siRNA (KIF20A and PGM2L1) group. ***p < 0.001. (D–F) Analysis of correction of LDHA with HMMR (D), KIF20A (E), and GPR87 (F). (G) Investigation of lactic production in control and siRNA (HMMR, KIF20A, and GPR87) group. ***p < 0.001.
Effect of the Five Glycolytic Genes on the Migration and Invasion of Prostate Cancer Cells
After confirming the involvement of the glycolysis-related signature in the glucose metabolism process, we further explored whether they affect the progression of PCa. Single-sample GSEA was used to explore the possible molecular functions and signaling pathways that might be involved. The results indicated that metastasis-associated pathways (cell adhesion molecules [CAMs], focal adhesion) and oxidative phosphorylation pathways were significantly enriched among these genes (Figures 7A–C). Considering these results, the migration and invasion ability of PC3 cells were assessed after knocking down different target genes. The results clearly demonstrated that knockdown of HMMR, KIF20A, PGM2L1, or ANKZF1 significantly attenuated the invasion and migration of PC3 cells. However, GPR87 knockdown promoted the invasion and migration of PC3 cells (Figure 7D). After confirmation in vitro, it was clear that this glycolysis-related signature exerts important regulatory effects in the progression of PCa.
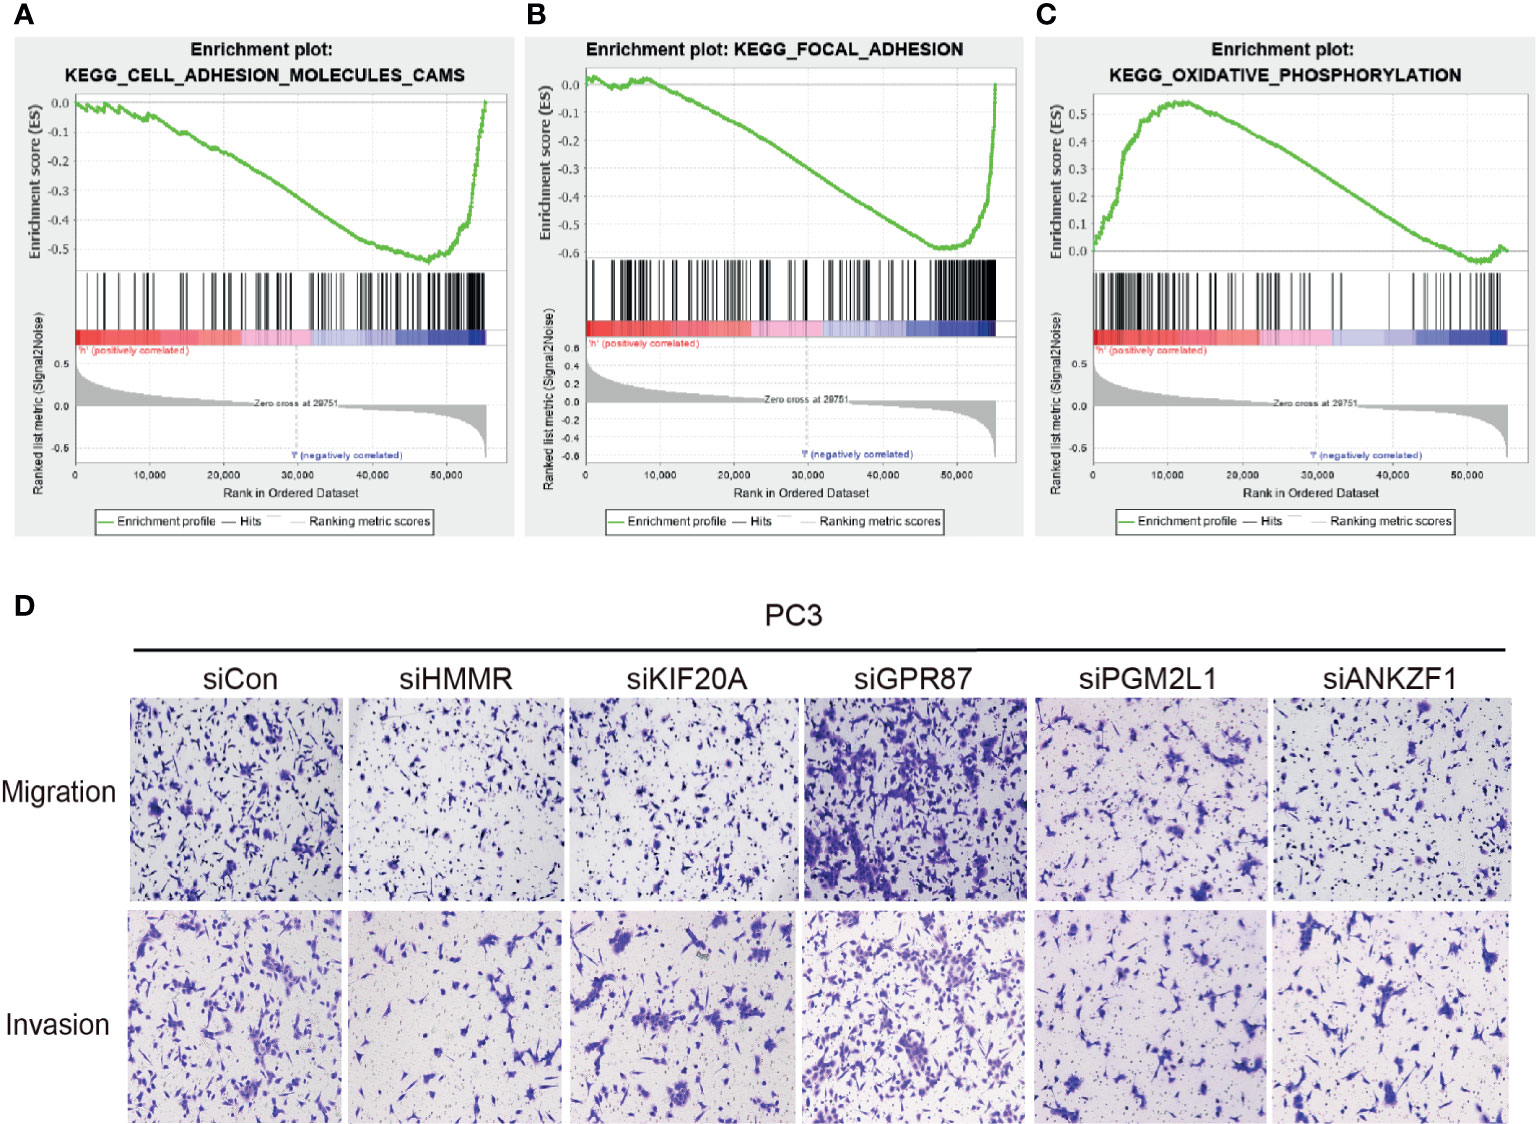
Figure 7 Effect of the five glycolytic genes on the migration and invasion of prostate cancer cells. (A–C) GESA analysis was performed in the high-risk group and low-risk group. (D) Investigation of ability of migration and invasion of PC3 cells.
Discussion
Although improvements in treatment have greatly increased the survival of PCa patients (26–29), survival and quality of life deteriorate significantly once BCR occurs (30). More regrettably, it is unavoidable that approximately 50% of high-risk PCa patients experience BCR despite active treatment (31). Moreover, the genome sequencing results shows that there are great individual differences in PCa, indicating the heterogeneity of PCa. These results pose great challenges in the formulation of favorable and reasonable personalized treatment strategies (32). Given that metabolic reprogramming is a crucial hallmark of malignancy, several studies have successfully recognized glycolysis-associated factors in multiple solid tumors (13, 33–35). Hence, we constructed and verified a prediction model based on glycolysis-related genes to accurately judge the prognosis of PCa patients.
Initially, in order to obtain sufficient meaningful variables, differentially expressed genes in cancer tissues were analyzed in the TCGA and subsequently overlapped with glycolysis-associated gene sets downloaded from the GSEA database. In addition to univariate and multivariate regression analysis, LASSO is another scientific variable screening method that is widely used to construct prediction tools (36). With these models, we further screened 13 glycolysis-related genes associated with prognosis. Considering that inclusion of many variates in signature could reduce the significance of research and hinder further application, we analyzed their expression pattern and HR values; five glycolytic genes (HMMR, KIF20A, GPR87, ANKZF1, and PGM2L1) were eventually selected for further investigation. ROC curve analysis confirmed the effectiveness of this model, which indicated that patients with risk scores had a poor prognosis. In addition, a validation dataset (GSE70770) was used to evaluate the predictive performance of the model in the present study, which makes the tool more valuable. Probably due to the different quality control of each batch of sequencing, the expression of these five genes was not completely consistent with TCGA. Even so, we found that the model still had a good predictive performance in PCa with BCR. However, due to the lack of a large cohort for clinical validation, the actual value of this prediction model still needs to be further evaluated in the clinic.
Increasing evidences have proven that the excessive activation of glycolysis mediates cell proliferation, resistance to chemotherapy, the immune response, and distant metastasis (15, 37–39), so targeting aerobic glycolysis has become a promising treatment strategy (40). In the present study, the molecular functions of five glycolytic genes were investigated in vitro. Previous literature clearly indicates that HMMR and KIF20A function as oncogenes in many types of cancers. For example, activation of the TGF-β/Smad2 signaling pathway mediated by HMMR contributes to the chemoresistance of gastric cancer (41). KIF20A maintains a set of malignant characteristics in colorectal cancer by activating the JAK/STAT3 pathway (42, 43). However, little is known about GPR87, PGM2L1, and ANKZF1 in PCa. In the aspect of BCR, few studies have reported these glycolytic genes’ functions in the process of BCR. For patients who underwent radical prostatectomy (RP), BCR was a precursor to local tumor recurrence and distant metastasis (44). The regulatory roles of these glycolytic genes in the process of metastasis were assessed, which was expected to partially reflect their roles in the process of BCR. In the present study, the results of the Transwell assays of HMMR and KIF20A knockdown cells further confirmed their roles as oncogenes in PCa, which were consistent with previous studies. Furthermore, this is the first study to prove the anti-oncogenic or oncogenic role of GPR87, PGM2L1, and ANKZF1 in PCa progression, providing important information for further investigating PCa. Interestingly, it is worth noting that GPR87 is generally considered as a tumor driver in the tumorigenesis of pancreatic cancer (45), lung cancer (46), bladder cancer (47), and liver cancer (48). However, it was indicated as a tumor suppressor in PCa. GPR87 is widely known as a G protein-coupled receptor with seven transmembrane proteins, and the signaling pathways that it activates are substrate-dependent in terms of mechanism. For instance, GPR87 couples with Gαq to mediate the activation of CREB and NF-κB signaling pathway and couples with Gα12/13 to induce SRE activation (49, 50). The specific characteristics of GPR87 in PCa and the detailed mechanisms are unclear and deserve further investigation.
In addition, several bioinformatics analyses have reported that these genes (HMMR, KIF20A, PGM2L1, ANKZF1, and GPR87) participate in glycolysis (51, 52). However, their roles in regulating tumor glycolysis have rarely been confirmed. Therefore, it was unclear whether they participated in regulating glucose metabolism in cancer cells. In the present study, we not only confirmed their involvement in the glycolysis process of PCa through bioinformatics but also demonstrated that interfering with KIF20A and PGM2L1 expression could affect glucose consumption and that interfering with HMMR, KIF20A, and GPR87 expression could regulate lactic acid production in vitro. It was worth noting that ANKZF1 had little regulatory role in glucose metabolism and lactic acid production process. It seems that the main function of ANKZF1 was to participate in the process of ribosome biogenesis (53, 54). Due to the lack of sufficient research, the actual role of ANKZF1 in cancer and glycolysis is unclear, and it is worthy of further investigation. In conclusion, this study preliminarily revealed their roles in the regulation of glucose metabolism.
Overall, further functional verification in vitro not only made our results more comprehensive but also provided a theoretical basis for this model. However, little is known about the exact roles of these genes and corresponding signaling pathways in regulating PCa progression and glycolysis. To better understand the theoretical basis of this model, the biological roles of these genes in vivo and their corresponding precise molecular mechanisms should be further elucidated in the future.
Conclusion
By analyzing the transcriptome signature of TCGA and GEO cohorts, a risk score system based on five glycolysis-associated genes was constructed and exhibited excellent performance in judging the prognosis of individual patients. In addition, GSEA and in vitro functional assays implied that these genes function through metastasis-related pathways and glucose metabolism pathways, indicating that they truly have a regulatory effect on tumor progression. Our findings indicated that the risk score prediction model might be a potential prognostic predictor for PCa patients with BCR.
Data Availability Statement
Publicly available datasets were analyzed in this study: The Cancer Genome Atlas (https://portal.gdc.cancer.gov/); the GSE70770 dataset was downloaded from Gene Expression Omnibus (GEO: https://www.ncbi.nlm.nih.gov/geo/).
Ethics Statement
The studies involving human participants were reviewed and approved by the Ethical Review Committee of Sun Yat-sen Memorial Hospital of Sun Yat-sen University. Written informed consent for participation was not required for this study in accordance with the national legislation and the institutional requirements.
Author Contributions
KX, KL, KG, and CoL conceived and designed the study. CoL performed public database data collection and analysis. KG and JS performed the experiments and analyzed the data. KG wrote the manuscript. ChL, ZT, and JS contributed to manuscript revision. All authors contributed to the article and approved the submitted version.
Funding
This work was supported by the National Natural Science Foundation of China (Grant Nos. 81702528, 81702525, and 82072841), the Guangdong Basic and Applied Basic Research Foundation (2021A1515010199), the Science and Technology Program of Guangzhou (Grant No. 201803010029), the Medical Scientific Research Foundation of Guangdong Province (Grant No. C2018060), and the Yixian Clinical Research Project of Sun Yat-sen Memorial Hospital (Grant No. SYS-C-201802).
Conflict of Interest
The authors declare that the research was conducted in the absence of any commercial or financial relationships that could be construed as a potential conflict of interest.
Publisher’s Note
All claims expressed in this article are solely those of the authors and do not necessarily represent those of their affiliated organizations, or those of the publisher, the editors and the reviewers. Any product that may be evaluated in this article, or claim that may be made by its manufacturer, is not guaranteed or endorsed by the publisher.
Supplementary Material
The Supplementary Material for this article can be found online at: https://www.frontiersin.org/articles/10.3389/fonc.2021.605810/full#supplementary-material
Supplementary Figure S1 | Identification of differential expressed genes in TCGA. (A) Heatmap of the differential expressed genes in TCGA. (B) Volcano plot of the differential expressed genes in TCGA.
Supplementary Figure S2 | Expression pattern and DFS of glycolysis-related genes in TCGA. (A–C) Expression pattern of ADH1B (A), ADH5 (B), NUP210 (C) in tumor tissues and normal tissues. (D-F) DFS of ADH1B (D), ADH5 (E), NUP210 (F) in prostate cancer patients.
Supplementary Figure S3 | Expression of candidate five glycolysis-related genes based on external dataset (GSE70770). (A-E). Expression of HMMR (A), KIF20A (B), ANKZF1 (C), GPR87 (D), PGM2L1 (E) in cancer tissues and normal tissues
Supplementary Figure S4 | Relationship between glycolysis-related genes with SLC2A1 or LDHA. (A-C) Relationship between SLC2A1 with HMMR (A), GPR87 (B), ANKZF1(C) in TCGA. (D, E) Relationship between LDHA with ANKZF1(D), PGM2L1(E) in TCGA.
Supplementary Figure S5 | Knockdown efficiency confirmation of glycolysis-related genes in prostate cacner cell lines through qRT-PCR. (A–E) Expression of GPR87(A), ANKZF1(B), HMMR(C), PGM2L1(D), KIF20A(E) in prostate cancer cells.
Supplementary Figure S6 | Glucose consumption and lactic acid production in glycolysis-related genes. (A) Glucose consumption in HMMR, ANKZF1, GPR87 knock down group. (B) Lactic acid production in PGM2L1, ANKZF1 knock down group.
References
1. Bray F, Ferlay J, Soerjomataram I, Siegel RL, Torre LA, Jemal A. Global Cancer Statistics 2018: GLOBOCAN Estimates of Incidence and Mortality Worldwide for 36 Cancers in 185 Countries. CA Cancer J Clin (2018) 68(6):394–424. doi: 10.3322/caac.21492
2. Bray F, Ferlay J, Soerjomataram I, Siegel RL, Torre LA, Jemal A. Erratum: Global Cancer Statistics 2018: GLOBOCAN Estimates of Incidence and Mortality Worldwide for 36 Cancers in 185 Countries. CA Cancer J Clin (2020) 70(4):313. doi: 10.3322/caac.21609
3. Chen X, Chen S, Yu D. Metabolic Reprogramming of Chemoresistant Cancer Cells and the Potential Significance of Metabolic Regulation in the Reversal of Cancer Chemoresistance. Metabolites (2020) 10(7):289. doi: 10.3390/metabo10070289
4. Chen S, Cao G, Wu W, Lu Y, He X, Yang L, et al. Mining Novel Cell Glycolysis Related Gene Markers That can Predict the Survival of Colon Adenocarcinoma Patients. Biosci Rep (2020) 40(8). doi: 10.1042/BSR20201427
5. Ishikawa H, Higuchi K, Kaminuma T, Takezawa Y, Saito Y, Etsunaga T, et al. The Effects of PSA Kinetics on the Outcome of Hypofractionated Salvage Radiotherapy for Biochemical Recurrence of Prostate Cancer After Prostatectomy. J Radiat Res (2020) 61(6):908–19. doi: 10.1093/jrr/rraa074
6. Sung H, Siegel RL, Torre LA, Pearson-Stuttard J, Islami F, Fedewa SA, et al. Global Patterns in Excess Body Weight and the Associated Cancer Burden. CA Cancer J Clin (2019) 69(2):88–112. doi: 10.3322/caac.21499
7. Pecinova A, Alan L, Brazdova A, Vrbacky M, Pecina P, Drahota Z, et al. Role of Mitochondrial Glycerol-3-Phosphate Dehydrogenase in Metabolic Adaptations of Prostate Cancer. Cells (2020) 9(8):1764. doi: 10.3390/cells9081764
8. Bose S, Le A. Glucose Metabolism in Cancer. Adv Exp Med Biol (2018) 1063:3–12. doi: 10.1007/978-3-319-77736-8_1
9. Pavlova NN, Thompson CB. The Emerging Hallmarks of Cancer Metabolism. Cell Metab (2016) 23(1):27–47. doi: 10.1016/j.cmet.2015.12.006
10. Hay N. Reprogramming Glucose Metabolism in Cancer: Can it be Exploited for Cancer Therapy? Nat Rev Cancer (2016) 16(10):635–49. doi: 10.1038/nrc.2016.77
11. Yadav UP, Singh T, Kumar P, Sharma P, Kaur H, Sharma S, et al. Metabolic Adaptations in Cancer Stem Cells. Front Oncol (2020) 10:1010. doi: 10.3389/fonc.2020.01010
12. Nakagawa T, Lanaspa MA, Millan IS, Fini M, Rivard CJ, Sanchez-Lozada LG, et al. Fructose Contributes to the Warburg Effect for Cancer Growth. Cancer Metab (2020) 8:16. doi: 10.1186/s40170-020-00222-9
13. Vander Heiden MG, Cantley LC, Thompson CB. Understanding the Warburg Effect: The Metabolic Requirements of Cell Proliferation. Science (2009) 324(5930):1029–33. doi: 10.1126/science.1160809
14. Frydman B, Bhattacharya S, Sarkar A, Drandarov K, Chesnov S, Guggisberg A, et al. Macrocyclic Polyamines Deplete Cellular ATP Levels and Inhibit Cell Growth in Human Prostate Cancer Cells. J Med Chem (2004) 47(4):1051–9. doi: 10.1021/jm030437s
15. Shangguan X, He J, Ma Z, Zhang W, Ji Y, Shen K, et al. SUMOylation Controls the Binding of Hexokinase 2 to Mitochondria and Protects Against Prostate Cancer Tumorigenesis. Nat Commun (2021) 12(1):1812. doi: 10.1038/s41467-021-22163-7
16. Das Gupta K, Shakespear MR, Curson JEB, Murthy AMV, Iyer A, Hodson MP, et al. Class IIa Histone Deacetylases Drive Toll-Like Receptor-Inducible Glycolysis and Macrophage Inflammatory Responses via Pyruvate Kinase M2. Cell Rep (2020) 30(8):2712–28 e8. doi: 10.1016/j.celrep.2020.02.007
17. Qu S, Xue H, Dong X, Lin D, Wu R, Nabavi N, et al. Aneustat (OMN54) has Aerobic Glycolysis-Inhibitory Activity and Also Immunomodulatory Activity as Indicated by a First-Generation PDX Prostate Cancer Model. Int J Cancer (2018) 143(2):419–29. doi: 10.1002/ijc.31310
18. Lin SR, Wen YC, Yeh HL, Jiang KC, Chen WH, Mokgautsi N, et al. EGFR-Upregulated LIFR Promotes SUCLG2-Dependent Castration Resistance and Neuroendocrine Differentiation of Prostate Cancer. Oncogene (2020) 39(44):6757–75. doi: 10.1038/s41388-020-01468-9
19. Harris BRE, Zhang Y, Tao J, Shen R, Zhao X, Cleary MP, et al. ATM Inhibitor KU-55933 Induces Apoptosis and Inhibits Motility by Blocking GLUT1-Mediated Glucose Uptake in Aggressive Cancer Cells With Sustained Activation of Akt. FASEB J (2021) 35(4):e21264. doi: 10.1096/fj.202001415RR
20. Kim HK, Bhattarai KR, Junjappa RP, Ahn JH, Pagire SH, Yoo HJ, et al. TMBIM6/BI-1 Contributes to Cancer Progression Through Assembly With Mtorc2 and AKT Activation. Nat Commun (2020) 11(1):4012. doi: 10.1038/s41467-020-17802-4
21. Lu C, Fang S, Weng Q, Lv X, Meng M, Zhu J, et al. Integrated Analysis Reveals Critical Glycolytic Regulators in Hepatocellular Carcinoma. Cell Commun Signal (2020) 18(1):97. doi: 10.1186/s12964-020-00539-4
22. Miryala SK, Anbarasu A, Ramaiah S. Impact of Bedaquiline and Capreomycin on the Gene Expression Patterns of Multidrug-Resistant Mycobacterium Tuberculosis H37Rv Strain and Understanding the Molecular Mechanism of Antibiotic Resistance. J Cell Biochem (2019) 120(9):14499–509. doi: 10.1002/jcb.28711
23. Chen Q, Li F, Gao Y, Xu G, Liang L, Xu J. Identification of Energy Metabolism Genes for the Prediction of Survival in Hepatocellular Carcinoma. Front Oncol (2020) 10:1210. doi: 10.3389/fonc.2020.01210
24. Liu KG, Kim JI, Olszewski K, Barsotti AM, Morris K, Lamarque C, et al. Discovery and Optimization of Glucose Uptake Inhibitors. J Med Chem (2020) 63(10):5201–11. doi: 10.1021/acs.jmedchem.9b02153
25. Brand A, Singer K, Koehl GE, Kolitzus M, Schoenhammer G, Thiel A, et al. LDHA-Associated Lactic Acid Production Blunts Tumor Immunosurveillance by T and NK Cells. Cell Metab (2016) 24(5):657–71. doi: 10.1016/j.cmet.2016.08.011
26. Hapuarachchige S, Artemov D. Theranostic Pretargeting Drug Delivery and Imaging Platforms in Cancer Precision Medicine. Front Oncol (2020) 10:1131. doi: 10.3389/fonc.2020.01131
27. Faria LF, Reis ST, Leite KR, da Cruz JAS, Pimenta R, Viana NI, et al. Digital Application Developed to Evaluate Functional Results Following Robot-Assisted Radical Prostatectomy: App for Prostate Cancer. Comput Methods Programs BioMed (2020) 197:105683. doi: 10.1016/j.cmpb.2020.105683
28. Moore C. Prostate-Specific Membrane Antigen PET-CT Before Radical Treatment. Lancet (2020) 395(10231):1170–2. doi: 10.1016/S0140-6736(20)30527-4
29. Song W, Lee SW, Chung JH, Kang M, Sung HH, Jeon HG, et al. Relationship Between Robotic-Assisted Radical Prostatectomy and Retropubic Radical Prostatectomy in the Learning Curve of a Single Surgeon as a Novice in Radical Prostatectomy: A Retrospective Cohort Study. Int J Surg (2020) 81:74–9. doi: 10.1016/j.ijsu.2020.07.006
30. May EJ, Viers LD, Viers BR, Kawashima A, Kwon ED, Karnes RJ, et al. Prostate Cancer Post-Treatment Follow-Up and Recurrence Evaluation. Abdom Radiol (NY) (2016) 41(5):862–76. doi: 10.1007/s00261-015-0562-1
31. Zumsteg ZS, Spratt DE, Romesser PB, Pei X, Zhang Z, Polkinghorn W, et al. The Natural History and Predictors of Outcome Following Biochemical Relapse in the Dose Escalation Era for Prostate Cancer Patients Undergoing Definitive External Beam Radiotherapy. Eur Urol (2015) 67(6):1009–16. doi: 10.1016/j.eururo.2014.09.028
32. Hovelson DH, Tomlins SA. The Role of Next-Generation Sequencing in Castration-Resistant Prostate Cancer Treatment. Cancer J (2016) 22(5):357–61. doi: 10.1097/PPO.0000000000000217
33. Wang ZH, Zhang YZ, Wang YS, Ma XX. Identification of Novel Cell Glycolysis Related Gene Signature Predicting Survival in Patients With Endometrial Cancer. Cancer Cell Int (2019) 19:296. doi: 10.1186/s12935-019-1001-0
34. Tian G, Li G, Liu P, Wang Z, Li N. Glycolysis-Based Genes Associated With the Clinical Outcome of Pancreatic Ductal Adenocarcinoma Identified by The Cancer Genome Atlas Data Analysis. DNA Cell Biol (2020) 39(3):417–27. doi: 10.1089/dna.2019.5089
35. Zhang C, Gou X, He W, Yang H, Yin H. A Glycolysis-Based 4-mRNA Signature Correlates With the Prognosis and Cell Cycle Process in Patients With Bladder Cancer. Cancer Cell Int (2020) 20:177. doi: 10.1186/s12935-020-01255-2
36. Dessie EY, Tsai JJP, Chang JG, Ng KL. A Novel miRNA-Based Classification Model of Risks and Stages for Clear Cell Renal Cell Carcinoma Patients. BMC Bioinf (2021) 22(Suppl 10):270. doi: 10.1186/s12859-021-04189-2
37. Xu K, Yin N, Peng M, Stamatiades EG, Chhangawala S, Shyu A, et al. Glycolytic ATP Fuels Phosphoinositide 3-Kinase Signaling to Support Effector T Helper 17 Cell Responses. Immunity (2021) 54(5):976–87.e7. doi: 10.1016/j.immuni.2021.04.008
38. Liu J, Peng Y, Shi L, Wan L, Inuzuka H, Long J, et al. Skp2 Dictates Cell Cycle-Dependent Metabolic Oscillation Between Glycolysis and TCA Cycle. Cell Res (2021) 31(1):80–93. doi: 10.1038/s41422-020-0372-z
39. Hou Y, Zhang Q, Pang W, Hou L, Liang Y, Han X, et al. YTHDC1-Mediated Augmentation of miR-30d in Repressing Pancreatic Tumorigenesis via Attenuation of RUNX1-Induced Transcriptional Activation of Warburg Effect. Cell Death Differ (2021). doi: 10.1038/s41418-021-00804-0
40. Bader DA, McGuire SE. Tumour Metabolism and Its Unique Properties in Prostate Adenocarcinoma. Nat Rev Urol (2020) 17(4):214–31. doi: 10.1038/s41585-020-0288-x
41. Zhang H, Ren L, Ding Y, Li F, Chen X, Ouyang Y, et al. Hyaluronan-Mediated Motility Receptor Confers Resistance to Chemotherapy via TGFbeta/Smad2-Induced Epithelial-Mesenchymal Transition in Gastric Cancer. FASEB J (2019) 33(5):6365–77. doi: 10.1096/fj.201802186R
42. Zhang Q, Di J, Ji Z, Mi A, Li Q, Du X, et al. KIF20A Predicts Poor Survival of Patients and Promotes Colorectal Cancer Tumor Progression Through the JAK/STAT3 Signaling Pathway. Dis Markers (2020) 2020:2032679. doi: 10.1155/2020/2032679
43. Xiong M, Zhuang K, Luo Y, Lai Q, Luo X, Fang Y, et al. KIF20A Promotes Cellular Malignant Behavior and Enhances Resistance to Chemotherapy in Colorectal Cancer Through Regulation of the JAK/STAT3 Signaling Pathway. Aging (Albany NY) (2019) 11(24):11905–21. doi: 10.18632/aging.102505
44. Van den Broeck T, van den Bergh RCN, Arfi N, Gross T, Moris L, Briers E, et al. Prognostic Value of Biochemical Recurrence Following Treatment With Curative Intent for Prostate Cancer: A Systematic Review. Eur Urol (2019) 75(6):967–87. doi: 10.1016/j.eururo.2018.10.011
45. Wang L, Zhou W, Zhong Y, Huo Y, Fan P, Zhan S, et al. Overexpression of G Protein-Coupled Receptor GPR87 Promotes Pancreatic Cancer Aggressiveness and Activates NF-kappaB Signaling Pathway. Mol Cancer (2017) 16(1):61. doi: 10.1186/s12943-017-0627-6
46. Park SM, Choi EY, Bae M, Kim S, Park JB, Yoo H, et al. Histone Variant H3F3A Promotes Lung Cancer Cell Migration Through Intronic Regulation. Nat Commun (2016) 7:12914. doi: 10.1038/ncomms12914
47. Zhang X, Liu D, Hayashida Y, Okazoe H, Hashimoto T, Ueda N, et al. G Protein-Coupled Receptor 87 (GPR87) Promotes Cell Proliferation in Human Bladder Cancer Cells. Int J Mol Sci (2015) 16(10):24319–31. doi: 10.3390/ijms161024319
48. Yan M, Li H, Zhu M, Zhao F, Zhang L, Chen T, et al. G Protein-Coupled Receptor 87 (GPR87) Promotes the Growth and Metastasis of CD133(+) Cancer Stem-Like Cells in Hepatocellular Carcinoma. PloS One (2013) 8(4):e61056. doi: 10.1371/journal.pone.0061056
49. Niss Arfelt K, Fares S, Sparre-Ulrich AH, Hjorto GM, Gasbjerg LS, Molleskov-Jensen AS, et al. Signaling via G Proteins Mediates Tumorigenic Effects of GPR87. Cell Signal (2017) 30:9–18. doi: 10.1016/j.cellsig.2016.11.009
50. Hill SJ, Baker JG, Rees S. Reporter-Gene Systems for the Study of G-Protein-Coupled Receptors. Curr Opin Pharmacol (2001) 1(5):526–32. doi: 10.1016/s1471-4892(01)00091-1
51. Xu F, Guan Y, Xue L, Huang S, Gao K, Yang Z, et al. The Effect of a Novel Glycolysis-Related Gene Signature on Progression, Prognosis and Immune Microenvironment of Renal Cell Carcinoma. BMC Cancer (2020) 20(1):1207. doi: 10.1186/s12885-020-07702-7
52. Chen L, He X, Yi S, Liu G, Liu Y, Ling Y. Six Glycolysis-Related Genes as Prognostic Risk Markers Can Predict the Prognosis of Patients With Head and Neck Squamous Cell Carcinoma. BioMed Res Int (2021) 2021:8824195. doi: 10.1155/2021/8824195
53. Verma R, Reichermeier KM, Burroughs AM, Oania RS, Reitsma JM, Aravind L, et al. Vms1 and ANKZF1 peptidyl-tRNA Hydrolases Release Nascent Chains From Stalled Ribosomes. Nature (2018) 557(7705):446–51. doi: 10.1038/s41586-018-0022-5
Keywords: glycolysis, prostate cancer, biochemical recurrence, prognosis, risk score, prediction model
Citation: Guo K, Lai C, Shi J, Tang Z, Liu C, Li K and Xu K (2021) A Novel Risk Factor Model Based on Glycolysis-Associated Genes for Predicting the Prognosis of Patients With Prostate Cancer. Front. Oncol. 11:605810. doi: 10.3389/fonc.2021.605810
Received: 14 September 2020; Accepted: 24 August 2021;
Published: 14 September 2021.
Edited by:
Nadia Judith Jacobo-Herrera, Instituto Nacional de Ciencias Médicas y Nutrición Salvador Zubirán (INCMNSZ), MexicoReviewed by:
Xuezhi Liang, First Hospital of Shanxi Medical University, ChinaDong Yu, Second Military Medical University, China
Copyright © 2021 Guo, Lai, Shi, Tang, Liu, Li and Xu. This is an open-access article distributed under the terms of the Creative Commons Attribution License (CC BY). The use, distribution or reproduction in other forums is permitted, provided the original author(s) and the copyright owner(s) are credited and that the original publication in this journal is cited, in accordance with accepted academic practice. No use, distribution or reproduction is permitted which does not comply with these terms.
*Correspondence: Kuiqing Li, sykq1920@163.com; Kewei Xu, xukewei@mail.sysu.edu.cn
†These authors have contributed equally to this work