 Shuhui Cao
 Yue Wang†
 Yao Zhang
94% of researchers rate our articles as excellent or good
Learn more about the work of our research integrity team to safeguard the quality of each article we publish.
Find out more
ORIGINAL RESEARCH article
Front. Oncol., 22 March 2021
Sec. Thoracic Oncology
Volume 11 - 2021 | https://doi.org/10.3389/fonc.2021.587744
This article is part of the Research TopicUnderstanding the Interplay Between the Tumor Immune Microenvironment and Genetic Alterations in Thoracic MalignanciesView all 13 articles
Background: Lung cancer is a malignant disease that threatens human health. Hence, it is crucial to identify effective prognostic factors and treatment targets. Single-cell RNA sequencing can quantify the expression profiles of transcripts in individual cells.
Methods: GSE117570 profiles were downloaded from the Gene Expression Omnibus database. Key ligand-receptor genes in the tumor and the normal groups were screened to identify integrated differentially expressed genes (DEGs) from the GSE118370 and The Cancer Genome Atlas Lung Adenocarcinoma databases. DEGs associated with more ligand-receptor pairs were selected as candidate DEGs for Gene Ontology (GO) functional annotation, Kyoto Encyclopedia of Genes and Genomes (KEGG) pathway analysis, and survival analysis. In addition, we conducted validation immunohistochemical experiments on postoperative specimens of 30 patients with lung cancer.
Results: A total of 18 candidate DEGs were identified from the tumor and the normal groups. The analysis of the GO biological process revealed that these DEGs were mainly enriched in wound healing, in response to wounding, cell migration, cell motility, and regulation of cell motility, while the KEGG pathway analysis found that these DEGs were mainly enriched in proteoglycans in cancer, bladder cancer, malaria, tyrosine kinase inhibitor resistance in Epidermal Growth Factor Receptor (EGFR), and the ERBB signaling pathway. Survival analysis showed that a high, rather than a low, expression of platelet endothelial cell adhesion molecule-1 (PECAM-1) was associated with improved survival. Similarly, in postoperative patients with lung cancer, we found that the overall survival of the PECAM-1 high-expression group shows a better trend than the PECAM-1 low-expression group (p = 0.172).
Conclusions: The candidate DEGs identified in this study may play some important roles in the occurrence and development of lung cancer, especially PECAM-1, which may present potential prognostic biomarkers for the outcome.
Lung cancer (LC) is the leading cause of cancer-related deaths among men and the third most common type of cancer among women, accounting for an estimated 2.1 million new cases and ~1.9 million deaths worldwide in 2018. Non-small cell LC (NSCLC) is the most common type of LC, accounting for about 85% of cases (1). Tumors of NSCLC typically undergo extensive genomic changes. Recently, molecularly targeted therapies and immune checkpoint inhibitors have dramatically improved the survival of patients with genomic changes to somatic cells (2). However, patients with LC often have different outcomes with the same therapy, and resistance to targeted therapies and immunotherapies remains problematic. Hence, the identification of a new biomarker of prognosis is needed.
Single-cell genomics is a powerful tool to explore genetic and functional heterogeneity, reconstruct evolutionary lineages, and detect rare subpopulations (3). Single-cell RNA sequencing (scRNA-seq) of human tumors has revealed new insights into tumor heterogeneity and the identification of different cell subpopulations, which are crucial to elucidate the mechanisms underlying tumorigenesis (4, 5). Furthermore, a better understanding of the gene expression profiles of the tumor microenvironment (TME) may help to improving prognosis and identifying molecular therapeutic targets.
Recently, intra-tumor mutational diversification analysis of LC at the single-cell level has been conducted (2, 6, 7). However, the scRNA-seq analysis has not yet been implemented to compare the gene expression profiles of non-small cell LC with those of normal tissues.
In the present study, the genomic features of LC cells and adjacent normal cells were obtained from GSE117570 and were analyzed to sort and screen key genes coding for ligand receptors. Then, candidate differentially expressed genes (DEGs) from The Cancer Genome Atlas Lung Adenocarcinoma (TCGA-LUAC) and GSE118370 databases were used for an enrichment analysis to identify those associated with crucial ligand-receptor activities to improve the efficacy of individualized treatment regimens for LC.
This analysis enrolled patients with newly diagnosed, pathologically confirmed NSCLC at the Shanghai Chest Hospital (Shanghai, China) from December 1, 2012 to December 31, 2017. All patients underwent complete resection, and no distant metastases were observed. All patients underwent follow-up of survival once a year. Paraffin-embedded lung adenocarcinoma specimens were obtained from all participants, and clinical, as well as pathological, data were collected. The present study was approved by the Institutional Review Board for Clinical Research of the Shanghai Chest Hospital.
The GSE117570 and GSE118370 datasets were downloaded from the Gene Expression Omnibus database (https://www.ncbi.nlm.nih.gov/geo/query/acc.cgi). The expression profiles of LC samples were downloaded from TCGA-LUAD database (https://portal.gdc.cancer.gov/).
The DropletUtils function of the R package was used to characterize the gene expression profiles of individual cells and to filter out any gene with counts of zero for all barcodes (8). Then, further screening was conducted of each cell with <100 unique molecular identifiers. The calculateQCMetrics scater package (9) was used to filter cells with ≤5% of mitochondrial genes and ≥10% of ribosomal genes. The expression matrix of each sample was normalized with the NormalizeData function included with the Seurat package (10).
The FindVariableFeatures function of the Seurat package was used to screen the top 2,000 genes with the highest standard deviations and defined as high variants. Focusing on high variant genes by downstream analysis helps to highlight biological signals in single-cell data sets. Then, the ScaleData function of the Seurat package was used to linearly scale the expression data. Finally, the RunPCA function of the Seurat package was used for linear dimensionality reduction analysis. After the selection of the principal components with large SDs, the FindNeighbors and FindClusters functions of the Seurat package were used for cell clustering analysis. Later, the RunTSNE function of the Seurat package was used for the non-linear dimensionality reduction analysis via t-SNE.
The FindAllMarkers function of the Seurat package was used to identify DEGs between each cluster and other cell types [logFC ≥ 0.25 (expression ratio of the cell population ≥0.25); p ≤ 0.05] as marker genes. Cell clusters were labeled and visualized according to existing annotations in the CellMarker database (11).
Genes in TCGA-LUAD and the GSE118370 databases with a significant difference in mean values among all samples (ANOVA; p ≤ 0.05) were selected for PCA. Samples with appropriate phenotypes were selected for differential expression analysis with the use of GSE118370 chip data with the Limma package and of TCGA sequencing data with the edgeR package after log2 conversion of each sample (|log2FC| ≥ 0.5849625). Then, DEGs were collected.
Based on the ligand-receptor pairing data, related ligand-receptor pairs of various cell types were analyzed, counted, and organized by networks (12).
Functional enrichment analysis of DEGs was conducted with the use of the Gene Ontology (GO) and the Kyoto Encyclopedia of Genes and Genomes (KEGG) biochemical pathway databases (13, 14). The Fisher's exact test was used to determine the specific functions of DEGs. The p-value and the false discovery rate were calculated for each DEG. The smaller the p-value, the greater the relationship between the functional item and the input gene, as most DEGs in the same group had similar functions.
Based on the genes included in the GSE118370 database, GSEA was used to compensate for the deficiency of a single gene (15).
Anti-PEACM1 antibody (1:50, ab28364, Abcam) was used for IHC staining. After the staining was completed, two pathologists independently scored the stained samples according to the staining intensity and the percentage of positively stained cells. The staining intensity was scored as follows: 0 (no staining), 1 (yellow or yellow-brown), and 2 (brown). The percentage of positive cells was scored as follows: 0 (none), 1 (<10%), 2 (10–50%), and 3 (<50%). Then, the relative expression index was calculated by multiplying these two scores; the final score <3 indicates low expression, and the final score ≥ 3 indicates high expression.
According to the TCGA database, we defined the median value of the expression of candidate DEGs in all patients as the cut-off value and performed the Kaplan-Meier Survival analysis and the COX regression analysis by using the survival package. Correlations among the characteristics of patients in different groups were analyzed with the Fisher's exact test and performed using the SPSS software version 22 (IBM Corporation, Chicago, IL).
Approximately, 11,233 cells from the GSE117570 database passed quality control and were selected for further analysis (Supplementary Figure 1A). The top 2,000 genes with the most significant differences in SDs were screened, and the top 10 genes are revealed in Figure 1A. The distribution of these genes between the tumor group and the normal group was detected by PCA and t-SNE. The top 46 significantly correlated genes are shown in Supplementary Figure 1B. We mapped the cells into two dimensions based on the PC_1 and PC_2 components, and other components were calculated with an estimated p-value, and the significant components were selected for subsequent analysis (Figures 1B,C). To further precisely cluster the populations of cells, t-SNE was adopted for the visualization of high dimensional data (Figure 1D). In total, 15 distinct cell clusters were identified by clustering analysis and classified based on the top 10 DEGs, which included CD4+T cells, CD8+ T cells, cancer stem cells, plasma cells, natural killer cells, M1 macrophages, macrophages, M2 macrophages, regulatory B cells, T helper 17 (Th17) cells, dendritic cells, effector T cells, cancer cells, endothelial cells, and Th2 cells (Figure 1E).
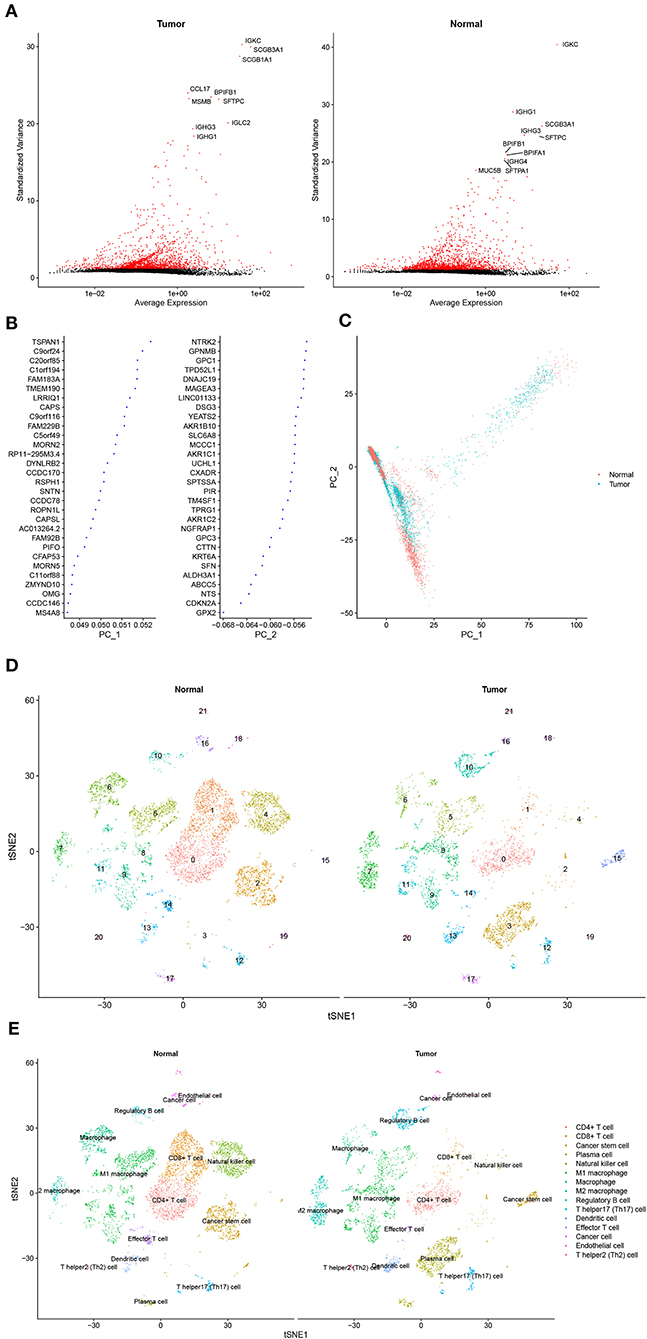
Figure 1. Cell cluster compositions of tumor tissues and normal tissues. (A) Top 10 genes with the most significant differences in SDs. (B) Gene contributions in two principal components (PC), namely PC_1 and PC_2. (C) Distribution of cells in two dimensions based on the PC_1 and PC_2 components. (D,E). Cell clusters of t-distributed stochastic neighbor embedding (t-SNE) and identified marker genes.
Of the 3,941 DEGs identified in the GSE118370 dataset, 1,798 were up-regulated and 2,143 were downregulated (Figures 2A,C; Table 1). Of the 1,113 DEGs identified in the TCGA dataset, 631 were upregulated and 482 were downregulated (Figures 2B,D; Table 1). Of the 457 shared DEGs in the two databases, 199 were upregulated and 258 were downregulated (Figures 2E,F). To further investigate cell functional states associated with LC and potential molecular regulators, functional enrichment analyses, including GO and KEGG analyses, of these DEGs were conducted. Three main categories of the GO function analysis [biological process (BP), cellular component (CC), and molecular function (MF)] revealed that the downregulated DEGs were significantly enriched in the following functions: cell motility, cell migration, and cell component movement (GO BP, Figure 3A); vesicle (GO CC, Figure 3B); and cell adhesion molecule binding, actin binding, and extracellular matrix structural constituent (GO MF, Figure 3C). According to the results of the KEGG analysis, the downregulated DEGs were mainly enriched in tight junctions, complement and coagulation cascades, and phagosomes (Figure 3D).
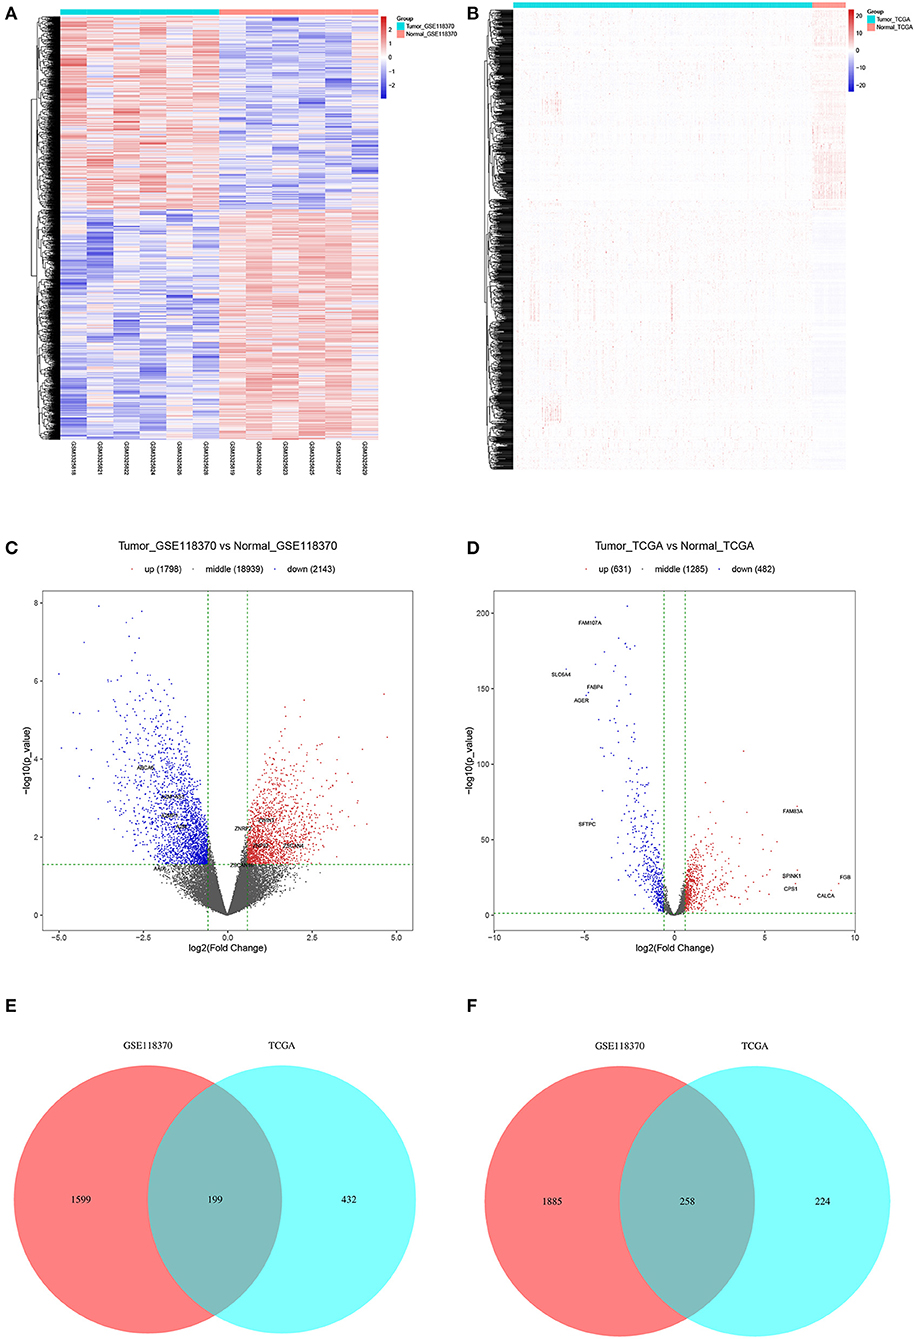
Figure 2. Filtering of differentially expression genes (DEGs). (A,B) Heat maps of DEGs of (A) GSE118370 and (B) The Cancer Genome Atlas (TCGA). (C,D) Volcano plot of DEGs of (C) GSE118370 and (D) TCGA. (E,F) The intersection of (E) upregulated DEGs and (F) downregulated DEGs of GSE118370 and TCGA.

Table 1. Statistic result of differentially expressed genes(DEGs).
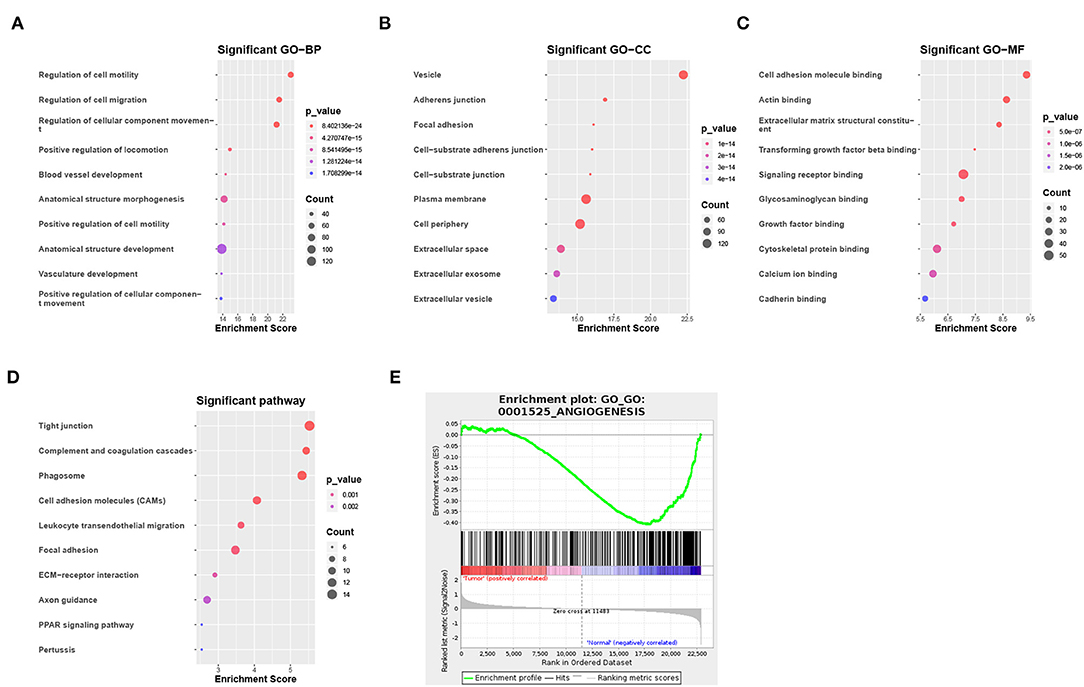
Figure 3. Functional enrichment analysis of DEGs. (A–C) Enrichment result of downregulated DEGs in (A) the biological process (BP), (B) the cellular component (CC), and (C) the molecular function (MF) pathway of Gene Ontology (GO). (D) Enrichment result of downregulated DEGs of the Kyoto Encyclopedia of Genes and Genomes (KEGG) pathway. (E) Gene set enrichment analysis result of GO:0001525 (ANGIOGENESIS).
To identify the potential functions of the DEGs in the tumor group and the normal group, GSEA was conducted to search GO terms enriched in the GSE118370 dataset (Figure 3E). The results showed that some of the genes expressed in the normal group were significantly and negatively correlated with the angiogenesis pathway (GO: 0001525).
Previous analyses of the ligand-receptor relationships of all marker genes in each cell type were presented as arrow diagrams (Supplementry Figure 1D; Figure 4A) (11). Finally, screening of nine ligand-receptor pairs with the most interactions identified a distinct network in individual cells (Figure 4B).
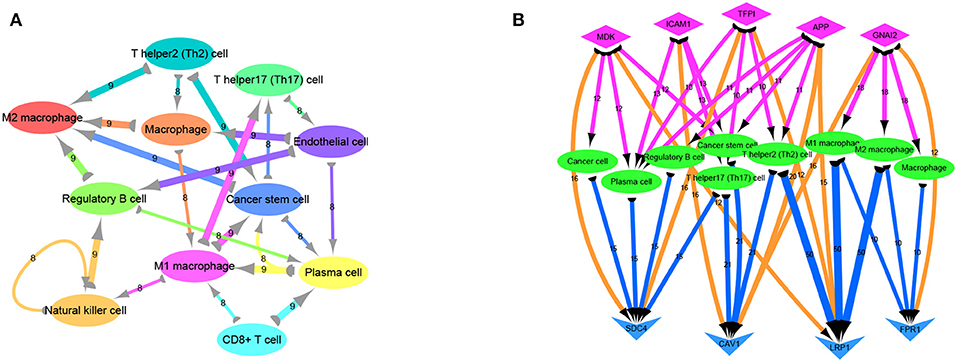
Figure 4. Ligand receptor network analysis. (A) Network diagram of the detailed relationship between ligand receptors in various cell types. (B) Based on the network pairing relationship, the top none most ligand-receptor relationship pairs are selected, and the number of relationships between them with cell group is counted, including SDC4-MDK (16 pairs); SDC4-TFPI (16 pairs); LRP1-MDK (12 pairs); CAV1-ICAM1 (16 pairs); CAV1-APP (20 pairs); CAV1-GNAI2 (16 pairs); LRP1-TFPI (12 pairs); LRP1-APP (15 pairs); FPR1-GNAI2 (12 pairs). Diamond-shaped nodes represent ligands, and the arrows from ligands to cell types means V-shaped nodes represent receptors.
The DEGs were compared with screened ligand-receptor pairs and the following top 18 transcripts were selected as candidate DEGs: AXL, C1QA, CAV1, CD36, CD93, CDH1, COL1A1, DDR1, EFNB2, ERBB2, ERBB3, GNAI2, HBEGF, LPL, MDK, PECAM-1, PROS1, and SDC1. Compared to normal tissues, CDH1, COL1A1, DDR1, ERBB2, ERBB3, MDK, and SDC1 were upregulated in LC, and AXL, C1QA, CAV1, CD36, CD93, EFNB2, GNAI2, HBEGF, LPL, PECAM-1, and PROS1 were downregulated. According to the GO analysis, the candidate DEGs were significantly enriched in wound healing, response to wounding, and cell migration (BP, Figure 5A), extracellular space, cell surface, and vesicle (CC, Figure 5B), and growth factor binding, transmembrane receptor protein kinase activity, and protein tyrosine activity (MF, Figure 5C). According to KEGG analysis, the candidate DEGs were significantly enriched in proteoglycans in cancer, bladder cancer, malaria, tyrosine kinase inhibitor resistance in the EGFR, the ERBB signaling pathway, ECM-receptor interactions, fluid shear stress and atherosclerosis, cell adhesion molecules, and cholesterol metabolism in endometrial cancer (Figure 5D).
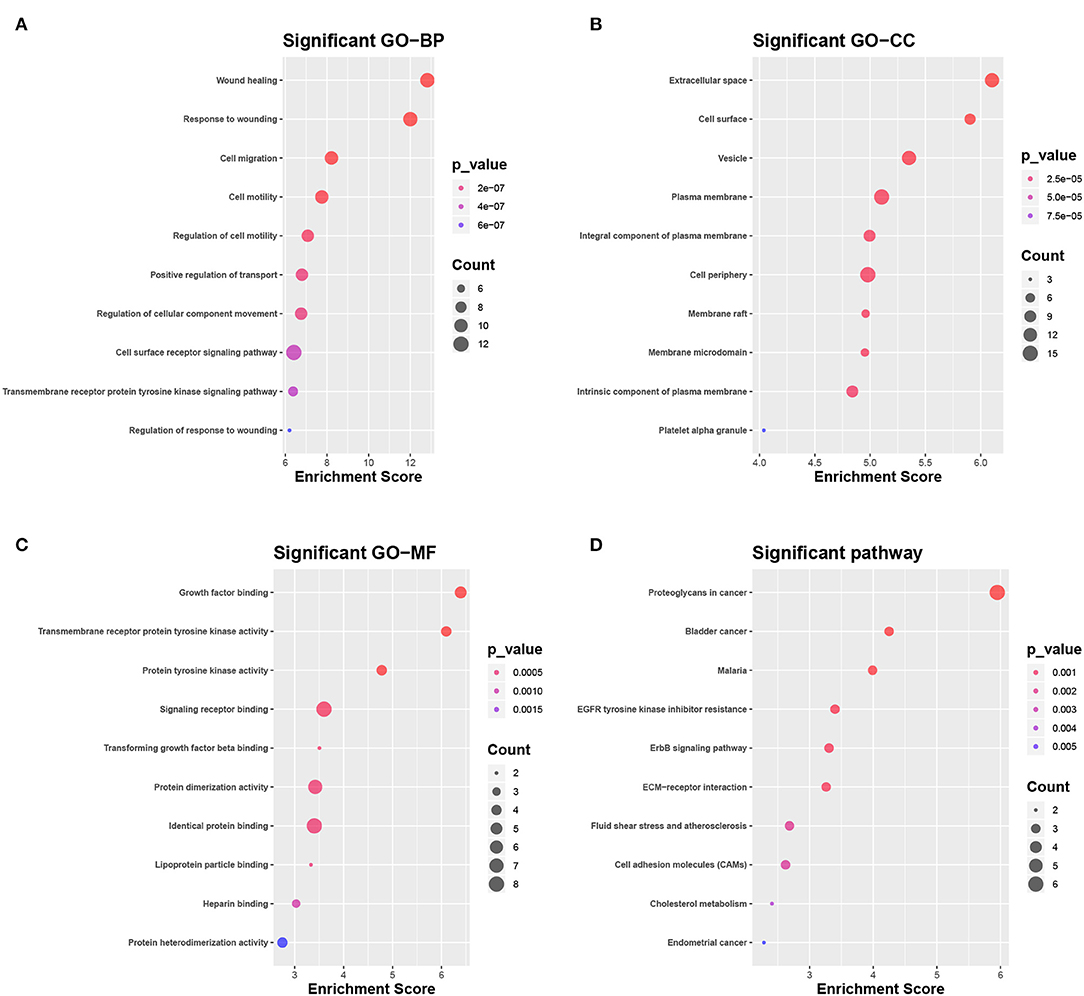
Figure 5. Selection and enrichment analysis of candidate DEGs. (A–C) Gene function enrichment analysis of candidate DEGs in (A) GO BP, (B) GO CC, and (C) GO MF. (D) Gene function enrichment analysis of candidate DEGs in the KEGG pathway.
Further analysis of the expression and clinical information of candidate DEGs in TCGA-LUAD database. We performed survival analysis on half of the patients with high expression levels and half of the patients with low expression levels of candidate DEGs and found that the expression of PECAM-1 had a significant impact on the survival of patients with LC at the threshold expression value of 8,615 (Figures 6A–D).
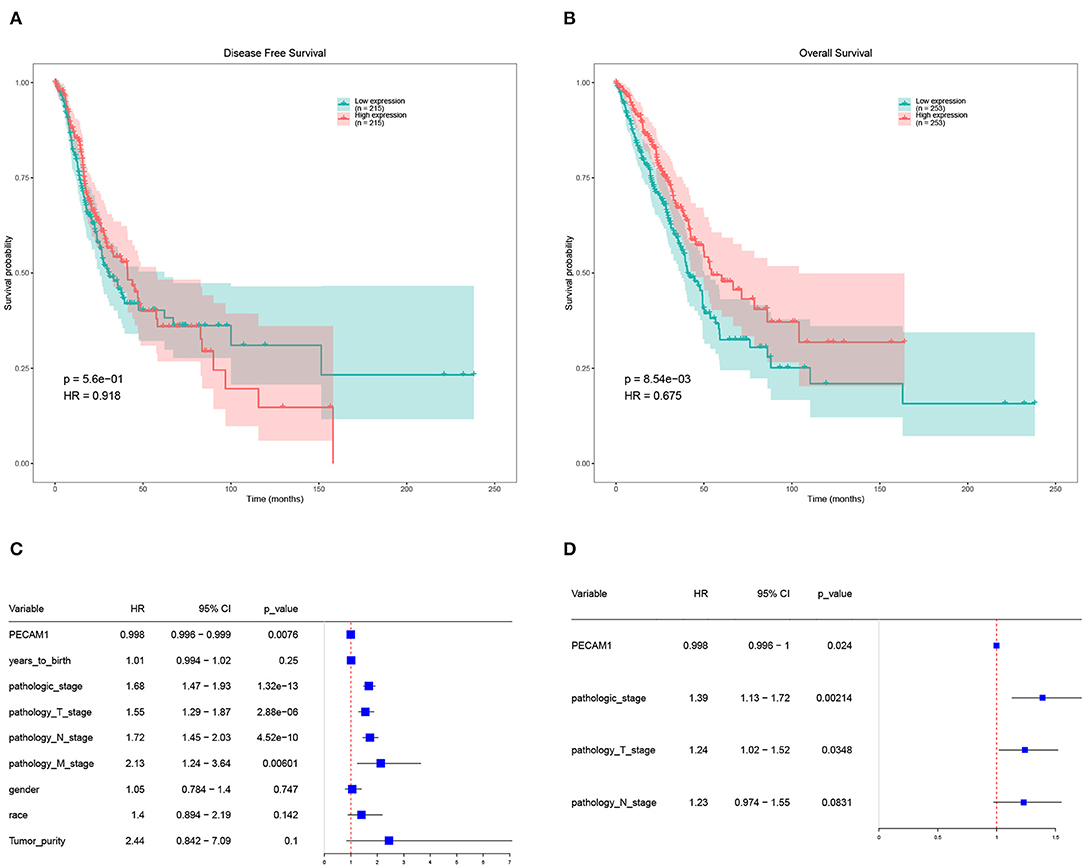
Figure 6. Survival analysis of PECAM-1. (A) Disease-free survival (DFS) of PECAM-1 expression. (B) Overall survival (OS) of PECAM-1 expression. (C) Univariate cox analysis of PECAM-1. (D) Multivariate cox analysis of PECAM-1.
High expression of PECAM-1 apparently lead to a longer overall survival than its low expression [p = 0.00854, hazard ratio (HR) = 0.675, Figure 6B]. Univariate Cox analysis showed that PECAM-1 is a protective factor [HR = 0.998, 95% confidence interval (95%CI) = 0.996–0.999, p = 0.0076, Figure 6C]. Multivariate analysis was used for factors found to be obviously significant in univariate analysis, and the results of multivariate Cox analysis showed that PECAM-1 tended to have a protective effect (HR = 0.998, 95%CI = 0.996–1, p = 0.0024, Figure 6D).
First, we collected the paraffin tissue and clinical data of 30 patients with postoperative LUAC (Table 2). Then, we performed immunohistochemical tests to validate the expression of PECAM-1 in those paraffin specimens (Figures 7A,B). The median follow-up time is 50 months (three patients were lost). The Kaplan–Meier survival analysis of the overall survival of two groups showed that the PECAM-1 high-expression group showed a better survival trend than the PECAM-1 low-expression group, similar to our previous analysis (p = 0.172, Figure 7C).
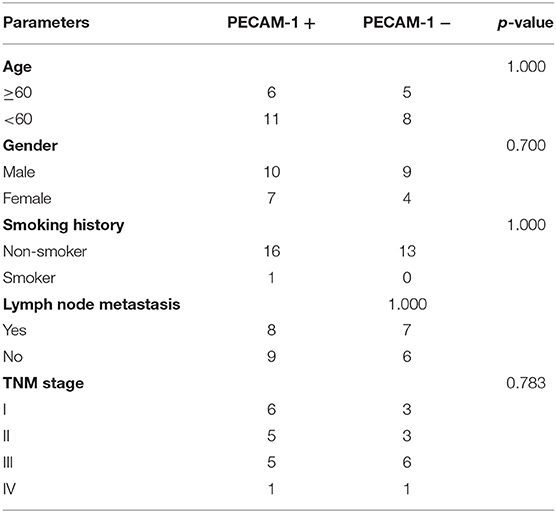
Table 2. Demographic, clinical, and pathological characteristics of patients with lung adenocarcinoma in the PECAM-1 high-expression group (PECAM-1+) and the PECAM-1 low-expression group (PECAM-1-).
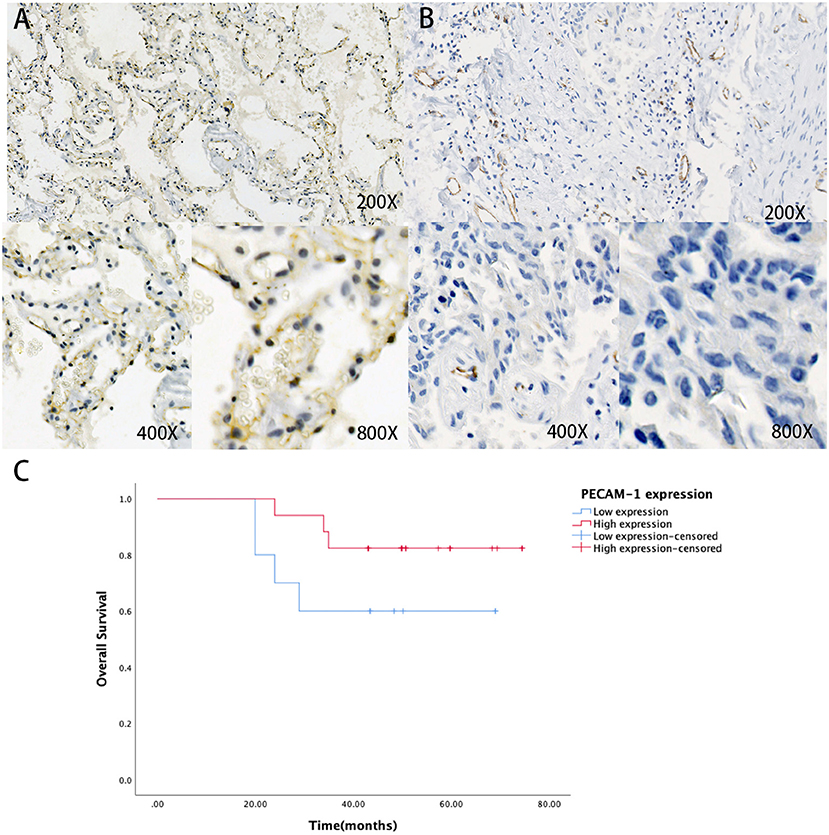
Figure 7. The expression of protein PECAM-1 in patients with lung adenocarcinoma. A-B Representative positive (A) and negative (B) expression of PECAM-1 were examined by immunohistochemistry in lung adenocarcinoma tissues (n = 30). Original magnification, ×200 (upper panel), ×400 (lower panel), ×800 (lower panel). (C) The association of protein expression of PECAM-1 with OS (n = 30).
In the present study, cell clusters in the tumor group and the normal group were identified. Screening of the top 18 candidate DEGs in two groups identified those expressed predominantly in ligand-receptor pairs with many interactions. Functional enrichment and survival analyses indicated that the candidate DEGs were significantly associated with the prognosis of LC, especially PECAM-1.
Overall, 18 candidate DEGs that participate in many ligand-receptor activities were subjected to scRNA-seq. The GO BP analysis results revealed that these DEGs were mainly enriched in the following top five functions: wound healing, response to wounding, cell migration, cell motility, and regulation of cell motility. Previous studies have demonstrated that the stroma of solid tumors contains a variety of cellular phenotypes and signaling pathways associated with wound healing. For example, tumor stroma is formed by abnormal activation of the wound healing pathways (16, 17). Both wound healing and TME are dependent on changes to deposition of the extracellular matrix, which promotes epithelial–mesenchymal transition and increases the motility of both fibroblasts and tumor cells (18). The GO CC analysis indicated that candidate DEGs enriched in extracellular space, cell surface, and vesicles may have important impacts on exosome production and tumor metastasis (19). The GO MF analysis demonstrated that some of the candidate DEGs were enriched in transmembrane receptor protein kinase activity and protein tyrosine activity, suggesting that the difference in the cellular processes of tumor cells vs. normal cells, such as cell signaling, cell-cell communication, transport, energy transduction, and enzyme activation, may be induced by receptor protein kinases. (20). These results suggest that these DEGs are involved in the establishment of the TME and the migration of LC cells.
The KEGG pathway analysis showed that the identified DEGs were mainly enriched in the following top five pathways: proteoglycans in cancer, bladder cancer, malaria, tyrosine kinase inhibitor resistance in EGFR, and the ERBB signaling pathway. Proteoglycans exert diverse functions in the occurrence of cancer (21–23) and are thought to regulate the phenotype of tumor cells and angiogenesis in tumor metabolism, in addition to promoting the formation of a temporary matrix for tumor growth, thereby affecting cell-cell interactions and cell-matrix interactions and tumor cell signal transduction (21). EGFR and the ERBB pathway are common targets for the treatment of LC (24, 25). The results of the present study showed DEGs have impact on tyrosine kinase inhibitor resistance in EGFR and the ERBB signaling pathway, which provide interesting insights for future studies of tyrosine kinase inhibitors in LC.
There were a lot of research about the 18 candidate DEGs. Expression of CDH1 (E-Cadherin) is associated with physiological signaling pathways, such as cell proliferation, maintenance of cell adhesion, cell polarity, and epithelial–mesenchymal transition. It is considered a risk factor for diffuse gastric and lobular breast cancer (26). COL1A1 expressions are found in most connective tissues and are abundant in bones, corneas, the dermis, and tendons (27). DDR1 is predominantly expressed in epithelial cells and is reported to be involved in the progression of cancer (28). Amplification of ERBB2 is well-described in many kinds of solid cancer and has been established as an important actionable target in multiple cancer types (29). ERBB3 plays an important role in cancer, and the mutation of ERBB is a potential tumor driver (30). MDK is a heparin-binding growth factor and acts as a mediator for the acquisition of critical hallmarks of cancer, including cell growth, survival, metastasis, migration, and angiogenesis (31). The expression of SDC1 often produces malignant phenotypes, which arise from increased cell proliferation and cell growth, cell survival, cell invasion and metastasis, and angiogenesis (32). AXL is a receptor tyrosine kinase expressed in many cancer types and has been associated with therapy resistance and poor clinical prognosis and outcomes (33). C1QA encodes the A-chain polypeptide of serum complement subcomponent C1q, which is associated with lupus erythematosus and glomerulonephritis (34). CAV1 encodes the scaffolding protein, which is the main component of the caveolae plasma membranes found in most cell types (35). CD36 is a scavenger receptor expressed in multiple cell types, and it mediates lipid uptake, immunological recognition, inflammation, molecular adhesion, and apoptosis (36). CD93 is a transmembrane receptor that is upregulated in tumor vessels in many types of cancer, including high-grade glioma (37). EFNB2 is expressed at abnormally high levels in some neoplasms, such as squamous cell carcinoma of the head and neck and colorectal cancer (38). The expression of GNAI2 in CD11c+ cells and IL6 in CD4+/CD11b+ DCs appears to promote colon tumor development in mice (39). HBEGF is a ligand for the EGFR, one of the most commonly amplified receptor tyrosine kinases in glioblastoma, which may be a clinically relevant target (40). LPL has been extensively investigated as a potential risk factor for coronary artery disease (41). PROS1 encodes a vitamin K-dependent plasma protein that functions as a cofactor for the anticoagulant protease, an activated protein C to inhibit blood coagulation. It plays an essential role in the resolution of inflammation (42).
PECAM-1 (also known as a cluster of differentiation 31, CD31) was primarily identified as an adhesion molecule that plays various roles in cell proliferation, apoptosis, and migration, in addition to cellular immunity. PECAM-1 is expressed by some tumor cells and may contribute to tumor invasion (43, 44). However, the role of PECAM-1 in LC remains unclear (45–50). Giovanna et al. found that PECAM-1 acts as a checkpoint molecule and can negatively regulate FcγR-mediated phagocytosis by monocytes and macrophages, and downregulation of PECAM-1 correlated with decreased survival of chronic lymphocytic leukemia cells (51, 52). Virman et al. found that high expression of PECAM-1 was significantly associated with improved survival.
At present, the research on PECAM-1 is not sufficient, but many studies have shown that PECAM-1 may affect immune regulation. This molecule may play a crucial and complex role in the regulation of T-cell-mediated immune responses, with a large impact on immunity in health and disease (53). Previous studies have found that although the loss of PECAM-1 leads to excessively cytotoxic killing, PECAM-1 also can delay T-cell apoptosis and prolong the action time of T cells (54, 55). Studies have also found that the PECAM-1 protein can promote the endothelial migration of lymphocytes and natural killer cell, which take pivotal roles in eliminating the abnormal cells, such as tumor cells (54, 56, 57). Analysis by our group revealed that a high PECAM-1 expression was associated with better overall survival and is a significant prognostic factor in LC. Although multivariate Cox analysis showed that PECAM-1 was not statistically significant, a suitable cutoff value of PECAM-1 expression may help to indicate better survival of patients with LC. Our research also found that, although it is statistically non-significant, patients with LC with a high PECAM-1 expression had a longer overall survival period, which may be related to the effect of PECAM-1 on the tumor immune microenvironment, promoting the transport of immune cells and enhancing the role of immune cells. However, the potential impact of PECAM-1-mediated interactions on the development and function of the immune system need to be fully studied.
The results of the present study identified key genes and pathways in LC, which will improve our understanding of the molecular mechanisms underlying the development and progression of LC. Eighteen genes that potentially play pivotal roles in the pathogenesis of LC and may be closely associated with tumor progression, especially PECAM-1, were identified in the present study. In addition, we conducted immunohistochemical analysis on the protein expression of PECAM-1 in lung cancer tissues and analyzed the survival of patients with LC with different PECAM-1 expressions. We found that the PECAM-1 high-expression group has a clear survival advantage, which further shows that PECAM-1 may be a protective prognostic factor.
Publicly available datasets were analyzed in this study. This data can be found here: the NCBI Gene Expression Omnibus (GSE117570 and GSE118370) and The Cancer Genome Atlas (https://portal.gdc.cancer.gov/) (TCGA LUAD).
Written informed consent was obtained from the individual(s) for the publication of any potentially identifiable images or data included in this article.
HZ, YZho, and SC designed the study. SC and YW drafted the manuscript. SC, YW, and JL processed and analyzed data. XL and YZha edited the drafting of the manuscript and drew some pictures. HZ and YZho revised the manuscript. All authors contributed to the article and approved the submitted version.
This work was supported by the Science and Technology Commission of Shanghai Muncipality (No. 19411970900) and the Shanghai Chest Hospital-Collaborative Innovation Project (Project No.YJXT20190204).
The authors declare that the research was conducted in the absence of any commercial or financial relationships that could be construed as a potential conflict of interest.
The Supplementary Material for this article can be found online at: https://www.frontiersin.org/articles/10.3389/fonc.2021.587744/full#supplementary-material
1. Herbst RS, Heymach JV, Lippman SM. Lung cancer. N Engl J Med. (2008) 359:1367–80. doi: 10.1056/NEJMra0802714
2. Collisson EA, Campbell JD, Brooks AN, Berger AH, Lee W, Chmielecki J, et al. Comprehensive molecular profiling of lung adenocarcinoma. Nature. (2014) 511:543–50. doi: 10.1038/nature13385
3. Tanay A, Regev A. Scaling single-cell genomics from phenomenology to mechanism. Nature. (2017) 541:331–8. doi: 10.1038/nature21350
4. Patel AP, Tirosh I, Trombetta JJ, Shalek AK, Gillespie SM, Wakimoto H, et al. Single-cell RNA-seq highlights intratumoral heterogeneity in primary glioblastoma. Science. (2014) 344:1396–401. doi: 10.1126/science.1254257
5. Lawson DA, Bhakta NR, Kessenbrock K, Prummel KD, Yu Y, Takai K, et al. Single-cell analysis reveals a stem-cell program in human metastatic breast cancer cells. Nature. (2015) 526:131–5. doi: 10.1038/nature15260
6. Xiong D, Pan J, Yin Y, Jiang H, Szabo E, Lubet RA, et al. Novel mutational landscapes and expression signatures of lung squamous cell carcinoma. Oncotarget. (2018) 9:7424–41. doi: 10.18632/oncotarget.23716
7. Guo X, Zhang Y, Zheng L, Zheng C, Song J, Zhang Q, et al. Global characterization of T cells in non-small-cell lung cancer by single-cell sequencing. Nat Med. (2018) 24:978–85. doi: 10.1038/s41591-018-0045-3
8. Lun ATL, Riesenfeld S, Andrews T, Dao TP, Gomes T, Marioni JC. EmptyDrops: distinguishing cells from empty droplets in droplet-based single-cell RNA sequencing data. Genome Biol. (2019) 20:63. doi: 10.1186/s13059-019-1662-y
9. McCarthy DJ, Campbell KR, Lun AT, Wills QF. Scater: pre-processing, quality control, normalization and visualization of single-cell RNA-seq data in R. Bioinformatics. (2017) 33:1179–86. doi: 10.1093/bioinformatics/btw777
10. Butler A, Hoffman P, Smibert P, Papalexi E, Satija R. Integrating single-cell transcriptomic data across different conditions, technologies, and species. Nat Biotechnol. (2018) 36:411–20. doi: 10.1038/nbt.4096
11. Zhang X, Lan Y, Xu J, Quan F, Zhao E, Deng C, et al. CellMarker: a manually curated resource of cell markers in human and mouse. Nucleic Acids Res. (2019) 47:D721–8. doi: 10.1093/nar/gky900
12. Ramilowski JA, Goldberg T, Harshbarger J, Kloppmann E, Lizio M, Satagopam VP, et al. A draft network of ligand-receptor-mediated multicellular signalling in human. Nat Commun. (2015) 6:7866. doi: 10.1038/ncomms8866
13. Ashburner M, Ball CA, Blake JA, Botstein D, Butler H, Cherry JM, et al. Gene ontology: tool for the unification of biology. The Gene Ontology Consortium. Nat Genet. (2000) 25:25–9. doi: 10.1038/75556
14. Kanehisa M, Goto S. KEGG: Kyoto encyclopedia of genes and genomes. Nucleic Acids Res. (2000) 28:27–30. doi: 10.1093/nar/28.1.27
15. Subramanian A, Tamayo P, Mootha VK, Mukherjee S, Ebert BL, Gillette MA, et al. Gene set enrichment analysis: a knowledge-based approach for interpreting genome-wide expression profiles. Proc Natl Acad Sci USA. (2005) 102:15545–550. doi: 10.1073/pnas.0506580102
16. Dvorak HF. Tumors: wounds that do not heal. Similarities between tumor stroma generation and wound healing. N Engl J Med. (1986) 315:1650–9. doi: 10.1056/NEJM198612253152606
17. Foster DS, Jones RE, Ransom RC, Longaker MT, Norton JA. The evolving relationship of wound healing and tumor stroma. JCI Insight. (2018) 3:e99911. doi: 10.1172/jci.insight.99911
18. Ge Y, Gomez NC, Adam RC, Nikolova M, Yang H, Verma A, et al. Stem cell lineage infidelity drives wound repair and cancer. Cell. (2017) 169:636–50.e614. doi: 10.1016/j.cell.2017.03.042
19. Meldolesi J. Exosomes and ectosomes in intercellular communication. Curr Biol. (2018) 28:R435–44. doi: 10.1016/j.cub.2018.01.059
20. Albrecht C, Appert-Collin A, Bagnard D, Blaise S, Romier-Crouzet B, Efremov RG, et al. Transmembrane peptides as inhibitors of protein-protein interactions: an efficient strategy to target cancer cells? Front Oncol. (2020) 10:519. doi: 10.3389/fonc.2020.00519
21. Fan S, Liang Z, Gao Z, Pan Z, Han S, Liu X, et al. Identification of the key genes and pathways in prostate cancer. Oncol Lett. (2018) 16:6663–9. doi: 10.3892/ol.2018.9491
22. Barash U, Cohen-Kaplan V, Dowek I, Sanderson RD, Ilan N, Vlodavsky I. Proteoglycans in health and disease: new concepts for heparanase function in tumor progression and metastasis. FEBS J. (2010) 277:3890–903. doi: 10.1111/j.1742-4658.2010.07799.x
23. Theocharis AD, Skandalis SS, Neill T, Multhaupt HA, Hubo M, Frey H, et al. Insights into the key roles of proteoglycans in breast cancer biology and translational medicine. Biochim Biophys Acta. (2015) 1855:276–300. doi: 10.1016/j.bbcan.2015.03.006
24. Singh D, Attri BK, Gill RK, Bariwal J. Review on EGFR inhibitors: critical updates. Mini Rev Med Chem. (2016) 16:1134–66. doi: 10.2174/1389557516666160321114917
25. Wang Z. ErbB receptors and cancer. Methods Mol Biol. (2017) 1652:3–35. doi: 10.1007/978-1-4939-7219-7_1
26. Shenoy S. CDH1 (E-Cadherin) mutation and gastric cancer: genetics, molecular mechanisms and guidelines for management. Cancer Manag Res. (2019) 11:10477–86. doi: 10.2147/CMAR.S208818
27. Marini JC, Forlino A, Bächinger HP, Bishop NJ, Byers PH, Paepe A, et al. Osteogenesis imperfecta. Nat Rev Dis Primers. (2017) 3:17052. doi: 10.1038/nrdp.2017.52
28. Yeh YC, Lin HH, Tang MJ. Dichotomy of the function of DDR1 in cells and disease progression. Biochim Biophys Acta Mol Cell Res. (2019) 1866:118473. doi: 10.1016/j.bbamcr.2019.04.003
29. Subramanian J, Katta A, Masood A, Vudem DR, Kancha RK. Emergence of ERBB2 mutation as a biomarker and an actionable target in solid cancers. Oncologist. (2019) 24:e1303–14. doi: 10.1634/theoncologist.2018-0845
30. Kiavue N, Cabel L, Melaabi S, Bataillon G, Callens C, Lerebours F, et al. ERBB3 mutations in cancer: biological aspects, prevalence and therapeutics. Oncogene. (2020) 39:487–502. doi: 10.1038/s41388-019-1001-5
31. Filippou PS, Karagiannis GS, Constantinidou A. Midkine (MDK) growth factor: a key player in cancer progression and a promising therapeutic target. Oncogene. (2020) 39:2040–54. doi: 10.1038/s41388-019-1124-8
32. Gharbaran R. Advances in the molecular functions of syndecan-1 (SDC1/CD138) in the pathogenesis of malignancies. Crit Rev Oncol Hematol. (2015) 94:1–17. doi: 10.1016/j.critrevonc.2014.12.003
33. Tanaka M, Siemann DW. Gas6/Axl signaling pathway in the tumor immune microenvironment. Cancers. (2020) 12:1850. doi: 10.3390/cancers12071850
34. Fonseca MI, Chu SH, Hernandez MX, Fang MJ, Modarresi L, Selvan P, et al. Cell-specific deletion of C1qa identifies microglia as the dominant source of C1q in mouse brain. J Neuroinflammation. (2017) 14:48. doi: 10.1186/s12974-017-0814-9
35. Hofmann F, Flockerzi V, Kahl S, Wegener JW. L-type CaV1.2 calcium channels: from in vitro findings to in vivo function. Physiol Rev. (2014) 94:303–26. doi: 10.1152/physrev.00016.2013
36. Wang J, Li Y. CD36 tango in cancer: signaling pathways and functions. Theranostics. (2019) 9:4893–908. doi: 10.7150/thno.36037
37. Lugano R, Vemuri K, Yu D, Bergqvist M, Smits A, Essand M, et al. CD93 promotes β1 integrin activation and fibronectin fibrillogenesis during tumor angiogenesis. J Clin Invest. (2018) 128:3280–97. doi: 10.1172/JCI97459
38. Zhu F, Dai SN, Xu DL, Hou CQ, Liu TT, Chen QY, et al. EFNB2 facilitates cell proliferation, migration, and invasion in pancreatic ductal adenocarcinoma via the p53/p21 pathway and EMT. Biomed Pharmacother. (2020) 125:109972. doi: 10.1016/j.biopha.2020.109972
39. Li ZW, Sun B, Gong T, Guo S, Zhang J, Wang J, et al. GNAI1 and GNAI3 reduce colitis-associated tumorigenesis in mice by blocking IL6 signaling and down-regulating expression of GNAI2. Gastroenterology. (2019) 156:2297–312. doi: 10.1053/j.gastro.2019.02.040
40. Shin CH, Robinson JP, Sonnen JA, Welker AE, Yu DX, VanBrocklin MW, et al. HBEGF promotes gliomagenesis in the context of Ink4a/Arf and Pten loss. Oncogene. (2017) 36:4610–18. doi: 10.1038/onc.2017.83
41. Xie L, Li YM. Lipoprotein Lipase (LPL) polymorphism and the risk of coronary artery disease: a meta-analysis. Int J Environ Res Public Health. (2017) 14:84. doi: 10.3390/ijerph14010084
42. Rothlin CV, Carrera-Silva EA, Bosurgi L, Ghosh S. TAM receptor signaling in immune homeostasis. Annu Rev Immunol. (2015) 33:355–91. doi: 10.1146/annurev-immunol-032414-112103
43. Gong G, Lin T, Yuan Y. Integrated analysis of gene expression and DNA methylation profiles in ovarian cancer. J Ovarian Res. (2020) 13:30. doi: 10.1186/s13048-020-00632-9
44. Ranamukhaarachchi SK, Modi RN, Han A, Velez DO, Kumar A, Engler AJ, et al. Macromolecular crowding tunes 3D collagen architecture and cell morphogenesis. Biomater Sci. (2019) 7:618–33. doi: 10.1039/C8BM01188E
45. Liu XL, Liu LD, Zhang SG, Dai SD, Li WY, Zhang L. Correlation between expression and significance of δ-catenin, CD31, and VEGF of non-small cell lung cancer. Genet Mol Res. (2015) 14:13496–503. doi: 10.4238/2015.October.28.10
46. Mohamed SY, Mohammed HL, Ibrahim HM, Mohamed EM, Salah M. Role of VEGF, CD105, and CD31 in the prognosis of colorectal cancer cases. J Gastrointest Cancer. (2019) 50:23–34. doi: 10.1007/s12029-017-0014-y
47. Rask L, Høgdall CK, Kjaer SK, Christensen L, Jensen A, Blaakaer J, et al. Association of CD31 and p53 with survival of ovarian cancer patients. Anticancer Res. (2019) 39:567–76. doi: 10.21873/anticanres.13149
48. Tzeng HT, Tsai CH, Yen YT, Cheng HC, Chen YC, Pu SW, et al. Dysregulation of Rab37-mediated cross-talk between cancer cells and endothelial cells via thrombospondin-1 promotes tumor neovasculature and metastasis. Clin Cancer Res. (2017) 23:2335–45. doi: 10.1158/1078-0432.CCR-16-1520
49. Virman J, Bono P, Luukkaala T, Sunela K, Kujala P, Kellokumpu-Lehtinen LP. VEGFR3, and CD31 as prognostic factors in renal cell cancer. Anticancer Res. (2015) 35:921–7.
50. Zhang YY, Kong LQ, Zhu XD, Cai H, Wang CH, Shi WK, et al. CD31 regulates metastasis by inducing epithelial-mesenchymal transition in hepatocellular carcinoma via the ITGB1-FAK-Akt signaling pathway. Cancer Lett. (2018) 429:29–40. doi: 10.1016/j.canlet.2018.05.004
51. Gautam S, Fatehchand K, Elavazhagan S, Reader BF, Ren L, Mo X, et al. Reprogramming nurse-like cells with interferon γ to interrupt chronic lymphocytic leukemia cell survival. J Biol Chem. (2016) 291:14356–62. doi: 10.1074/jbc.M116.723551
52. Merchand-Reyes G, Robledo-Avila FH, Buteyn NJ, Gautam S, Santhanam R, Fatehchand K, et al. CD31 acts as a checkpoint molecule and is modulated by FcγR-mediated signaling in monocytes. J Immunol. (2019) 203:3216–24. doi: 10.4049/jimmunol.1900059
53. Marelli-Berg FM, Clement M, Mauro C, Caligiuri G. An immunologist's guide to CD31 function in T-cells. J Cell Sci. (2013) 126(Pt. 11):2343–52. doi: 10.1242/jcs.124099
54. Zocchi MR, Ferrero E, Leone BE, Rovere P, Bianchi E, Toninelli E, et al. CD31/PECAM-1-driven chemokine-independent transmigration of human T lymphocytes. Eur J Immunol. (1996) 26:759–67. doi: 10.1002/eji.1830260406
55. Ma L, Mauro C, Cornish GH, Chai J-G, Coe D, Fu H, et al. Ig gene-like molecule CD31 plays a nonredundant role in the regulation of T-cell immunity and tolerance. Proc Natl Acad Sci USA. (2010) 107:19461–6. doi: 10.1073/pnas.1011748107
56. Berman ME, Xie Y, Muller WA. Roles of platelet/endothelial cell adhesion molecule-1 (PECAM-1, CD31) in natural killer cell transendothelial migration and beta 2 integrin activation. J Immunol. (1996) 156:1515–24.
Keywords: non-small cell lung cancer, single-cell RNA-seq, gene expression omnibus database (GEO), the Cancer Genome Atlas (TCGA), PECAM-1 (CD31)
Citation: Cao S, Wang Y, Li J, Ling X, Zhang Y, Zhou Y and Zhong H (2021) Prognostic Implication of the Expression Level of PECAM-1 in Non-small Cell Lung Cancer. Front. Oncol. 11:587744. doi: 10.3389/fonc.2021.587744
Received: 27 July 2020; Accepted: 08 February 2021;
Published: 22 March 2021.
Edited by:
Emanuela Felley-Bosco, University of Zurich, SwitzerlandCopyright © 2021 Cao, Wang, Li, Ling, Zhang, Zhou and Zhong. This is an open-access article distributed under the terms of the Creative Commons Attribution License (CC BY). The use, distribution or reproduction in other forums is permitted, provided the original author(s) and the copyright owner(s) are credited and that the original publication in this journal is cited, in accordance with accepted academic practice. No use, distribution or reproduction is permitted which does not comply with these terms.
*Correspondence: Hua Zhong, ZWRkaWVkb25nOEBob3RtYWlsLmNvbQ==; Yan Zhou, eXpob3U3MTZAMTYzLmNvbQ==
†These authors have contributed equally to this work
Disclaimer: All claims expressed in this article are solely those of the authors and do not necessarily represent those of their affiliated organizations, or those of the publisher, the editors and the reviewers. Any product that may be evaluated in this article or claim that may be made by its manufacturer is not guaranteed or endorsed by the publisher.
Research integrity at Frontiers
Learn more about the work of our research integrity team to safeguard the quality of each article we publish.