 Qinglian He
 Ziqi Li
 Jinbao Yin1
 Yuling Li
 Yuting Yin
 Xue Lei
 Wei Zhu
94% of researchers rate our articles as excellent or good
Learn more about the work of our research integrity team to safeguard the quality of each article we publish.
Find out more
ORIGINAL RESEARCH article
Front. Oncol. , 15 April 2021
Sec. Gastrointestinal Cancers
Volume 11 - 2021 | https://doi.org/10.3389/fonc.2021.566539
This article is part of the Research Topic Molecular Biomarkers for Gastric Cancer View all 36 articles
Background: Colorectal cancer (CRC) is a common malignant solid tumor with an extremely low survival rate after relapse. Previous investigations have shown that autophagy possesses a crucial function in tumors. However, there is no consensus on the value of autophagy-associated genes in predicting the prognosis of CRC patients. This work screens autophagy-related markers and signaling pathways that may participate in the development of CRC, and establishes a prognostic model of CRC based on autophagy-associated genes.
Methods: Gene transcripts from the TCGA database and autophagy-associated gene data from the GeneCards database were used to obtain expression levels of autophagy-associated genes, followed by Wilcox tests to screen for autophagy-related differentially expressed genes. Then, 11 key autophagy-associated genes were identified through univariate and multivariate Cox proportional hazard regression analysis and used to establish prognostic models. Additionally, immunohistochemical and CRC cell line data were used to evaluate the results of our three autophagy-associated genes EPHB2, NOL3, and SNAI1 in TCGA. Based on the multivariate Cox analysis, risk scores were calculated and used to classify samples into high-risk and low-risk groups. Kaplan-Meier survival analysis, risk profiling, and independent prognosis analysis were carried out. Receiver operating characteristic analysis was performed to estimate the specificity and sensitivity of the prognostic model. Finally, GSEA, GO, and KEGG analysis were performed to identify the relevant signaling pathways.
Results: A total of 301 autophagy-related genes were differentially expressed in CRC. The areas under the 1-year, 3-year, and 5-year receiver operating characteristic curves of the autophagy-based prognostic model for CRC were 0.764, 0.751, and 0.729, respectively. GSEA analysis of the model showed significant enrichment in several tumor-relevant pathways and cellular protective biological processes. The expression of EPHB2, IL-13, MAP2, RPN2, and TRAF5 was correlated with microsatellite instability (MSI), while the expression of IL-13, RPN2, and TRAF5 was related to tumor mutation burden (TMB). GO analysis showed that the 11 target autophagy genes were chiefly enriched in mRNA processing, RNA splicing, and regulation of the mRNA metabolic process. KEGG analysis showed enrichment mainly in spliceosomes. We constructed a prognostic risk assessment model based on 11 autophagy-related genes in CRC.
Conclusion: A prognostic risk assessment model based on 11 autophagy-associated genes was constructed in CRC. The new model suggests directions and ideas for evaluating prognosis and provides guidance to choose better treatment strategies for CRC.
Colorectal cancer (CRC) is a prevalent disease worldwide (1). Even with improvements in living standards and changes in dietary structure, the morbidity and fatality of CRC have remained high in recent years (2). At present, the prognosis of CRC patients is primarily assessed using the tumor-node-metastasis (TNM) staging system. Generally, the earlier the stage it occurs, the better the prognosis is. Autophagy is a lysosome-dependent degradation pathway characterized by cytoplasmic vacuolation (3). It can degrade damaged structures in the cytoplasm and produce small organic molecules, and other substances for protein compound and energy metabolism, enabling cells to adapt to hypoxia and starvation (4). The process of autophagy is modulated by multifarious complex signaling molecules (5). Failure of this regulatory mechanism is closely related to tumor development, neurodegenerative diseases, and aging (6–8). Current experimental data demonstrate that autophagy is related to CRC (9). Raptor and autophagy-related 5 (ATG5), which are autophagy-related genes, contribute to CRC metastasis and drug resistance by regulating autophagy (10, 11), suggesting that autophagy may be significant in treatment and prognosis prediction for CRC. Although many investigations have explored the pathogenesis of CRC, further studies are needed to fully elucidate its detailed molecular mechanisms.
In the present study, autophagy-associated genes differentially expressed in CRC were screened using a bioinformatics approach. In addition, a simple prognostic model of autophagy-associated genes related to the prognosis of CRC patients was constructed based on Cox analysis, in order to obtain evidence for the application of these genes in prognosis prediction and clinical treatment of CRC patients.
Raw CRC transcript data, clinical patient data, and the metadata for all DNA whole-exome BAM files were collected from The Cancer Genome Atlas (TCGA) database (https://portal.gdc.cancer.gov/; released before October 27, 2019) (12), and data for 1,526 autophagy-associated genes with a relevance score of >1.5 were obtained from the GeneCard database (https://www.genecards.org; released before February 19, 2020) (13). As 15 genes, including MARCHF7, CCN2, H2AX, and SARS1, were not found in the TCGA CRC sample, only 1,511 autophagy-associated genes were obtained. TCGA CRC mutation data (VarScan2 Variant Aggregation and Masking) were downloaded from UCSC (https://xenabrowser.net/datapages/; released before March 30, 2020) (14). Sample expression values from the above data were collated using perl (version 10.0.18363.1256), and the ENSEMBL gene ID was converted into a gene name. The Wilcox test was performed on the autophagy-associated genes from CRC tissues and normal tissues using the R software (version 3.6.1) “limmar” package, and the differentially expressed genes (DEGs) were defined by the absolute values of log (fold change) >1 and FDR (false discovery rate) <0.05.
DEGs were subjected to univariate Cox analysis using the “survival” R package. Autophagy-associated genes related with CRC prognosis were identified, and multivariate Cox analysis was carried out to construct a prognostic model according to the best Aike information criterion.
By combining the expression of autophagy-associated genes and the coefficients obtained by multivariate Cox regression analysis, a final formula for calculating risk scores was listed next: risk scores = SLCO1A2exp × 1.24168405018345 + RAB6Bexp × 0.425074259002984 + SNAI1exp × 0.480196885198325 + NOL3exp × 0.473830469554988 − ULK4exp × 1.04014423940406 − EPHB2exp × 0.295212904754073 + TRAF5exp × 0.379124034189421 − PPARGC1Aexp × 0.516127561999247 + MAP2exp × 0.742235003720545 − RPN2exp × 0.557629664887039 − IL13exp × 6.47343548405588. According to the above formula, we calculated the prognostic risk value for each sample in the TCGA data (the median value of the risk score was the standard for defining the high-risk and low-risk groups). Then, the “survival” and “survminer” R packages were used for survival analysis and independent prognosis analysis using the risk score, as well as for visualization of the results. We also performed Kaplan-Meier (KM) survival analysis of 11 autophagy genes in the model. Receiver operating characteristic (ROC) analysis was conducted using the “survivalROC” R package. Finally, the concordance index (C-index) of the autophagy-related prognostic model was calculated. The values of C-index and AUC have low accuracy when they are from 0.50 to 0.70, moderate accuracy when they are from 0.71 to 0.90, and high accuracy when they are greater than 0.90.
For the evaluation of protein level, IHC samples of CRC were downloaded from EPHB2, NOL3, and SNAI1 in the human protein atlas (HPA) database (https://www.proteinatlas.org/) (15) and the integrated optical density (IOD) was analyzed. The IOD of IHC was analyzed by Image-Pro Plus 6.0 software and GraphPad software 8 (statistical significance between groups was examined with an independent-samples t-test). For the evaluation of cell level, the verification of EPHB2, NOL3, and SNAI1 was performed using the Cancer Cell Line Encyclopedia (CCLE) database (https://portals.broadinstitute.org/ccle/about) (16), and GraphPad software 8 was used to visualize the mRNA expression of these genes in nine common CRC cell lines (CACO2, HCT116, HT29, LOVO, RKO, SW1116, SW48, SW480, and SW620) obtained from the CCLE database. When the p value is less than 0.05, the data are considered to be statistically significant.
To identify potential signaling pathways related to prognosis in CRC, we divided CRC patients into high- and low-risk groups for Gene Set Enrichment (GSEA) analysis using the prognostic model. To determine the biological functions and signaling pathways related to the genes in the prognostic model, the target genes of 11 autophagy genes in the model were obtained using the online RNA prediction platform ENCORI (encyclopedia of RNA interactions, http://starbase.sysu.edu.cn/rbpClipRNA.php?source=mRNA; released before February 19, 2020) (17), and Gene Ontology (GO) and Kyoto Encyclopedia of Genes and Genomes (KEGG) analyses were carried out.
According to the previous steps (18), the algorithm MANTIS was used to calculate the MSI score of each sample of CRC, and then R was used to analyze the correlation between these autophagy-related genes and MSI (Spearman), and draw the radar map of the correlation between these genes and MSI. Perl was used to collate the TCGA CRC mutation data obtained from UCSC and calculate the TMB data of each sample. The TMB data of each sample were collated and calculated by perl, and the TMB was calculated as the total number of somatic mutations (including non-synonymous point mutations, insertions, and deletions in the coding region of exons)/the size of the target region, in units of mutations/Mb. Then R was used to analyze the correlation between these autophagy-related genes and TMB (Spearman). Finally, the radar map of the correlation between these genes and TMB was drawn.
According to the mRNA matrix data for 568 CRC tissues and 44 normal tissues in TCGA, absolute values of mRNA expression levels with log (fold change) >1.0 and FDR <0.05 were used as screening criteria. A total of 301 autophagy-associated DEGs were obtained, of which 134 were significantly downregulated and 167 were significantly upregulated. The scatter plot is shown in Figure 1A, and the top five autophagy genes with the most significant upregulation and downregulation are presented in Table 1.
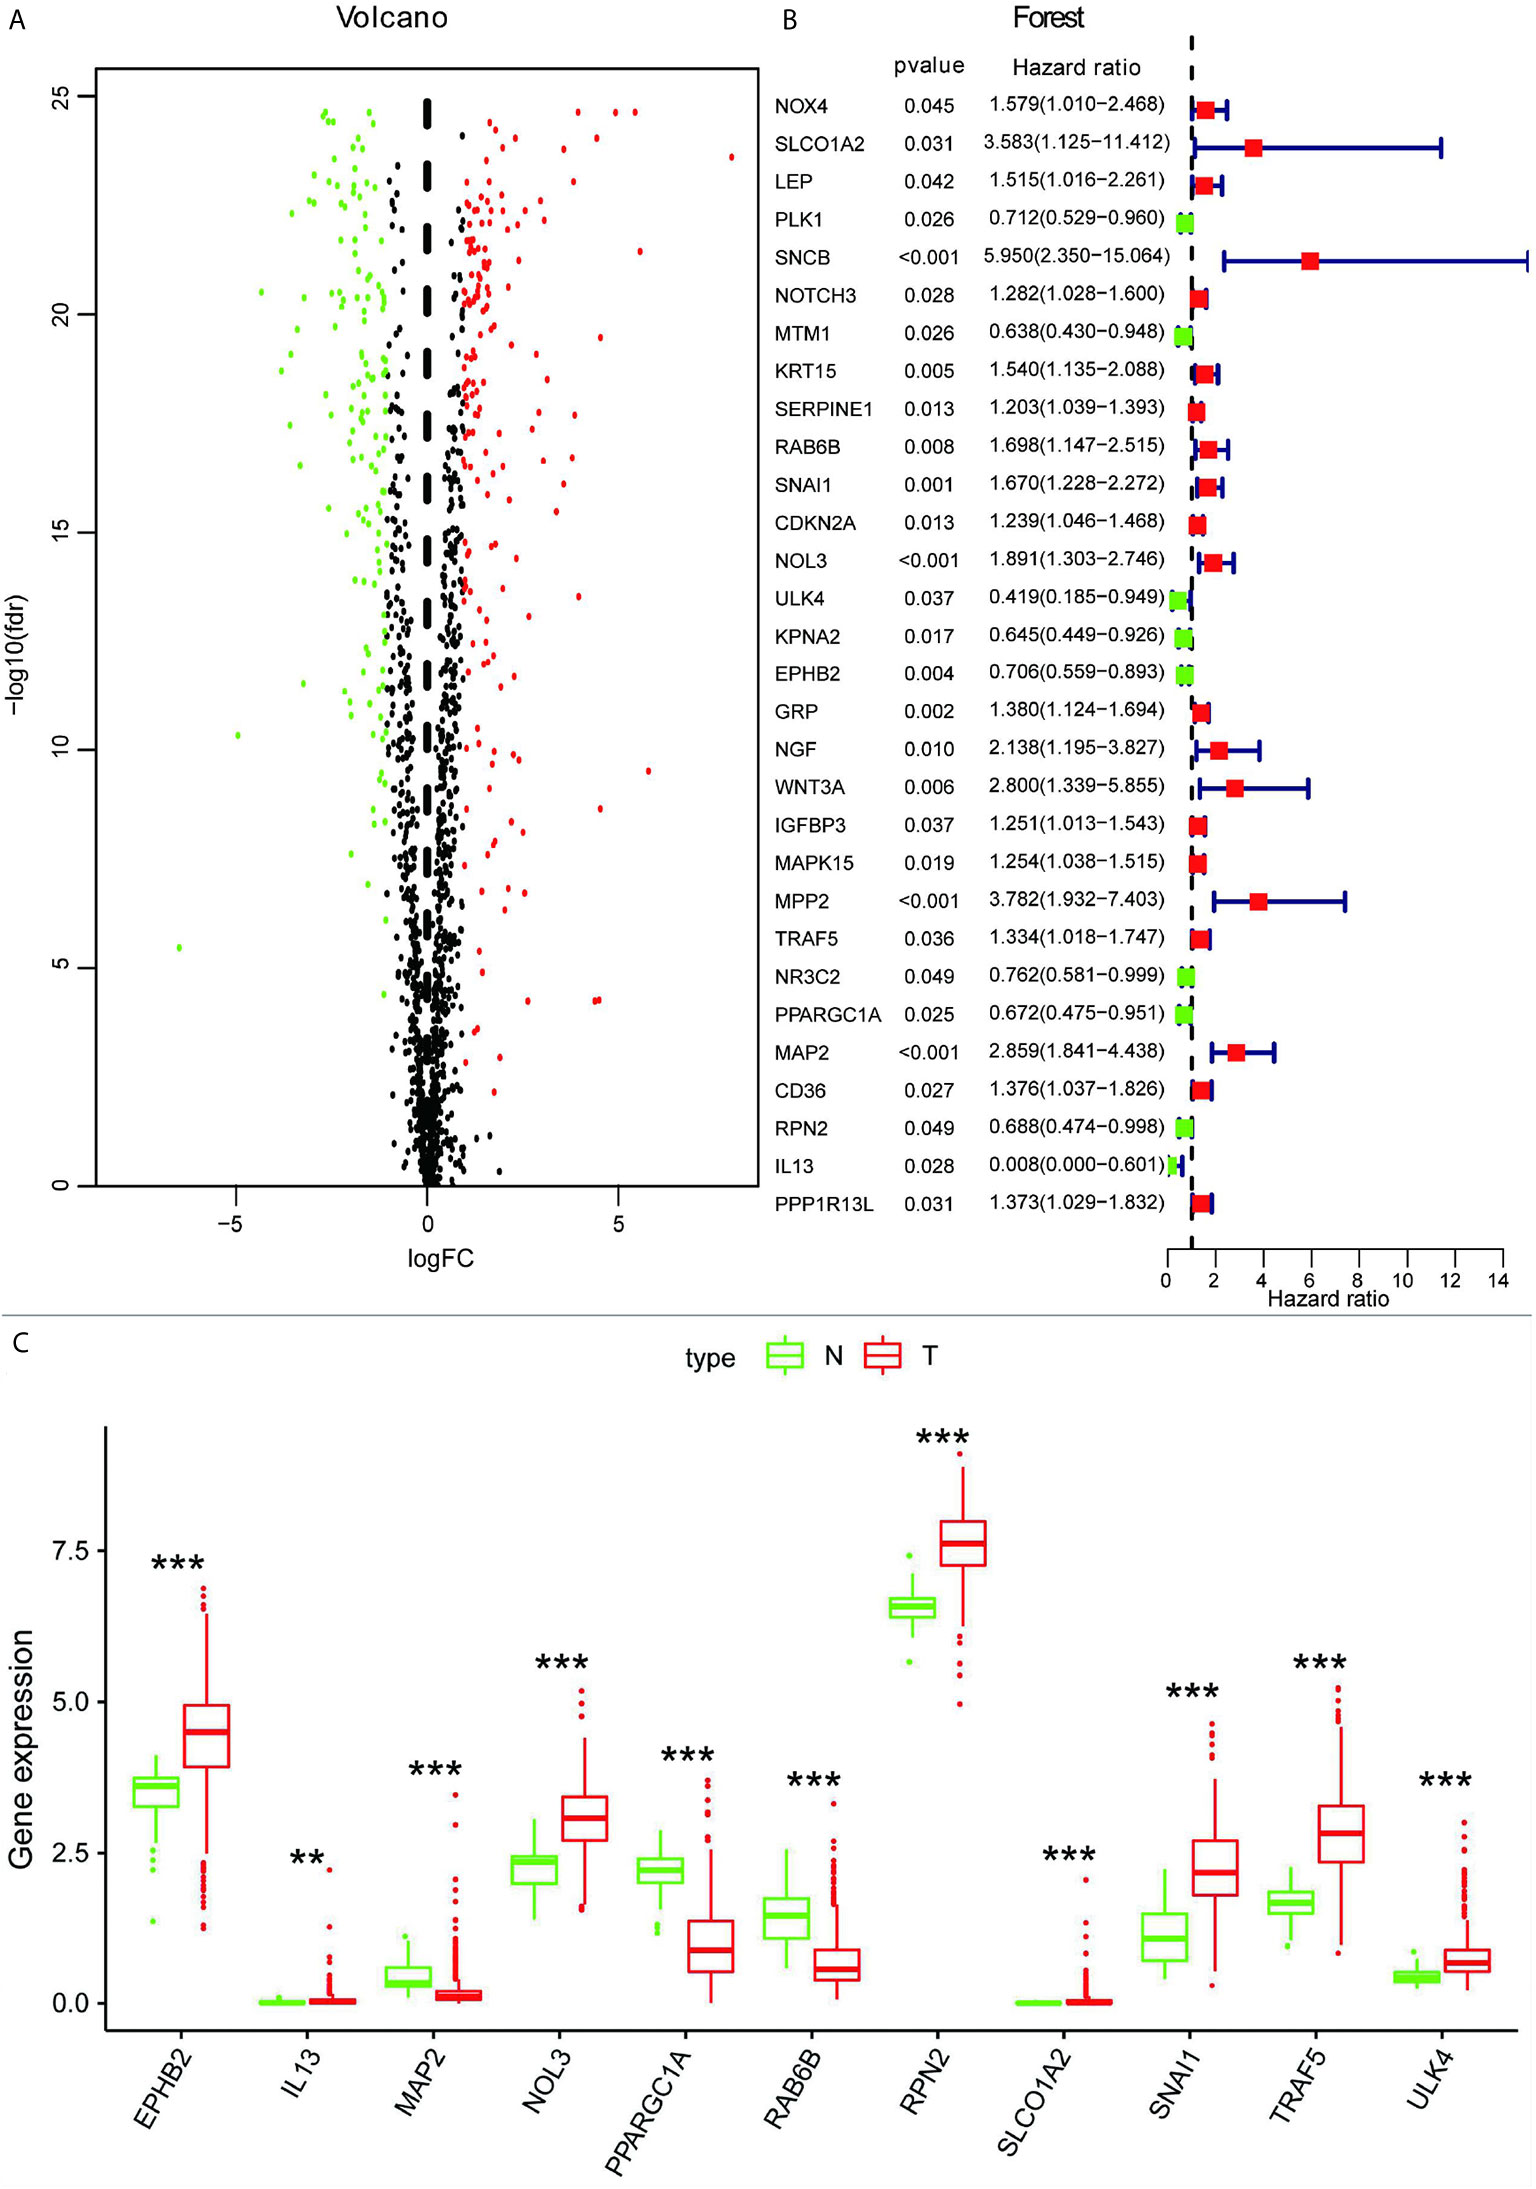
Figure 1 (A) Volcano map of autophagy-associated DEGs. (B) Screening of autophagy-associated genes associated with the prognosis of CRC by univariate Cox analysis. (C) Box plot showing expression of 11 autophagy-associated genes in normal tissues and CRC. **p < 0.01, ***p < 0.001.
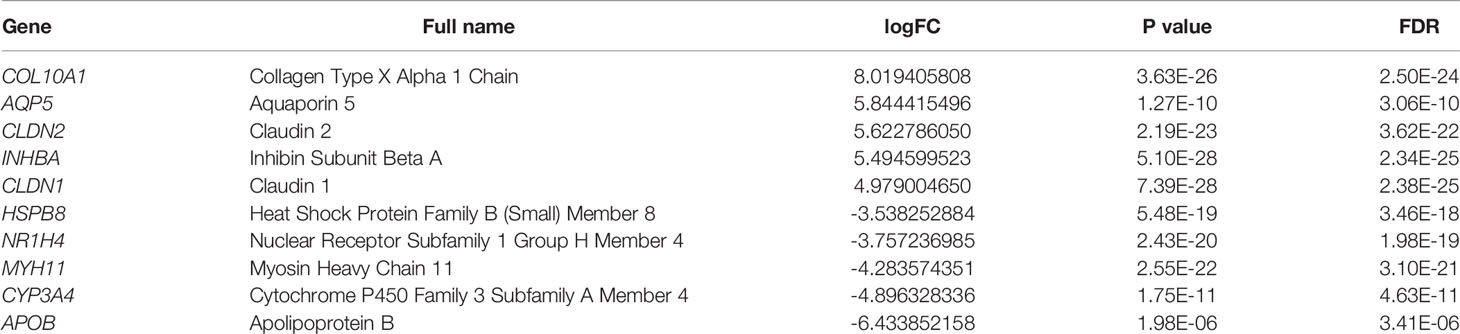
Table 1 Top five autophagy-associated genes significantly upregulated and downregulated in CRC.
To further understand whether autophagy-associated DEGs were associated with the survival of CRC patients, we obtained 30 prognosis-associated genes by univariate Cox analysis (Figure 1B), which were screened and modeled by further multivariate Cox analysis (Table 2). Finally, a box plot was used to show the expression of genes used to build the model in normal and CRC tissues (Figure 1C).
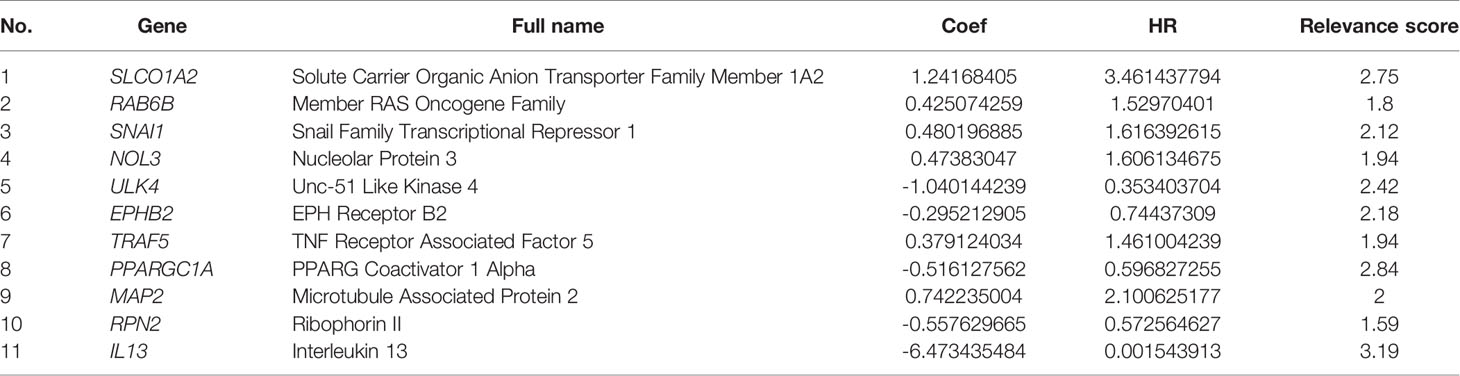
Table 2 Construction of 11 autophagy-associated genes for prognosis.
Based on the analysis results, the median value of the risk score was determined. According to the median value, all samples were classified into high- and low-risk groups. The analysis results were visualized and a distribution map of the risk score was drawn. Figure 2A shows the probability distribution of the risk score. Red points represent samples of the high-risk group, and green points represent samples of the low-risk group. Figure 2B presents the distribution of risk scores and survival time. The ordinate is the survival time (in years), the red points denote dead cases, and the green points denote alive cases. Survival analysis of risk scores showed significant statistical differences between the two groups (p = 1.277e-07) (Figure 2C). The results of KM survival analysis of the 11 autophagy prognostic genes in the model indicated that EPHB2, NOL3, and SNAI1 were relevant to the survival of patients with CRC (Figures 3A–C). According to the prognostic model, the survival rates of the high- and low-risk groups were predicted (Table S1). The 5-year survival rate of CRC patients in the low-risk group was approximately 0.738, with a 95% confidence interval (CI) of 0.618-0.881. The 5-year survival rate of CRC patients in the high-risk group was about 0.477 with a 95% CI of 0.365-0.623. Univariate and multivariate independent prognostic analyses uncovered that the risk score for this prognostic model was an independent prognostic factor (p < 0.001) (Figures 2D, E). The AUC values for the 1-year, 3-year, and 5-year ROC curves were 0.764, 0.751, and 0.729, respectively (Figures 3D–F). Finally, the C-index was applied to evaluate the prediction ability of the model. The C-index is the proportion of all patient pairs in which the predicted consequences are in agreement with the practical consequences. The C-index of the prognostic model was calculated to be 0.734 (standard error = 0.028). In summary, the above results show that the model has a moderate accuracy.
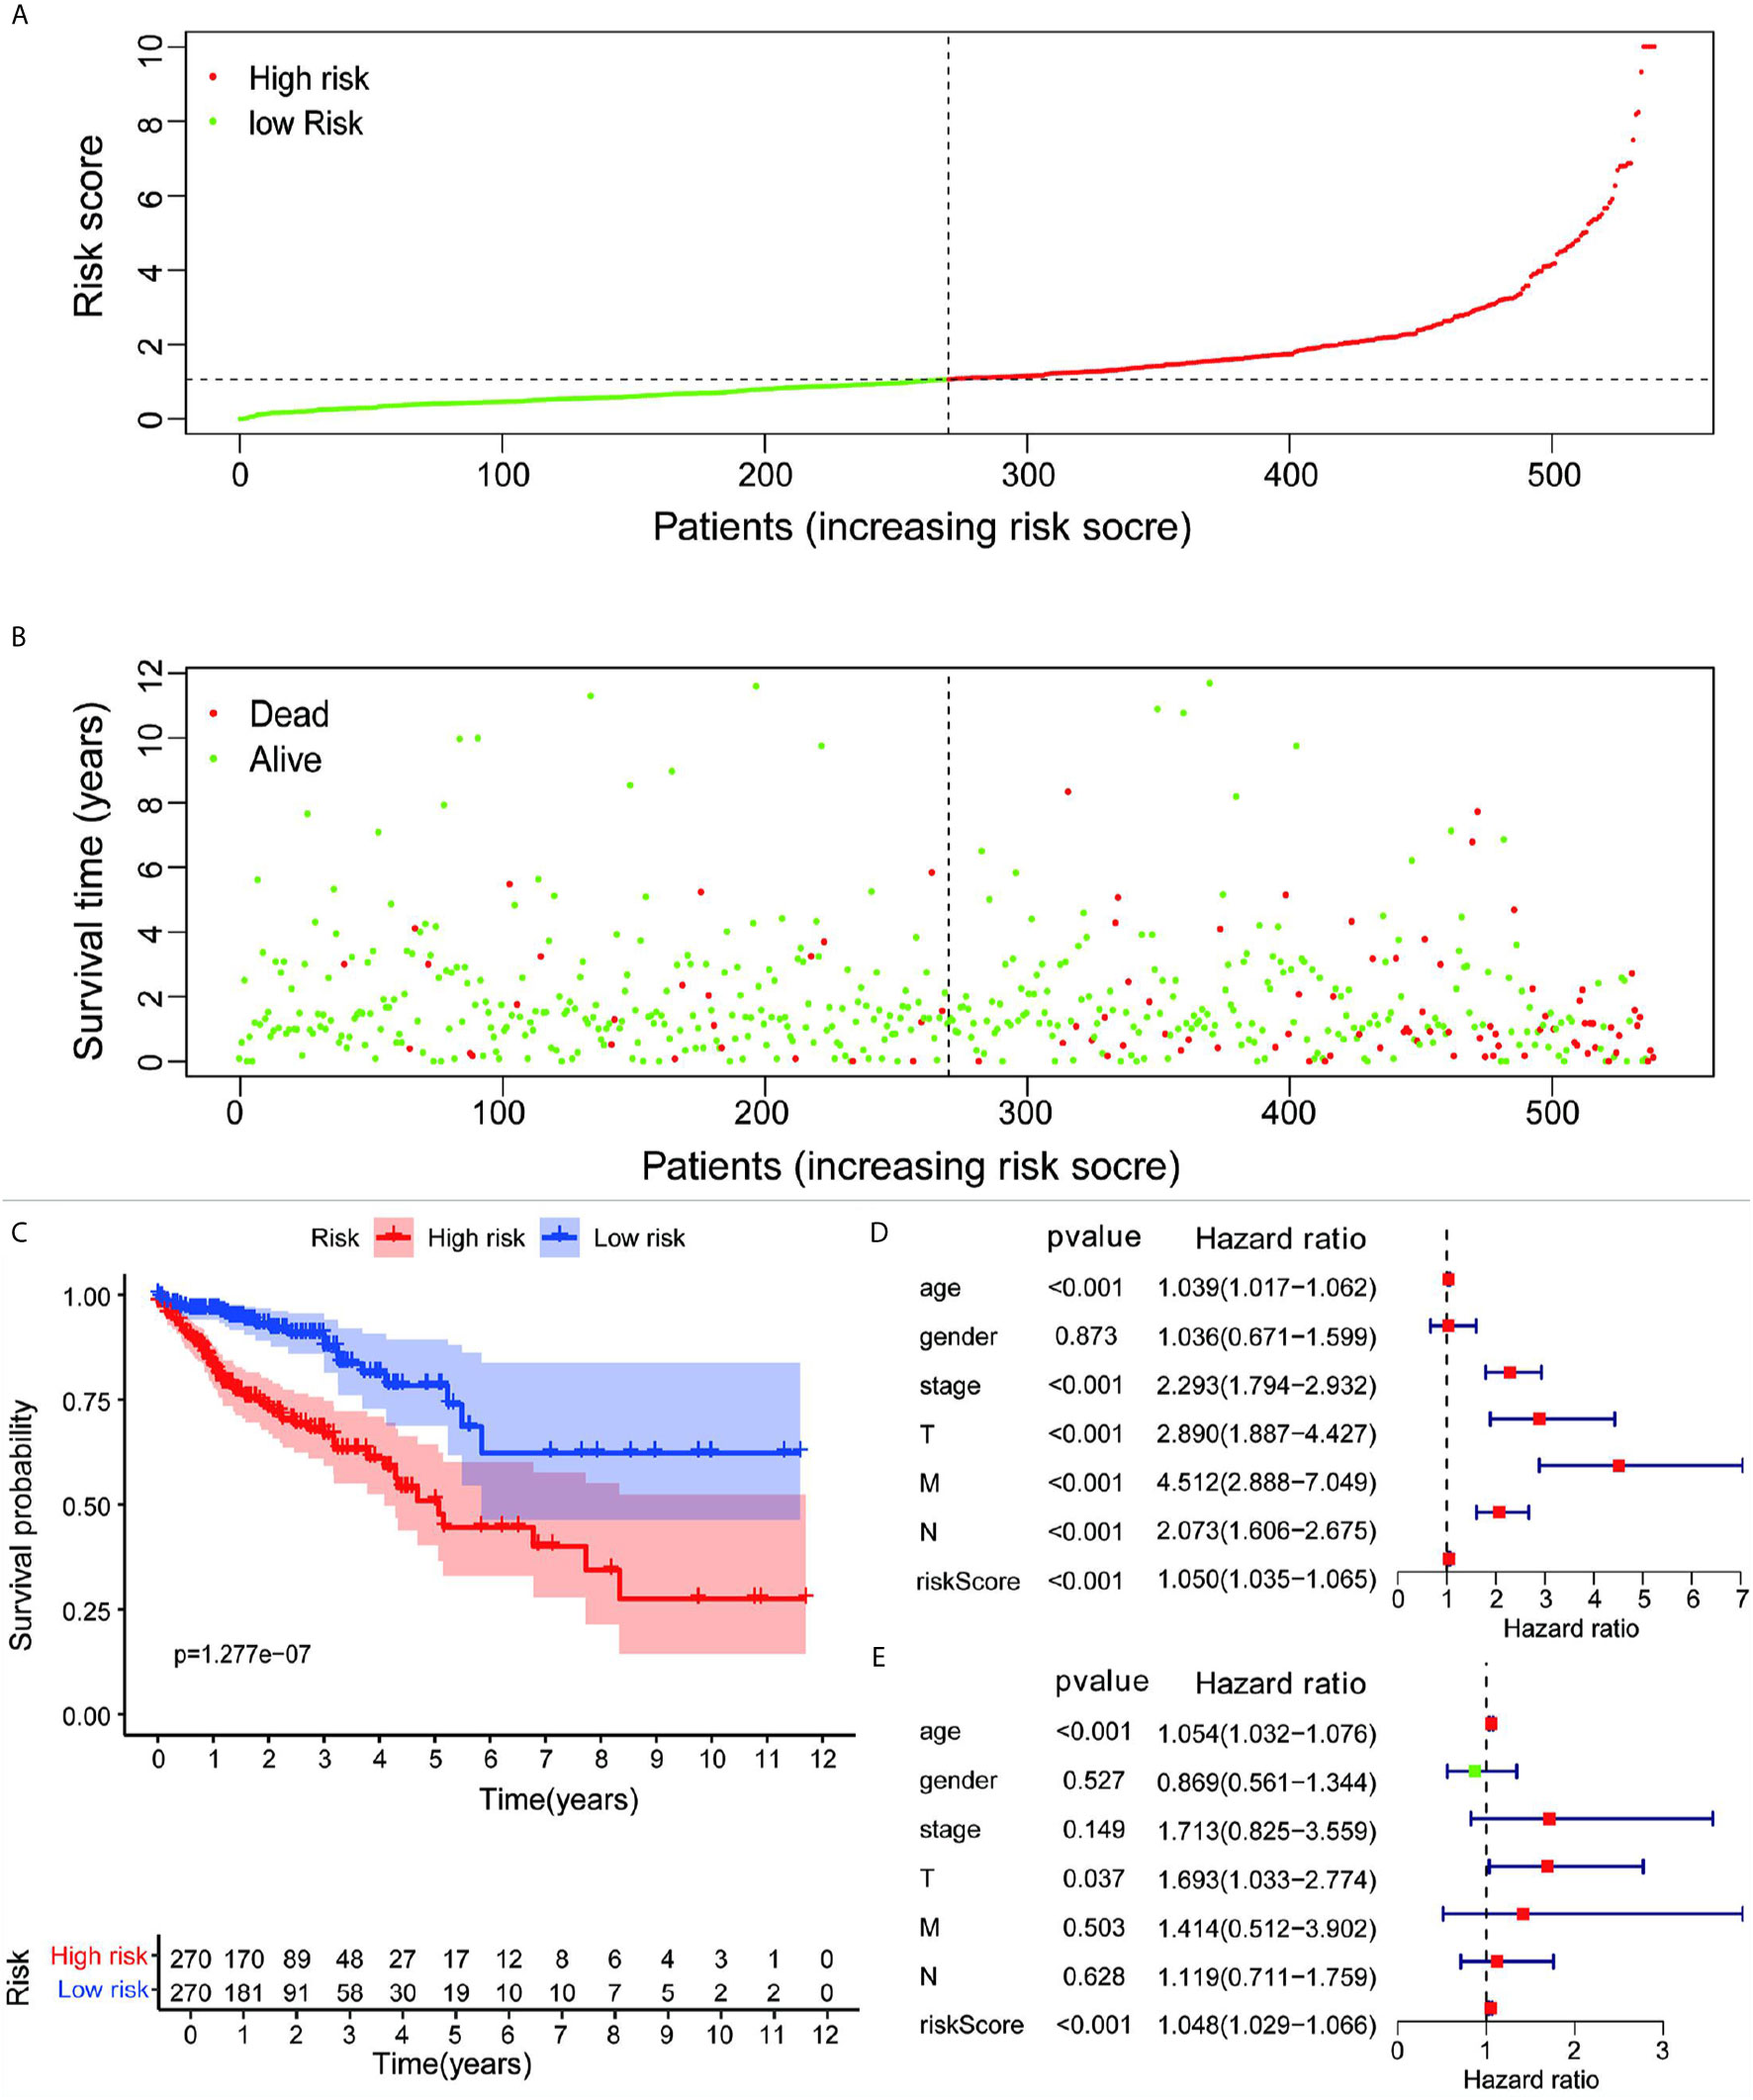
Figure 2 (A) Risk scores for all samples from clinical data. (B) Distribution of risk scores and survival time of patients. (C) KM assessment of survival time for samples from TCGA clinical data using the autophagy prognostic model. Forest plot of (D) univariate and (E) multivariate independent prognostic analysis of the model.
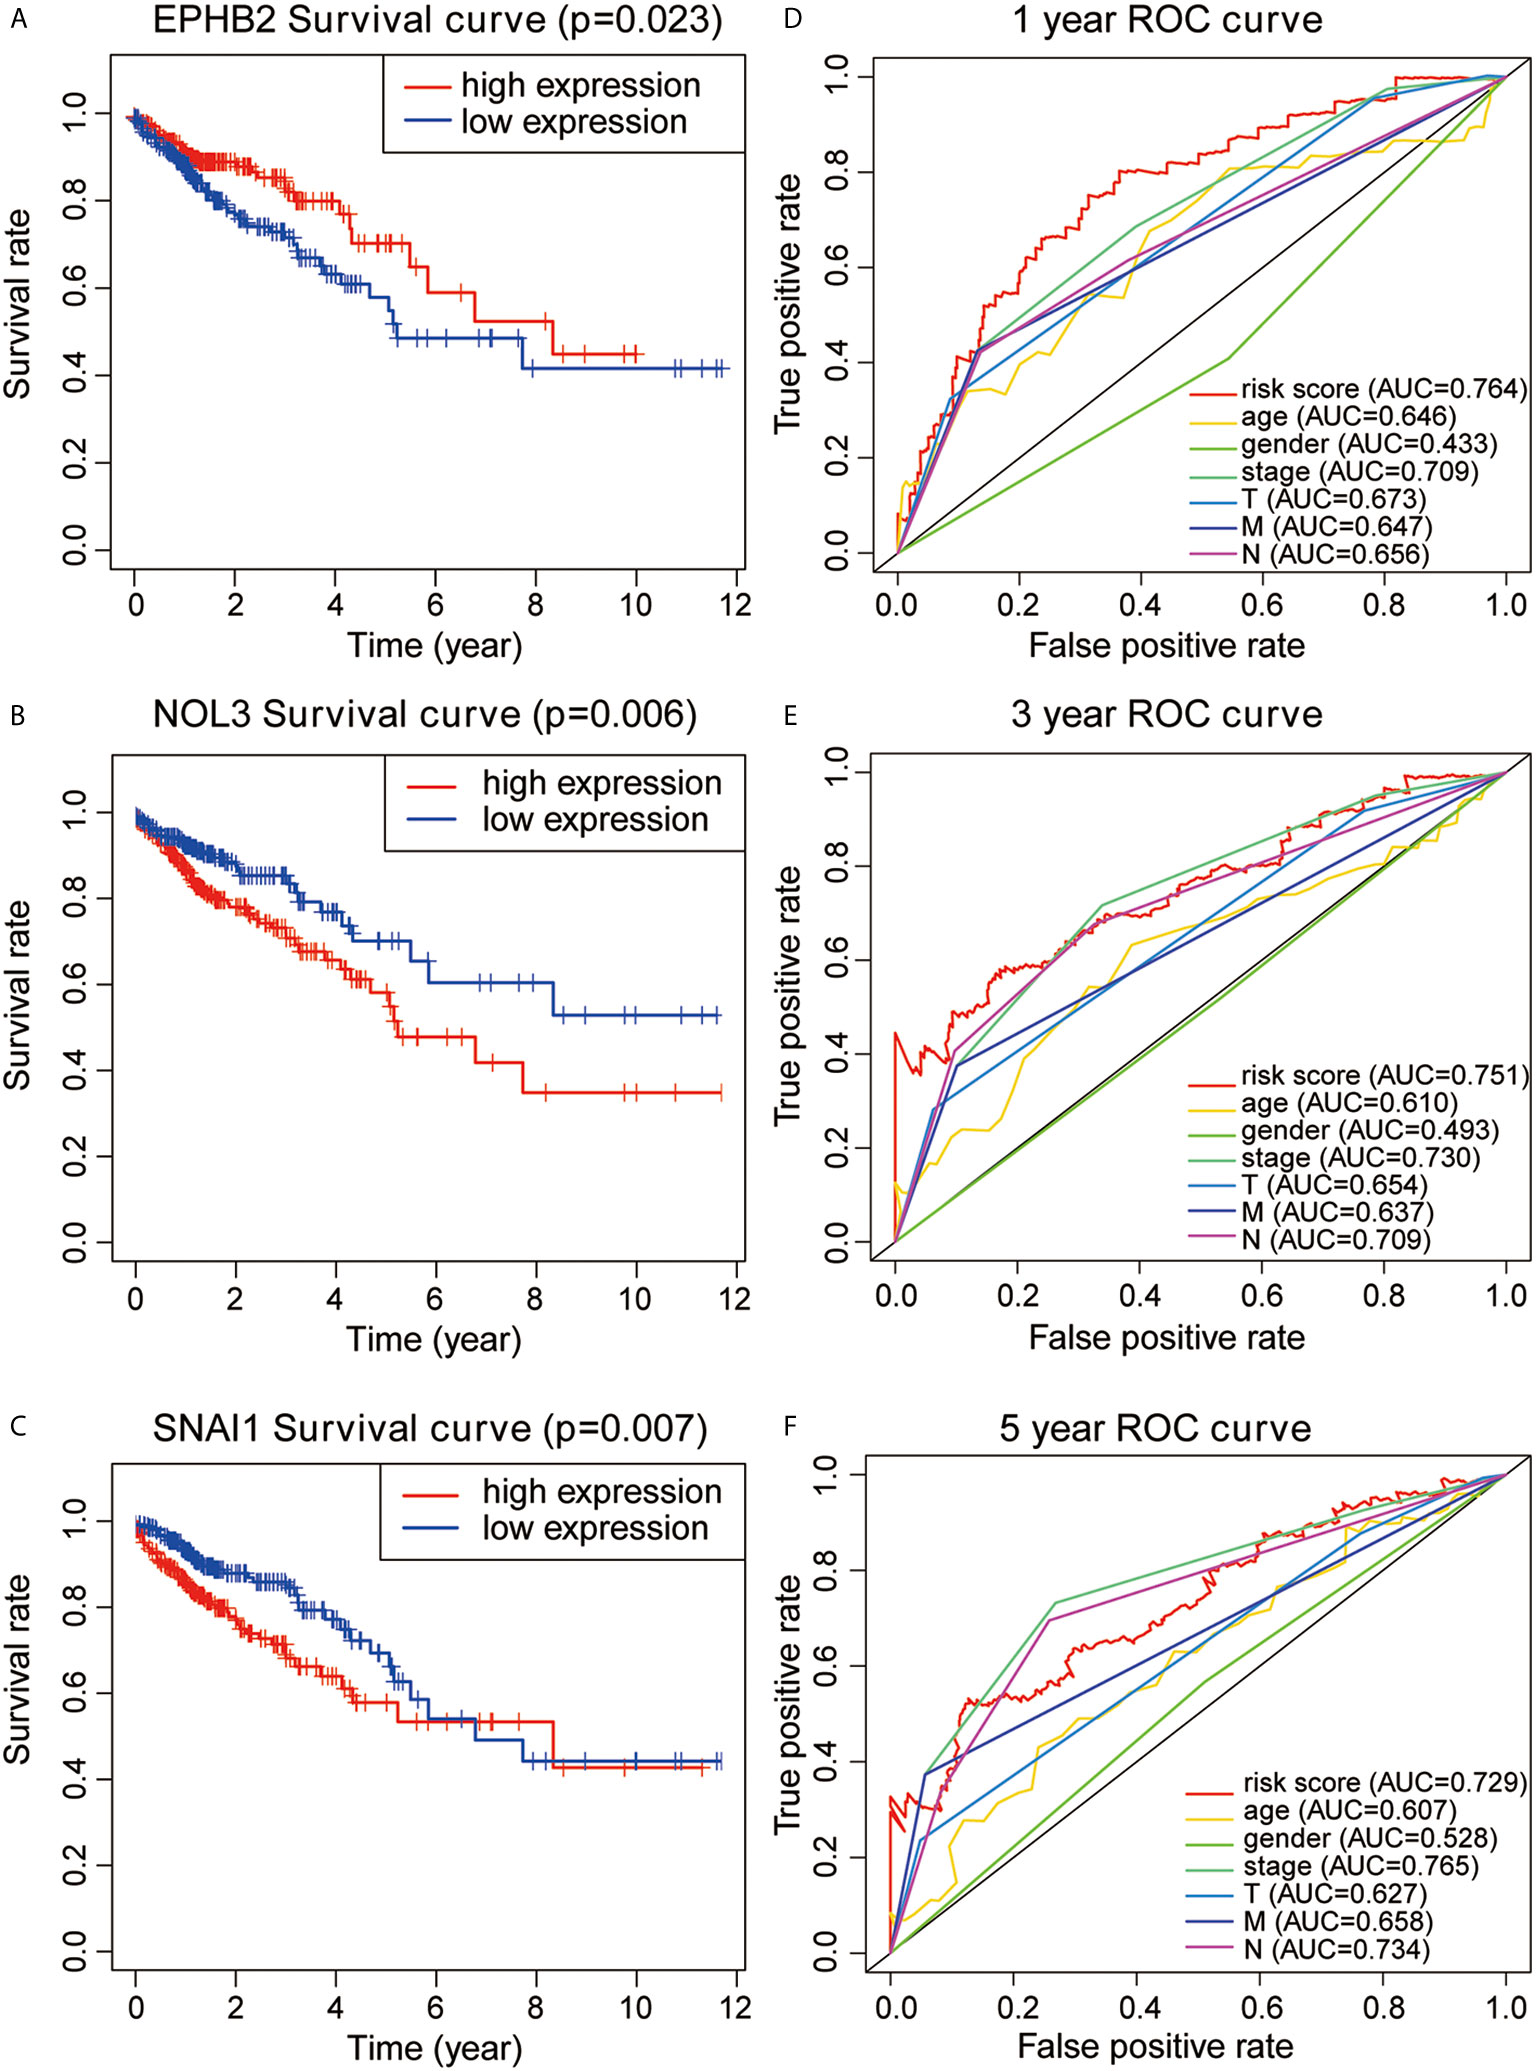
Figure 3 (A–C) KM survival analysis for EPHB2, NOL3, and SNAL1. (D–F) 1-year, 3-year, and 5-year ROC curves and AUC based on the autophagy prognostic model.
EPHB2, NOL3, and SNAI1 were highly expressed at the protein level (Figure 4) and cellular level (Figures 5A–C), which were consistent with the data obtained in TCGA. The most upregulated expressions of EPHB2, NOL3, and SNAI1 in the nine common CRC cell lines were SW620, HT29, and CACO2, respectively (Figures 5D–F).
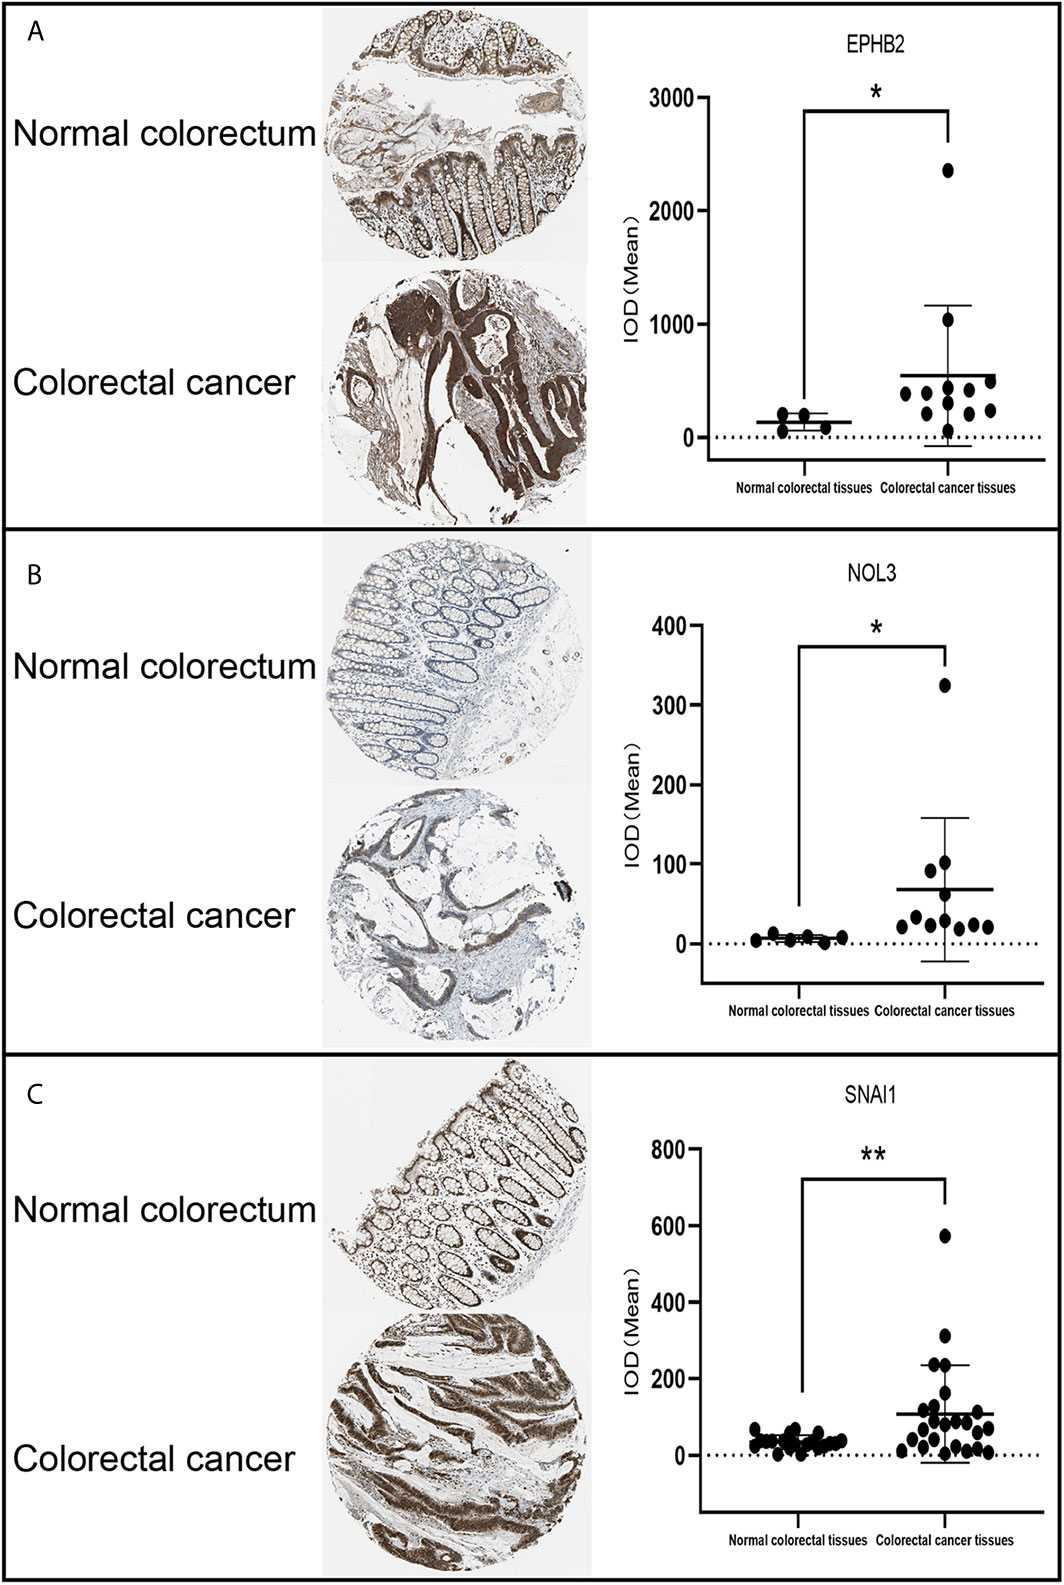
Figure 4 IHC analysis of EPHB2 (A), NOL3 (B), and SNAI1 (C) in CRC tissues. *p < 0.05, **p < 0.01.
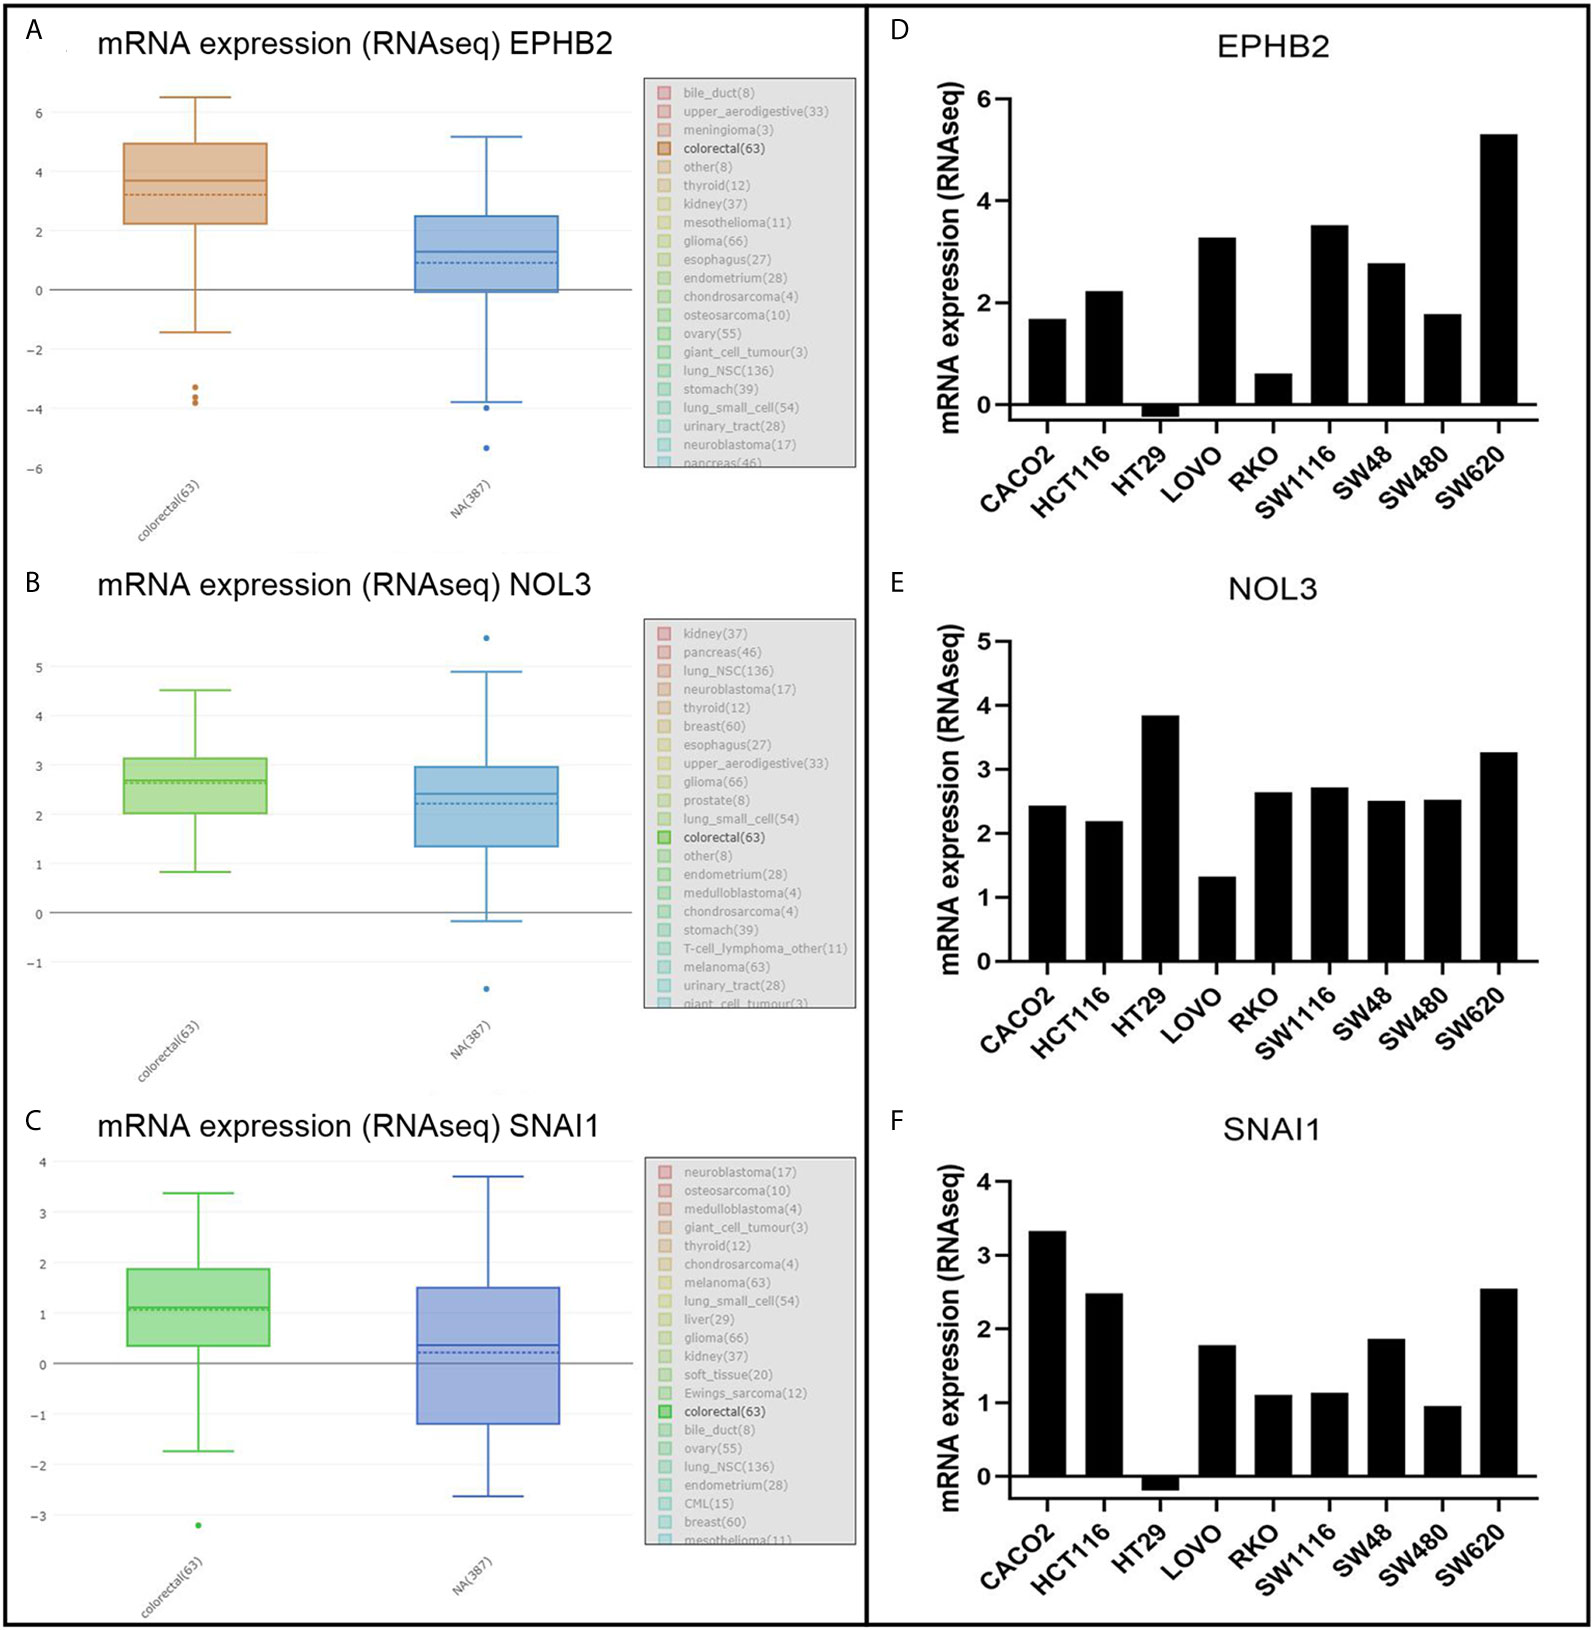
Figure 5 mRNA analysis of EPHB2 (A, D), NOL3 (B, E), and SNAI1 (C, F) in CRC cell lines.
According to the GSEA analysis, the high-risk group was mainly associated with the Notch, VEGF, WNT, MAPK, and TGF-β signaling pathways, which are tumor-related pathways (Figure 6A; Table 3). The low-risk group had a negative correlation with DNA replication, RNA degradation, cell cycle, mismatch repair (MMR), peroxisome, and glutathione metabolism, which are mainly involved in cytoprotective response (Figure 6B; Table 3). GO analysis revealed that the primary biological processes of the target genes of the model included mRNA processing, RNA splicing, and regulation of mRNA metabolic process (Figure 7A). KEGG analysis revealed that the major enriched pathways included spliceosome, RNA transport, mRNA surveillance pathway, and ribosome biogenesis in eukaryotes (Figure 7B). These pathways are mainly concentrated in the processes of splicing and metabolism of mRNA.
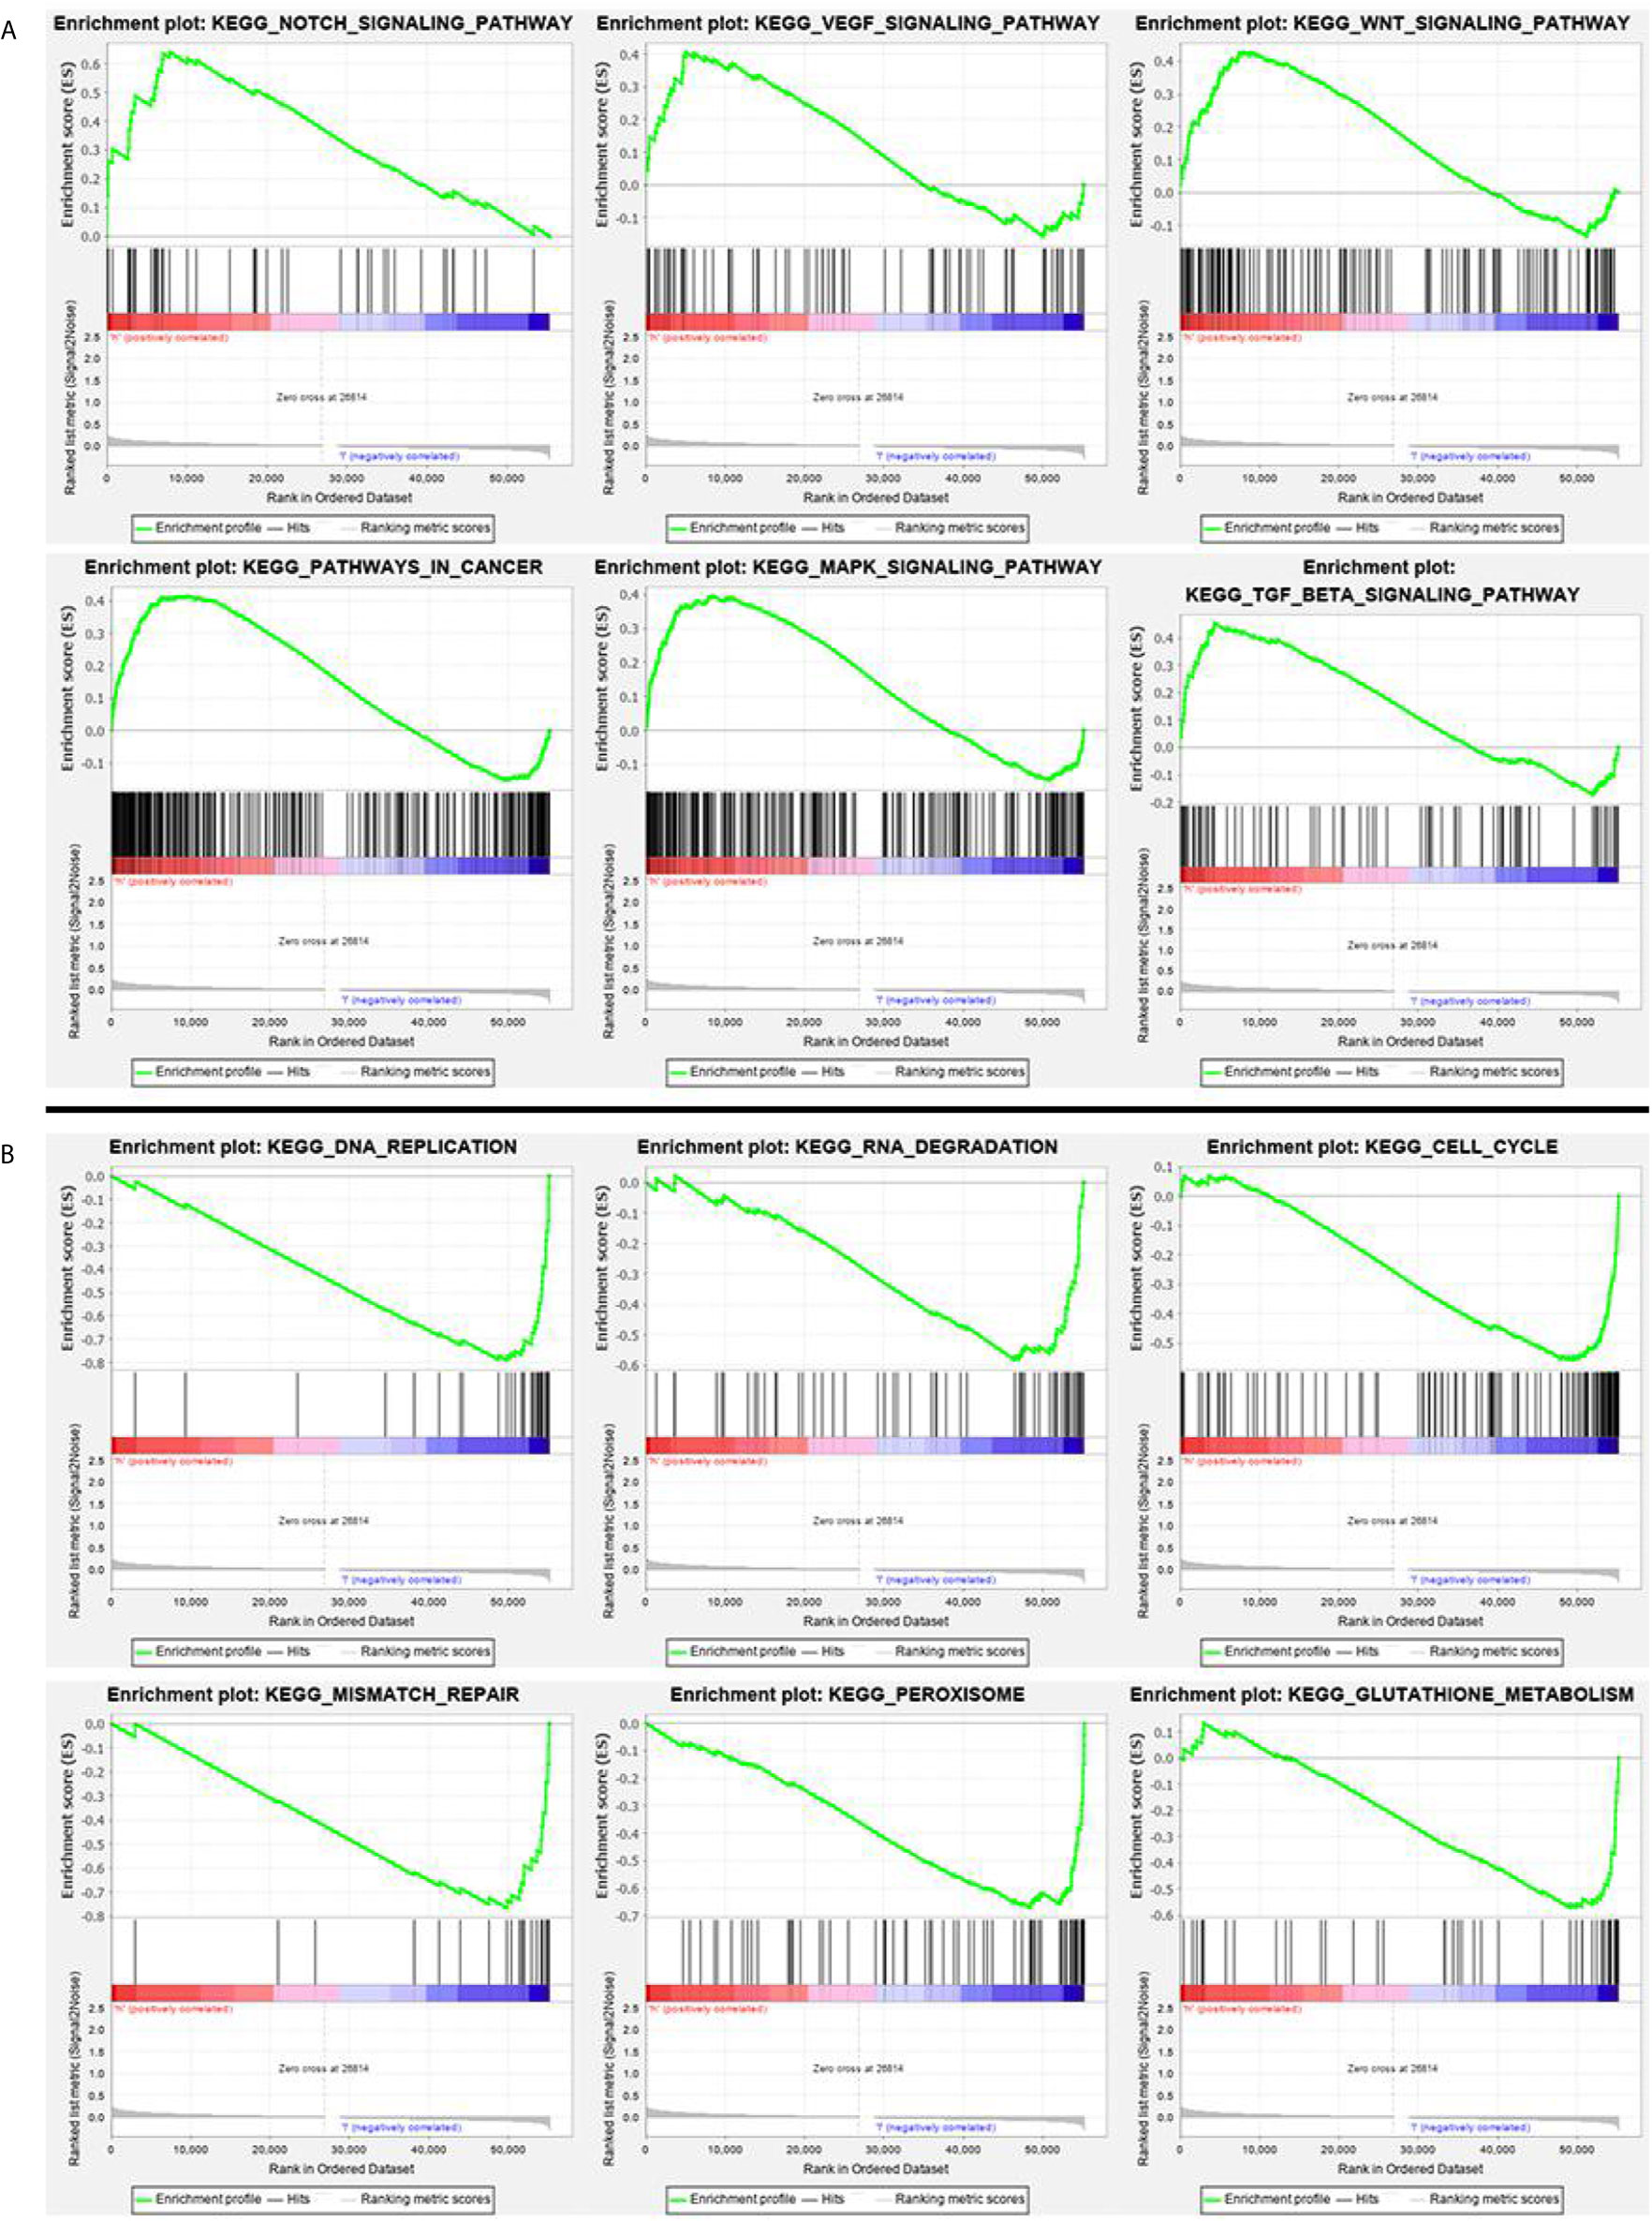
Figure 6 (A) GSEA analysis of main enriched pathways in the high-risk group. (B) GSEA analysis of main enriched pathways in the low-risk group.
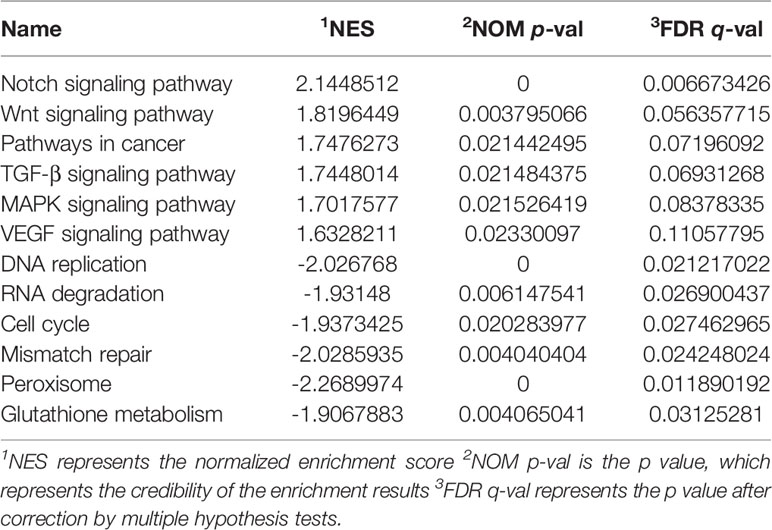
Table 3 Display of GSEA enrichment results in high and low risk groups.
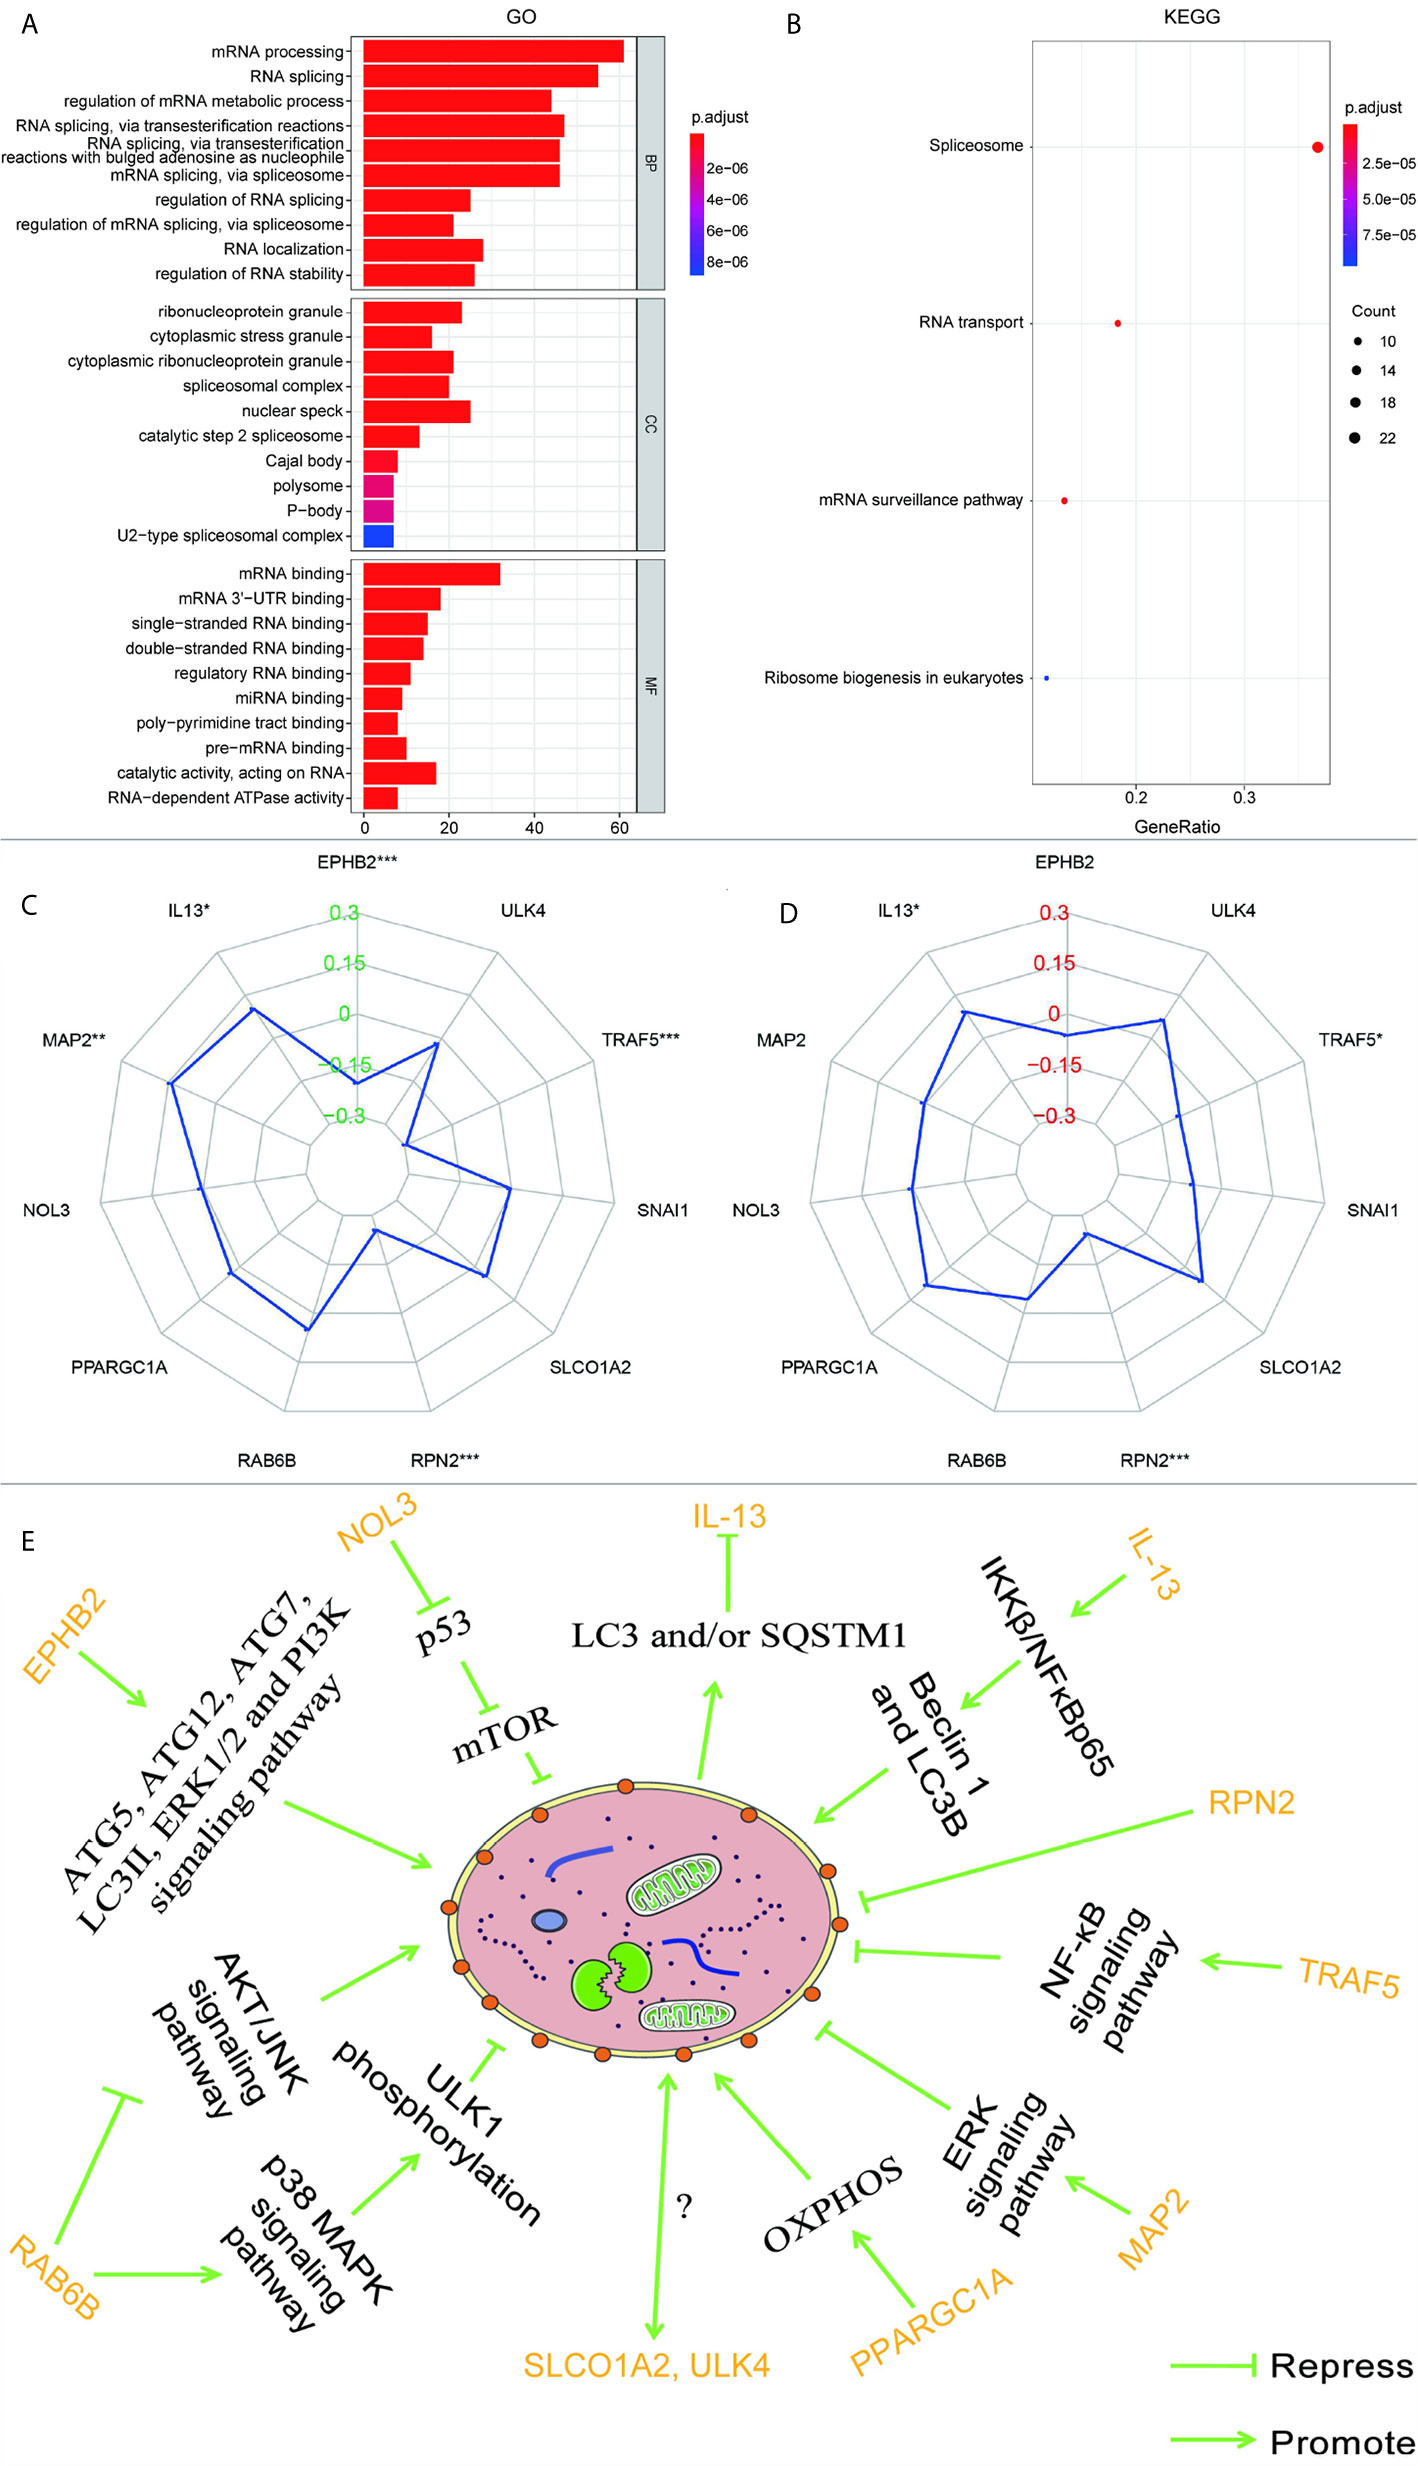
Figure 7 (A) GO analysis and (B) KEGG analysis of the target genes of 11 autophagy-associated genes in the model. The radar maps of 11 autophagy-associated genes are analyzed with MSI (C) and TMB (D), respectively. Regulatory relationships between the 11 genes in the model and autophagy (E). *p < 0.05, **p < 0.01, ***p < 0.001.
Based on the previous data, a correlation between MMR pathway and low-risk groups was discovered, so we speculate that the expression of these autophagy-associated genes may be related to MSI. A previous report has shown that high TMB in CRC is usually related to MSI and mismatch repair defects (19). Therefore, we also analyzed the relationship between these autophagy-related genes and TMB. As can be seen from Figures 7C, D, EPHB2, IL-13, MAP2, RPN2, and TRAF5 are correlated with MSI, EPHB2 (R = -0.204), RPN2 (R = -0.255), and TRAF5 (R = -0.295) are negatively correlated with MSI, while IL-13 (R = 0.102) and MAP2 (R = 0.141) are positively correlated. IL-13, RPN2, and TRAF5 were correlated with TMB, RPN2 (R = -0.244) and TRAF5 (R = -0.094) were negatively correlated with TMB, while IL-13 (R = 0.093) was positively correlated with TMB.
CRC is caused by abnormal cell growth in the colon or rectum. Increasing numbers of studies confirm the importance of autophagy in CRC at various stages (20, 21). In the current work, we used bioinformatics analysis to identify autophagy-associated genes with statistically significant differences in expression in CRC.
As the early symptoms of CRC are not obvious, the prognosis of CRC patients is poor once CRC progresses (22). Hence, the identification of effective prognostic markers is important to guide assessment and treatment of CRC patients. Huang et al. constructed a prognostic model that has been confirmed by experiments to have a clear correlation with CRC, and the marker based on multi-RNA had a higher prognostic accuracy than TNM staging (23). Zhou et al. identified five autophagy genes to establish an early recurrence classifier. The report shows that autophagy score can be used to predict the postoperative survival rate of CRC (24). Qian and his colleagues constructed a competitive endogenous RNA (ceRNA)-ceRNA interaction network mediated by autophagy in CRC by integrating the systematic expression profiles of long non-coding RNA and mRNA (25). Some people even screened the autophagy-related non-coding RNA, for network construction or prognostic model construction based on the characteristics of autophagy genes (26). Most of the above studies used the human autophagy database to obtain a small number of autophagy-related genes, in order to identify biomarkers related to the prognosis of CRC. However, these studies ignored the potential key autophagy-related genes that have not been paid attention to, which is of great significance in mining the prognosis, occurrence, and development of CRC. As autophagy affects the progression and prognosis of CRC and may even lead to chemotherapy resistance, we established a prognostic model of CRC based on 1,511 autophagy-associated genes. It was a new simple prognostic model based on the listed genes (SLCO1A2, RAB6B, SNAI1, NOL3, ULK4, EPHB2, TRAF5, PPARGC1A, MAP2, RPN2, and IL-13) and established using univariate Cox analysis and multivariate Cox analysis. ULK4, EPHB2, PPARGC1A, RPN2, and IL-13 had hazard ratio (HR) values less than 1 and were thus good prognostic factors, whereas SLCO1A2, RAB6B, SNAI1, NOL3, TRAF5, and MAP2 with a HR greater than 1 were considered poor prognostic factors. The 5-year survival rates of CRC patients in the high-risk group and low-risk group were 73.8% and 47.7%, respectively. These results indicate that the survival rates of patients with high-risk scores were markedly lower than those of patients with low-risk scores. We deduced the following rule from the risk curve: the higher the risk score, the greater the number of deaths and the larger the proportion of death. Independent prognostic analysis revealed that the risk value obtained from the autophagy prognostic prediction model was an independent prognostic factor. Higher risk scores were correlated with poorer patient prognosis.
According to the KM survival analysis, the autophagy-associated genes EPHB2, NOL3, and SNAI1 in the prognostic model were statistically significant (p < 0.05). EPHB2 encodes the receptor tyrosine kinase transmembrane glycoprotein family member EPHB2, which engages in lots of cellular processes including movement, division, and differentiation (27). EPHB2 functions in the gastrointestinal homeostasis and is an essential factor regulating the classification of mature epithelial cells (28). EPHB2 primarily generates in epithelial cells and is the highest level of EPH receptor in the ordinary intestine (29). Studies in human breast cancer have shown that the expression of EPHB2 can induce the increase of ATG5/12 and LC3II, thereby inducing autophagy (26). Based on experimental results, Kandouz and colleagues propose that EPHB2 may affect autophagy via the ERK1/2 and PI3K pathways (27, 30). Moreover, they observed LC3 accumulation and transformation from LC3I to LC3II in EPHB2-upregulated cells. Knock-out of the autophagy regulatory genes ATG5/7 can significantly reduce cellular death induced by EPHB2. Some researchers have found that reducing tyrosine phosphorylation of EPHA1 and EPHB2 induces autophagy in CRC cells (28). There are also reports that the expression of EPHB2 is reduced during the development of CRC tumors, and its high expression may inhibit the development of tumors and reduce the invasion of cancer cells (31). This is consistent with the relationship between the low expression of EPHB2 and the poor prognosis of CRC in our survival analysis. EPHB2 is a tumor suppressor that affects the progression of CRC by acting on autophagy (27).
On the contrary, according to the results of our survival analysis, high expression of NOL3 was connected to poor prognosis in CRC. NOL3 encodes an anti-apoptotic protein that is involved in pathways including apoptosis and autophagy, apoptosis regulation, and signal transduction (32). The caspase recruitment domain (CARD) of NOL3 can downregulate the activity of p53 via CARD–CARD interaction (32). p53 is a well-known tumor suppressor protein (33). Some research indicates that p53 may induce autophagy whether it is inhibited or activated, and current data suggest that p53 promotes cell autophagy by inhibiting the mechanistic target of rapamycin kinase (mTOR) (34). SNAI1 participates in the stimulation of epithelial-to-mesenchymal transition (EMT) and exerts a vital role in tumor drug resistance, cellular proliferation inhibition, survival, and movement (35). SNAI1 is a pivotal regulator of EMT and controls CRC invasion and proliferation (36). Recent research suggests that autophagy degrades SNAI1 in cancer cells via LC3 and/or (sequestosome 1) SQSTM1, thereby inhibiting tumor progression (30).
Furthermore, the other eight genes in the model are closely related to the tumor. Some studies suggest that RAB6B, one of the RAS oncogene family members, functions in retrograde transport at the Golgi complex level or in retrograde transport in nerve cells (37). Silencing RAB6B in gastric cancer inhibits the AKT/JNK signaling pathway, suppressing gastric cancer cell proliferation, and impels apoptosis by furthering the p38 MAPK pathway (38). Overexpression of Caveolin-1 has been shown to reduce paclitaxel resistance of osteosarcoma cells via weakening autophagy, and the AKT/JNK pathway is an effective regulator for autophagy (39, 40). Furthermore, p38 MAPK can inhibit autophagy and promote microglial inflammation via phosphorylating unc-51-like autophagy activating kinase 1 (ULK1) (41), and the stimulation of the p38 MAPK pathway via osteopontin can advocate malignant change in CRC, and suppress autophagy (42).
SLCO1A2 is the gene encoding organic anion-transporting polypeptide 1A2 (OATP1A2), which belongs to the organic anion transport polypeptide (OATP) subunit of the superfamily of drug transporters. OATP1A2 is mainly found in epithelial tissue and can affect the distribution of many drugs, xenobiotics, and endophytes (43). OATP1A2 dysfunction may damage the pharmacokinetics and traits of a drug, thereby affecting the effectiveness of the treatment, and it may also hinder the absorption of endogenous organisms to the target tissue (43). OATP1A2 is regulated by AMPK, which has an impact on its membrane target, internalization, reuse, and degradation processes (44). Some researchers found that OATP1A2 could not be detected in the large intestine of normal controls when conducting intestinal transport protein research, but in another study, OATP1A2 was found to be widely expressed in patients with CRC liver metastases (45, 46). Therefore, OATP1A2 could be an influential factor altering the effect of oral drug treatment in CRC. As shown in Figure 2, the expression level of the SLCO1A2 tumor group was higher than that of the normal group. The interaction between autophagy and drug transporters is reported to be related to drug resistance (47). For example, high expression of the transporter ATP binding cassette subfamily G member 2 can promote autophagy, and the activation of autophagy greatly increases the survival rate of cells (48). TRAF5 regulates the stimulation of the typical nuclear factor kappa B (NF-κB) pathway (49, 50). Most investigations have found that activation of the NF-κB pathway can inhibit autophagy (51).
RPN2 is tremendously overexpressed in CRC and promotes cell proliferation by regulating the glycosylation state of epidermal growth factor receptor (52, 53). RPN2 has been manifested to repress autophagy in liver cancer (54). IL-13, one of the autophagy genes used to construct the model, is an important T cell-derived cytokine that induces EMT in CRC cells (55). In the airway epithelium, IL-13 can activate autophagy and affect cell secretion (56). Besides, in breast carcinoma, IL-13 can regulate the expression of Beclin 1 as well as light chain 3 beta (LC3B), increasing the formation of autophagosomes via IKKβ/NFκBp65 (57). The protein encoded by PPARGC1A is a transcriptional co-activator that modulates genes involved in energetic metabolism (58). This protein cooperates with a variety of transcription elements to enhance mitochondrial oxidative phosphorylation (OXPHOS) under conditions of high energy demand (58). In various malignant tumors, including CRC, ascendant expression of PPARGC1A is strongly related to metabolism and advances the growth, distant spread, and chemical resistance of tumor cells (58). Overexpression of PPARGC1A increases the amount of the OXPHOS protein complex, accelerates autophagy, and activates tumor development in breast cancer cells (59). In melanoma cells, downregulating PPARGC1A/PPARGC1B results in decreased OXPHOS activity, creating an acidic tumor environment and triggering autophagy (60). MAP2 is mainly involved in neurite outgrowth and neuronal migration during neuronal development (61, 62). However, there have been few studies of MAP2 in non-nerve cells (61). Some researchers have observed that a high level of MAP2 is absent from normal mucosa in aggressive oral neoplasm (61). MAP2 interacts with growth factor receptor-bound protein 2 to enhance the ERK signaling pathway (63). In RAS-driven cancers (including CRC), it has been demonstrated that RAF/MEK/ERK inhibition can cause cancer-cell-protective autophagy (63). ULK4 belongs to a member of the unc-51-like serine/threonine kinase family functioning in the neuron (64). Lebovitz et al. investigated more than 200 human autophagy-related signatures and cancer-associated changes in the DNA sequence as well as RNA expression, and used sequence data from TCGA to examine their relationships with multiple cancer types and patient survival outcomes (65). ATG7 and ULK4, which are core autophagy genes, showed effective selection of mutations in renal cancer and endometrial cancer, respectively, indicating that the expression and mutation of ULK4 may be closely related to autophagy (65). The above data demonstrate that the 11 genes used to build the model are all involved in autophagy to a greater or lesser extent, as illustrated in Figure 7E. However, owing to a lack of research, the mechanisms by which ULK4 and SLCO1A2 interact with autophagy remain unclear. They appear to be key genes regulating the autophagy pathway in CRC; however, more experiments are needed to confirm this.
Some signaling transduction pathways are known to be abnormally activated during the occurrence and progression of CRC, in particular, Notch, VEGF, WNT, MAPK, and TGF-β signaling, and these pathways cooperate with cell autophagy to determine the fate of the cell (66–69). Our GSEA enrichment analysis showed that the high-risk group with higher mortality than the low-risk group had a mainly positive role in the relevant mechanisms of tumor cells, including the Notch, VEGF, WNT, MAPK, and TGF-β signaling pathways, 11 autophagy associated genes may be related to the biological pathway related to CRC, and its dysfunction may lead to poor prognosis of CRC. While the low-risk group had mainly negative correlations with DNA replication, RNA degradation, cell cycle, MMR, peroxisome, and glutathione metabolism, all of which are normal cell protective responses. A considerable number of studies have concluded that autophagy is a protective mechanism for cancer cells, limiting the response to various therapeutic interventions (70, 71). These results indicate that autophagy is largely based on the interaction with various abnormal signaling pathways to influence the progress of CRC. A large number of studies have proved that the MMR pathway plays an important role in repairing DNA replication errors in normal and tumor cells (72, 73). The deficiency of DNA MMR protein, which determines the microsatellite instability-high (MSI-H), may lead to the accumulation of mutations and the production of new antigens, which may stimulate the anti-tumor immune response (74). Clinical trials have shown that MSI-H status is associated with long-term benefits for patients treated with an immune checkpoint inhibitor. It has been reported that the expression level of autophagy key factor LC3B-II in CRC is higher than that in MSI (75). UVRAG, a key autophagy tumor suppressor, produces truncated mutations when CRC patients have MSI (76). The mutated UVRAG loses its ability to inhibit autophagy and promotes tumorigenesis (76). A recent study report also suggested that autophagy-related genes were expressed differently in an MSI group and microsatellite stability (MSS) group, which suggested that autophagy may be closely related to tumor MSS. According to our analysis of the results, we found that EPHB2, IL-13, MAP2, RPN2, and TRAF5 are related to MSI, and EPHB2 has been experimentally confirmed to be negatively related to MSI-H (77), which is the same as the result of our analysis. From the results, we discovered that RPN2 and TRAF were negatively correlated with TMB and MSI, while IL-13 was positively correlated with TMB and MSI. The correlation between RPN2, TRAF, and IL-13 in TMB and MSI was consistent, which partly explains the consistency with high TMB and high MSI, and suggests that autophagy-related genes may have a key effect on MSI.
At the same time, to further understand the potential mechanism between the 11 autophagy-associated genes of this model and CRC, we analyzed their targeted genes by GO and KEGG. According to Figure 7B, all the targeting genes of the 11 autophagy-associated genes used to construct the prognostic model may be related to RNA splicing. Splicing factors are key regulators of the mRNA alternative splicing (78). Researchers have investigated the expression level of more than 20 splicing factors, meanwhile autophagy was stimulated by hypoxia in oral tumors and found that the serine and arginine rich splicing factor 3 (SRSF3) was considerably downregulated (78). The results show that the splicing factor SRSF3 is a carcinogen in CRC, and the silencing of its expression can induce autophagic death of CRC cells (79). The variable transcripts of Beclin 1 are produced by selective 3’ splicing, and its translation products show reduced activity during starvation-induced autophagy, suggesting that the subtype of splicing may be a negative regulator of autophagy (80). As a proliferation regulatory factor of CRC, splicing factor proline and glutamine rich (SFPQ) can cooperate with peroxisome proliferator activated receptor gamma (PPARγ) (81). PSF gene knockout induces autophagosome generation via suppressing PPARγ (81). In malignant tumor cells, knockdown of the core spliceosome components small nuclear ribonucleoprotein polypeptide E and small nuclear ribonucleoprotein D1 polypeptide resulted in cancer cell death through autophagy rather than apoptosis (82). Consequently, preceding investigations also support our hypothesis that RNA splicing affects the progression of CRC by regulating autophagy. However, the connection between the conservative processes (autophagy and RNA splicing) is not completely clear, and more experiments are needed.
The series of bioinformatics analyses described here show that the autophagy prognostic model had a certain level of accuracy in predicting the prognosis of CRC patients. Nevertheless, more research and clinical evidence are needed to confirm the validity of this model.
In total, 301 DEGs in CRC were identified by bioinformatics analysis. GSEA, GO, and KEGG analyses indicated that autophagy may have an essential function in key signaling pathways of CRC, thereby deepening our understanding of the mechanism by which autophagy participates in the development of CRC. The analysis of the relationship between autophagy-associated genes and MSI and TMB suggests that autophagy may be an important process affecting MSI and TMB. We also established a simple prognostic model using bioinformatics tools. The model was based on screening autophagy-associated genes that were extremely relevant to the appearance and evolvement of cancers. A series of analysis methods were used to assess the predictive capability of the model. We believe that the autophagy prognostic model might have a far-reaching role in improving traditional TNM staging and histological classification for the prognosis prediction and treatment of CRC patients.
Publicly available datasets were analyzed in this study. These can be found in The Cancer Genome Atlas (https://portal.gdc.cancer.gov/).
QH conducted data analysis and drafted manuscripts. ZL, JY, YL, and XL were involved in research design and data collection. Finally, WZ revised the manuscript. All authors contributed to the article and approved the submitted version.
This work was supported by the National Natural Science Foundation of China (81472275, 81702399) and the Guangdong Basic and Applied Basic Research Foundation (2020A151501303, 2014A030313542, 2017A030313618).
The authors declare that the research was conducted in the absence of any commercial or financial relationships that could be construed as a potential conflict of interest.
The Supplementary Material for this article can be found online at: https://www.frontiersin.org/articles/10.3389/fonc.2021.566539/full#supplementary-material
1. C. Global Burden of Disease Cancer, Fitzmaurice C, Akinyemiju TF, Al Lami FH, Alam T, Alizadeh-Navaei R, et al. Global, Regional, and National Cancer Incidence, Mortality, Years of Life Lost, Years Lived With Disability, and Disability-Adjusted Life-Years for 29 Cancer Groups, 1990 to 2016: A Systematic Analysis for the Global Burden of Disease Study. JAMA Oncol (2018) 4:1553–68. doi: 10.1001/jamaoncol.2018.2706
2. Arnold M, Sierra MS, Laversanne M, Soerjomataram I, Jemal A, Bray F. Global patterns and trends in colorectal cancer incidence and mortality. Gut (2017) 66:683–91. doi: 10.1136/gutjnl-2015-310912
3. Ohsumi Y. Historical landmarks of autophagy research. Cell Res (2014) 24:9–23. doi: 10.1038/cr.2013.169
4. Abdul Rahim SA, Dirkse A, Oudin A, Schuster A, Bohler J, Barthelemy V, et al. Regulation of hypoxia-induced autophagy in glioblastoma involves ATG9A. Br J Cancer (2017) 117:813–25. doi: 10.1038/bjc.2017.263
5. Li L, Tan J, Miao Y, Lei P, Zhang Q. ROS and Autophagy: Interactions and Molecular Regulatory Mechanisms. Cell Mol Neurobiol (2015) 35:615–21. doi: 10.1007/s10571-015-0166-x
6. Amaravadi RK, Kimmelman AC, Debnath J. Targeting Autophagy in Cancer: Recent Advances and Future Directions. Cancer Discov (2019) 9:1167–81. doi: 10.1158/2159-8290.CD-19-0292
7. Guo F, Liu X, Cai H, Le W. Autophagy in neurodegenerative diseases: pathogenesis and therapy. Brain Pathol (2018) 28:3–13. doi: 10.1111/bpa.12545
8. Cordani M, Donadelli M, Strippoli R, Bazhin AV, Sánchez-Álvarez M. Interplay between ROS and Autophagy in Cancer and Aging: From Molecular Mechanisms to Novel Therapeutic Approaches. Oxid Med Cell Longev (2019) 2019:8794612. doi: 10.1155/2019/8794612
9. Mokarram P, Albokashy M, Zarghooni M, Moosavi MA, Sepehri Z, Chen QM, et al. New frontiers in the treatment of colorectal cancer: Autophagy and the unfolded protein response as promising targets. Autophagy (2017) 13:781–819. doi: 10.1080/15548627.2017.1290751
10. Shuhua W, Chenbo S, Yangyang L, Xiangqian G, Shuang H, Tangyue L, et al. Autophagy-related genes Raptor, Rictor, and Beclin1 expression and relationship with multidrug resistance in colorectal carcinoma. Hum Pathol (2015) 46:1752–9. doi: 10.1016/j.humpath.2015.07.016
11. Zhou C, Gu J, Zhang G, Dong D, Yang Q, Chen MB, et al. AMPK-autophagy inhibition sensitizes icaritin-induced anti-colorectal cancer cell activity. Oncotarget (2017) 8:14736–47. doi: 10.18632/oncotarget.14718
12. Jensen MA, Ferretti V, Grossman RL. The NCI Genomic Data Commons as an engine for precision medicine. Blood (2017) 130:453–9. doi: 10.1182/blood-2017-03-735654
13. Stelzer G, Rosen N, Plaschkes I, Zimmerman S, Twik M, Fishilevich S, et al. The GeneCards Suite: From Gene Data Mining to Disease Genome Sequence Analyses. Curr Protoc Bioinformatics (2016) 54:1.30.1–1.30.33. doi: 10.1002/cpbi.5
14. Goldman MJ, Craft B. Visualizing and interpreting cancer genomics data via the Xena platform. Nat Biotechnol (2020) 38:675–8. doi: 10.1038/s41587-020-0546-8
15. Uhlen M, Zhang C. A pathology atlas of the human cancer transcriptome. Science (2017) 357:eaan2507. doi: 10.1126/science.aan2507
16. Ghandi M, Huang FW, Jané-Valbuena J, Kryukov GV, Lo CC, McDonald ER, et al. Next-generation characterization of the Cancer Cell Line Encyclopedia. Nature (2019) 569:503–8. doi: 10.1038/s41586-019-1186-3
17. Li JH, Liu S, Zhou H, Qu LH, Yang JH. starBase v2.0: decoding miRNA-ceRNA, miRNA-ncRNA and protein-RNA interaction networks from large-scale CLIP-Seq data. Nucleic Acids Res (2014) 42:D92–7. doi: 10.1093/nar/gkt1248
18. Kautto EA, Bonneville R, Miya J, Yu L, Krook MA, Reeser JW, et al. Performance evaluation for rapid detection of pan-cancer microsatellite instability with MANTIS. Oncotarget (2017) 8:7452–63. doi: 10.18632/oncotarget.13918
19. Fabrizio DA, George TJ Jr., Dunne RF, Frampton G, Sun J, Gowen K, et al. Beyond microsatellite testing: assessment of tumor mutational burden identifies subsets of colorectal cancer who may respond to immune checkpoint inhibition. J Gastrointest Oncol (2018) 9:610–7. doi: 10.21037/jgo.2018.05.06
20. Koustas E, Karamouzis MV, Mihailidou C, Schizas D, Papavassiliou AG. Co-targeting of EGFR and autophagy signaling is an emerging treatment strategy in metastatic colorectal cancer. Cancer Lett (2017) 396:94–102. doi: 10.1016/j.canlet.2017.03.023
21. Xiao T, Zhu W, Huang W, Lu SS, Li XH, Xiao ZQ, et al. RACK1 promotes tumorigenicity of colon cancer by inducing cell autophagy. Cell Death Dis (2018) 9:1148. doi: 10.1038/s41419-018-1113-9
22. Tauriello DVF, Batlle E. Targeting the Microenvironment in Advanced Colorectal Cancer. Trends Cancer (2016) 2:495–504. doi: 10.1016/j.trecan.2016.08.001
23. Kandouz M, Haidara K, Zhao J, Brisson ML, Batist G. The EphB2 tumor suppressor induces autophagic cell death via concomitant activation of the ERK1/2 and PI3K pathways. Cell Cycle (2010) 9:398–407. doi: 10.4161/cc.9.2.10505
24. Huang Z, Liu J, Luo L, Sheng P, Wang B, Zhang J, et al. Genome-Wide Identification of a Novel Autophagy-Related Signature for Colorectal Cancer. Dose Response (2019) 17:1559325819894179. doi: 10.1177/1559325819894179
25. Zhou Z, Mo S, Dai W, Ying Z, Zhang L, Xiang W, et al. Development and Validation of an Autophagy Score Signature for the Prediction of Post-operative Survival in Colorectal Cancer. Front Oncol (2019) 9:2019.00878:878. doi: 10.3389/fonc.2019.00878
26. Qian K, Huang H, Jiang J, Xu D, Guo S, Cui Y, et al. Identifying autophagy gene-associated module biomarkers through construction and analysis of an autophagy-mediated ceRNA-ceRNA interaction network in colorectal cancer. Int J Oncol (2018) 53:1083–93. doi: 10.3892/ijo.2018.4443
27. Cheng L, Han T, Zhang Z, Yi P, Zhang C, Zhang S, et al. Identification and Validation of Six Autophagy-related Long Non-coding RNAs as Prognostic Signature in Colorectal Cancer. Int J Med Sci (2021) 18:88–98. doi: 10.7150/ijms.49449
28. Tanabe H, Kuribayashi K, Tsuji N, Tanaka M, Kobayashi D, Watanabe N. Sesamin induces autophagy in colon cancer cells by reducing tyrosine phosphorylation of EphA1 and EphB2. Int J Oncol (2011) 39:33–40. doi: 10.3892/ijo.2011.1011
29. Ishii M, Nakajima T, Ogawa K. Complementary expression of EphB receptors and ephrin-B ligand in the pyloric and duodenal epithelium of adult mice. Histochem Cell Biol (2011) 136:345–56. doi: 10.1007/s00418-011-0849-4
30. Chukkapalli S, Amessou M, Dilly AK, Dekhil H, Zhao J, Liu Q, et al. Role of the EphB2 receptor in autophagy, apoptosis and invasion in human breast cancer cells. Exp Cell Res (2014) 320:233–46. doi: 10.1016/j.yexcr.2013.10.022
31. Jang BG, Kim HS, Chang WY, Bae JM, Kang GH. Prognostic Significance of EPHB2 Expression in Colorectal Cancer Progression. J Pathol Transl Med (2018) 52:298–306. doi: 10.4132/jptm.2018.06.29
32. Sohn EJ, Shin MJ, Eum WS, Kim DW, Yong JI, Ryu EJ, et al. Tat-NOL3 protects against hippocampal neuronal cell death induced by oxidative stress through the regulation of apoptotic pathways. Int J Mol Med (2016) 38:225–35. doi: 10.3892/ijmm.2016.2596
33. Tasdemir E, Maiuri MC, Galluzzi L, Vitale I, Djavaheri-Mergny M, D’Amelio M, et al. Regulation of autophagy by cytoplasmic p53. Nat Cell Biol (2008) 10:676–87. doi: 10.1038/ncb1730
34. Duan L, Perez RE, Davaadelger B, Dedkova EN, Blatter LA, Maki CG. p53-regulated autophagy is controlled by glycolysis and determines cell fate. Oncotarget (2015) 6:23135–56. doi: 10.18632/oncotarget.5218
35. Kaufhold S, Bonavida B. Central role of Snail1 in the regulation of EMT and resistance in cancer: a target for therapeutic intervention. J Exp Clin Cancer Res (2014) 33:62. doi: 10.1186/s13046-014-0062-0
36. Freihen V, Rönsch K, Mastroianni J, Frey P, Rose K, Boerries M, et al. SNAIL1 employs β-Catenin-LEF1 complexes to control colorectal cancer cell invasion and proliferation. Int J Cancer (2020) 146:2229–42. doi: 10.1002/ijc.32644
37. Opdam FJ, Echard A, Croes HJ, van den Hurk JA, van de Vorstenbosch RA, Ginsel LA, et al. The small GTPase Rab6B, a novel Rab6 subfamily member, is cell-type specifically expressed and localised to the Golgi apparatus. J Cell Sci (2000) 113(Pt 15):2725–35.
38. Zhao L, Xue M, Zhang L, Guo B, Qin Y, Jiang Q, et al. MicroRNA-4268 inhibits cell proliferation via AKT/JNK signalling pathways by targeting Rab6B in human gastric cancer. Cancer Gene Ther (2019) 27:461–72. doi: 10.1038/s41417-019-0118-6
39. Guan J, Yuan Z, He J, Wu Z, Liu B, Lin X, et al. Overexpression of caveolin-1 reduces Taxol resistance in human osteosarcoma cells by attenuating PI3K-Akt-JNK dependent autophagy. Exp Ther Med (2016) 12:2815–22. doi: 10.3892/etm.2016.3713
40. Mo H, He J, Yuan Z, Mo L, Wu Z, Lin X, et al. WT1 is involved in the Akt-JNK pathway dependent autophagy through directly regulating Gas1 expression in human osteosarcoma cells. Biochem Biophys Res Commun (2016) 478:74–80. doi: 10.1016/j.bbrc.2016.07.090
41. He Y, She H, Zhang T, Xu H, Cheng L, Yepes M, et al. p38 MAPK inhibits autophagy and promotes microglial inflammatory responses by phosphorylating ULK1. J Cell Biol (2018) 217:315–28. doi: 10.1083/jcb.201701049
42. Huang RH, Quan YJ, Chen JH, Wang TF, Xu M, Ye M, et al. Osteopontin Promotes Cell Migration and Invasion, and Inhibits Apoptosis and Autophagy in Colorectal Cancer by activating the p38 MAPK Signaling Pathway. Cell Physiol Biochem (2017) 41:1851–64. doi: 10.1159/000471933
43. Schulte RR, Ho RH. Organic Anion Transporting Polypeptides: Emerging Roles in Cancer Pharmacology. Mol Pharmacol (2019) 95:490–506. doi: 10.1124/mol.118.114314
44. Lu X, Chan T, Cheng Z, Shams T, Zhu L, Murray M, et al. The 5’-AMP-Activated Protein Kinase Regulates the Function and Expression of Human Organic Anion Transporting Polypeptide 1A2. Mol Pharmacol (2018) 94:1412–20. doi: 10.1124/mol.118.113423
45. Drozdzik M, Gröer C, Penski J, Lapczuk J, Ostrowski M, Lai Y, et al. Protein abundance of clinically relevant multidrug transporters along the entire length of the human intestine. Mol Pharm (2014) 11:3547–55. doi: 10.1021/mp500330y
46. Wlcek K, Svoboda M, Riha J, Zakaria S, Olszewski U, Dvorak Z, et al. The analysis of organic anion transporting polypeptide (OATP) mRNA and protein patterns in primary and metastatic liver cancer. Cancer Biol Ther (2011) 11:801–11. doi: 10.4161/cbt.11.9.15176
47. Kumar P, Zhang DM, Degenhardt K, Chen ZS. Autophagy and transporter-based multi-drug resistance. Cells (2012) 1:558–75. doi: 10.3390/cells1030558
48. Ding R, Jin S, Pabon K, Scotto KW. A role for ABCG2 beyond drug transport: Regulation of autophagy. Autophagy (2016) 12:737–51. doi: 10.1080/15548627.2016.1155009
49. Hildebrand JM, Yi Z, Buchta CM, Poovassery J, Stunz LL, Bishop GA. Roles of tumor necrosis factor receptor associated factor 3 (TRAF3) and TRAF5 in immune cell functions. Immunol Rev (2011) 244:55–74. doi: 10.1111/j.1600-065X.2011.01055.x
50. Gong H, Fang L, Li Y, Du J, Zhou B, Wang X, et al. miR−873 inhibits colorectal cancer cell proliferation by targeting TRAF5 and TAB1. Oncol Rep (2018) 39:1090–8. doi: 10.3892/or.2018.6199
51. Verzella D, Pescatore A, Capece D, Vecchiotti D, Ursini MV, Franzoso G, et al. Life, death, and autophagy in cancer: NF-κB turns up everywhere. Cell Death Dis (2020) 11:210. doi: 10.1038/s41419-020-2399-y
52. Bi C, Jiang B. Downregulation of RPN2 induces apoptosis and inhibits migration and invasion in colon carcinoma. Oncol Rep (2018) 40:283–93. doi: 10.3892/or.2018.6434
53. Li H, Al-Japairai K, Tao Y, Xiang Z. RPN2 promotes colorectal cancer cell proliferation through modulating the glycosylation status of EGFR. Oncotarget (2017) 8:72633–51. doi: 10.18632/oncotarget.20005
54. Huang L, Jian Z, Gao Y, Zhou P, Zhang G, Jiang B, et al. RPN2 promotes metastasis of hepatocellular carcinoma cell and inhibits autophagy via STAT3 and NF-κB pathways. Aging (Albany NY) (2019) 11:6674–90. doi: 10.18632/aging.102167
55. Cao H, Zhang J, Liu H, Wan L, Zhang H, Huang Q, et al. IL-13/STAT6 signaling plays a critical role in the epithelial-mesenchymal transition of colorectal cancer cells. Oncotarget (2016) 7:61183–98. doi: 10.18632/oncotarget.11282
56. Dickinson JD, Alevy Y, Malvin NP, Patel KK, Gunsten SP, Holtzman MJ, et al. IL13 activates autophagy to regulate secretion in airway epithelial cells. Autophagy (2016) 12:397–409. doi: 10.1080/15548627.2015.1056967
57. Li WL, Xiong LX, Shi XY, Xiao L, Qi GY, Meng C. IKKβ/NFκBp65 activated by interleukin-13 targets the autophagy-related genes LC3B and beclin 1 in fibroblasts co-cultured with breast cancer cells. Exp Ther Med (2016) 11:1259–64. doi: 10.3892/etm.2016.3054
58. Luo X, Liao C, Quan J, Cheng C, Zhao X, Bode AM, et al. Posttranslational regulation of PGC-1α and its implication in cancer metabolism. Int J Cancer (2019) 145:1475–83. doi: 10.1002/ijc.32253
59. Salem AF, Whitaker-Menezes D, Howell A, Sotgia F, Lisanti MP. Mitochondrial biogenesis in epithelial cancer cells promotes breast cancer tumor growth and confers autophagy resistance. Cell Cycle (2012) 11:4174–80. doi: 10.4161/cc.22376
60. Ferretta A, Maida I, Guida S, Azzariti A, Porcelli L, Tommasi S, et al. New insight into the role of metabolic reprogramming in melanoma cells harboring BRAF mutations. Biochim Biophys Acta (2016) 1863:2710–8. doi: 10.1016/j.bbamcr.2016.08.007
61. Liu SY, Chen YT, Tseng MY, Hung CC, Chiang WF, Chen HR, et al. Involvement of microtubule-associated protein 2 (MAP2) in oral cancer cell motility: a novel biological function of MAP2 in non-neuronal cells. Biochem Biophys Res Commun (2008) 366:520–5. doi: 10.1016/j.bbrc.2007.11.179
62. Dehmelt L, Halpain S. The MAP2/Tau family of microtubule-associated proteins. Genome Biol (2005) 6:204. doi: 10.1186/gb-2004-6-1-204
63. Kinsey CG, Camolotto SA, Boespflug AM, Guillen KP, Foth M, Truong A, et al. Protective autophagy elicited by RAF→MEK→ERK inhibition suggests a treatment strategy for RAS-driven cancers. Nat Med (2019) 25:620–7. doi: 10.1038/s41591-019-0367-9
64. Liu M, Xu P, O’Brien T, Shen S. Multiple roles of Ulk4 in neurogenesis and brain function. Neurogenesis (Austin) (2017) 4:e1313646. doi: 10.1080/23262133.2017.1313646
65. Lebovitz CB, Robertson AG, Goya R, Jones SJ, Morin RD, Marra MA, et al. Cross-cancer profiling of molecular alterations within the human autophagy interaction network. Autophagy (2015) 11:1668–87. doi: 10.1080/15548627.2015.1067362
66. Sun C, Wang FJ, Zhang HG, Xu XZ, Jia RC, Yao L, et al. miR-34a mediates oxaliplatin resistance of colorectal cancer cells by inhibiting macroautophagy via transforming growth factor-β/Smad4 pathway. World J Gastroenterol (2017) 23:1816–27. doi: 10.3748/wjg.v23.i10.1816
67. Zhang J, Chu D, Kawamura T, Tanaka K, He S. GRIM-19 repressed hypoxia-induced invasion and EMT of colorectal cancer by repressing autophagy through inactivation of STAT3/HIF-1α signaling axis. J Cell Physiol (2019) 234:12800–8. doi: 10.1002/jcp.27914
68. Pandurangan AK, Divya T, Kumar K, Dineshbabu V, Velavan B, Sudhandiran G. Colorectal carcinogenesis: Insights into the cell death and signal transduction pathways: A review. World J Gastrointest Oncol (2018) 10:244–59. doi: 10.4251/wjgo.v10.i9.244
69. Pan H, Wang Y, Na K, Wang Y, Wang L, Li Z, et al. Autophagic flux disruption contributes to Ganoderma lucidum polysaccharide-induced apoptosis in human colorectal cancer cells via MAPK/ERK activation. Cell Death Dis (2019) 10:456. doi: 10.1038/s41419-019-1653-7
70. Hall TM, Tétreault MP, Hamilton KE, Whelan KA. Autophagy as a cytoprotective mechanism in esophageal squamous cell carcinoma. Curr Opin Pharmacol (2018) 41:12–9. doi: 10.1016/j.coph.2018.04.003
71. Wang H, Yu X, Su C, Shi Y, Zhao L. Chitosan nanoparticles triggered the induction of ROS-mediated cytoprotective autophagy in cancer cells. Artif Cells Nanomed Biotechnol (2018) 46:293–301. doi: 10.1080/21691401.2017.1423494
72. Prolla TA. DNA mismatch repair and cancer. Curr Opin Cell Biol (1998) 10:311–6. doi: 10.1016/s0955-0674(98)80005-7
73. Gelsomino F, Barbolini M, Spallanzani A, Pugliese G, Cascinu S. The evolving role of microsatellite instability in colorectal cancer: A review. Cancer Treat Rev (2016) 51:19–26. doi: 10.1016/j.ctrv.2016.10.005
74. Sena P, Mariani F, Mancini S, Benincasa M, Magnani G, Pedroni M, et al. Autophagy is upregulated during colorectal carcinogenesis, and in DNA microsatellite stable carcinomas. Oncol Rep (2015) 34:3222–30. doi: 10.3892/or.2015.4326
75. He S, Zhao Z, Yang Y, O’Connell D, Zhang X, Oh S, et al. Truncating mutation in the autophagy gene UVRAG confers oncogenic properties and chemosensitivity in colorectal cancers. Nat Commun (2015) 6:7839. doi: 10.1038/ncomms8839
76. Drucker A, Arnason T, Yan SR, Aljawad M, Thompson K, Huang WY. Ephrin b2 receptor and microsatellite status in lymph node-positive colon cancer survival. Trans Oncol (2013) 6:520–7. doi: 10.1593/tlo.13385
77. Aquilina G, Bignami M. Mismatch repair in correction of replication errors and processing of DNA damage. J Cell Physiol (2001) 187:145–54. doi: 10.1002/jcp.1067
78. Zhou L, Guo J, Jia R. Oncogene SRSF3 suppresses autophagy via inhibiting BECN1 expression. Biochem Biophys Res Commun (2019) 509:966–72. doi: 10.1016/j.bbrc.2019.01.048
79. Kuranaga Y, Sugito N, Shinohara H, Tsujino T, Taniguchi K, Komura K, et al. SRSF3, a Splicer of the PKM Gene, Regulates Cell Growth and Maintenance of Cancer-Specific Energy Metabolism in Colon Cancer Cells. Int J Mol Sci (2018) 19:3012. doi: 10.3390/ijms19103012
80. Niu YN, Liu QQ, Zhang SP, Yuan N, Cao Y, Cai JY, et al. Alternative messenger RNA splicing of autophagic gene Beclin 1 in human B-cell acute lymphoblastic leukemia cells. Asian Pac J Cancer Prev (2014) 15:2153–8. doi: 10.7314/apjcp.2014.15.5.2153
81. Tsukahara T, Haniu H, Matsuda Y. The PTB-Associated Splicing Factor/Peroxisome Proliferator-Activated Receptor Gamma Axis Regulates Autophagosome Formation in Human Pancreatic Cancer Cells. Biores Open Access (2015) 4:319–25. doi: 10.1089/biores.2015.0018
Keywords: colorectal cancer, autophagy, prognostic model, splicing, markers
Citation: He Q, Li Z, Yin J, Li Y, Yin Y, Lei X and Zhu W (2021) Prognostic Significance of Autophagy-Relevant Gene Markers in Colorectal Cancer. Front. Oncol. 11:566539. doi: 10.3389/fonc.2021.566539
Received: 28 May 2020; Accepted: 22 March 2021;
Published: 15 April 2021.
Edited by:
Fenglin Liu, Fudan University, ChinaReviewed by:
Brian M. Olson, Emory University, United StatesCopyright © 2021 He, Li, Yin, Li, Yin, Lei and Zhu. This is an open-access article distributed under the terms of the Creative Commons Attribution License (CC BY). The use, distribution or reproduction in other forums is permitted, provided the original author(s) and the copyright owner(s) are credited and that the original publication in this journal is cited, in accordance with accepted academic practice. No use, distribution or reproduction is permitted which does not comply with these terms.
*Correspondence: Wei Zhu, emh1d2VpQGdkbXUuZWR1LmNu
Disclaimer: All claims expressed in this article are solely those of the authors and do not necessarily represent those of their affiliated organizations, or those of the publisher, the editors and the reviewers. Any product that may be evaluated in this article or claim that may be made by its manufacturer is not guaranteed or endorsed by the publisher.
Research integrity at Frontiers
Learn more about the work of our research integrity team to safeguard the quality of each article we publish.