 Jianyuan Zhou1†
 Sijuan Zou1†
 Siyuan Cheng1
 Dong Kuang2
 Dan Li1
 Lixing Chen1Cong Liu2
 Jianhua Yan3*
 Xiaohua Zhu1*
- 1Department of Nuclear Medicine and PET, Tongji Hospital, Tongji Medical College, Huazhong University of Science and Technology, Wuhan, China
- 2Department of Pathology, Tongji Hospital, Tongji Medical College, Huazhong University of Science and Technology, Wuhan, China
- 3Shanghai Key Laboratory of Molecular Imaging, Shanghai University of Medicine and Health Sciences, Shanghai, China
Purpose: Dual-time-point 18F-fluorodeoxyglucose positron emission tomography (DTP 18F-FDG PET), which reflects the dynamics of tumor glucose metabolism, may also provide a novel approach to the characterization of both cancer cells and immune cells within the tumor immune microenvironment (TIME). We investigated the correlations between the metabolic parameters (MPs) of DTP 18F-FDG PET images and the tumor microenvironment immune types (TMITs) in patients with non-small cell lung cancer (NSCLC).
Methods: A retrospective analysis was performed in 91 patients with NSCLC who underwent preoperative DTP 18F-FDG PET/CT scans. MPs in the early scan (eSUVmax, eSUVmean, eMTV, eTLG) and delayed scan (dSUVmax, dSUVmean, dMTV, dTLG) were calculated, respectively. The change in MPs (ΔSUVmax, ΔSUVmean, ΔMTV, ΔTLG) between the two time points were calculated. Tumor specimens were analyzed by immunohistochemistry for PD-1/PD-L1 expression and CD8+ tumor-infiltrating lymphocytes (TILs). TIME was classified into four immune types (TMIT I ~ IV) according to the expression of PD-L1 and CD8+ TILs. Correlations between MPs with TMITs and the immune-related biomarkers were analyzed. A composite metabolic signature (Meta-Sig) and a combined model of Meta-Sig and clinical factors were constructed to predict patients with TMIT I tumors.
Results: eSUVmax, eSUVmean, dSUVmax, dSUVmean, ΔSUVmax, ΔSUVmean, and ΔTLG were significantly higher in PD-L1 positive patients (p = 0.0007, 0.0006, < 0.0001, < 0.0001, 0.0002, 0.0002, 0.0247, respectively), and in TMIT-I tumors (p = 0.0001, < 0.0001, < 0.0001, < 0.0001, 0.0009, 0.0009, 0.0144, respectively). Compared to stand-alone MP, the Meta-Sig and combined model displayed better performance for assessing TMIT-I tumors (Meta-sig: AUC = 0.818, sensitivity = 86.36%, specificity = 73.91%; Model: AUC = 0.869, sensitivity = 77.27%, specificity = 82.61%).
Conclusion: High glucose metabolism on DTP 18F-FDG PET correlated with the TMIT-I tumors, and the Meta-Sig and combined model based on clinical and metabolic information could improve the performance of identifying the patients who may respond to immunotherapy.
Introduction
Lung cancer is the leading cause of cancer death in China (1). Non-small cell lung cancer (NSCLC) accounts for more than 80% of all lung cancer cases. Over the last decade, the immune checkpoint inhibitors (ICIs) targeting the programmed death protein 1 (PD-1)/programmed death ligand 1 (PD-L1) axis have shown significant clinical benefit for advanced NSCLC patients. The expression of PD-L1 on tumor cells is considered as a predictive biomarker for the response to anti-PD-1/PD-L1 ICIs (2). However, not all patients with positive PD-L1 expression respond well to immunotherapy. It suggests that other tumor immune microenvironment (TIME) factors may also affect the response to the ICIs (3). In addition to PD-L1 expression, CD8+ tumor-infiltrating lymphocytes (TILs) might play an important role in anti–PD-1/PD-L1 therapies (2). Without CD8+ TILs, it’s unlikely that blocking PD-1 or PD-L1 causes any tumor inhibition (4). Characterized by high infiltration of CD8+ cytotoxic lymphocytes, the infiltrated–inflamed TIME has significantly better responses to ICIs (5). Therefore, it was proposed that TIME could be classified into four subtypes based on PD-L1 and CD8+ TILs status (4). Tumors with high PD-L1 expression and the presence of CD8+ TILs are classified as tumor microenvironment immune type I (TMIT-I), a immunologically ‘hot’ subtype that would likely benefit from anti-PD-1/PD-L1 therapies (6). However, there is no noninvasive method to identify TMIT I tumors, and up to now the overall and dynamic detection of TIME biomarkers is still challenging.
Among the image-based modalities for non-invasive tumor assessment, 18F-fluorodeoxyglucose positron emission tomography/computed tomography (18F-FDG PET/CT) is the most common one of patients with NSCLC (7). Glucose metabolism is closely related to the characteristics of TIME. As a nutrient, glucose is actively entrapped in neoplastic tissue and tumor-related activated immune cells (8). Previous studies have established the correlation between the MPs [maximum and mean standard uptake value (SUVmax and SUVmean)] of 18F-FDG PET and the expression of immune markers (PD-1, PD-L1 and CD8) in patients with NSCLC (9–16). However, little attention was paid to CD8+ TILs and tumor immune types. The predictive value of tumor metabolism solely based on SUVmax remains weak in patients undergoing ICI immunotherapy. Dual-time-point (DTP) 18F-FDG PET, which reflects the dynamics of glucose metabolism, is expected to be a potential imaging method to reveal the TIME information. Up to date, the correlation between metabolic parameters (MPs) on DTP FDG PET and TMITs in pretreated NSCLC remains unclear.
This retrospective study was conducted to correlate a number of MPs of DTP 18F-FDG PET with immune markers and TMITs in a cohort of pretreated NSCLC patients. We hypothesize that the abundant metabolic information on DTP FDG PET imaging defines the TMITs of NSCLC and helps optimize patient selection for ICIs treatment.
Materials and Methods
Patient Population
Patients who underwent pretreatment DTP 18F-FDG PET/CT scans in Tongji hospital for NSCLC diagnosis and staging from December 2014 to December 2017, were retrospectively reviewed. Eligible patients were histologically confirmed with NSCLC, underwent initial PET scan less than 30 days from surgery (or biopsy), with tumor size ≥ 1 cm in diameter. Key exclusion criteria were: patients that received anti-tumor therapy before surgery (or biopsy), and patients whose tumor specimens were not available for immunohistochemistry. This retrospective study was approved by the institutional review board.
DTP 18F-FDG PET/CT Acquisition Protocol and Image Analysis
In each patient, 3.7 MBq/kg FDG was intravenously administered after fasting for at least 6 h. The blood glucose concentration was lower than 200 mg/dL before injecting. PET/CT images were obtained by a PET/CT scanner (Discovery 690 PET/CT, GE) at approximately 60 ± 5 min (early) and 120 ± 5 min (delayed) after FDG administration. Whole body images were obtained from the base of the skull to mid-thigh by means of an integrated PET/CT tomography (5 to 7 bed positions with 3 min per bed position). PET images were attenuation-corrected and anatomically fused with low-dose CT images, and reconstructed onto a 128 × 128 matrix. A low-dose helical CT scan (120 kV, 120 mA, slice thickness, 3.75mm) was performed for anatomical correlation and attenuation correction.
Images were analyzed by two board-certified nuclear medicine physicians. Tumor mass area of increased radiotracer uptake was first identified, then a semi-automated, ellipsoid 3D-isocontour volume of interest (VOI) with threshold of 40%SUVmax was marked around the tumor for the measurement of SUVmax, SUVmean and metabolic tumor volume (MTV). For tumors with low uptake, VOI was obtained by manually delineating the boundary layer by layer along the tumors, then SUVs and MTV (with threshold of 40%SUVmax) were automatically calculated within each VOI. Total lesion glycolysis (TLG) and the change of SUVmax, SUVmean, MTV and TLG were calculated according to the following formula: TLG = SUVmean × MTV, ΔMP = dMP – eMP.
Immunohistochemistry Analysis
Immunohistochemistry was performed using 4 µm sections from a paraffin-embedded tissue block as previously described (17). Briefly, the sections were deparaffinized in xylene and rehydrated in graded ethanol and distilled water. Slides were auto-stained with primary antibodies raised against CD8+ (ZA-0508, ZSGB-BIO, China), PD-1 (Abcam, EPR4877(2), ab137132), PD-L1 (ZA-0629, ZSGB-BIO, China). The PD-L1 immunostaining results were classified into two groups based on staining intensity and proportion of tumor cell positivity (18). Staining intensity was scored as follows: 0, negative staining; 1, weak staining; 2, moderate staining; and 3, strong staining (more intense than alveolar macrophages). Case in which more than 5% of tumor cells displayed a staining intensity ≥2 was considered positive. Case with staining intensity <2 or less than 5% of tumor cells was defined negative. The expressions of PD-1 and CD8+ TIL were evaluated according to the average number of positively stained cells in 3 randomly selected high-power fields in each case. The numbers of CD8+ TILs were classified into two groups based on the median value: CD8+ TILs+ (n ≤100), CD8+ TILs- (n> 100).
Four tumor microenvironment immune types was classified as reported (3, 6, 19): TMIT-I (PD-L1+, CD8+ TILs+); TMIT-II (PD-L1-, CD8+ TILs-); TMIT-III (PD-L1+, CD8+ TILs-) and TMIT-IV (PD-L1-, CD8+ TILs+).
Statistical Analysis
Data was analyzed with the SPSS statistical package, MedCalc and R software. The distribution of variables was checked using Shapiro-Wilk test. For continuous data, the differences between two groups were assessed using Mann-Whitney U test or Student’s t-test. Differences among multi-group were compared using one-way analysis of variance (ANOVA) (with least significant difference method) or Kruskal-Wallis H test, when appropriate. Spearman’s correlation coefficients were calculated. The least absolute shrinkage and selection operator (LASSO) algorithm method using 10-fold cross-validation was employed to select the optimal features. Features with non-zero coefficients at the minimum of lambda were selected from the candidate MPs to construct a metabolic signature (Meta-Sig). Multivariate logistic regression analysis with backward stepwise elimination method was performed to construct a combined model, based on clinical factors and the Meta-Sig. The receiver operating characteristic (ROC) curves and DeLong test were used to compare the area under the curves (AUCs) for predicting TMIT I tumors. Furthermore, decision curve analysis (DCA) was used to evaluate the clinical usefulness of the combined model by quantifying the net benefits at different threshold probabilities. P<0.05 was considered to be statistically significant.
Results
Patient Characteristics
A total of 91 patients (68 with adenocarcinoma, 22 with squamous cell carcinoma and 1 with adenosquamous carcinoma; 47 male, 44 female) were included. The median age of these patients was 59 years (range 36~78). Patients’ demographics and the median value of twelve MPs of DTP 18F-FDG PET images were shown in Table 1.
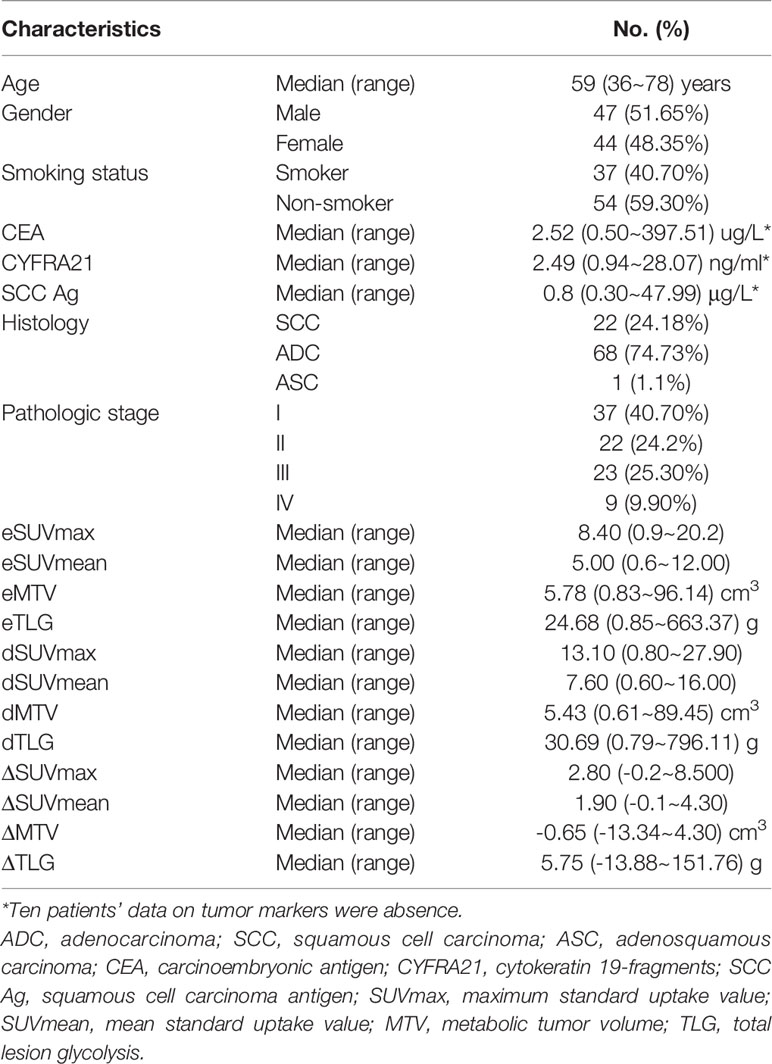
Table 1 Demographic and clinical data of all patients.
Positive PD-L1 immunostaining was observed on the membranes and/or in the cytoplasm of tumor cells. Positive PD-L1 expressions were noted in 33 of the 91 (36.26%) patients. The median value of CD8+ TILs and PD-1 TILs was 100 (range 0~300) and 74 (range 0~282) respectively. The percentage of TMIT-I tumors was 24.18% (22/91) in this study.
Characterization of TMITs
The percentages of four TMITs were as follows: 22 (24.18%) TMIT I, 36 (39.56%) TMIT II, 11 (12.09%) TMIT III and 22 (24.18%) TMIT IV. PD-1 expression was significantly higher in TMIT I tumors than TMIT II and III tumors (p < 0.001, 0.015), but no statistically significant difference was found between TMIT I and IV groups (p = 0.584) (Figure 1). The spearman’s analysis showed a statistically significant correlation between the PD-1 and CD8+ TILs (rho = 0.543, p < 0.001). PD-1 and CD8+ TILs were significantly higher in PD-L1 positive patients (p = 0.015 and 0.004, respectively).
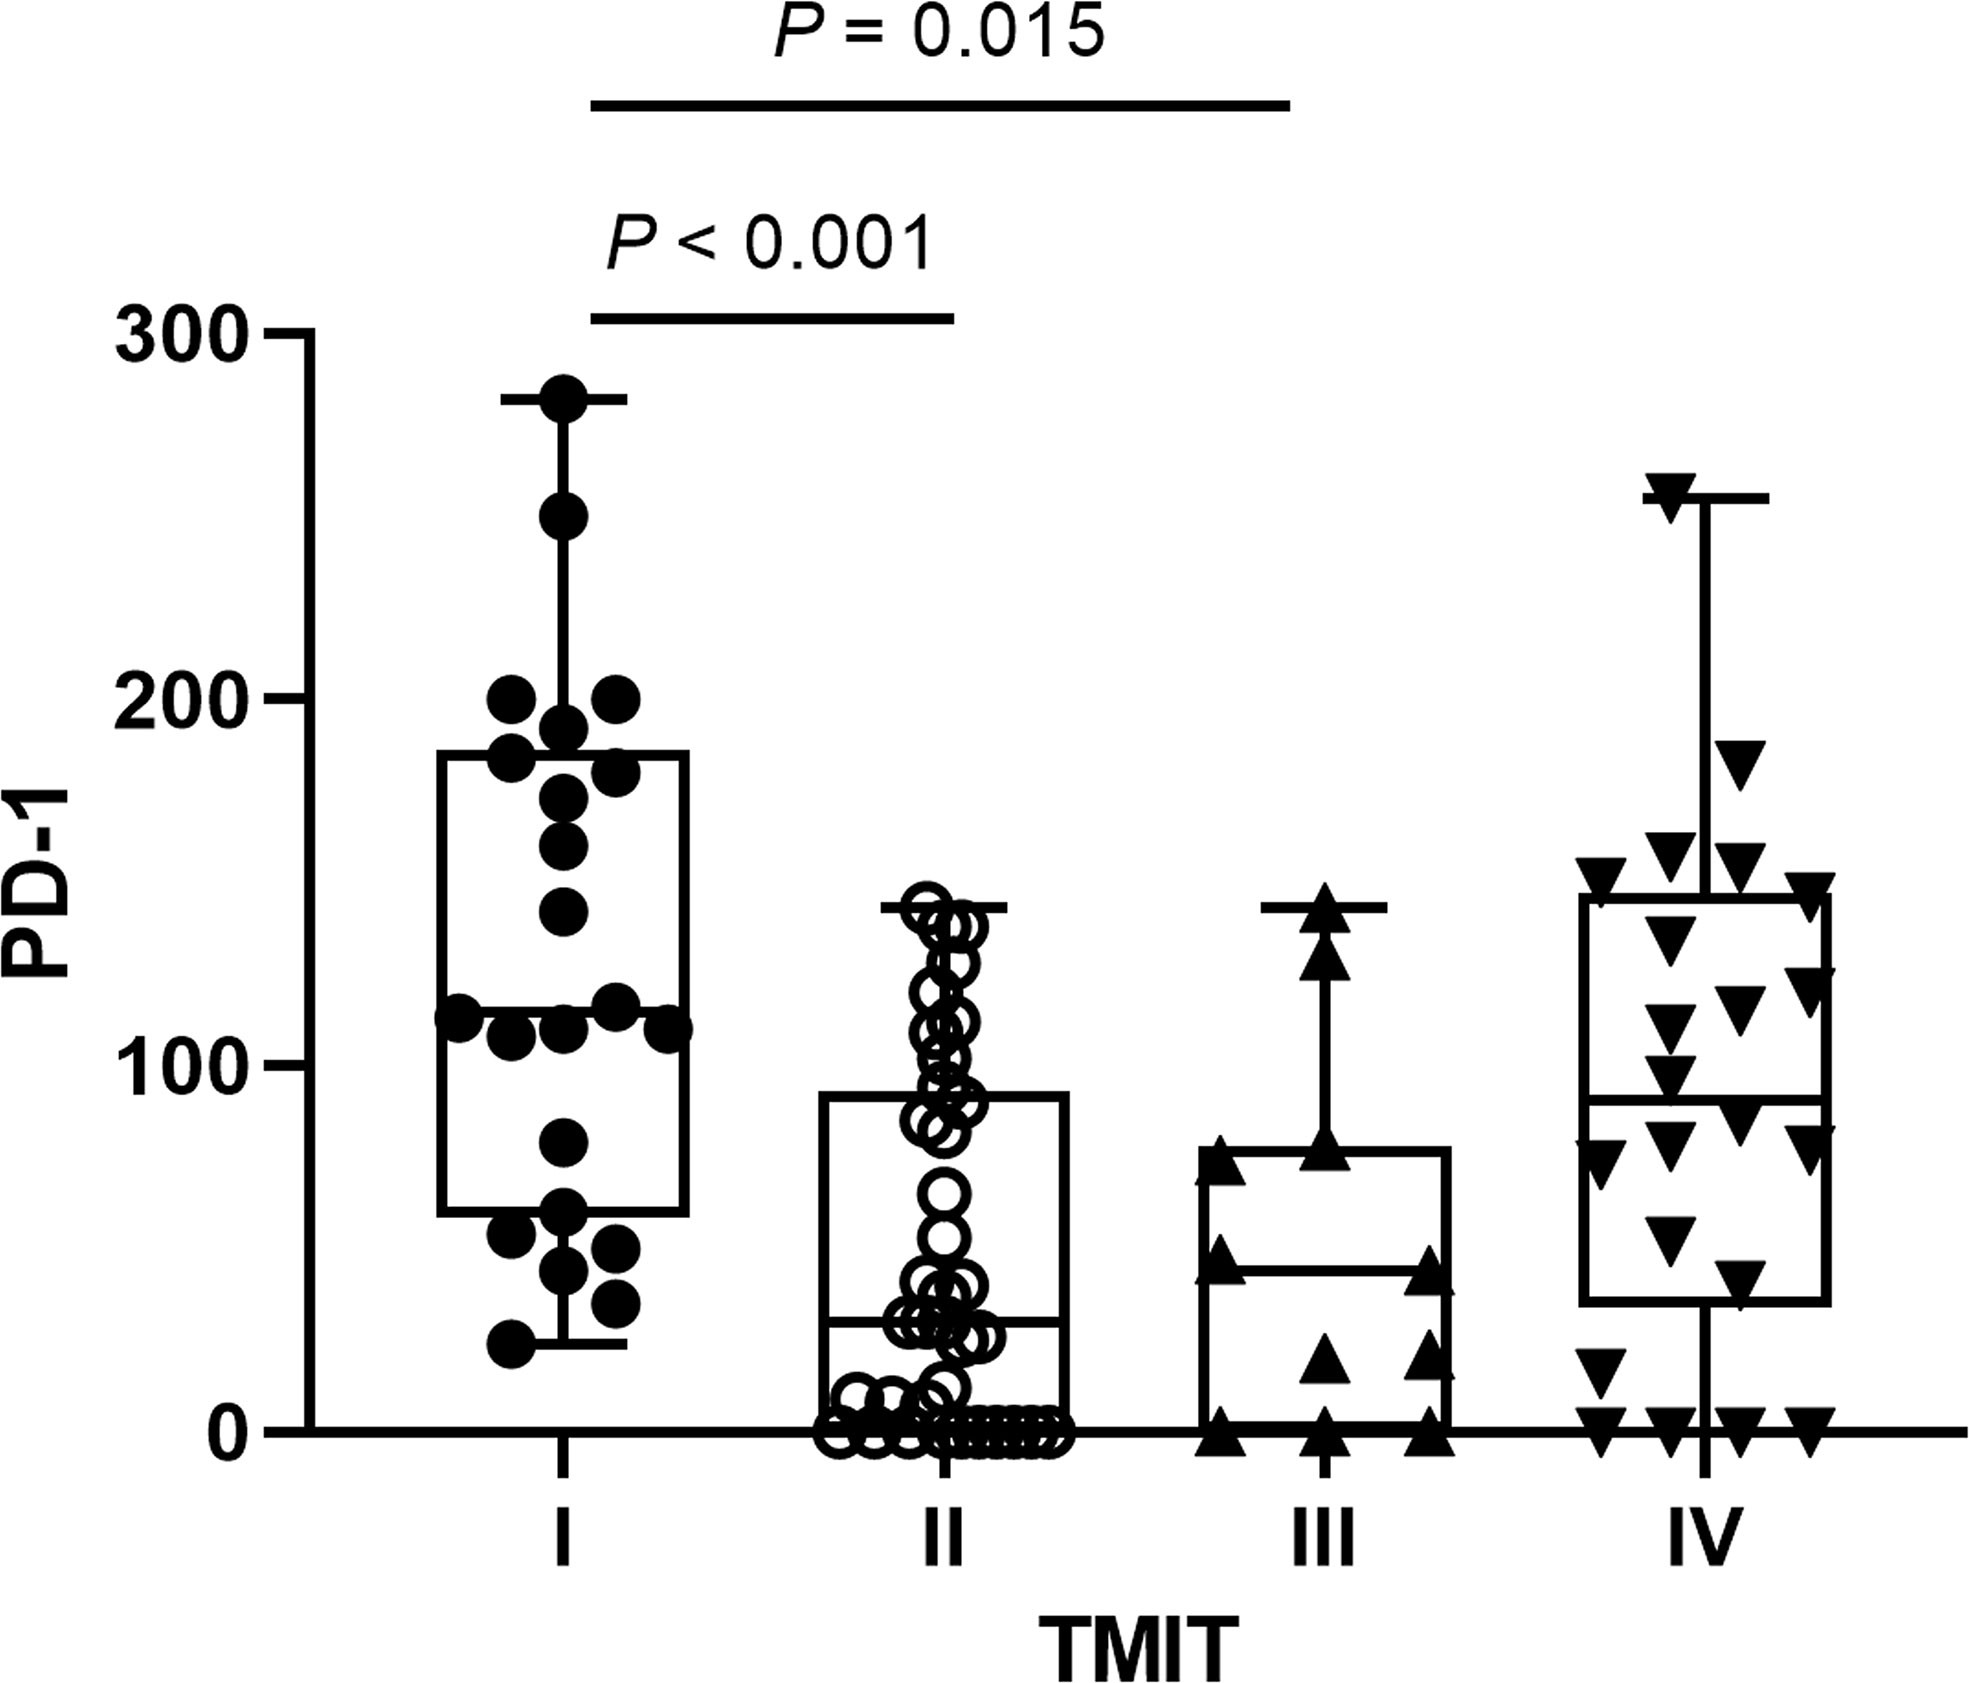
Figure 1 The distributions of programmed cell death 1 (PD‐1) expression according to different tumor microenvironment immune types (TMITs). The PD-1 expression was significantly higher in TMIT I tumors than TMIT II and III tumors.
Correlations Between PD-L1 Expression and MPs on DTP FDG PET
By Mann-Whitney U test, PD-L1 positive patients showed higher early SUVmax (eSUVmax) (p = 0.0007), early SUVmean (eSUVmean) (p = 0.0006), delayed SUVmax (dSUVmax) (p < 0.0001), delayed SUVmean (dSUVmean) (p<0.0001), ΔSUVmax (p = 0.0002), ΔSUVmean (p = 0.0002) and ΔTLG (p = 0.0247) in Figure 2. ROC curve for MPs showed moderate ability for predicting PD-L1 expression in Table 2.

Figure 2 The distributions of metabolic parameters (MPs) according to programmed cell death‐ligand 1 (PD‐L1) protein expression. The MPs were significantly higher in patients with PD‐L1 positivity than those with PD‐L1 negativity.
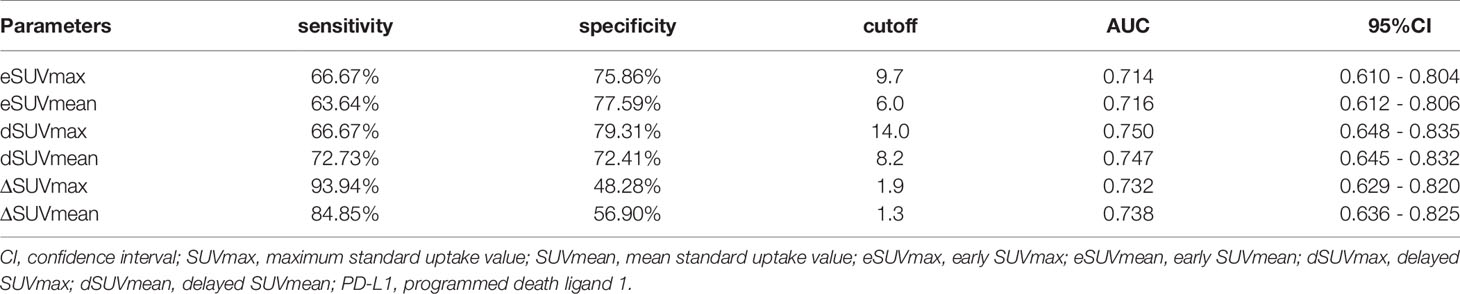
Table 2 ROC analysis for the metabolic parameters according to PD-L1 expression.
Correlations Between TILs and MPs on DTP FDG PET
Spearman’s correlation coefficients revealed poor correlations between TILs and MPs. Specifically, CD8+ TILs in NSCLC were weakly correlated with dSUVmean (rho = 0.212, p = 0.044) and ΔSUVmean (rho = 0.209, p = 0.047). Similarly, weak correlations were found between PD-1 TILs and eSUVmax (rho = 0.234, p = 0.026), eSUVmean (rho = 0.242, p = 0.021), dSUVmax (rho = 0.225, p = 0.032) and dSUVmean (rho = 0.235, p = 0.025), respectively (Figure 3).
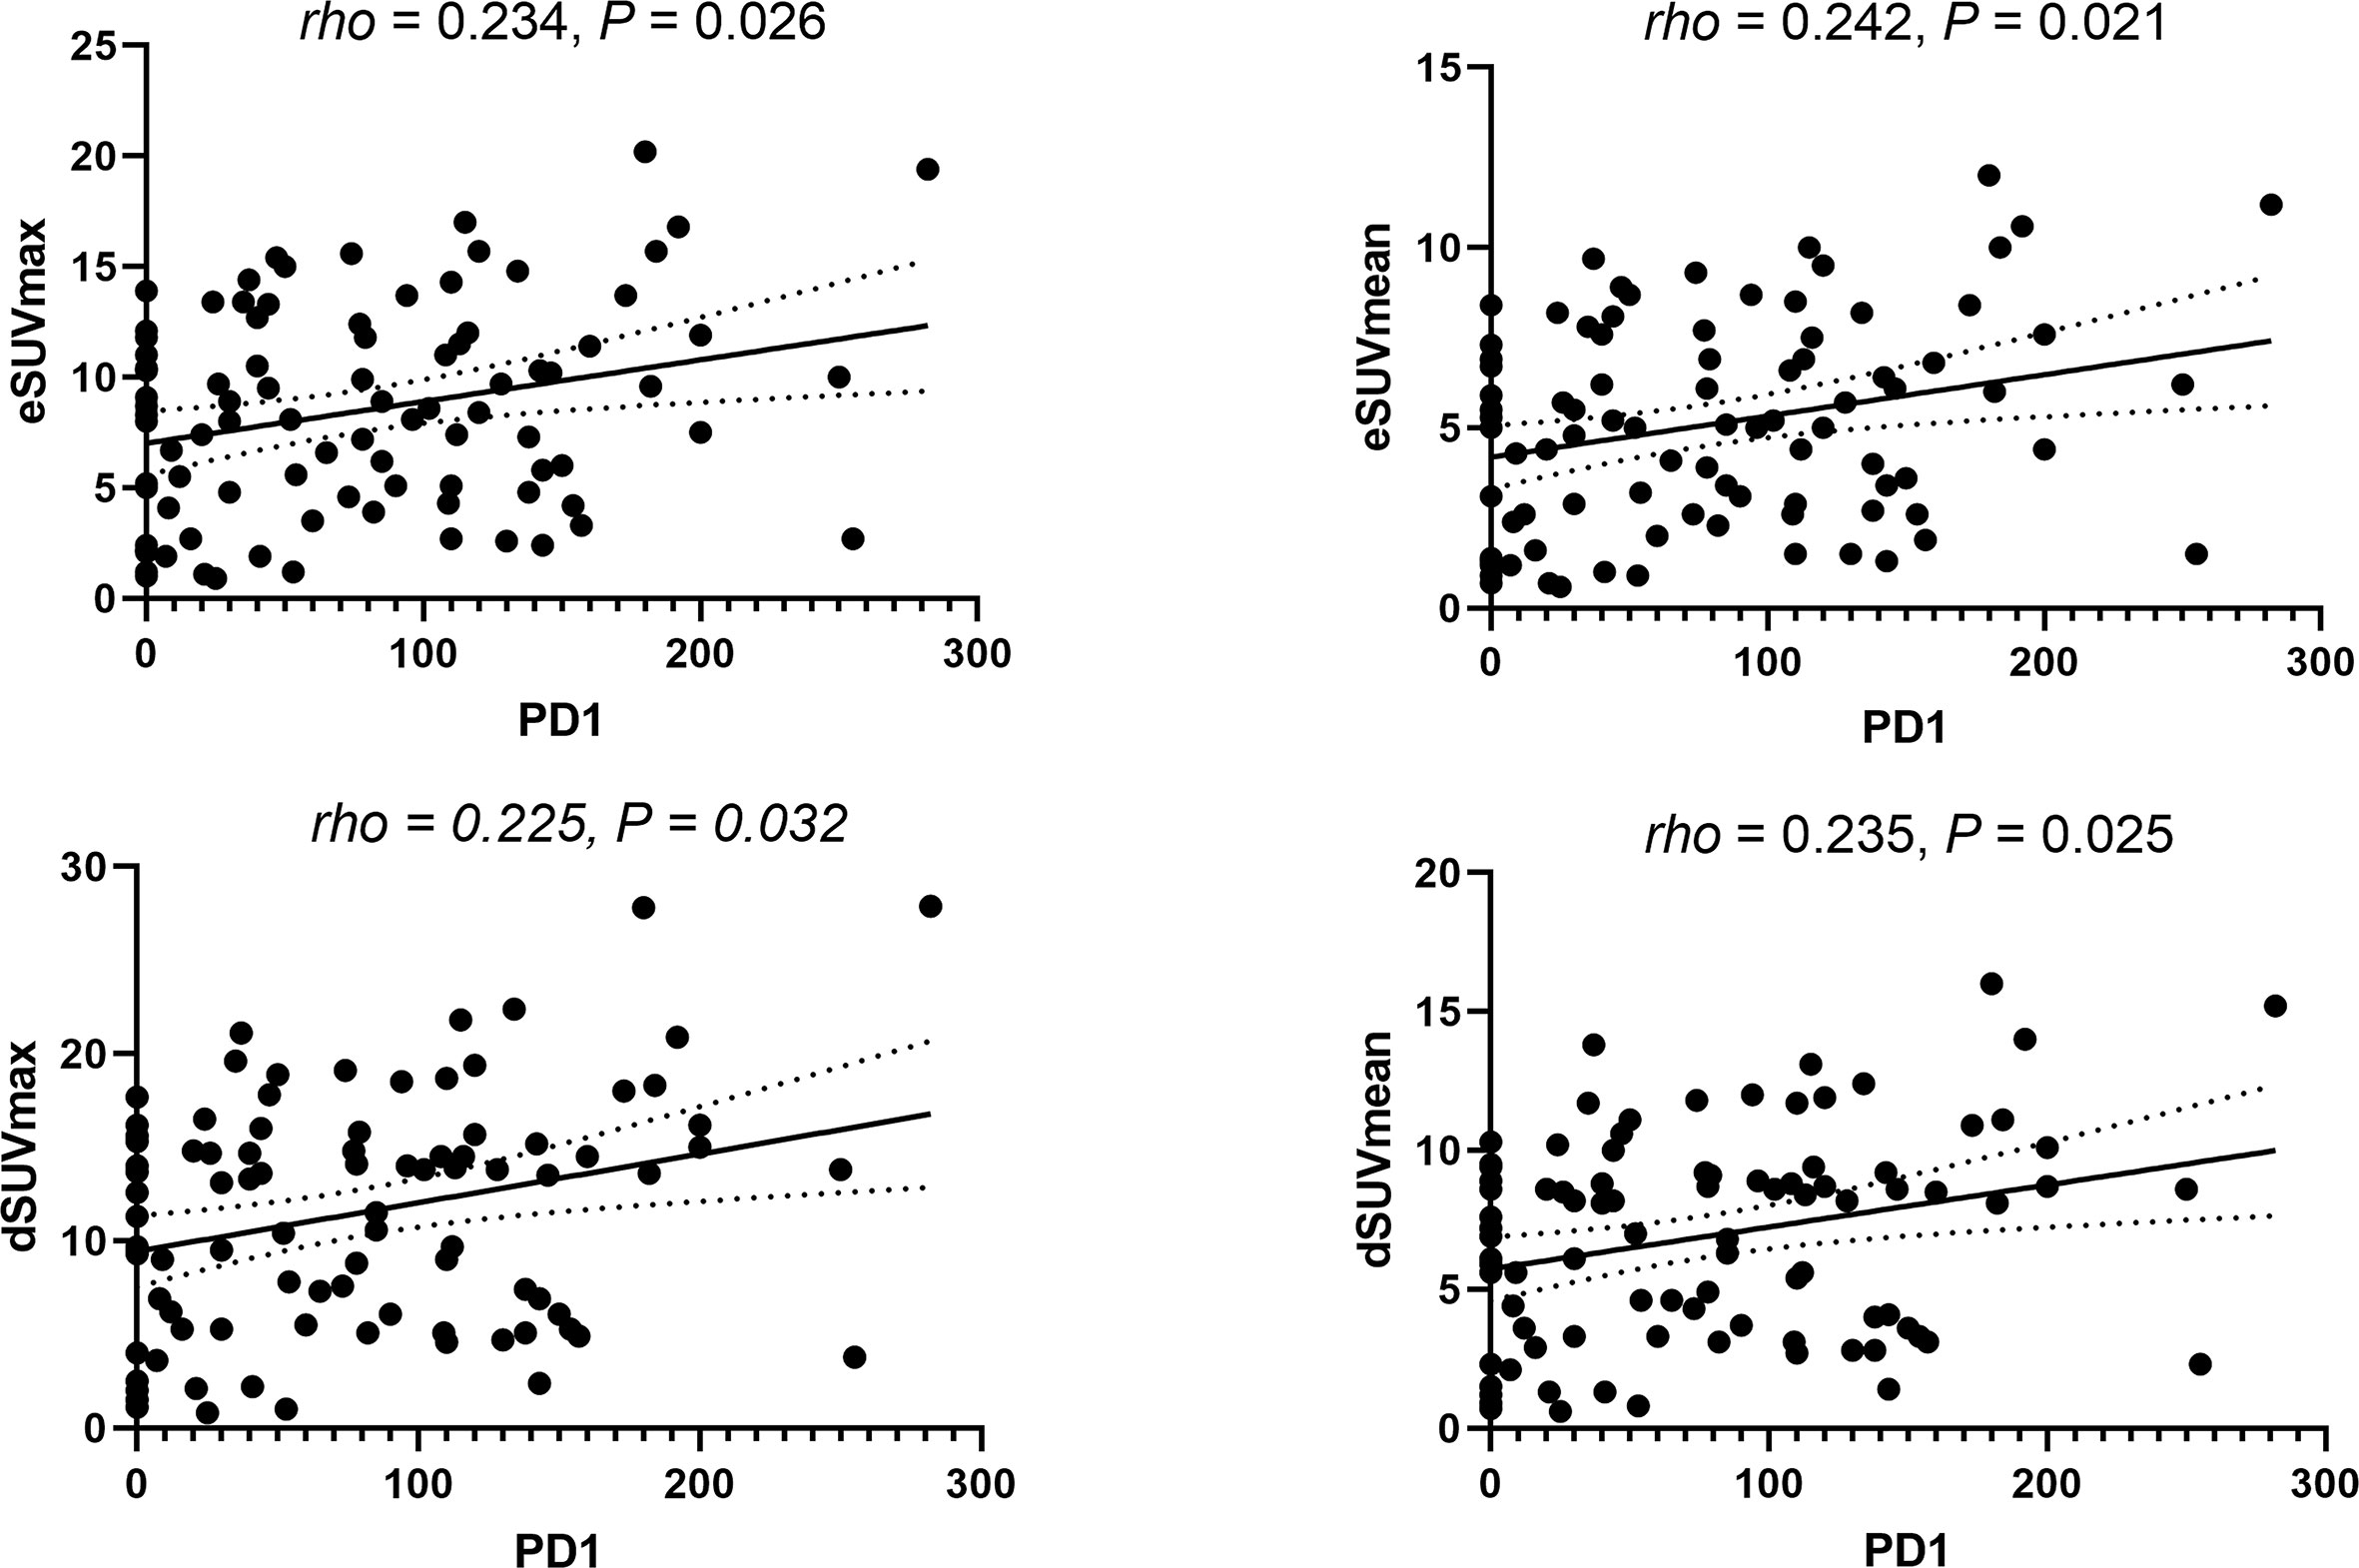
Figure 3 Correlations between metabolic parameters and PD-1 expression.
Correlations Between Different TMITs and MPs on DTP FDG PET
Figure 4 showed that most MPs were significantly different between TMIT I and other immune types (TMIT II, III, IV) respectively. Meanwhile, the least p value was shown in TMIT I vs II, increasing gradually in TIMT I vs IV and TIMT I vs III. Moreover, TMIT I tumors exhibited higher eSUVmax, eSUVmean, eTLG, dSUVmax, dSUVmean, dTLG, ΔSUVmax, ΔSUVmean and ΔTLG (p = 0.0001, < 0.0001, 0.0453, < 0.0001, <0.0001, 0.0231, 0.0009, 0.0009, 0.0144) than other types together (TMIT II+III+IV). Figure 5 showed a representative patient with a TMIT-I tumor exhibited hypermetabolic tumors on DTP PET, characterized by high expression of PD-L1 and high density of PD-1, CD8+ TILs. Of the nine metabolic features above, eSUVmax, eSUVmean, eTLG, dSUVmax and ΔTLG were selected in the LASSO model with 10-fold cross-validation (Figure 6). The Meta-Sig (metabolic signature) was constructed as follows:

Figure 4 The differences of metabolic parameters (MPs) according to different tumor microenvironment immune types (TMITs). The MPs were significantly higher in TMIT I tumors than other immune types.
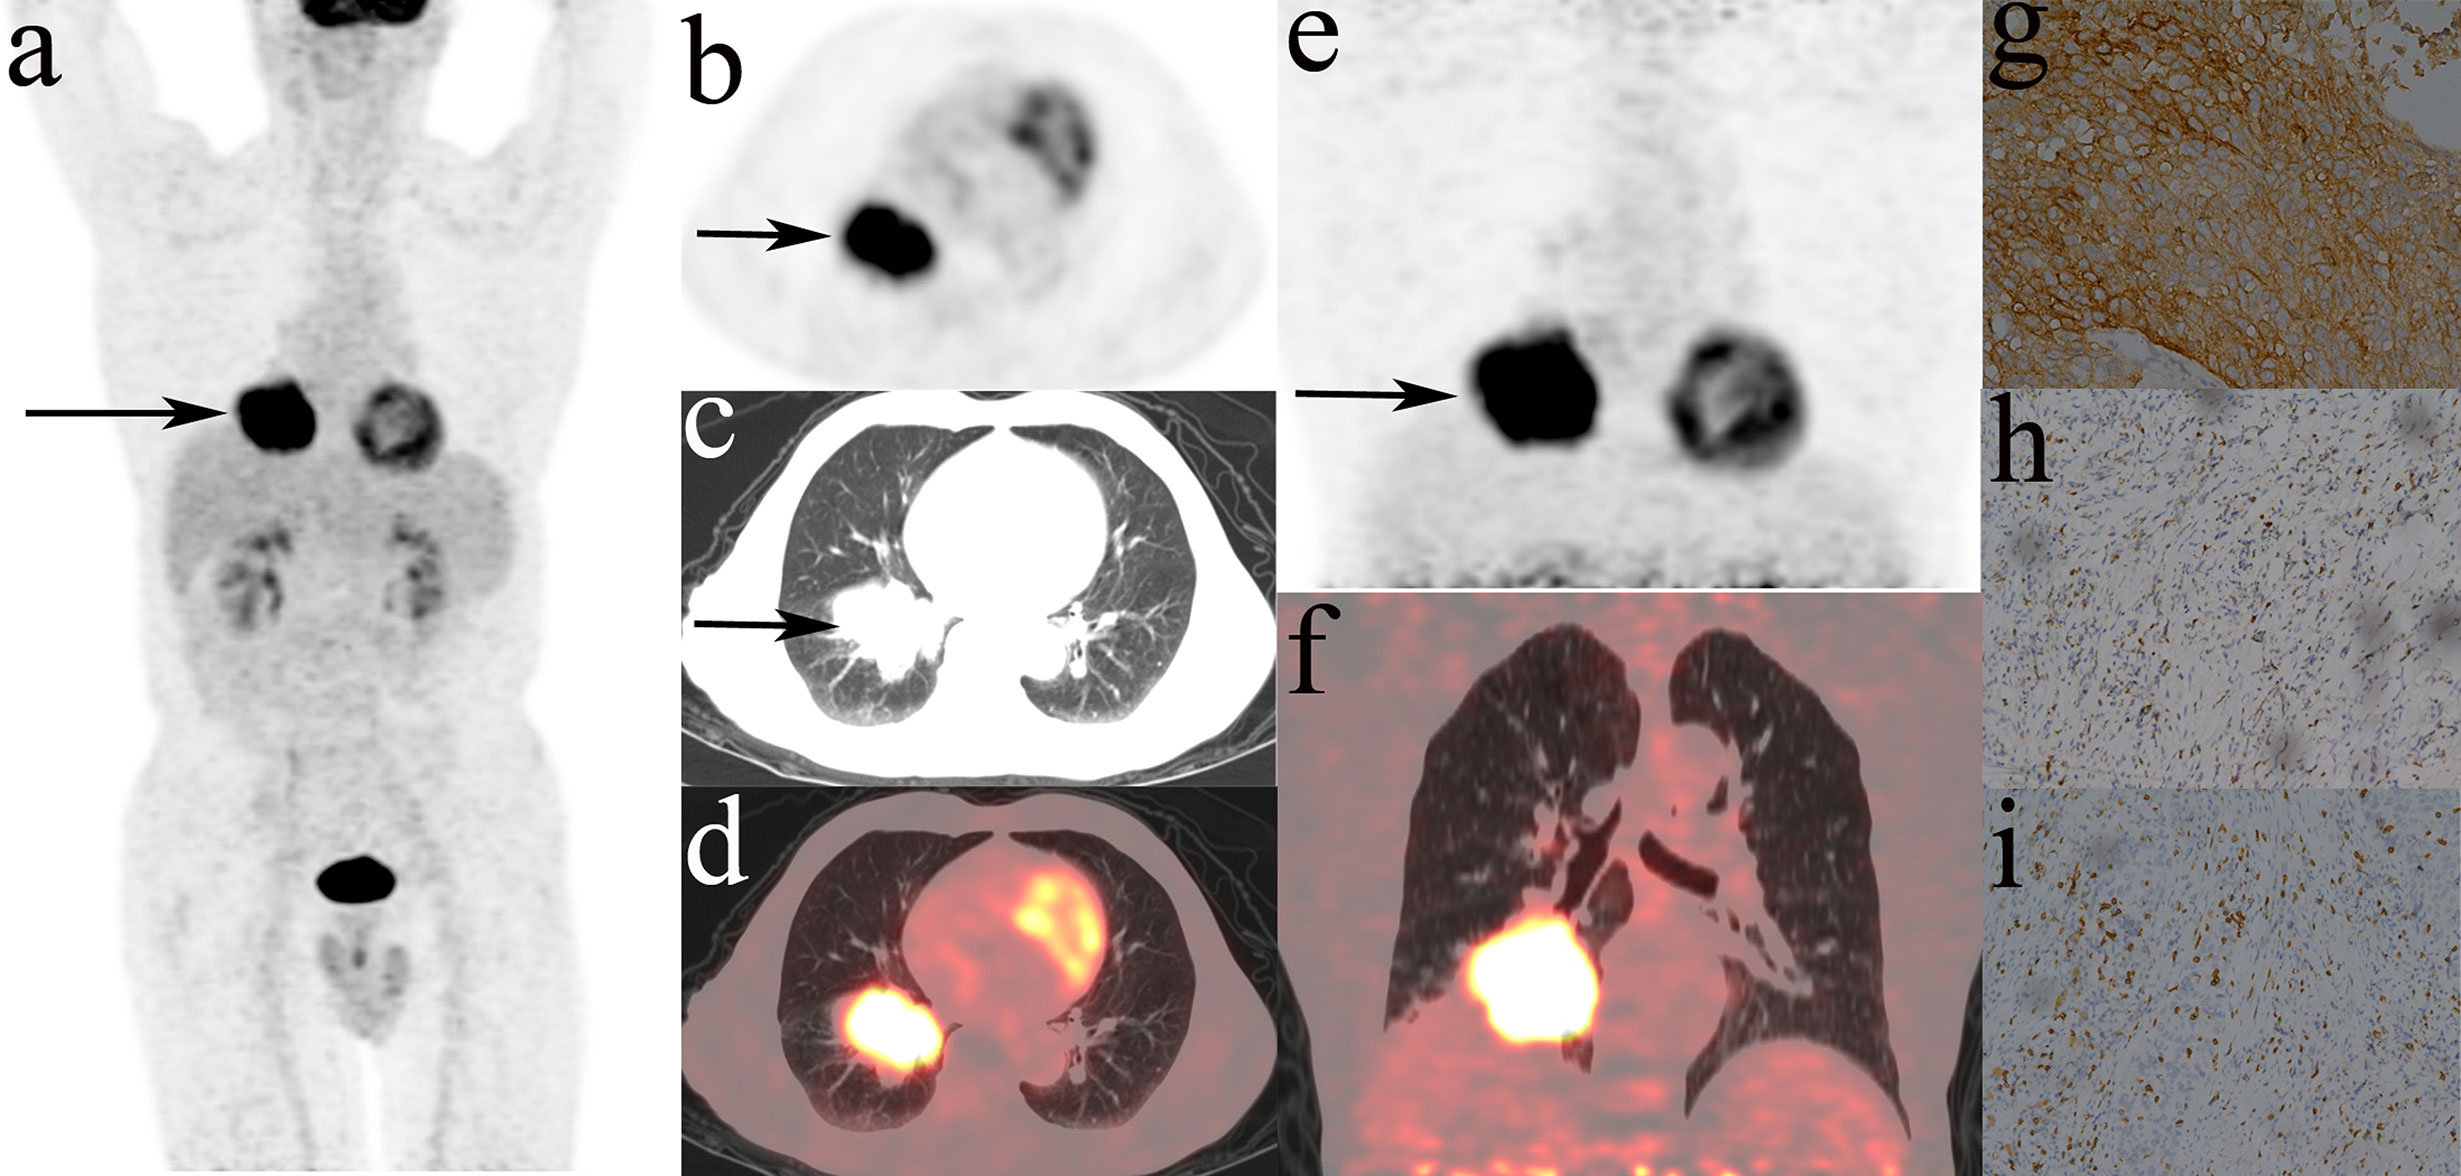
Figure 5 Representative DTP 18F-FDG PET/CT imagings of a 71y male patients, defined as TMIT I tumor. (A–D): early images, (E, F): delayed images, (A): MIP figure, (B–D): PET, lung window, PET/CT fusion image. A mass was in the lower lobe of right lung (arrow) with markedly increased radioactivity, eSUVmax: 20.3, eSUVmean: 12.0, eMTV: 52.9 cm3, eTLG: 634.8 g, dSUVmax: 27.7, dSUVmean: 16.0, dMTV: 49.16 cm3, dTLG: 786.56 g. The surgical pathology: moderately differentiated squamous cell carcinoma. (G) high PD-L1 expression. (H) PD-1 TIL high density. (I) CD8+ TIL high density.

Figure 6 The selection of optimal MPs using the LASSO algorithm. (A) The optimal tuning parameter (Lambda) in the LASSO model was selected using 10-fold cross-validation at the minimum of lambda. (B) LASSO coefficient profiles of the 9 parameters. According to the 10-fold cross-validation in (A), Five parameters with non-zero coefficients were included for metabolic signature construction.
Meta-Sig had a higher AUC value than the stand-alone MP, although the differences were not statistically significant according to the Delong test. When compared to eSUVmax (AUC: 0.775, sensitivity: 77.27%, specificity: 73.91%) and dSUVmax (AUC: 0.788, sensitivity: 86.36%, specificity: 65.22%), Meta-Sig enhanced the performance to predict TMIT I tumors with higher sensitivity or specificity (AUC: 0.818, sensitivity: 86.36%, specificity: 73.91%) (Table 3).
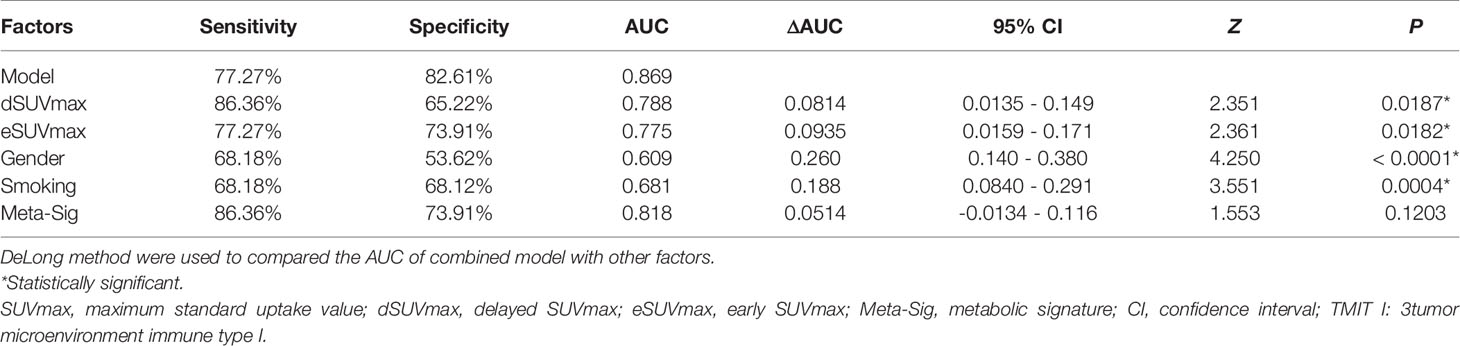
Table 3 Performance of the combined model and other factors according to TMIT I tumors.
With multivariate logistic regression analysis (using backward stepwise elimination method), the combined model was constructed based on the clinical and metabolic information. The formula was as follows:
The preferable model was assessed using ROC analyses and decision curve analysis (DCA). Compared to the combined model (AUC: 0.869, sensitivity: 77.27%, specificity: 82.61%), AUCs for eSUVmax, dSUVmax, gender, and smoking were relatively lower according to the Delong test (p = 0.0187, 0.0182, <0.0001, 0.0004) (Table 3; Figure 7). DCA for the combined model was shown in Figure 8. Using the combined model to predict TMIT I tumors added more benefit than eSUVmax or dSUVmax.
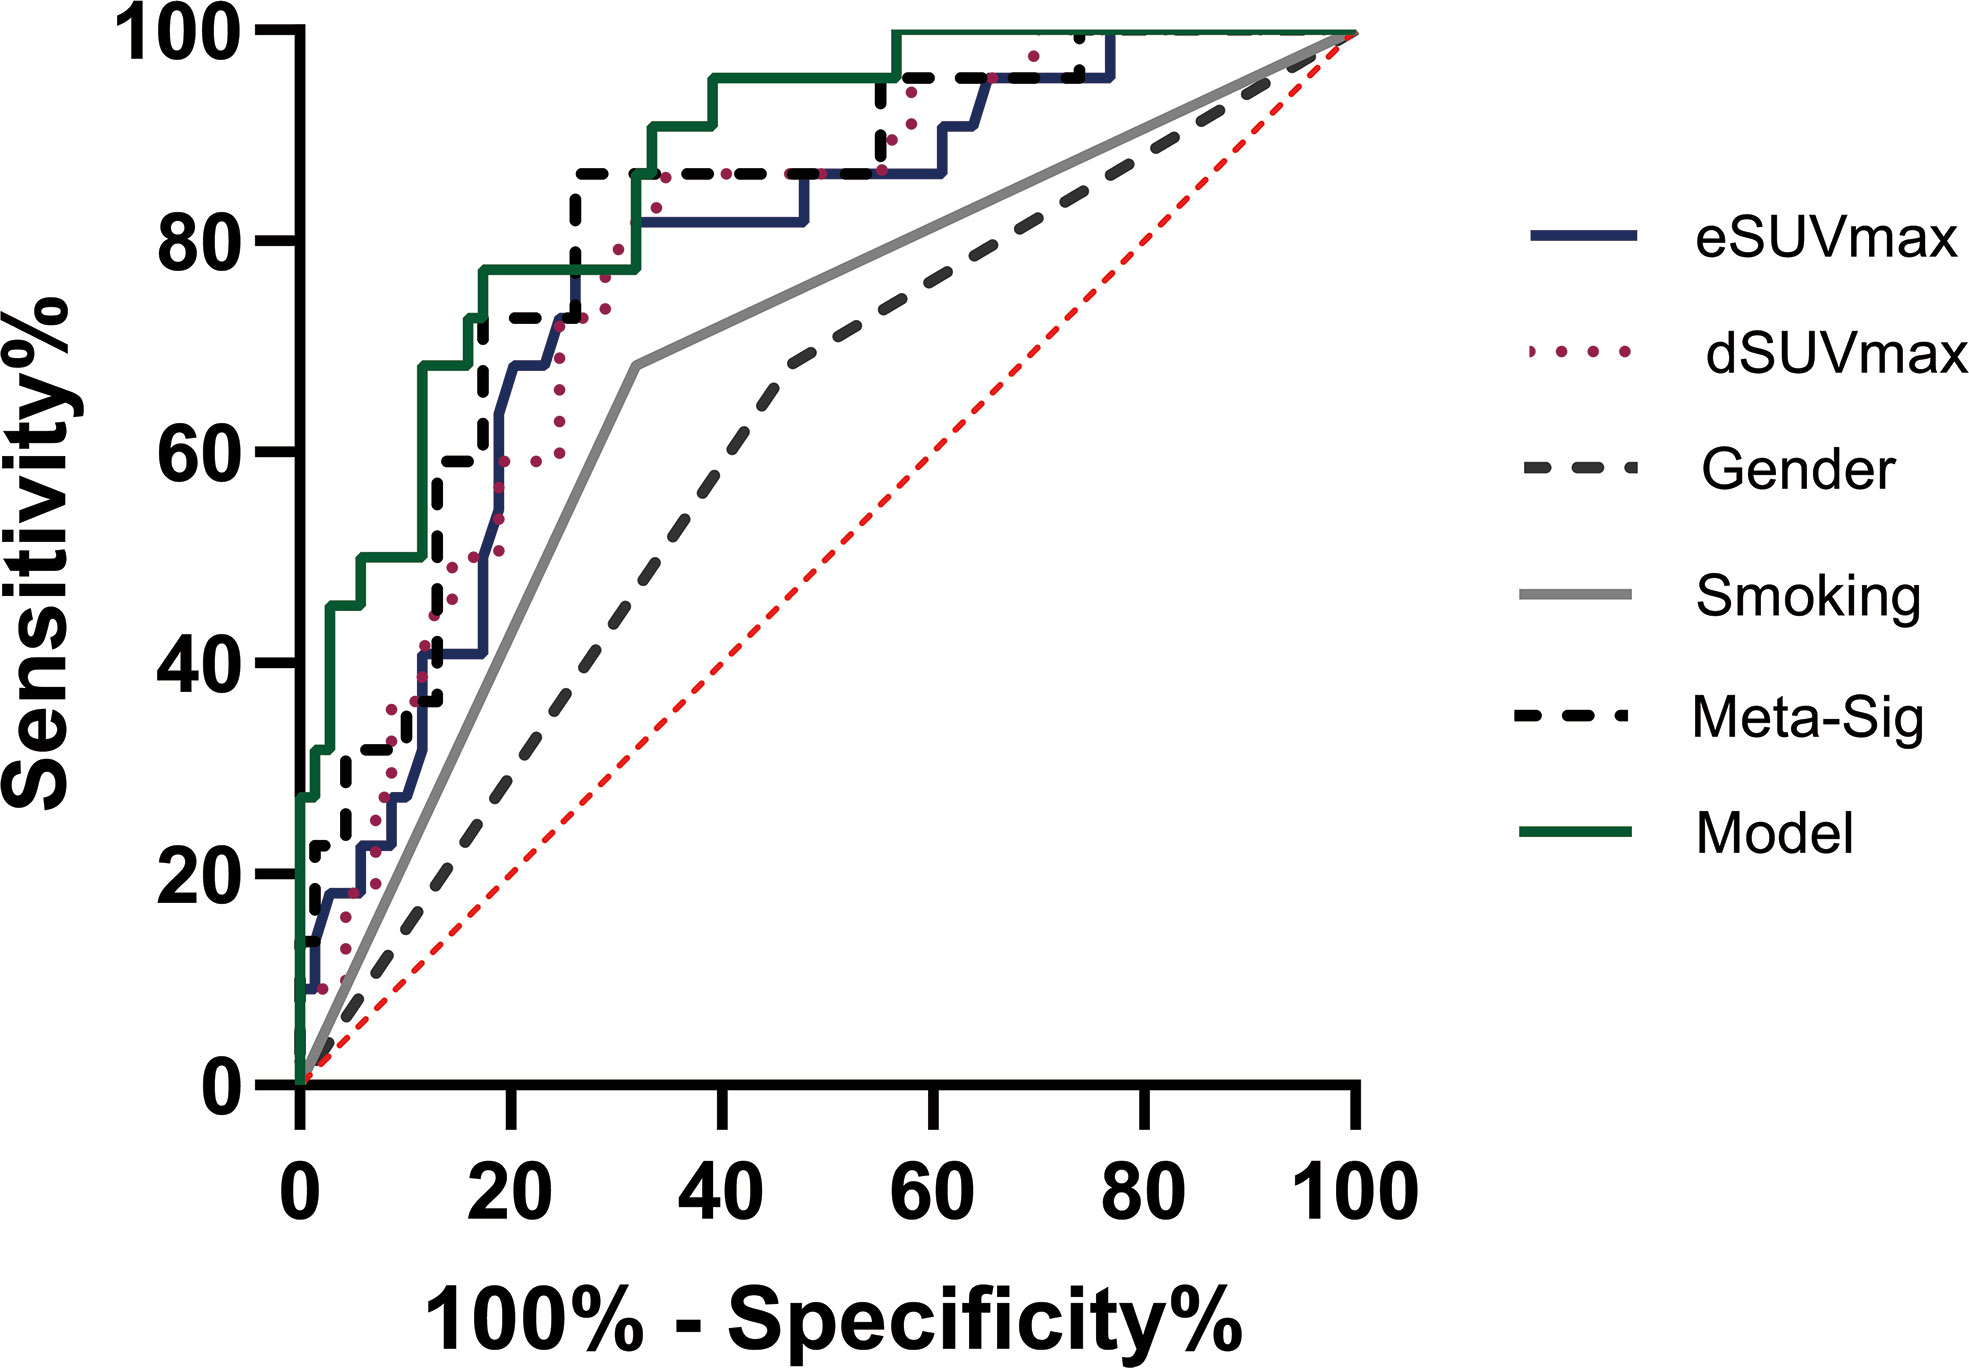
Figure 7 Representative image of receiver operating characteristic (ROC) curves for various factors in the analyses of TMIT I tumors. The combined model had the highest AUC than other factors.
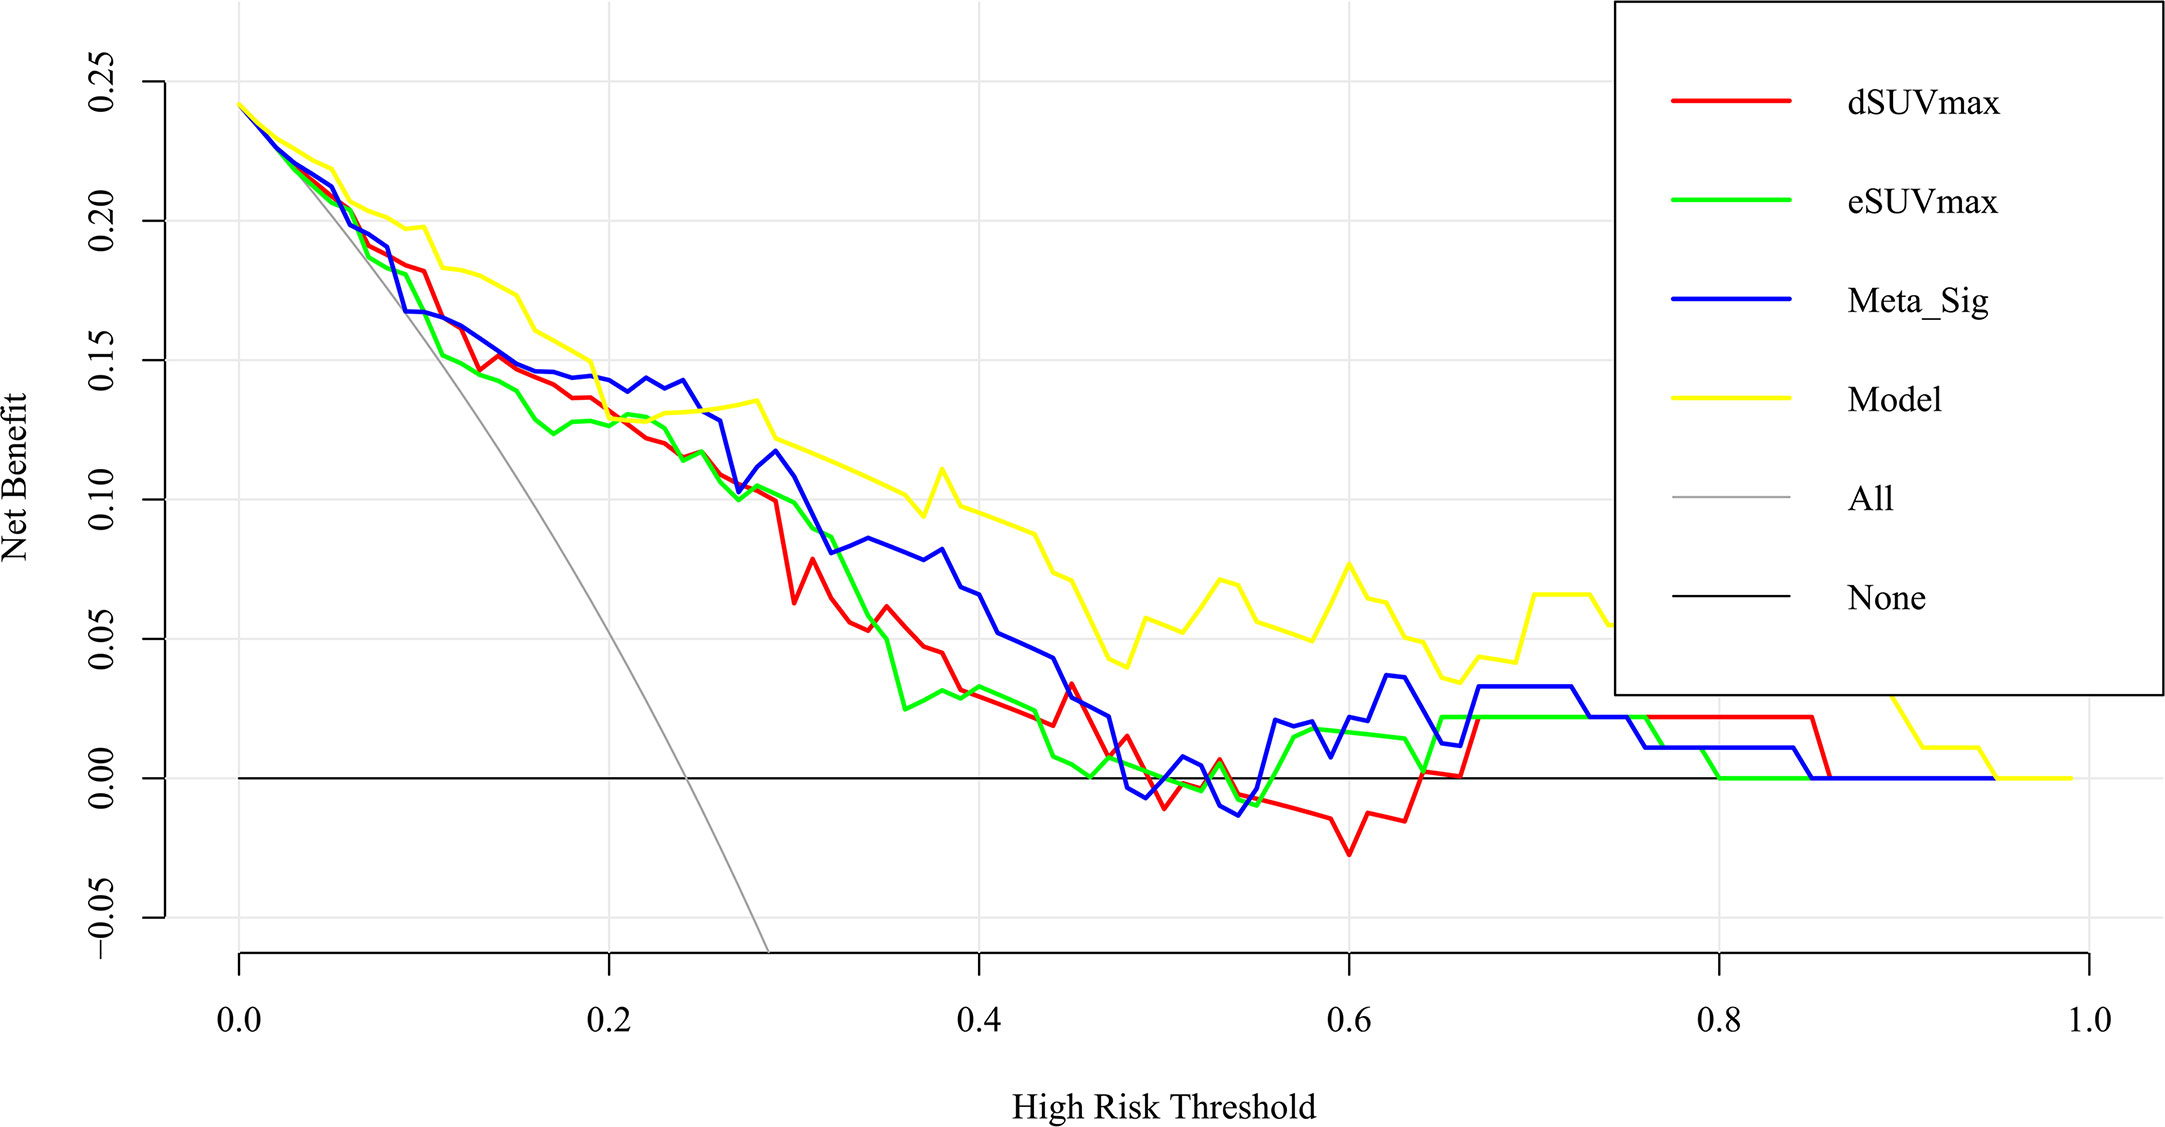
Figure 8 Decision curve analysis for the model and other factors. The y axis measures the net benefit. The x axis shows the threshold probability. The yellow line represents the combined model. The blue line represents the Meta-Sig only. The thin gray line represents the assumption that all patients were with TMIT I tumors. The black line represents the assumption that no patients have a TMIT I tumor.
Discussion
The past decade was marked by a revolution in the field of cancer treatment. Recently, antibody-based immunotherapy that modulates immune responses against tumors has been approved as first-line treatment option for selected advanced or metastatic lung cancer (20). However, the response of NSCLC patients to immunotherapy is affected by the TIME. Notably, patients with TMIT I tumors, regarded as immunologically ‘hot’, are most likely to benefit from ICI therapy. Our study provided a new insight into the underlying correlation between TIME types and DTP FDG PET imaging. To our knowledge, this is the first study to identify TMIT I type using DTP FDG PET scan in pretreated NSCLC patients.
In general, TMIT I tumors are characterized by somatic tumor mutations, PD-L1/PD-1 expression, and CD8+ TILs. In a previous report, TMIT I tumors were found to harbor significantly more somatic tumor mutations (6), therefore presenting more neoantigens (4). Endogenous CD8+ T cells can recognize these neoantigens, increase the TILs density, and trigger an immune response by the host (21). Meanwhile, glucose transporter 1 is reported to upregulate in these activated CD8+ T cells, leading to increased glucose uptake (8). Furthermore, during therapeutic PD-1 blockade, pre-treatment samples obtained from responders exhibited higher CD8+ cell densities compared to those from non-responders (22). According to results in our study, tumors with high infiltration of CD8+ T cells had a tendency for high FDG uptake in comparison with the TILs- tumors. It suggested that FDG PET could serve as a non-invasive tool to assess the tumor microenvironment, and might help to identify responders ahead of treatment. However, CD8+ TILs alone had low correlations (p = 0.044, 0.047) with MPs in our work, proving the necessity of simultaneously interpreting multiple immune biomarkers within the complex system of tumor immune microenvironment. Indeed, there was a metabolic competition between tumors and immune cells. The high levels of glycolysis within tumor cells consumed extracellular glucose, which in turn impaired the glycolysis in T cells (23). We hypothesized that the FDG uptake of TMIT I tumors depends primarily on PD-L1+ tumor cells rather than CD8+ T cells. Chang et al. (24) reported that PD-L1 expression maintained Akt/mTOR signaling, which in turn promoted metabolic pathway through the translation of glycolysis enzymes. Lopci et al. (9) first investigated the correlation between PD-L1 expression and FDG uptake in NSCLC. Although no correlation was found in this particular study, the negative results may arise from the small size of studied patients. Later, Takada et al. (10) found a positive correlation between FDG uptake with PD‐L1 expression in a larger group of patients. In addition to PD-L1 expression and CD8+ TILs, PD-1 expression is also a biomarker of ICIs treatment. PD-1 expression was significantly higher in TMIT I tumors than type II and III, probably because PD-1 is of upregulated in CD8+ TILs, where the binding of PD-1 and its ligand PD-L1 can inhibit a cytotoxic T-cell response.
CD8+ TILs and the tumor immune microenvironment may also affect patients’ responses to immunotherapy, since not all patients with positive PD-L1 expression respond well. We hereby categorized the tumor immune microenvironment into four subgroups to assist the stratification of NSCLC patients. We strived to identify responders from the perspective of different tumor immune types, and for the first time established the correlation between dynamic glucose metabolism and TMIT-I tumors. One remarkable finding in the present study was that TMIT I tumors present higher MP values than other types (TMIT II, III, IV), and the smallest p value was shown between TMIT I vs II. Contrary to TMIT I tumors, TMIT II tumors, regarded as “cold” tumors, lack tumors cells expressing PD-L1 and CD8+ T cells. While TMIT I tumors are most likely to benefit from single-agent anti-PD-1/L1 blockade, TMIT II tumors had significantly worse prognosis due to the lack of detectable immune responses (4). The semi-quantification of MPs on DTP FDG PET was a decision support methodology for the complex clinical decisions to differentiate TMIT I and II tumors. Compared to TMIT I vs II, the p values increased gradually in TMIT I vs IV. TMIT IV tumors are enriched with CD8+ TILs. However, the lower uptake FDG may be attributed to PD-L1 negativity. Interestingly, TMIT III tumors also showed relatively lower FDG uptake than TMIT I, and the p value increased even further in TMIT I vs III. Since TMIT III tumors were also characterized by PD-L1 positivity like TMIT I tumors, CD8+ T cells have less effect on the FDG uptake of TMIT III tumors. It should be noted that only a low proportion of tumors in this study belonged to TMIT III (12.1%, 11/91). A similarly low occurrence of TMIT III was also observed in melanoma. (2%) (25). Nevertheless, the presence of TMIT III tumors indicates that not all patients with PD-L1 positive expression respond well to the ICIs. Our work demonstrated the importance of highlighting this subset of patients as probable non-responders to immunotherapy. The identification of different tumor immune types is meaningful from the perspective of clinical practice, since using the same strategy for all patients will be inefficient, costly, and unreasonable (26).
For the identification of TMIT I tumors, DTP FDG PET not only provided a non-invasive work-up, but also improved the capability for pre-selecting patients that are likely responsive to ICIs. Cancer cells continuously uptake 18F-FDG and trap them intracellularly in the form of 18F-FDG-6-phosphate (27). In contrast, in benign tissue, the uptake of 18F-FDG decreases or plateaued after reaching a maximum within 30 min of FDG administration. Although it is generally accepted that FDG-PET/CT images obtained during the delayed phase reflect the dynamics of tumor glucose metabolism, our study revealed that eSUVmax and dSUVmax had similarly unsatisfactory performances for the assessment of TMIT I tumors since the sensitivity of eSUVmax (77.27%) and specificity of dSUVmax (65.22%) were relatively low when compared with each other. The application of DTP FDG PET provided a new perspective for the assessment of tumor immune microenvironment, and can make up the deficiencies of a single MP. Compared with the MP at a single time point, DTP PET exhibited improved sensitivity (Meta-Sig vs eSUVmax: 86.36% vs 77.27%) and specificity (Meta-Sig vs dSUVmax: 73.91% vs 65.22%). Therefore, DTP FDG PET might reduce the false positive rates on early scan and false negative rates on delayed scan, which would help to facilitate accurate treatment strategies and reduce unnecessary medical cost. Furthermore, the combined model achieved a performance for the identification of TMIT I tumors with AUC of 0.869, better than that of Meta-Sig (0.818). As confirmed by DCA, the combined model had a better clinical usefulness than Meta-Sig at a wide range of threshold probability (except the range of 20%~25%).
This present study also has a couple of limitations. First, this study was a single institutional retrospective study with a limit number of subjects. Second, further understanding of the complex and volatile TIME is still needed because TIME consists of various cells types, which display metabolic interactions in the tumor microenvironment. Third, as the analysis of histology slices was performed with a semi-quantitative method in the present study, some clustering analyses are needed to make it more quantitative. The clustering analysis may allocate the cohort into distinct and discrete subgroups, and clearly delineate patients who are suitable for immunotherapy. Fourth, none of the patients in the retrospective cohort received immunotherapy within one month of the 18F-FDG PET/CT scan. Therefore, it is unknown whether the patients with significantly changed MPs could benefit from immunotherapy. A recent study on 89 patients with advanced or recurrent NSCLC showed that patients with higher baseline SUVmax values had higher response rate to immunotherapy than those with lower baseline SUVmax values (28). Future studies are warranted to enroll patients that receive subsequent 18F-FDG PET/CT and immunotherapy within one month of each other, and to evaluate whether the patients with significantly changed MPs could benefit from immunotherapy.
Conclusion
High glucose metabolism on DTP 18F-FDG PET is relevant to TMIT-I tumors, and the Meta-Sig and combined model based on clinical and metabolic information could improve the performance of identifying patients who may respond to ICIs treatment.
Data Availability Statement
The original contributions presented in the study are included in the article/supplementary material. Further inquiries can be directed to the corresponding authors.
Ethics Statement
All procedures performed in studies involving human participants were approved by the Institutional Review Board of Tongji Hospital, Tongji Medical College, Huazhong University of Science and Technology (TJ-IRB 20181202) and in accordance with the principles of the 1964 Declaration of Helsinki and its later amendments or comparable ethical standards. This article does not describe any studies with animals performed by any of the authors.
Author Contributions
XZ, JZ and SZ contributed to the conception and design of the study. JZ, SC, DK, DL, LC and CL carried out the research. JZ, SZ, JY and XZ performed the data analysis. JZ wrote the first draft of the manuscript. XZ, SZ, DK and JY made the comments. XZ and SZ critically reviewed and revised the manuscript. All authors contributed to the article and approved the submitted version.
Funding
This work was supported by the National Natural Science Foundation of China (81671718, 81873903, 91959119), and Natural Science Foundation of Hubei Province of China (2016CFB687).
Conflict of Interest
The authors declare that the research was conducted in the absence of any commercial or financial relationships that could be construed as a potential conflict of interest.
References
1. Chen W, Zheng R, Baade PD, Zhang S, Zeng H, Bray F, et al. Cancer statistics in China, 2015. CA Cancer J Clin (2016) 66(2):115–32. doi: 10.3322/caac.21338
2. Zhang M, Yang J, Hua W, Li Z, Xu Z, Qian Q. Monitoring checkpoint inhibitors: predictive biomarkers in immunotherapy. Front Med (2019) 13(1):32–44. doi: 10.1007/s11684-018-0678-0
3. Lin Z, Gu J, Cui X, Huang L, Li S, Feng J, et al. Deciphering Microenvironment of NSCLC based on CD8+ TIL Density and PD-1/PD-L1 Expression. J Cancer (2019) 10(1):211–22. doi: 10.7150/jca.26444
4. Teng MW, Ngiow SF, Ribas A, Smyth MJ. Classifying Cancers Based on T-cell Infiltration and PD-L1. Cancer Res (2015) 75(11):2139–45. doi: 10.1158/0008-5472.CAN-15-0255
5. Binnewies M, Roberts EW, Kersten K, Chan V, Fearon DF, Merad M, et al. Understanding the tumor immune microenvironment (TIME) for effective therapy. Nat Med (2018) 24(5):541–50. doi: 10.1038/s41591-018-0014-x
6. Ock C-Y, Keam B, Kim S, Lee J-S, Kim M, Kim TM, et al. Pan-Cancer Immunogenomic Perspective on the Tumor Microenvironment Based on PD-L1 and CD8 T-Cell Infiltration. Clin Cancer Res (2016) 22(9):2261–70. doi: 10.1158/1078-0432.ccr-15-2834
7. Takeuchi S, Khiewvan B, Fox PS, Swisher SG, Rohren EM, Bassett RL Jr., et al. Impact of initial PET/CT staging in terms of clinical stage, management plan, and prognosis in 592 patients with non-small-cell lung cancer. Eur J Nucl Med Mol Imaging (2014) 41(5):906–14. doi: 10.1007/s00259-013-2672-8
8. Scharping NE, Delgoffe GM. Tumor Microenvironment Metabolism: A New Checkpoint for Anti-Tumor Immunity. Vaccines (Basel) (2016) 4(4):46. doi: 10.3390/vaccines4040046
9. Lopci E, Toschi L, Grizzi F, Rahal D, Olivari L, Castino GF, et al. Correlation of metabolic information on FDG-PET with tissue expression of immune markers in patients with non-small cell lung cancer (NSCLC) who are candidates for upfront surgery. Eur J Nucl Med Mol Imaging (2016) 43(11):1954–61. doi: 10.1007/s00259-016-3425-2
10. Takada K, Toyokawa G, Okamoto T, Baba S, Kozuma Y, Matsubara T, et al. Metabolic characteristics of programmed cell death-ligand 1-expressing lung cancer on (18) F-fluorodeoxyglucose positron emission tomography/computed tomography. Cancer Med (2017) 6(11):2552–61. doi: 10.1002/cam4.1215
11. Takada K, Toyokawa G, Tagawa T, Kohashi K, Akamine T, Takamori S, et al. Association Between PD-L1 Expression and Metabolic Activity on (18)F-FDG PET/CT in Patients with Small-sized Lung Cancer. Anticancer Res (2017) 37(12):7073–82. doi: 10.21873/anticanres.12180
12. Zhang M, Wang D, Sun Q, Pu H, Wang Y, Zhao S, et al. Prognostic significance of PD-L1 expression and (18)F-FDG PET/CT in surgical pulmonary squamous cell carcinoma. Oncotarget (2017) 8(31):51630–40. doi: 10.18632/oncotarget.18257
13. Kasahara N, Kaira K, Bao P, Higuchi T, Arisaka Y, Erkhem-Ochir B, et al. Correlation of tumor-related immunity with 18F-FDG-PET in pulmonary squamous-cell carcinoma. Lung Cancer (2018) 119:71–7. doi: 10.1016/j.lungcan.2018.03.001
14. Kaira K, Shimizu K, Kitahara S, Yajima T, Atsumi J, Kosaka T, et al. 2-Deoxy-2-[fluorine-18] fluoro-d-glucose uptake on positron emission tomography is associated with programmed death ligand-1 expression in patients with pulmonary adenocarcinoma. Eur J Cancer (2018) 101:181–90. doi: 10.1016/j.ejca.2018.06.022
15. Chen R, Zhou X, Liu J, Huang G. Relationship between the expression of PD-1/PD-L1 and (18)F-FDG uptake in bladder cancer. Eur J Nucl Med Mol Imaging (2019) 46(4):848–54. doi: 10.1007/s00259-018-4208-8
16. Choi SH, Chang JS, Koo JS, Park JW, Sohn JH, Keum KC, et al. Differential Prognostic Impact of Strong PD-L1 Expression and 18F-FDG Uptake in Triple-negative Breast Cancer. Am J Clin Oncol (2018) 4(11):1049–57. doi: 10.1097/coc.0000000000000426
17. Castino GF, Cortese N, Capretti G, Serio S, Di Caro G, Mineri R, et al. Spatial distribution of B cells predicts prognosis in human pancreatic adenocarcinoma. Oncoimmunology (2016) 5(4):e1085147. doi: 10.1080/2162402X.2015.1085147
18. Koh J, Go H, Keam B, Kim MY, Nam SJ, Kim TM, et al. Clinicopathologic analysis of programmed cell death-1 and programmed cell death-ligand 1 and 2 expressions in pulmonary adenocarcinoma: comparison with histology and driver oncogenic alteration status. Mod Pathol (2015) 28(9):1154–66. doi: 10.1038/modpathol.2015.63
19. Koh J, Nam SK, Roh H, Kim J, Lee BC, Kim JW, et al. Somatic mutational profiles of stage II and III gastric cancer according to tumor microenvironment immune type. Genes Chromosomes Cancer (2019) 58(1):12–22. doi: 10.1002/gcc.22683
20. Ettinger DS, Aisner DL, Wood DE, Akerley W, Bauman J, Chang JY, et al. NCCN Guidelines Insights: Non-Small Cell Lung Cancer, Version 5.2018. J Natl Compr Canc Netw (2018) 16(7):807–21. doi: 10.6004/jnccn.2018.0062
21. Baretti M, Le DT. DNA mismatch repair in cancer. Pharmacol Ther (2018) 189:45–62. doi: 10.1016/j.pharmthera.2018.04.004
22. Tumeh PC, Harview CL, Yearley JH, Shintaku IP, Taylor EJ, Robert L, et al. PD-1 blockade induces responses by inhibiting adaptive immune resistance. Nature (2014) 515(7528):568–71. doi: 10.1038/nature13954
23. Sukumar M, Roychoudhuri R, Restifo NP. Nutrient Competition: A New Axis of Tumor Immunosuppression. Cell (2015) 162(6):1206–8. doi: 10.1016/j.cell.2015.08.064
24. Chang CH, Qiu J, O’Sullivan D, Buck MD, Noguchi T, Curtis JD, et al. Metabolic Competition in the Tumor Microenvironment Is a Driver of Cancer Progression. Cell (2015) 162(6):1229–41. doi: 10.1016/j.cell.2015.08.016
25. Taube JM, Anders RA, Young GD, Xu H, Sharma R, McMiller TL, et al. Colocalization of inflammatory response with B7-h1 expression in human melanocytic lesions supports an adaptive resistance mechanism of immune escape. Sci Transl Med (2012) 4(127):127ra37. doi: 10.1126/scitranslmed.3003689
26. Sanmamed M F, Chen L. A Paradigm Shift in Cancer Immunotherapy: From Enhancement to Normalization. Cell (2018) 175(2):313–26. doi: 10.1016/j.cell.2018.09.035
27. Parghane R V, Basu S. Dual-time point (18)F-FDG-PET and PET/CT for Differentiating Benign From Malignant Musculoskeletal Lesions: Opportunities and Limitations. Semin Nucl Med (2017) 47(4):373–91. doi: 10.1053/j.semnuclmed.2017.02.009
Keywords: DTP 18F-FDG PET, PD-L1, tumor microenvironment immune types, NSCLC, metabolic parameters
Citation: Zhou J, Zou S, Cheng S, Kuang D, Li D, Chen L, Liu C, Yan J and Zhu X (2021) Correlation Between Dual-Time-Point FDG PET and Tumor Microenvironment Immune Types in Non-Small Cell Lung Cancer. Front. Oncol. 11:559623. doi: 10.3389/fonc.2021.559623
Received: 06 May 2020; Accepted: 01 March 2021;
Published: 18 March 2021.
Edited by:
Georgios S. Limouris, National and Kapodistrian University of Athens, GreeceReviewed by:
Kuangyu Shi, University of Bern, SwitzerlandKatsuhiko Shimizu, Kawasaki Medical School Hospital, Japan
Lucia Nogova, University of Cologne, Germany
Copyright © 2021 Zhou, Zou, Cheng, Kuang, Li, Chen, Liu, Yan and Zhu. This is an open-access article distributed under the terms of the Creative Commons Attribution License (CC BY). The use, distribution or reproduction in other forums is permitted, provided the original author(s) and the copyright owner(s) are credited and that the original publication in this journal is cited, in accordance with accepted academic practice. No use, distribution or reproduction is permitted which does not comply with these terms.
*Correspondence: Xiaohua Zhu, ZXZhemh1QHZpcC5zaW5hLmNvbQ==; Jianhua Yan, amlhbmh1YS55YW5AZ21haWwuY29t
†These authors have contributed equally to this work