
95% of researchers rate our articles as excellent or good
Learn more about the work of our research integrity team to safeguard the quality of each article we publish.
Find out more
ORIGINAL RESEARCH article
Front. Oncol. , 26 April 2021
Sec. Head and Neck Cancer
Volume 11 - 2021 | https://doi.org/10.3389/fonc.2021.534838
This article is part of the Research Topic Mechanisms of Resistance in Head and Neck Cancers View all 16 articles
 Feng Xu1,2†
 Huan Xu2,3†
 Zixiong Li2,4
 Yuanyuan Huang2,3
 Xiaoling Huang1,2
 Yangyi Li1,2
 Xiaohe Zheng1,2
 Yongsong Chen2,5*
 Ling Lin2,3*
While increased glycolysis has been identified as a cancer marker and attracted much attention in thyroid cancer (THCA), the prognostic role of it remains to be further elucidated. Here we aimed to determine a specific glycolysis-associated risk model to predict THCA patients' survival. We also explored the interaction between this signature and tumor immune microenvironment and performed drug screening to identify specific drugs targeting the glycolysis-associated signature. Six genes (CHST6, POM121C, PPFIA4, STC1, TGFBI, and FBP2) comprised the specific model, which was an independent prognostic indicator in THCA patients determined by univariate, LASSO and multivariate Cox regression analyses. The receiver operating characteristic (ROC) curve analysis confirmed the excellent clinical performance of the prognostic signature. According to the specific gene signature, patients were categorized into high- and low-risk subgroups. The high-risk group was characterized by decreased immune score and elevated tumor purity, as well as worser survival prognosis compared to the low-risk group. We also validated the expression of these genes in clinical samples and in-vitro experiments. Lastly, we identified potential drugs targeting the glycolysis-associated signature. The derived glycolysis-related signature is an independent prognostic biomarker for THCA patients and might be used as an efficacy of biomarker for drug-sensitivity prediction.
Thyroid cancer (THCA) is one of the most frequently diagnosed malignancies of the endocrine system worldwide, and this cancer incidence rate is still on the rise (1–3). The average annual incidence rate of THCA is more than 6%, which is the highest among all cancers (4). Although THCA is considered to be a curable disease after standard treatment, tumor recurrence, and distant metastasis result in unsatisfactory clinical results in a small proportion of patients. Thus, there is a real need to investigate novel and effective factors, which may predict THCA patient prognosis more accurately.
Warburg effect, also known as aerobic glycolysis, is a phenomenon whereby various types of cancer cells characterize by excessive conversion of glucose to lactate for their energy substrate regardless of oxygen levels (5). Growing evidence indicates that accelerated glycolysis in cancers influence the therapy outcome that most cancers show significant increases in glucose uptake when compared with adjacent normal tissue (6–8). Moreover, increased glycolysis has been reported to promote angiogenesis and invasive cancer growth (9). Lactate, produced by glycolytic tumor cells, plays crucial roles in the suppression of anticancer immune cells and then promotes the tumor recurrence following anticancer therapies (10). The high accumulation of lactate in tumor microenvironment (TME), which lowers extracellular pH to 6.0–6.5, blocks the function and proliferation rate of T cells (11). High concentrations of lactate in TME affects antitumor therapy, which leads to the suggestion that inhibiting glycolytic pathway, and therefore lactate production may provide an effective and potential strategy to enhance anticancer agents.
In our study, we established a glycolysis-related gene model, which may be a robust prognostic indicator for clinical use. In addition, by applying ESTIMATE algorithm, we gained insight into the interaction of glycolysis-related gene signature with TME. In-vivo and in-vitro experiments confirmed the influence of glycolysis-related gene on tumor growth. Finally, we discovered candidate compounds targeting the glycolysis-related gene signature through the publicly available drug sensitivity database.
All RNA-seq expression profile and the clinical data for THCA patients were obtained from the Cancer Genome Atlas (TCGA) database. Our study meets TCGA's publication guidelines. Glycolysis-associated gene sets were downloaded from publicly available gene set databases-Molecular Signatures Database v7.0, namely three different gene sets (KEGG_GLYCOLYSIS_GLUCONEOGENESIS, HALLMARK_GLYCOLYSIS, and REACTOME_GLYCOLYSIS). These gene sets are presented in the Supplementary Table 1.
We performed a univariate Cox regression analysis to consider the association between glycolysis-related gene expression level and THCA's over survival, and genes were identified significantly when the p < 0.05. After primary filtration, the least absolute shrinkage and selection operator (LASSO) logistic regression with ten-fold cross validation was conducted to reduce glycolysis-related genes for THCA patients by using R package “glmnet.” Finally, the glycolysis-related risk model was finally established by a multivariate Cox regression analysis to identify the prognostic value of specific gene signature as our study previously described (12). THCA patients were then divided into high- and low-risk groups through the median score as a cutoff. The Kaplan-Meier method was applied to evaluate the significant difference of overall survival using “survival” R package between high- and low-risk groups. The receiver operating characteristic (ROC) analysis was applied to estimate the sensitivity and specificity of the prediction model.
The cBioPortal for cancer genomics provides visualization features and analyzes multidimensional cancer genomics data (13). We used the THCA (TCGA, Firehouse Legacy) dataset for genetic mutations of glycolysis-related genes. The genomic profiles were determined as mutations, mRNA expression Z scores (RNA-seq v.2 RSEM), putative copy number alterations from GISTIC, and protein expression Z scores (RPPA).
To predict the proportion of immune score and tumor purity in the TME of each THCA patient, we applied the ESTIMATE algorithm to estimate the immune score in THCA patients from the TCGA cohort (14, 15). Based on the ESTIMATE score, tumor purity was acquired using a fitted formula as previous study described (15).
In order to explore whether the prognostic signature was independent of other clinical variables, univariate, and multivariate Cox analyses were carried out.
The Nyth-ori-3-1, BCPAP, and TPC-1 cell lines were obtained from Guangzhou JENNIO Biotech Technology (Guangzhou, China). Nyth-ori-3-1 and TPC-1 cells were cultured in RPMI 1640 (GIBCO, Invitrogen, Carlsbad CA, USA), supplemented with 10% fetal bovine serum (FBS) (GIBCO, Melbourne, Australia). BCPAP cells were cultured in Dulbecco's modified Eagle's medium (DMEM) (GIBCO) containing 10% FBS of Australia origin. All the cells were cultured at 37°C in 5% CO2.
Total RNA of Nyth-ori-3-1, TPC-1, and BCPAP cells was extracted utilizing Trizol method and 500 ng total RNA was reversely transcribed into cDNA with “PrimeScriptTM RT reagent Kit with gDNA Eraser” (Takara, Japan). Quantitative real time-PCR (qRT-PCR) was perform using “SYBR Green Premix PCR Master Mix” (Takara, Japan) according to the manufacturer protocols. We calculated the relative mRNA expression markers utilizing the Ct method (2−ΔΔCt) after being normalized to β-actin. All reactions were carried out independently and repeated three times each time. A primer sequence of the six genes was used and is presented in the Supplementary Table 2.
The tissue samples were obtained from THCA patients and nodular goiter patients after surgery in our hospital. In addition, the sections were created after the tissues were dehydrated and embedded. The Ethics Committee from our hospital approved all the procedures of our study. Formalin-fixed paraffin embedded (FFPE) sections were subjected to antigen retrieval using citrate buffer for 15 min at 100°C and incubated in anti-CHST6 (1:30 Lifespan), anti-FBP2 (1:50 Abcam), anti-PPFIA4 (1:300 Abcam), anti-TGFBI (1:100 Abcam), and anti-STC1 (1:300 Abcam) at 4°C overnight. The primary antibody was omitted for negative-control sections. Sections were washed and placed in a biotinylated secondary antibody. After washing, the biotinylated secondary antibody, avidin-biotin complex, and horseradish peroxidase were applied (all the reagents were made from MXB, CHINA). Peroxidase activity was visualized by using DAB staining, which were then counterstained with hematoxylin (16–18). The figures of Immunohistochemistry were captured using a Nikon-inverted research-grade microscope.
The expression localizations of the glycolysis-associated genes in THCA tissues are clarified in Supplementary Table 3. Then the expression levels of target proteins in tissue were examined by two independent pathologists blinded to the clinical characteristics of the patients according to proportion of cell staining (0 = 0%, 1 = ≤25%, 2 = 26–50%, 3 = 51–75%, 4 = >75% positive cells) and the staining intensity (0 = no staining, 1 = weak, 2 =moderate, 3 = strong). A final score was calculated by multiplying the above two scores (19, 20). Protein expression was considered high if the final score was >6 points and low if the final score was 6 points or less. The specific scores of immunohistochemistry are clarified in Supplementary Table 4.
Ethics approval for this project was obtained from the First Affiliated Hospital of Shantou University Medical College Ethics committee (No. B-2020-217).
With the R package “pRRophetic,” the drug-response prediction was estimated based on the half maximal inhibitory concentration (IC50) of each THCA patient on the Genomics of Drug Sensitivity in Cancer (GDSC) website (21).
A univariate Cox regression was used to explore the interaction of the glycolysis-related genes with the overall survival of THCA patients and determined 17 survival-related genes in THCA patients when the p < 0.05 (Figure 1A). Then, a LASSO-penalized Cox analysis was developed to narrow the genes, which were selected over 900 times a total of 1,000 repetitions (Figures 1B,C). As a consequence, 10 genes were identified. In addition, a stepwise multivariate Cox regression analysis was performed, and six glycolysis-related genes were finally selected to construct the prognostic gene signature (Figure 1D).
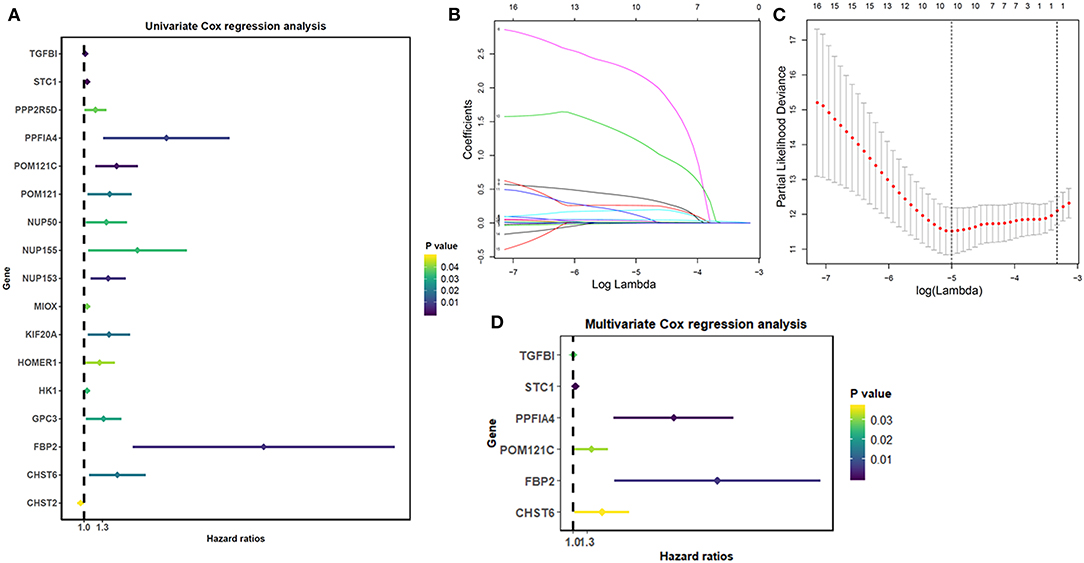
Figure 1. Identification of glycolysis-related genes significantly correlated with patients' survival. (A) The Univariate Cox analysis of glycolysis-related genes. (B) LASSO coefficient profiles of the glycolysis-related genes. (C) Plots of the cross-validation error rates. (D) Multivariate Cox analysis of glycolysis-related genes.
The risk score for predicting prognostic value was calculated using the formula: risk score = (0.0149 × TGFBI expression level) + (0.0517 × STC1 expression level) + (1.866 × PPFIA4 expression level) + (0.345 × POM121C expression level) + (0.542 × CHST6 expression level) + (2.672 × FBP2 expression level). We calculated the risk score for each THCA patient according to this formula and categorized the patients into high- or low-risk groups (Figures 2A–C). Kaplan-Meier analysis showed that high-risk patients had significantly worse overall survival than low-risk patients (p = 0.0007; Figure 2D). The prognostic capacity of the six-gene signature was assessed by calculating the area under the curve (AUC) of a time-dependent ROC curve (Figure 2E). The higher AUC demonstrated the better model performance for THCA-specific survival. The AUC of ROC analysis for the six-gene signature was 0.929, implying excellent performance for survival prediction.
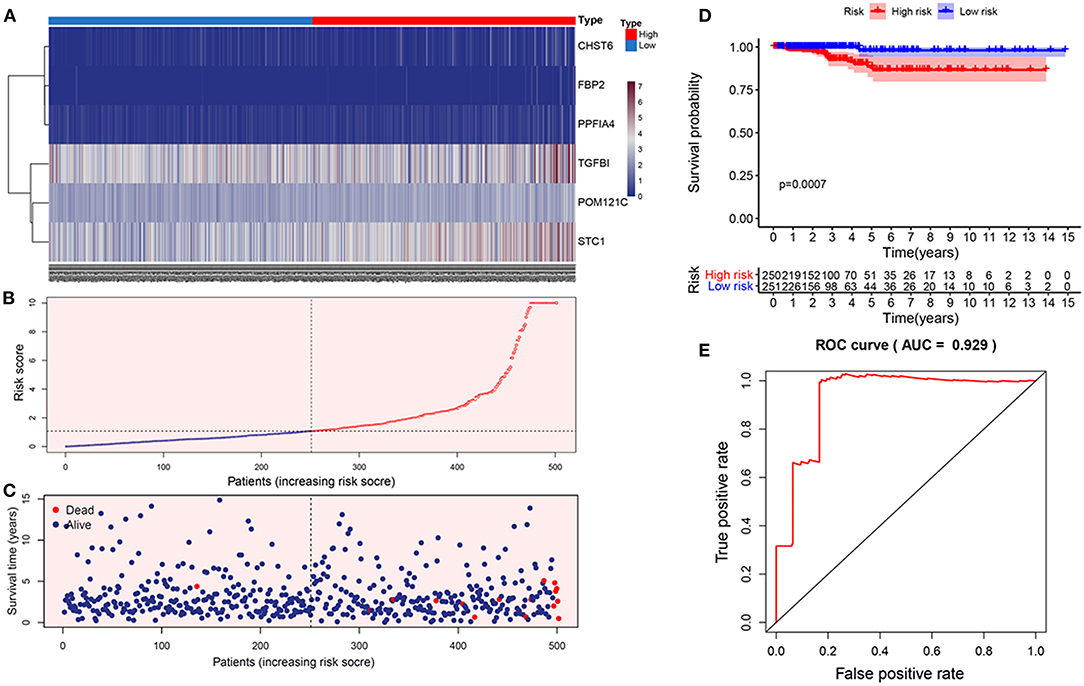
Figure 2. Construction of the prognostic glycolytic gene signature in TCGA. (A) Heatmap of six-gene expression profiles between the high- and low-risk groups. (B) The distribution of the glycolysis-based risk score. (C) Vital statuses of patients between the high- and low-risk groups. (D) Kaplan-Meier survival curves of the relative overall survival of high- and low-risk patients. (E) ROC curve analysis.
Genetic mutations of six genes were analyzed through cBioPortal online tool for THCA patients. Six genes were altered in 98 samples of 516 patients with THCA (19%) (Figure 3A). According to the relationship between the six-gene status and disease prognosis indicated that patients with these gene mutations showed poorer prognosis (Figure 3B), indicating that the glycolysis-related gene mutation may contribute to THCA progression. A Pearson correlation analysis was performed using gene expression data of six glycolysis-related genes collected from TCGA for THCA patients (Figure 3C). The results found out low correlations between each glycolysis-related gene, suggesting that these six genes were independent of each other.
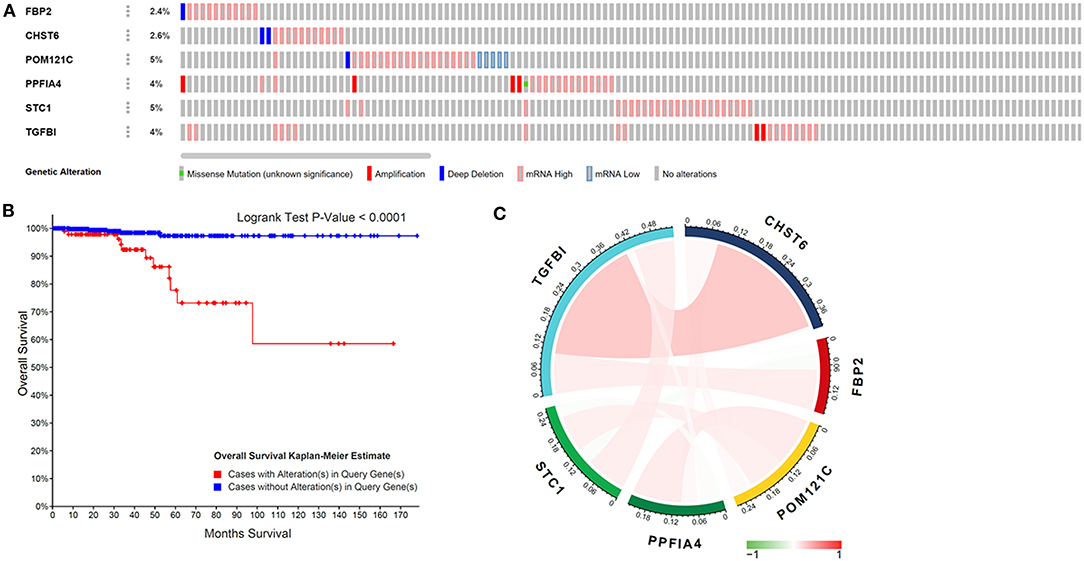
Figure 3. Glycolysis-related gene mutations and the correlation with gene expression in THCA patients. (A) Mutations of six genes in patients with THCA. (B) Kaplan–Meier survival curve for THCA patients stratified by the six-gene mutations. (C) Pearson correlation of six genes.
We then explored the TME differences in high- and low-risk THCA patients. As a result, TME were significantly different in high- and low-risk THCA patients (Figure 4A). On the basis of the ESTIMATE algorithm, the immune score in low-risk group was higher than those in high-risk group (Figure 4B). In addition, we compared the tumor purity of the two groups, and found the opposite trend (Figure 4C). These results showed that the glycolysis-related genes had significantly and negatively correlations with immune microenvironment, and the poor prognosis of the high-risk group was partly due to the immunosuppressive microenvironment.
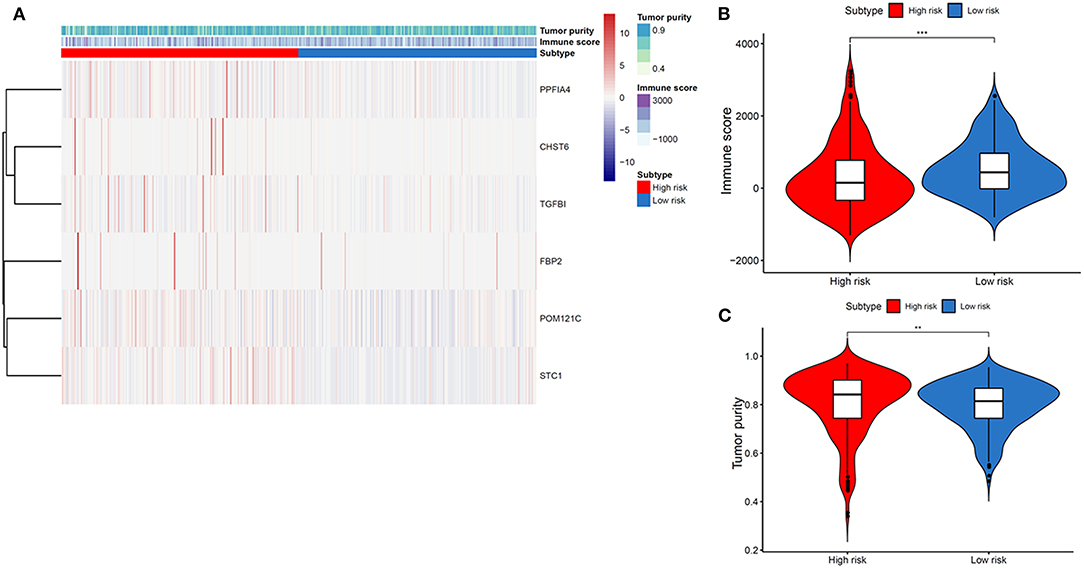
Figure 4. Association between tumor immune microenvironment and gene signature-based subsets in THCA. (A) Heatmap indicating the relationship of THCA subtypes with the expression of tumor immune microenvironment. (B) Immune score in THCA subtypes. (C) Tumor purity in THCA subtypes.
We then elucidated whether the glycolysis-related gene model was an independent marker compared to clinical properties. Univariate Cox regression analysis revealed the T stage, TNM stage, and risk score were significantly associated with THCA patient prognosis, and multivariate Cox regression analysis documented that the glycolysis-related gene signature showed a remarkable prognostic value when compared with other clinical properties (p < 0.001; Figure 5).

Figure 5. Univariate and multivariate Cox regression analyses between the glycolysis-related gene model and clinical features with overall survival.
To further validate the results, qRT-PCR was applied to analysis the relative mRNA expressions of six glycolysis-related genes in THCA cells (BCPAP, TPC-1) and normal thyroid cells (Nyth-ori-3-1). The results showed that THCA cell lines exhibited relative higher mRNA levels of CHST6, FBP2, PPFIA4, POM121C, and TGFBI, but a lower mRNA level of STC1 than normal thyroid cells (Figures 6A–F). In addition, immunohistochemistry analysis was also conducted to determine CHST6, FBP2, PPFIA4, TGFBI, and STC1 protein expression levels in THCA patients. According to the immunostaining, we could observe the similar results (Figures 7A–E). CHST6, FBP2, PPFIA4, and TGFBI proteins were all upregulated in THCA tissues compared with nodular goiter tissues. On the other hand, the result of STC1 was opposite (Figure 7F). In order to verify the specific efficacy in predicting recurrence of these genes, we collected patients who were diagnosed with THCA in our hospital in 2011–2015 and did follow-up surveys until November in 2020 to know their prognosis. According to the results of the immunohistochemistry, we divided those patients into a low-risk group and high-risk group and analyzed the recurrence rates of patients with THCA. The result showed that the recurrence rate in the high-risk group was higher than that in the low-risk group, according to the classification of the expression of CHST6 (Figure 8). In addition, the relationship between CHST6 and clinicopathologic factors of THCA patients is clarified in Supplementary Table 5.
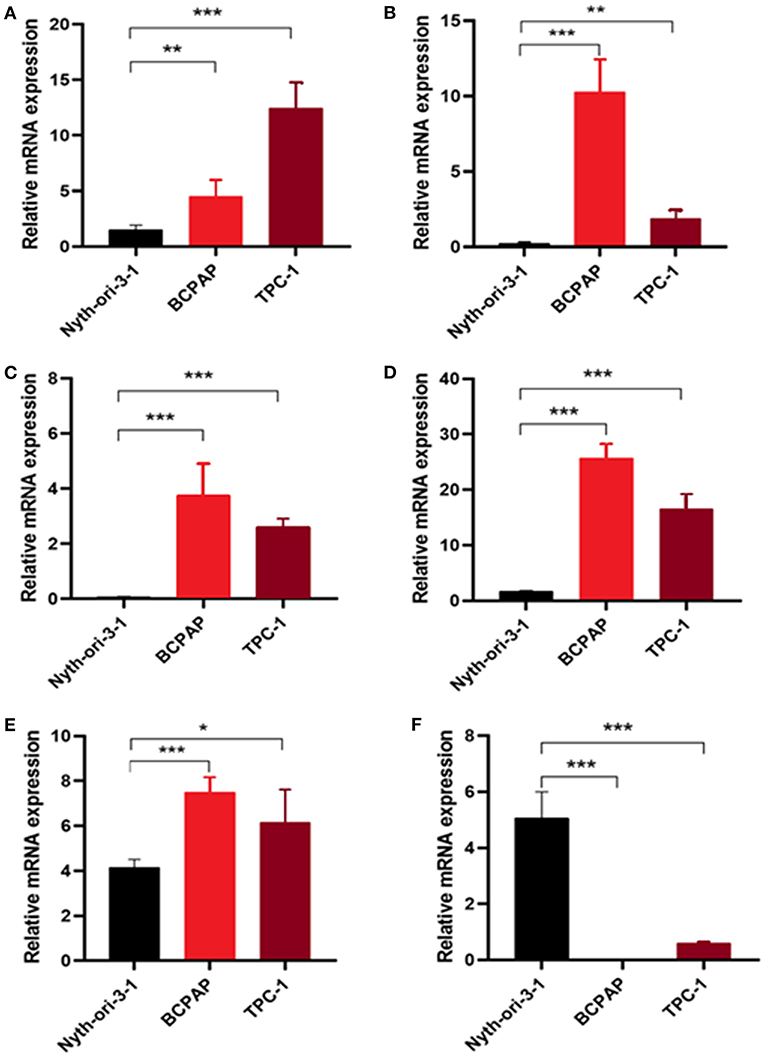
Figure 6. Measurement of glycolysis-related genes at mRNA levels in cell lines. Relative mRNA levels of (A) CHST6, (B) FBP2, (C) PPFIA4, (D) POM121C, (E) TGFBI, and (F) STC1 in thyroid cancer cells (BCPAP and TPC-1) and thyroid cells (Nyth-ori-3-1). *p < 0.05, **p < 0.01, and ***p < 0.001.
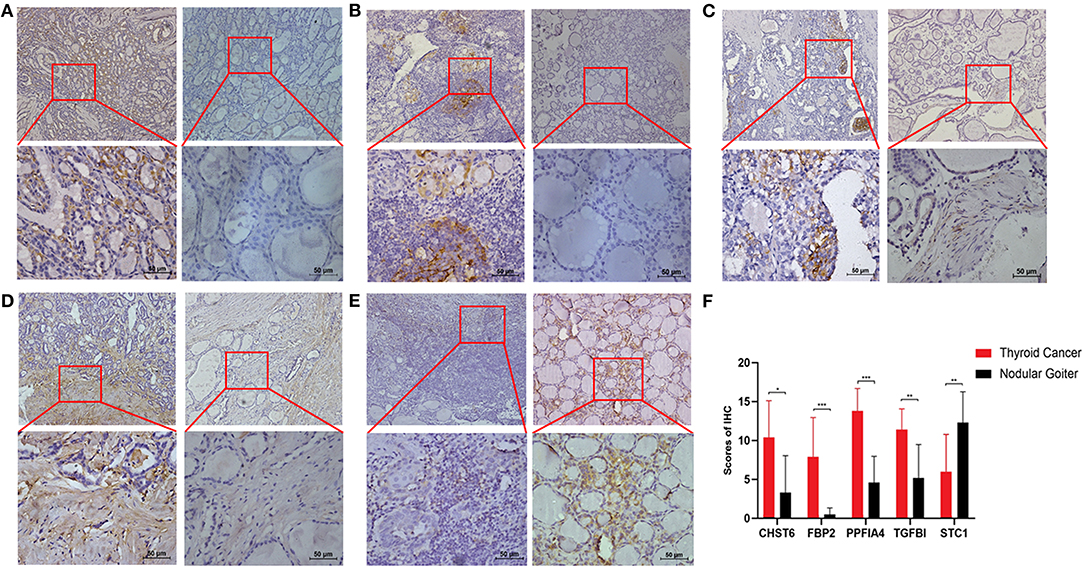
Figure 7. Measurement of glycolysis-related genes at protein levels in clinical samples. Representative immunohistochemical staining images of (A) CHST6, (B) FBP2, (C) PPFIA4, (D) TGFBI, and (E) STC1 in human thyroid cancer sections (left line) and nodular goiter sections (right line). (F) Protein expression scores in human thyroid cancer sections and nodular goiter sections. *p < 0.05, **p < 0.01, and ***p < 0.001.
After characterizing the key features of six glycolysis-related genes, we also explore potential compounds that capable of targeting the pathways linked to glycolysis on the basis of IC50 available in the GDSC database for each TCGA sample. It was excited that 26 chemo compounds were selected with significant differences in the estimated IC50 between high- and low-risk groups, and that the high-risk group was more sensitive to all of these drugs (Figure 9 and Table 1). These findings further suggested that the heterogeneity of glycolysis activation in THCA patients was a better model for predicting the therapeutic response.
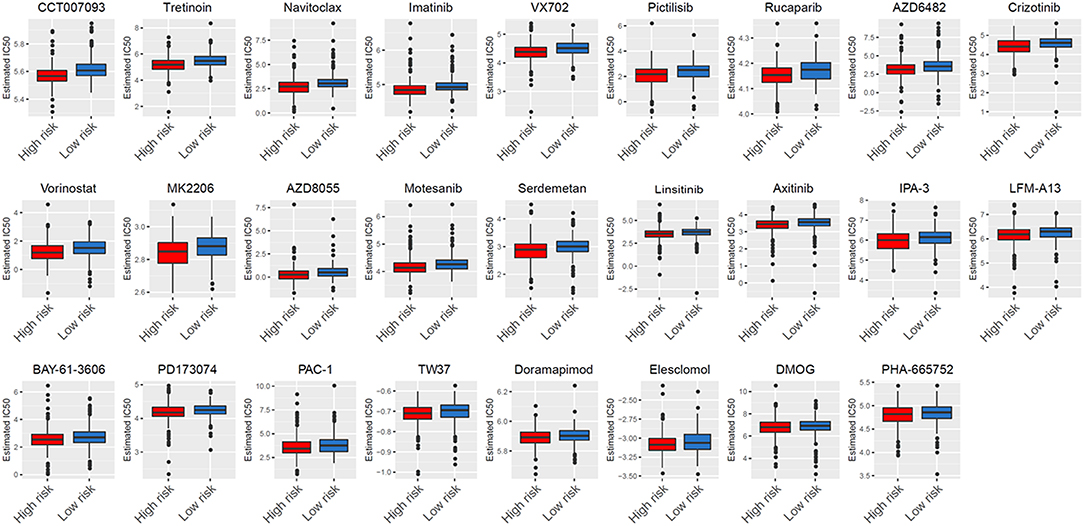
Figure 9. Analysis of GDSC database identifies novel candidate compounds targeting the glycolysis-related gene model.
According to GDSC database analysis, five drugs (Crizotinib, Axitinib, Motesanib, PHA-665752, and PD173074) shared the RTK signaling pathway, four drugs (Pictilisib, AZD6482, AZD8055, and MK2206) shared the PI3K/MTOR signaling pathway, three drugs (PAC-1, Navitoclax, and TW37) shared the apoptosis regulation pathway, three drugs (BAY-61-3606, Imatinib, and LFM-A13) shared the kinases pathway, and two drugs (VX702 and Doramapimod) shared the JNK and p38 signaling. We also observed DMOG as a metabolism inhibitor, Linsitinib as an IGF1R signaling inhibitor, Rucaparib as a genome integrity inhibitor, Vorinostat as a chromatin histone acetylation inhibitor, CCT007093 as a cell cycle inhibitor, Elesclomol as a protein stability and degradation inhibitor, and Serdemetan as a p53 pathway inhibitor.
Recently, studies on immune evasion and energy metabolism have attracted people's attention, and the emerging hallmarks of cancer have been discovered (22–24). Unlike normal cells, cancer cells rely mainly on glycolysis for producing ATP energy, even when in the presence of adequate levels of oxygen (25). Many researchers also have explored the glucose metabolism features of THCA (26, 27). Thus, targeting the glycolytic pathway may have the promising future to provide an effective target for THCA therapy. Our study has identified glycolysis-related genes providing a new prognostic biomarker and therapeutic target for THCA patients. The AUC of ROC curve of this prediction model was 0.929, revealing this gene signature has an excellent effect in predicting survival. THCA patients were categorized into high- and low-risk groups through a glycolytic risk-prognosis model, and the overall survival rate of high-risk patients was worse. Clinical analysis also showed that THCA patients with the six-gene mutation have a poorer survival prognosis. In addition, qRT-PCR and immunohistochemistry were also applied to confirm the differential expressions of these glycolysis-related genes between THCA patients and non-tumor patients. We also found the recurrence rate in the high-risk group was higher than that in the low-risk group, according to the classification of the expression of CHST6. Those results indicated that these glycolysis-related genes might play crucial roles in determining the prognosis of cancer patients with THCA.
According to glycolysis-related signature, the clinician could establish individualized treatment for THCA patients. Additionally, experimental evidence indicated the accumulation of extracellular lactate produced by glycolytic cancer cells was related to the inhibition of anticancer immune cells. For instance, the high concentration of lactate in TME affected T cells' proliferation and function through disturbing their intracellular pH (28). Tumor-derived lactate was an important factor regulating dendritic cell phenotype in a TME and might be related to the tumor avoidance mechanism (29). Moreover, lactate, increased arginase I (ARG1) expression in macrophages, inhibited proliferation and activation of T-cell (30). Natural killer (NK) cells could also be inhibited by lactate, hence allowing for cancer progression (10). According to these reasons, we hypothesized that different groups of patients may have different immune responses. As consequence, we reported a significant negative correlation between glycolytic activity (high-risk group) and immune activity (quantified by immune score and tumor purity). Thus, we may further support the immunosuppressive role of glycolysis in patients with THCA, and suppress glycolysis to improve the immune status to increase the survival of patients with THCA.
We documented that the clinical TNM stage, T stage, and risk score indicated significant association with overall survival of THCA patients. What's more, we confirmed that the six-gene signature indicated an indispensable relationship with survival compared with other clinical characteristics. In standard clinical practice, the pathologic stage is considered to be an important prognostic determinant of THCA. However, there are some differences in clinical outcomes differ among patients at the same stage, demonstrating the present staging systems are inadequate for effective prognosis, and the biological heterogeneity of patients with THCA cannot be fully reflected. Thus, it is vital to obtain novel biomarkers to use as prognostic and therapeutic factors. To our knowledge, this is the first glycolysis-associated gene model confirmed in THCA. Our model provides a new method for the evaluation of THCA patients and guides prognostic prediction and treatment decisions.
Finally, according to the GDSC database, high-risk THCA patients were found to be more sensitive to 22 compounds compared with low-risk THCA patients. Twenty-two compounds revealed 13 mechanisms shared by the above compounds. Among the 22 compounds, Crizotinib, Axitinib, PD173074, Motesanib, and PHA-665752 shared the RTK signaling pathway. The RTK signaling stimulated the accumulation of cellular metabolites, thereby increasing lactate excretion, which led to T cell activity inhibition (31). Pictilisib, AZD6482, MK2206, and Serdemetan shared the PI3K/MTOR signaling pathway. The PI3K oncogene has been reported to stimulate glycolysis and promote cancer growth in a variety of human cancers (32–35). The mTOR, a downstream effector of PI3K/Akt signaling, had two forms and both were involved in the regulation of glycolysis (36, 37). We also explore other approaches that may eventually contribute to the implementation of targeted glycolysis therapy.
Our research provides a new perspective for the study of THCA immune microenvironment. However, as our study was retrospective, our study needed to be validated by further prospective studies. In addition, most public database data included in the analysis were from patients in developed countries but data from developing countries were lacking.
In conclusion, our study identifies a six-gene model related to glycolysis, which could independently predict THCA patient prognosis. In addition, in-vivo and in-vitro experiments reveal that expression of glycolysis-related genes are associated with tumor growth, which may be helpful to provide new therapeutic target for THCA patients in the future. Our study also identifies several specific drugs targeting glycolysis for individualized treatment.
All datasets generated for this study are included in the article/Supplementary Material.
The studies involving human participants and animal studies were reviewed and approved by the First Affiliated Hospital of Shantou University Medical College Ethics committee (Shantou, China).
FX did the original design of the study, analyzed data, and wrote the manuscript. HX, ZL, YH, XH, and YL collected clinical samples. HX performed the in vivo and in vitro experiments. FX, LL, and YC provided funding acquisition. LL, YC, and XZ supervised the research, analyzed data, and wrote the manuscript. All authors read and approved the final submitted manuscript.
This study was supported by grants from the National Natural Science Foundation of China (81672640), the Guangdong Basic and Applied Basic Research Foundation (2021A1515010137, 2020A1515011519), the Grant for Key Disciplinary Project of Clinical Medicine under the Guangdong High-level University Development Program, the 2020 Li Ka Shing Foundation Cross-Disciplinary Research Grant (2020LKSFG04A, 2020LKSFG10A), the Dengfeng Project for the construction of high-level hospitals in Guangdong Province-the First Affiliated Hospital of Shantou University Medical College Supporting Funding (2019-70), and the Medical Science and Technology Research Foundation of Guangdong Province (A2021409, A2020430).
The authors declare that the research was conducted in the absence of any commercial or financial relationships that could be construed as a potential conflict of interest.
The Supplementary Material for this article can be found online at: https://www.frontiersin.org/articles/10.3389/fonc.2021.534838/full#supplementary-material
1. La Vecchia C, Malvezzi M, Bosetti C, Garavello W, Bertuccio P, Levi F, et al. Thyroid cancer mortality and incidence: a global overview. Int J Cancer. (2015) 136:2187–95. doi: 10.1002/ijc.29251
2. Lin P, Guo YN, Shi L, Li XJ, Yang H, He Y, et al. Development of a prognostic index based on an immunogenomic landscape analysis of papillary thyroid cancer. Aging. (2019) 11:480–500. doi: 10.18632/aging.101754
3. Zha T, Wu H. Expression of serum AMPD1 in thyroid carcinoma and its clinical significance. Exp Ther Med. (2018) 15:3357–61. doi: 10.3892/etm.2018.5859
4. Tu Y, Fan G, Xi H, Zeng T, Sun H, Cai X, et al. Identification of candidate aberrantly methylated and differentially expressed genes in thyroid cancer. J Cell Biochem. (2018) 119:8797–806. doi: 10.1002/jcb.27129
5. Jeong H, Kim S, Hong B-J, Lee C-J, Kim Y-E, Bok S, et al. Tumor-associated macrophages enhance tumor hypoxia and aerobic glycolysis. Cancer Res. (2019) 79:795–806. doi: 10.1158/0008-5472.CAN-18-2545
6. Abdel-Wahab AF, Mahmoud W, Al-Harizy RM. Targeting glucose metabolism to suppress cancer progression: prospective of anti-glycolytic cancer therapy. Pharmacol Res. (2019) 150:104511. doi: 10.1016/j.phrs.2019.104511
7. Ganapathy-Kanniappan S, Geschwind JF. Tumor glycolysis as a target for cancer therapy: progress and prospects. Mol Cancer. (2013) 12:152. doi: 10.1186/1476-4598-12-152
8. Sheng H, Tang W. Glycolysis inhibitors for anticancer therapy: a review of recent patents. Recent Pat Anticancer Drug Discov. (2016) 11:297–308. doi: 10.2174/1574892811666160415160104
9. Lee N, Jang WJ, Seo JH, Lee S, Jeong CH. 2-Deoxy-d-glucose-induced metabolic alteration in human oral squamous SCC15 cells: involvement of N-glycosylation of Axl and Met. Metabolites. (2019) 99:188. doi: 10.3390/metabo9090188
10. Husain Z, Seth P, Sukhatme VP. Tumor-derived lactate modifies antitumor immune response: effect on myeloid-derived suppressor cells and NK cells. Oncoimmunology. (2013) 2: e26383. doi: 10.4161/onci.26383
11. Romero-Garcia S, Moreno-Altamirano MMB, Prado-Garcia H, Sánchez-García FJ. Lactate contribution to the tumor microenvironment: mechanisms, effects on immune cells and therapeutic relevance. Front Immunol. (2016) 7:52. doi: 10.3389/fimmu.2016.00052
12. Xu F, Zhang H, Chen J, Lin L, Chen Y. Immune signature of T follicular helper cells predicts clinical prognostic and therapeutic impact in lung squamous cell carcinoma. Int Immunopharmacol. (2019) 81:105932. doi: 10.1016/j.intimp.2019.105932
13. Gao J, Aksoy BA, Dogrusoz U, Dresdner G, Gross B, Sumer SO, et al. Integrative analysis of complex cancer genomics and clinical profiles using the cBioPortal. Sci Signal. (2013) 6:pl1. doi: 10.1126/scisignal.2004088
14. Daily K, Ho Sui SJ, Schriml LM, Dexheimer PJ, Salomonis N, Schroll R, et al. Molecular, phenotypic, and sample-associated data to describe pluripotent stem cell lines and derivatives. Sci Data. (2017) 4:170030. doi: 10.1038/sdata.2017.30
15. Yoshihara K, Shahmoradgoli M, Martinez E, Vegesna R, Kim H, Torres-Garcia W, et al. Inferring tumour purity and stromal and immune cell admixture from expression data. Nat Commun. (2013) 4:2612. doi: 10.1038/ncomms3612
16. Xu F, Cao J, Luo M, Che L, Li W, Ying S, et al. Early growth response gene 1 is essential for urban particulate matter-induced inflammation and mucus hyperproduction in airway epithelium. Toxicol Lett. (2018) 294:145–55. doi: 10.1016/j.toxlet.2018.05.003
17. Xu F, Luo M, He L, Cao Y, Li W, Ying S, et al. Necroptosis contributes to urban particulate matter-induced airway epithelial injury. Cell Physiol Biochem. (2018) 46:699–712. doi: 10.1159/000488726
18. Xu F, Lin H, He P, He L, Chen J, Lin L, et al. A TP53-associated gene signature for prediction of prognosis and therapeutic responses in lung squamous cell carcinoma. Oncoimmunology. (2020) 9:1731943. doi: 10.1080/2162402X.2020.1731943
19. Yang X, Zhang S, He C, Xue P, Zhang L, He Z, et al. METTL14 suppresses proliferation and metastasis of colorectal cancer by down-regulating oncogenic long non-coding RNA XIST. Mol Cancer. (2020) 19:46. doi: 10.1186/s12943-020-1146-4
20. Konno R, Yamakawa H, Utsunomiya H, Ito K, Sato S, Yajima A. Expression of survivin and Bcl-2 in the normal human endometrium. Mol Hum Reproduct. (2000) 6:529–534. doi: 10.1093/molehr/6.6.529
21. Geeleher P, Cox NJ, Huang RS. Clinical drug response can be predicted using baseline gene expression levels and in vitro drug sensitivity in cell lines. Genome Biol. (2014) 15:R47. doi: 10.1186/gb-2014-15-3-r47
22. Li X, Zhang Y, Ma W, Fu Q, Liu J, Yin G, et al. Enhanced glucose metabolism mediated by CD147 contributes to immunosuppression in hepatocellular carcinoma. Cancer Immunol Immunother. (2020) 69:535–48. doi: 10.1007/s00262-019-02457-y
23. Xu F, Chen J-X, Yang X-B, Hong X-B, Li Z-X, Lin L, et al. Analysis of lung adenocarcinoma subtypes based on immune signatures identifies clinical implications for cancer therapy. Mol Ther Oncolytics. (2020) 17:241–9. doi: 10.1016/j.omto.2020.03.021
24. Xu F, Zhan X, Zheng X, Xu H, Li Y, Huang X, et al. A signature of immune-related gene pairs predicts oncologic outcomes and response to immunotherapy in lung adenocarcinoma. Genomics. (2020) 112:4675–83. doi: 10.1016/j.ygeno.2020.08.014
25. Jiang L, Zhao L, Bi J, Guan Q, Qi A, Wei Q, et al. Glycolysis gene expression profilings screen for prognostic risk signature of hepatocellular carcinoma. Aging. (2019) 11:10861–82. doi: 10.18632/aging.102489
26. Suh H, Choi H, Paeng J, Cheon G, Chung J, Kang K. Comprehensive gene expression analysis for exploring the association between glucose metabolism and differentiation of thyroid cancer. BMC Cancer. (2019) 19:1260. doi: 10.1186/s12885-019-6482-7
27. Nahm JH, Kim HM, Koo JS. Glycolysis-related protein expression in thyroid cancer. Tumor Biol. (2017) 39:1010428317695922. doi: 10.1177/1010428317695922
28. Deberardinis RJ, Sayed N, Ditsworth D, Thompson CB. Brick by brick: metabolism and tumor cell growth. Curr Opin Genet Dev. (2008) 18:54–61. doi: 10.1016/j.gde.2008.02.003
29. Gottfried E, Kunz-Schughart LA, Ebner S, Mueller-Klieser W, Hoves S, Andreesen R, et al. Tumor-derived lactic acid modulates dendritic cell activation and antigen expression. Blood. (2006) 107:2013–21. doi: 10.1182/blood-2005-05-1795
30. Ohashi T, Akazawa T, Aoki M, Kuze B, Mizuta K, Ito Y, et al. Dichloroacetate improves immune dysfunction caused by tumor-secreted lactic acid and increases antitumor immunoreactivity. Int J Cancer. (2013) 133:1107–18. doi: 10.1002/ijc.28114
31. Lim SO, Li CW, Xia W, Lee HH, Chang SS, Shen J, et al. EGFR signaling enhances aerobic glycolysis in triple-negative breast cancer cells to promote tumor growth and immune escape. Cancer research. (2016) 76:1284–96. doi: 10.1158/0008-5472.CAN-15-2478
32. Li R, Weng L, Liu B, Zhu L, Zhang X, Tian G, et al. TRIM59 predicts poor prognosis and promotes pancreatic cancer progression via the PI3K/AKT/mTOR-glycolysis signaling axis. J Cell Biochem. (2020) 121:1986–97. doi: 10.1002/jcb.29433
33. Tu W, Ye J, Wang ZJ. Embryonic liver fordin is involved in glucose glycolysis of hepatic stellate cell by regulating PI3K/Akt signaling. World J Gastroenterol. (2016) 22:8519–27. doi: 10.3748/wjg.v22.i38.8519
34. Li Z, Liu J, Que L, Tang X. The immunoregulatory protein B7-H3 promotes aerobic glycolysis in oral squamous carcinoma via PI3K/Akt/mTOR pathway. J Cancer. (2019) 10:5770–84. doi: 10.7150/jca.29838
35. Wei J, Wu J, Xu W, Nie H, Zhou R, Wang R, et al. Salvianolic acid B inhibits glycolysis in oral squamous cell carcinoma via targeting PI3K/AKT/HIF-1alpha signaling pathway. Cell Death Dis. (2018) 9:599. doi: 10.1038/s41419-018-0623-9
36. Maiese K, Chong ZZ, Shang YC, Wang S. mTOR: on target for novel therapeutic strategies in the nervous system. Trends Mol Med. (2013) 19:51–60. doi: 10.1016/j.molmed.2012.11.001
Keywords: tumor glycolysis, thyroid cancer, gene signature, TME, prognosis
Citation: Xu F, Xu H, Li Z, Huang Y, Huang X, Li Y, Zheng X, Chen Y and Lin L (2021) Glycolysis-Based Genes Are Potential Biomarkers in Thyroid Cancer. Front. Oncol. 11:534838. doi: 10.3389/fonc.2021.534838
Received: 14 February 2020; Accepted: 24 February 2021;
Published: 26 April 2021.
Edited by:
Erminia Massarelli, City of Hope National Medical Center, United StatesReviewed by:
Hong-Quan Duong, Hanoi University of Public Health, VietnamCopyright © 2021 Xu, Xu, Li, Huang, Huang, Li, Zheng, Chen and Lin. This is an open-access article distributed under the terms of the Creative Commons Attribution License (CC BY). The use, distribution or reproduction in other forums is permitted, provided the original author(s) and the copyright owner(s) are credited and that the original publication in this journal is cited, in accordance with accepted academic practice. No use, distribution or reproduction is permitted which does not comply with these terms.
*Correspondence: Ling Lin, bGxpbmNAMTYzLm5ldA==; Yongsong Chen, eW9uZ3NvbmdjaGVuQDEyNi5jb20=
†These authors have contributed equally to this work
Disclaimer: All claims expressed in this article are solely those of the authors and do not necessarily represent those of their affiliated organizations, or those of the publisher, the editors and the reviewers. Any product that may be evaluated in this article or claim that may be made by its manufacturer is not guaranteed or endorsed by the publisher.
Research integrity at Frontiers

Learn more about the work of our research integrity team to safeguard the quality of each article we publish.