 Lin Yang
- 1Department of Pathology, Institute of Basic Medical Sciences, Chinese Academy of Medical Sciences, Beijing, China
- 2School of Basic Medicine, Peking Union Medical College, Beijing, China
- 3Molecular Pathology Research Center, Chinese Academy of Medical Sciences, Beijing, China
- 4Department of Breast Surgery, The First Affiliated Hospital of China Medical University, Shenyang, China
- 5China National Center for Bioinformation, Beijing, China
- 6National Genomics Data Center & CAS Key Laboratory of Genome Sciences and Information, Beijing Institute of Genomics, Chinese Academy of Sciences, Beijing, China
RNA N6-methyladenosine (m6A) methylation is the most prevalent epitranscriptomic modification in mammals, with a complex and fine-tuning regulatory system. Recent studies have illuminated the potential of m6A regulators in clinical applications including diagnosis, therapeutics, and prognosis. Based on six datasets of breast cancer in The Cancer Genome Atlas (TCGA) database and two additional proteomic datasets, we provide a comprehensive view of all the known m6A regulators in their gene expression, copy number variations (CNVs), DNA methylation status, and protein levels in breast tumors and their association with prognosis. Among four breast cancer subtypes, basal-like subtype exhibits distinct expression and genomic alteration in m6A regulators from other subtypes. Accordingly, four representative regulators (IGF2BP2, IGF2BP3, YTHDC2, and RBM15) are identified as basal-like subtype-featured genes. Notably, luminal A/B samples are subclassified into two clusters based on the methylation status of those four genes. In line with its similarity to basal-like subtype, cluster1 shows upregulation in immune-related genes and cell adhesion molecules, as well as an increased number of tumor-infiltrating lymphocytes. Besides, cluster1 has worse disease-free and progression-free survival, especially among patients diagnosed with stage II and luminal B subtype. Together, this study highlights the potential functions of m6A regulators in the occurrence and malignancy progression of breast cancer. Given the heterogeneity within luminal subtype and high risk of recurrence and metastasis in a portion of patients, the prognostic stratification of luminal A/B subtypes utilizing basal-featured m6A regulators may help to improve the accuracy of diagnosis and therapeutics of breast cancer.
Introduction
Breast cancer is the most ubiquitous cancer in women worldwide. It is a heterogeneous disease and has been classified into different subtypes according to the gene expression profile. These subtypes are termed as human epidermal growth factor 2 (HER2)-enriched, basal-like, and luminal subtypes (1, 2). Standardization of breast cancer classification and optimal treatment regimens for each subtype have acquired great progress since the concept of subtype was first proposed. Patients of HER2-enriched subtype benefit from HER2-targeted therapy, such as trastuzumab and pertuzumab (3). In contrast, patients of basal-like subtype have poor prognosis, high risk of recurrence, and lack efficient therapeutic strategy (1, 4, 5). Luminal subtype, accounting for 70% of breast cancers, has positive response to endocrine therapies and the best prognosis (6). However, substantial heterogeneity still exists within this subtype (7–9). By utilizing immunohistochemical analysis of progesterone receptor (PR) and Ki-67, luminal subtype could be further classified into less-aggressive luminal A and more-aggressive luminal B subtypes (10). Despite that, the standards of PR status and Ki-67 index remain controversial across the world or even among hospitals. Additionally, there also exists undeniable intragroup heterogeneity bringing about indeterminacy in clinical management (7, 11). Thus, continuous efforts have been made to subclassify the intrinsic subtypes into more precise subgroups. For instance, basal-like cancers were further classified into 6 (12) or 4 (13) subgroups based on their genomic and transcriptomic profiling. By taking advantage of DNA copy number, DNA methylation, and gene expression data, luminal subtype was successfully segregated into subgroups with distinct molecular and clinical characteristics (8, 9, 11, 14). Nevertheless, despite the extensive investigations on breast cancer, genetic variance still brings about different responses to standard treatment protocol within the same subtype. Therefore, it is important to comprehensively understand the regulatory mechanism of gene alterations in pathological status.
Other than extensively studied genomic, transcriptomic, and epigenetic modulations, RNA m6A modification (m6A) represents a vital layer of epitranscriptomic regulation of gene expression and has drawn much attention in recent years. m6A is the most prevalent epitranscriptomic modification in mammals. Its formation is catalyzed by methyltransferase complex (also called “writers”), which is composed of core components METTL3, METTL14 (15–17), WTAP (18), and other subunits. Conversely, RNA m6A methylation can be removed by demethylases, better known as “erasers,” specifically FTO (19) and ALKBH5 (20). The effects of m6A on gene expression are mediated by m6A binding proteins which are usually called “readers.” So far, m6A regulators have been unveiled to function in regulating RNA alternative splicing, nuclear export, degradation, and translation (21). Given their crucial roles in many different physiological contexts, aberrant expression of m6A regulators could incur the occurrence or progression of multiple cancers through disturbing the m6A-dependent RNA metabolism (22).
Aberrant expression of m6A regulators, including METTL3, METTL14, WTAP, ALKBH5, and FTO, has been identified in breast cancer, as well as their potential prognostic values (23, 24). Mechanistically, upregulation of METTL3, METTL14, and FTO expression exhibits oncogenic roles by promoting cells proliferation, migration, or invasion in m6A-dependent manner (25–28). On the other side, hypoxia-dependent expression of ALKBH5 and ZNF217 is associated with the maintenance and specification of breast cancer stem cells via their inhibitory role on m6A methylation of mRNAs encoding pluripotency factors NANOG or KLF4 (29, 30). Despite the progress in the above regulators, there is still a lack of comprehensive analysis to excavate the roles and clinical applications of all the known m6A regulators in breast cancer.
Recently, bioinformatics analyses provide convenient tools in identifying the m6A regulators applicable in tumor classification and prognosis prediction in multiple cancers (12, 31–35). In this study, we analyzed the molecular alterations of m6A regulators and found their distinctive features in breast cancer. Besides, survival analysis revealed the prognostic values of several m6A regulators in breast cancer. Our results suggest their critical roles in the initiation and progression of breast cancer and diverse regulatory mechanisms of them. Furthermore, according to the DNA methylation status of 11 probes located on basal-like subtype-featured m6A regulators, luminal A and luminal B subtypes were further segregated into two clusters respectively, which differed in the enrichment of tumor infiltrating lymphocytes (TILs) and patients’ prognosis. Subclassification of luminal subtype will provide additional prognostic information in an attempt to improve personalized treatment of breast cancer.
Materials and Methods
Data Collection
Six types of breast cancer datasets (Table S1) originated from the Cancer Genome Atlas (TCGA) database (36) were downloaded from UCSC xena platform (37): the gene expression profiles obtained were originally generated from the Illunima HiSeq 2000 platform and transformed into log2(RSEM+1) format; somatic mutation data was compiled in Mutation Annotation Format (MAF); gene-level copy number variations (CNVs) were measured experimentally using the Affymetrix Genome-Wide Human SNP Array 6.0 platform and preprocessed with GISTIC2 method (38); DNA methylation levels estimated by beta values were measured based on the GPL13534 platform (Illumina Infinium HumanMehytlation450 Bead-Chip array). The beta values of DNA methylation are continuous variables between 0 and 1, representing the percentage of methylated alleles; miRNA expression data was generated from IlluminaHiseq platform, while the miRNA-target interactions were downloaded from miRTarBase database (39); phenotype data contained the survival and subtype information of each sample.
Proteomic datasets were obtained from another two independent studies. The first proteomic study applied a quantitative liquid chromatography/mass spectrometry-based proteome analysis to 65 breast tumors and 53 adjacent non-cancerous tissues (40). This dataset was used for comparing expression between tumor and normal samples. The other study utilized high-resolution accurate-mass tandem mass spectrometry method and contained 105 breast tumors with explicit information of subtyping and prognosis, which was applied for comparison among subtypes and for survival analysis (41).
Correlation Analysis
The Pearson correlation coefficients between gene expression and DNA methylation, copy number, or miRNA expression were computed in R with cor.test function, respectively. Only the DNA methylation probes that had missing values in less than 50% of samples were included for the analysis. Different versions of miRNA IDs were converted through miRBaseVersions.db R package (42).
Determination of Basal-Featured m6A Regulators
The importance of m6A regulators in distinguishing basal-like samples from other subtypes was ranked by performing random forest algorithm based on their gene expression levels. This procedure was processed in R with RandomForest package (43). Furthermore, the variable selection was determined by using varSelRF R package (44).
Samples Clustering Analysis
Based on phenotype data, only normal samples and breast tumor samples allocated to explicit subtypes were included in sample clustering analysis. t-Distributed Stochastic Neighbor Embedding (t-SNE) analysis was performed with the expression values of all 28 m6A regulators using the tsne R package (45). Unsupervised hierarchical clustering analysis was performed with filtered DNA methylation probes, whose beta values should meet the below criteria (1): absolute value of Pearson correlation coefficient with gene expression was greater than 0.3; (2) standard deviation (SD) among all samples was higher than 0.2. Consensus clustering that determined the number of clusters for luminal and basal-like samples was implemented with ConsensusClusterPlus package in R by resampling iteration (50 iterations, resampling rate of 80%). The cluster number was determined according to the relative change in area under the cumulative distribution function (CDF) curve (46). The heatmap corresponding to the consensus clustering was generated with pheatmap R package.
Differential Expression Analysis
Differentially expressed genes between cluster1 and cluster2 samples were defined with DESeq2 R package (47). Briefly, the original log2(RSEM+1) values were transformed into RSEM values and grounded to integers, then the expression matrix was imported using the DESeqDataSetFromMatrix function. Genes that met the criteria of adjusted P < 0.05 and FoldChange > 1.5 or < 0.66 were regarded as differentially expressed genes between cluster1 and cluster2 samples.
Functional Enrichment Analysis
Kyoto Encyclopedia of Genes and Genomes (KEGG) pathway enrichment analysis of the differentially expressed genes between cluster1 and cluster2 samples was implemented with clusterProfiler R package (48). Marker genes for each immune cell population were curated from published research (49), the relative abundance of different types of TILs in each sample was assessed by single sample gene set enrichment analysis (ssGSEA) method (50) in GSVA R package.
Statistical Analysis
All analyses were implemented with R computing framework (v3.6.1). Wilcoxon rank-sum test was employed to compare the difference in expression of m6A regulators between control and breast tumor samples. The comparison of gene expression among the four subtypes was implemented by Kruskal-Wallis analysis. Univariate cox proportional hazard regression analysis was performed to evaluate the correlation between gene expression level, CNV, DNA methylation level and survival time using the coxph function with survival R package. Kaplan-Meier survival analyses and log-rank test were performed for comparison of survival time between the two clusters which was processed with survival R package (51).
Results
Alterations of m6A Regulators Exhibited Prognostic Values in Breast Cancer
Accumulating evidence has confirmed that aberrant expression of m6A regulators is associated with tumorigenesis and progression in multiple cancers. Thereby, we asked whether this phenomenon could be observed in breast cancer. At present, 28 genes have been identified as m6A regulators due to their direct or indirect functions in m6A deposition, removal, or recognition (Figure S1A). First, we examined the expression of those m6A regulators in breast cancer and normal samples. Among them, 17 out of 28 genes exhibited significantly differential expression (P < 0.001), including KIAA1429, FMR1, HNRNPA2B21, HNRNPC, IGF2BP1, PRRC2A, YTHDF1, ZNF217 being upregulated and METTL14, WTAP, ZC3H13, METTL16, ZCCHC4, FTO, EIF3A, IGF2BP2, YTHDC1 being downregulated in breast cancer samples (Figure 1A and Figure S1B), suggesting their potential involvement in tumorigenesis of breast cancer.
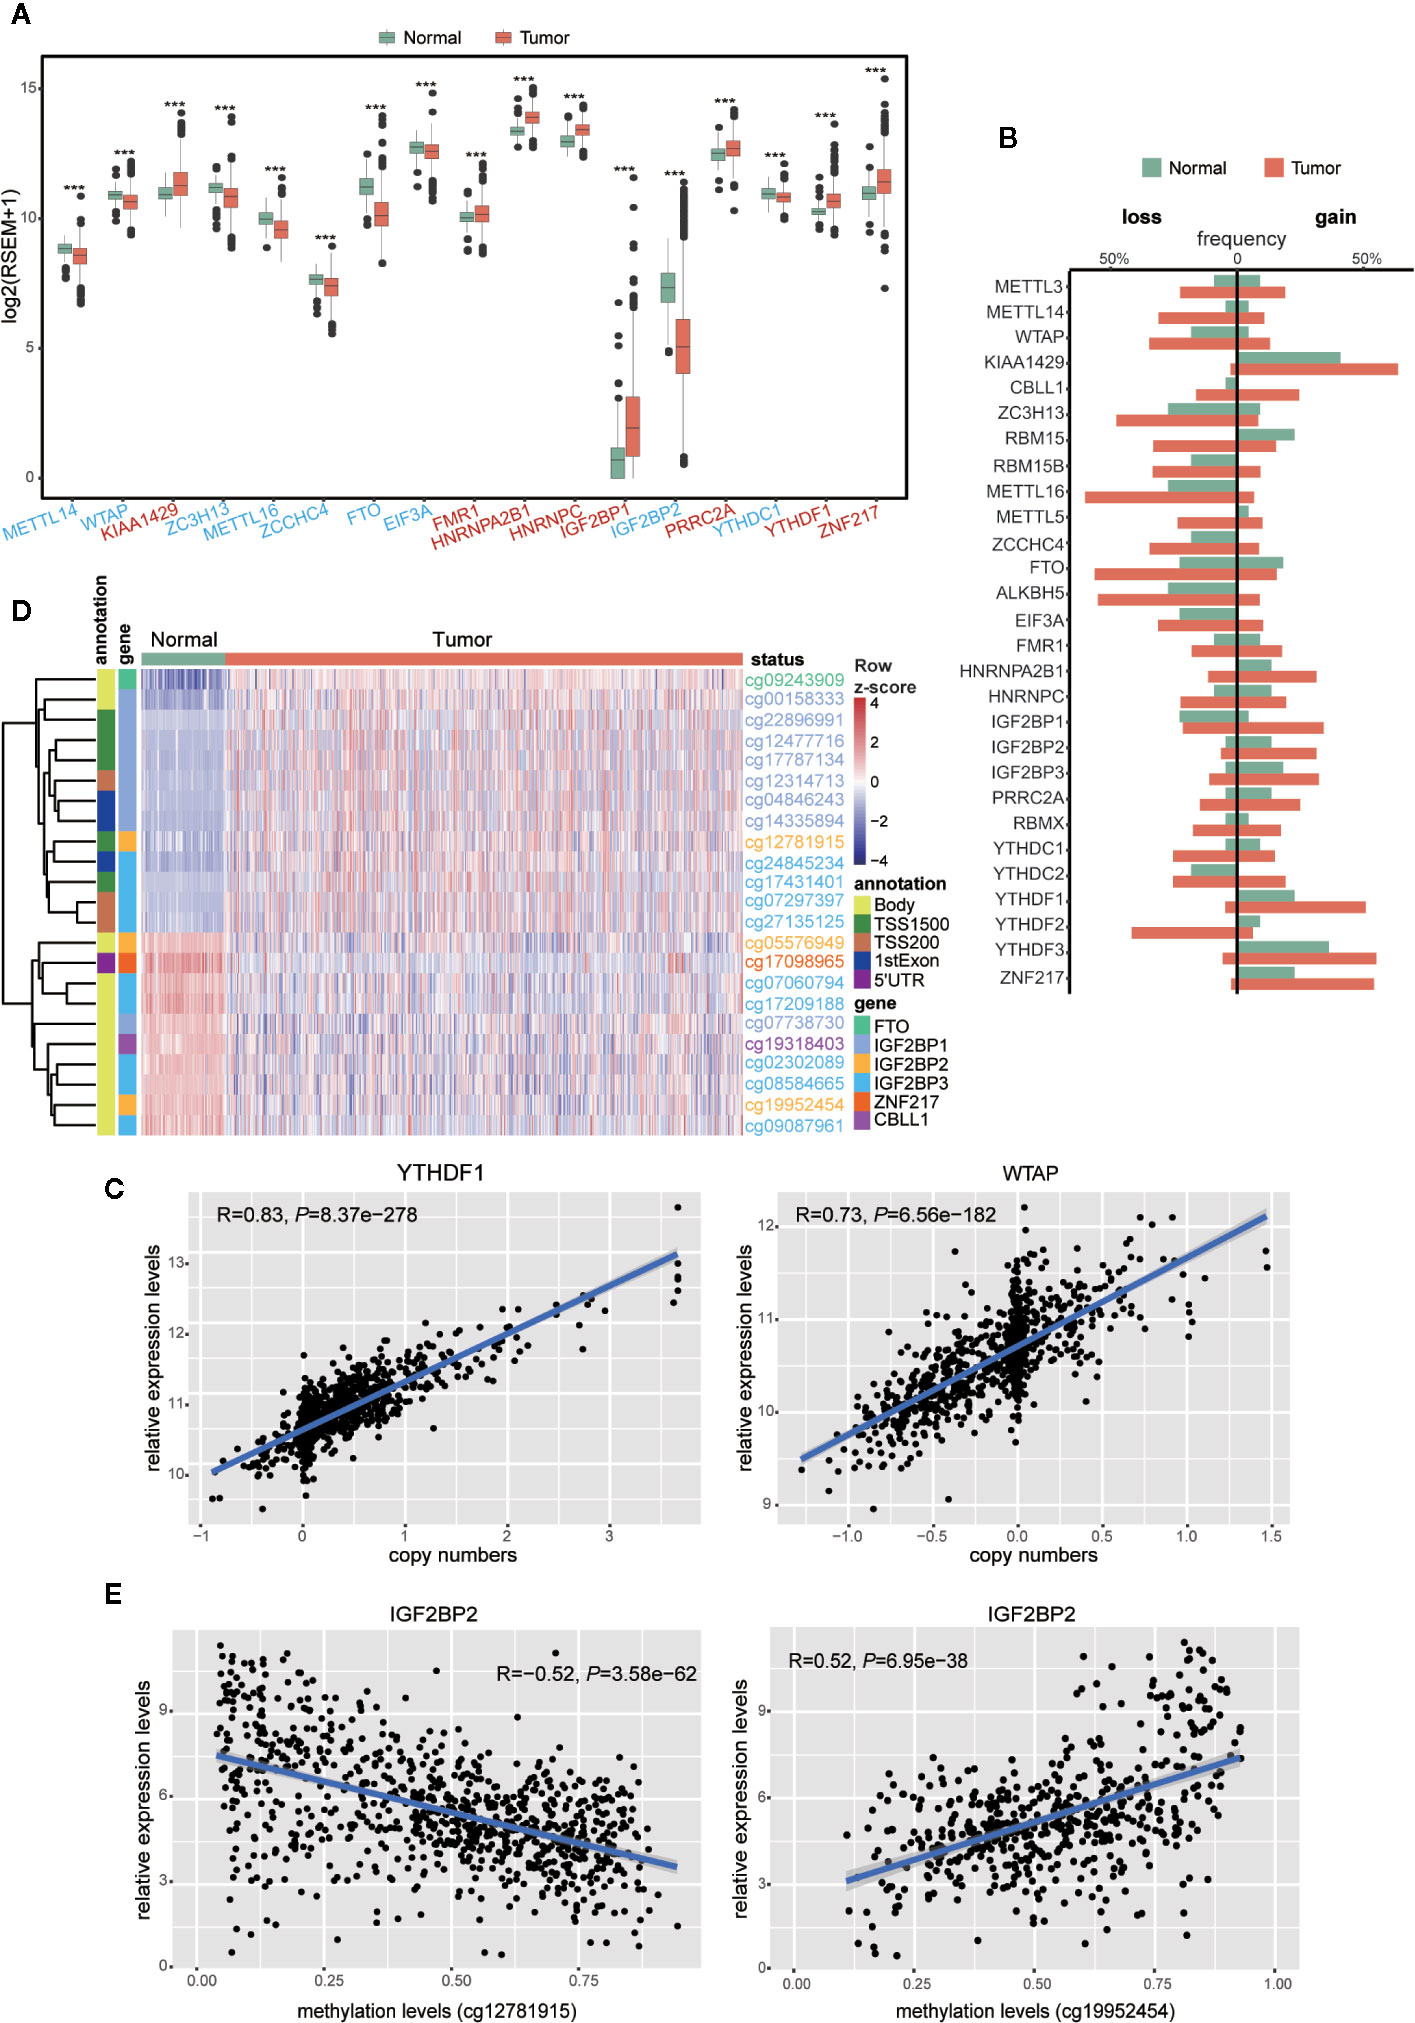
Figure 1 Expressions and genetic variations of m6A regulators in breast cancer. (A) Boxplot showing the m6A regulators with highly significant difference in their RNA expression between normal and tumor samples (***P < 0.001). Different colors of axis labels stand for the changing direction of gene expression in tumor, with red labels representing upregulation and blue labels representing downregulation. (B) Frequencies of the copy number gain/loss of each m6A regulator in normal and tumor samples. (C) Correlation analysis between the gene expression levels and copy numbers of two representative genes (YTHDF1 and WTAP) with the highest correlation coefficients. (D) Unsupervised hierarchical clustering heatmap showing the beta-values of 23 differentially methylated DNA probes between normal and tumor samples. (E) Correlation analysis between IGF2BP2 expression level and its DNA methylation levels at two sites (cg12781915 and cg19952454).
To our knowledge, gene expression could be manipulated by multi-layered genomic features, such as DNA mutation, CNV, DNA methylation, and miRNA expression. To find out the abnormal regulatory elements for each m6A regulator in breast cancer, comparisons were implemented sequentially in breast cancer versus normal samples. The frequencies of gene mutation in all 28 m6A gene regulators were relatively low (Table S2). In contrast, their CNVs were prevalent for most m6A regulators. Particularly, in contrast to their low CNV frequencies (< 5%) in normal samples, CBLL1, METTL14, RBM15, IGF2BP1, YTHDC1, and YTHDF2 exhibited more than 20% difference in their frequencies of CNVs between tumor and normal samples (Figure 1B and Table S2). Next, we performed correlation analysis between copy numbers and gene expression levels to evaluate the possible effect of CNVs on gene expression. Eight regulators, including KIAA1429, METTL16, WTAP, ZCCHC4, ALKBH5, YTHDF1, YTHDF2, and YTHDF3 exhibited significant correlations (R > 0.6) between gene expression levels and copy numbers in breast tumors (Figure 1C and Table S3). It indicated that CNVs of these eight genes might be one of the causal factors to perturb their gene expression in the tumors.
In parallel, we also compared the DNA methylation levels of m6A regulators between tumor and normal samples. Among the 593 probes located in these 28 genes, 23 probes located on 6 genes, including CBLL1, FTO, IGF2BP1, IGF2BP2, IGF2BP3, and ZNF217, showed significant differences in their methylation patterns between tumor and normal samples (|Δbeta-value| > 0.2 and P < 0.05) (Figure 1D). Correlation analysis between the levels of DNA methylation and gene expression was further performed with all the breast cancer samples. Significant correlation (|R| > 0.3 and P < 0.05) was observed in WTAP, ZC3H13, ZCCHC4, FTO, ALKBH5, YTHDC2, IGF2BP2, and IGF2BP3, implying a possible role of DNA methylation in shaping their gene expression in breast cancer (Table S4). Markedly, negative correlation with gene expression levels was solely observed in the probes located on potential promoter regions, while positive correlation existed in gene body and 3’UTR regions only (Figure 1E and Table S4). This phenomenon implied that the DNA methylation in different genomic regions might have opposite effects on the gene expression (52, 53). In terms of miRNA regulation, despite the positive and negative relation observed between miRNA and m6A regulator expression, their correlation seemed to be weaker than that with copy number and DNA methylation (Table S5).
Given the roles of m6A regulators in predicting prognosis observed in various cancers, we further sought to explore their potential prognostic values in breast cancer. Univariate cox regression analysis was performed with gene expression, copy number, and DNA methylation. In terms of gene expression, METTL3, RBM15B, HNRNPC, YTHDC1, and ZNF217 appeared to be protective factors with HR < 1, while IGF2BP1 and YTHDF3 were risky genes with HR > 1. Notably, higher expression of IGF2BP1 was a risky factor for overall survival (OS), disease-free survival (DFS) and progression-free survival (PFS) (Figure 2A). Additionally, it turned out that CNVs of m6A regulators also had prognostic values. Thereinto, copy number loss of FTO was a protective factor, while copy number gain of another 9 m6A regulators marked a worse prognosis (Figure 2B). Particularly, copy number loss of ZNF217 was associated with shorter OS, DFS and PFS of breast cancer patients. Regarding DNA methylation, we identified a total of 74 CpG sites located on 19 genes whose DNA methylation levels were associated with the OS, DFS or PFS of breast cancer patients (Figure 2C). Most of the methylation sites exhibited protective roles in prognosis. Conversely, higher methylation levels of 16 CpG sites located on WTAP, RBM15B, EIF3A, FMR1, HNRNPA2B1, IGF2BP1, IGF2BP2, IGF2BP3, and YTHDF3 were associated with poor prognosis. Intriguingly, although located on the same genes, methylation levels of distinct sites had opposite roles in predicting prognosis. Inconsistently, all significantly predictive methylation sites on FTO and YTHDC1 exhibited protective values in prognosis.
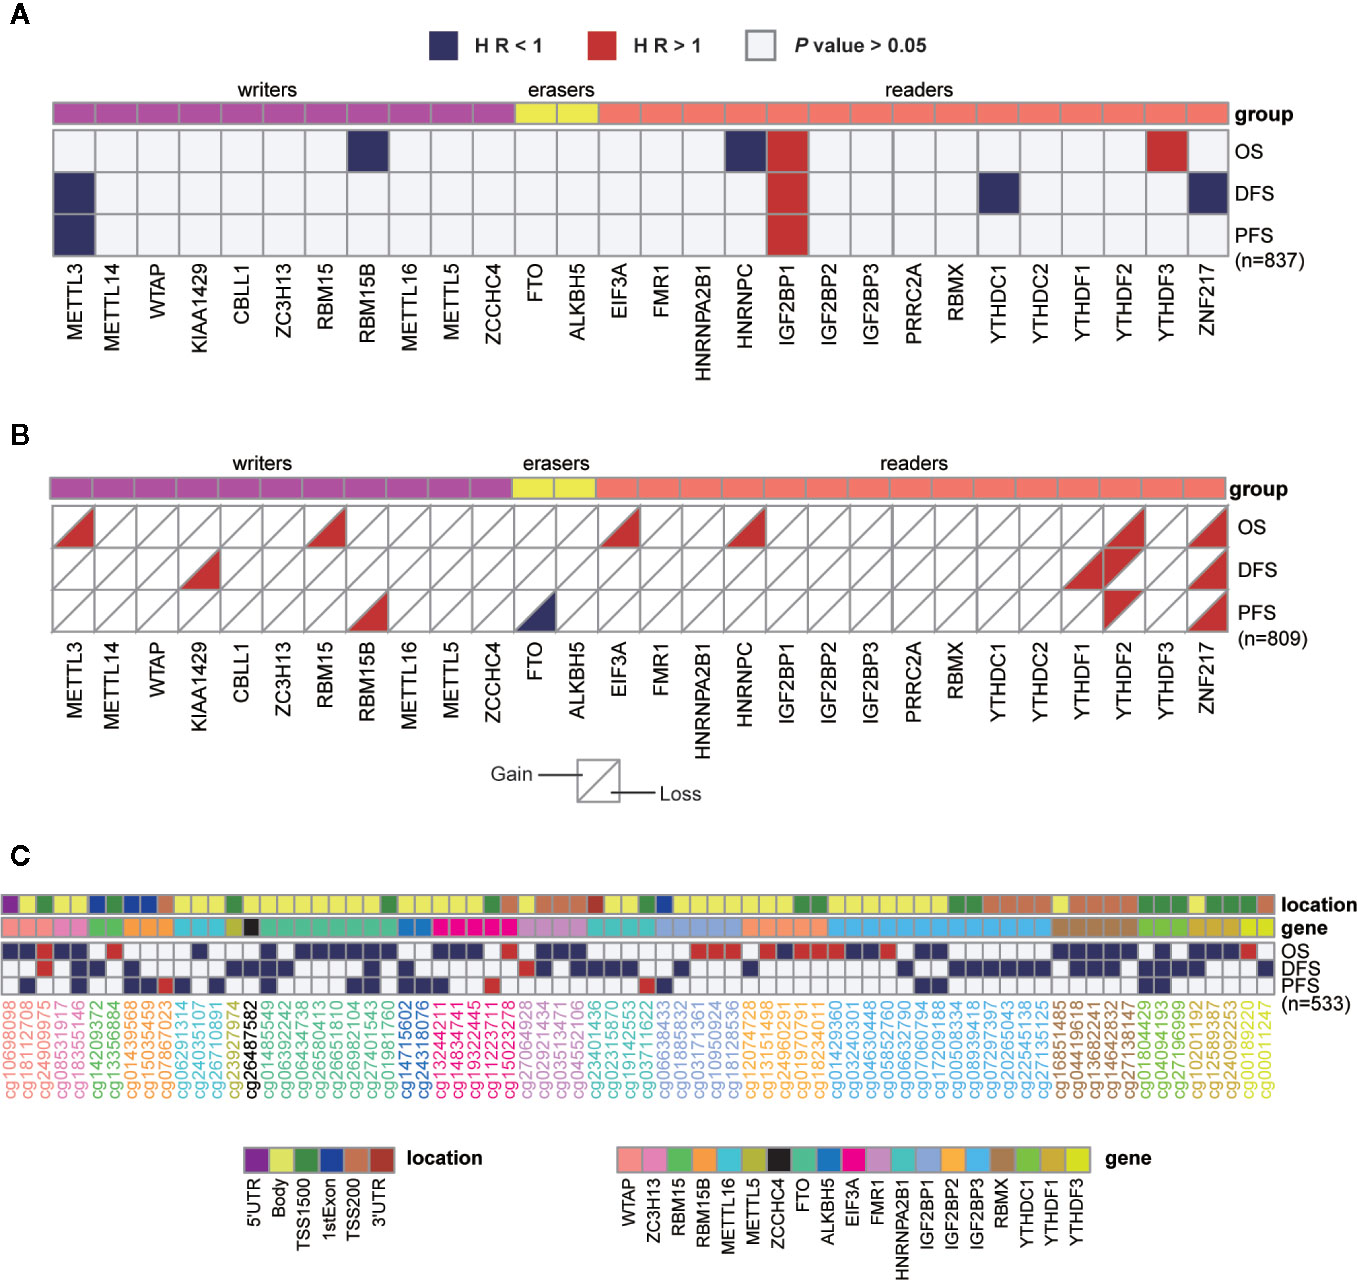
Figure 2 Univariate cox regression analysis of m6A regulators. (A–C) Univariate cox regression analysis of the association between overall survival (OS), disease-free survival (DFS), or progression-free survival (PFS) and gene expressions (A), copy number variations (B), or DNA methylation levels (C). Blue box, protective factors (HR < 1 and P < 0.05); Red box, risky factors (HR > 1 and P < 0.05); white box, P > 0.05. The sample size used in each cox regression analysis was marked in brackets.
In addition to the genetic and transcriptional alterations of m6A regulators, we further explored whether we could detect any changes at protein level. By comparing tumor and normal samples, we found that six proteins were differentially expressed in breast cancer significantly (P < 0.001), including EIF3A, HNRNPA2B1, HNRNPC, RBMX, YTHDF1, YTHDF2 (Figure 3A). Among them, three genes (HNRNPA2B1, HNRNPC, YTHDF1) exhibited consistently aberrant expression in both RNA and protein levels while EIF3A had reverse change direction in RNA and protein levels. Besides, we performed cox regression analysis to evaluate the prognostic values of m6A regulators at protein level (Figure 3B). As a result, IGF2BP2 and IGF2BP3 showed significant prognostic values of being risk factors (HR > 1) for OS of breast cancer patients.
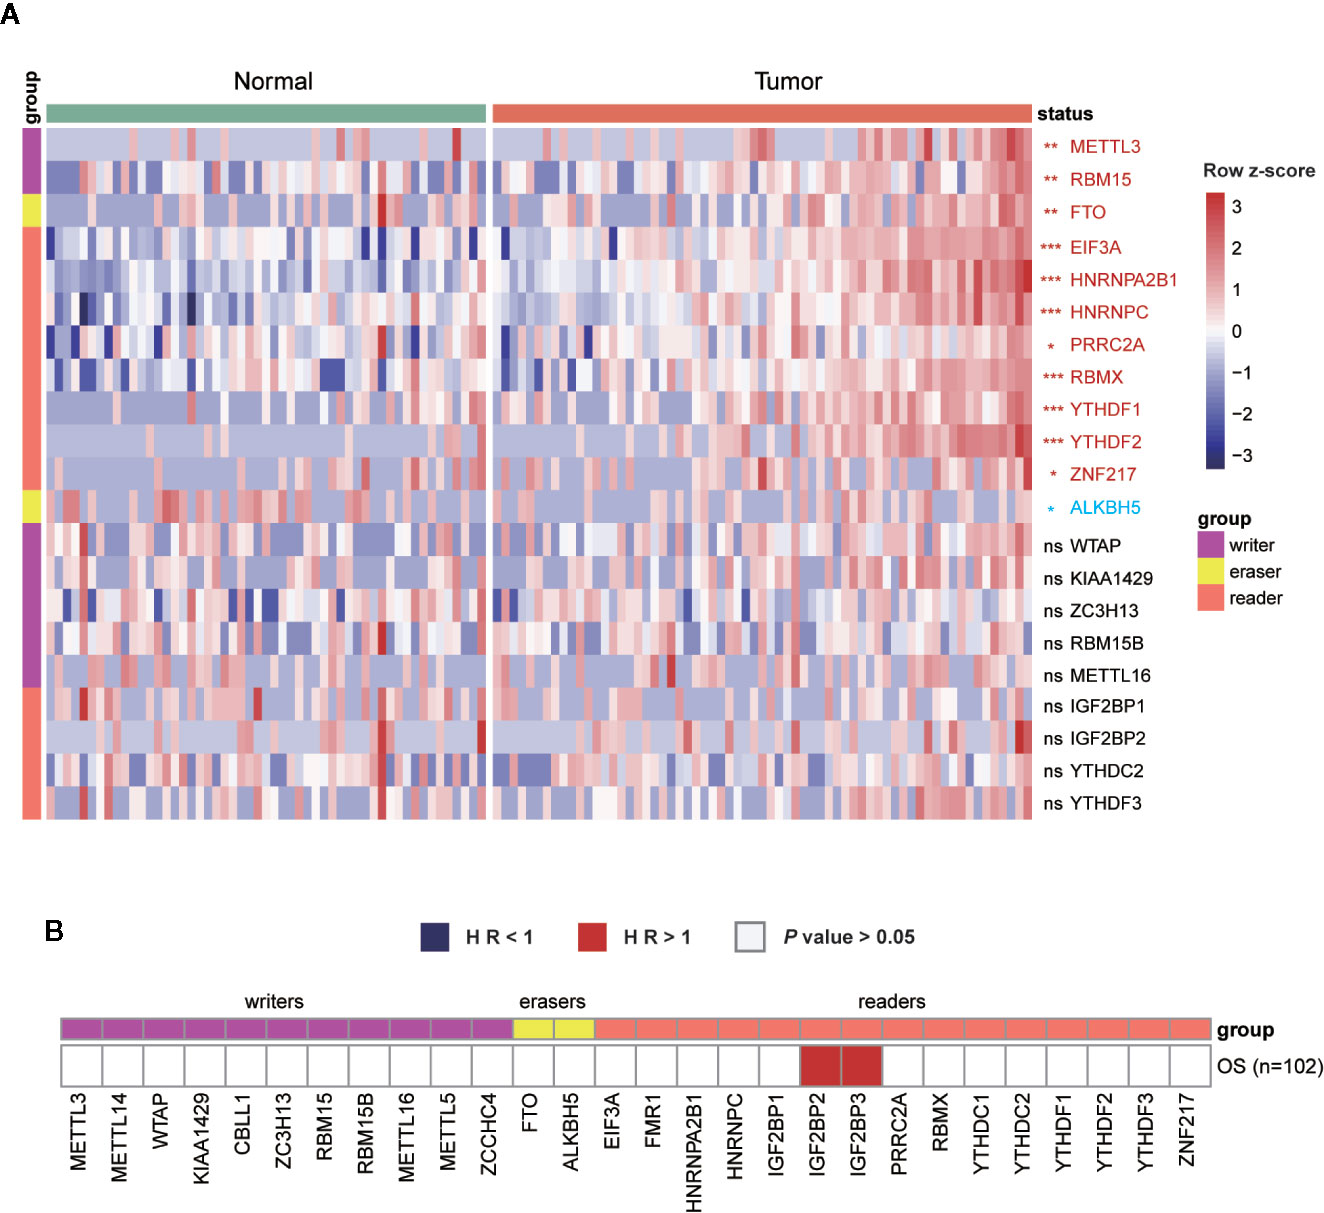
Figure 3 Expressions and survival analyses of m6A regulators at protein level. (A) Comparison of m6A regulators between tumor and normal samples at protein level. The change direction was exhibited by label colors, with red representing for upregulation and blue representing for downregulation. ns, P > 0.05; *P < 0.05; **P < 0.01; ***P < 0.001. (B) Univariate cox regression analysis of the association between protein expression levels and OS of patients. Blue box, protective factors (HR < 1 and P < 0.05); Red box, risky factors (HR > 1 and P < 0.05); white box, P > 0.05.
Together, we offered a comprehensive view of genetic, transcriptional, and post-transcriptional alterations of 28 known m6A regulators in breast cancer, indicative of their possible roles in tumorigenesis and diverse regulatory mechanisms. Moreover, a few genes were identified to be potential predictors for patient survival based on their changes in gene expression, copy numbers, DNA methylation, or protein levels.
Diverse Expression Patterns and Regulations of m6A Regulators Among the Four Subtypes Revealed the Unique Characters of Basal-Like Subtype
Given the undeniable diversity in molecular mechanisms and clinical characteristics among the four subtypes of breast cancer, we next explored whether those m6A regulators exhibited any differences among them. First, by comparing the protein expression of all regulators, only IGF2BP2 exhibited differential expression among the four subtypes (Figure S2).
To further investigate the variance among different subtypes, we turned to compare them at the transcriptional level. Ultimately, we found that 23 out of 28 m6A regulators exhibited significantly distinct expression levels among the four subtypes (Figure 4A). Next, to further explore and visualize the dispersion of m6A regulators in all subtypes, we adopted t-SNE method to reduce the high dimensional expression data into a lower-dimensional subspace. This result showed that breast cancer samples could be segregated from normal samples judged by the expression of m6A regulators. Strikingly, basal-like subtype displayed evident segregation from another three subtypes as well (Figure 4B). These results implied that the function of those m6A regulators in the four subtypes varied from each other. Particularly, basal-like subtype might exploit unique regulatory mechanisms in malignant progression driven by RNA m6A modification.
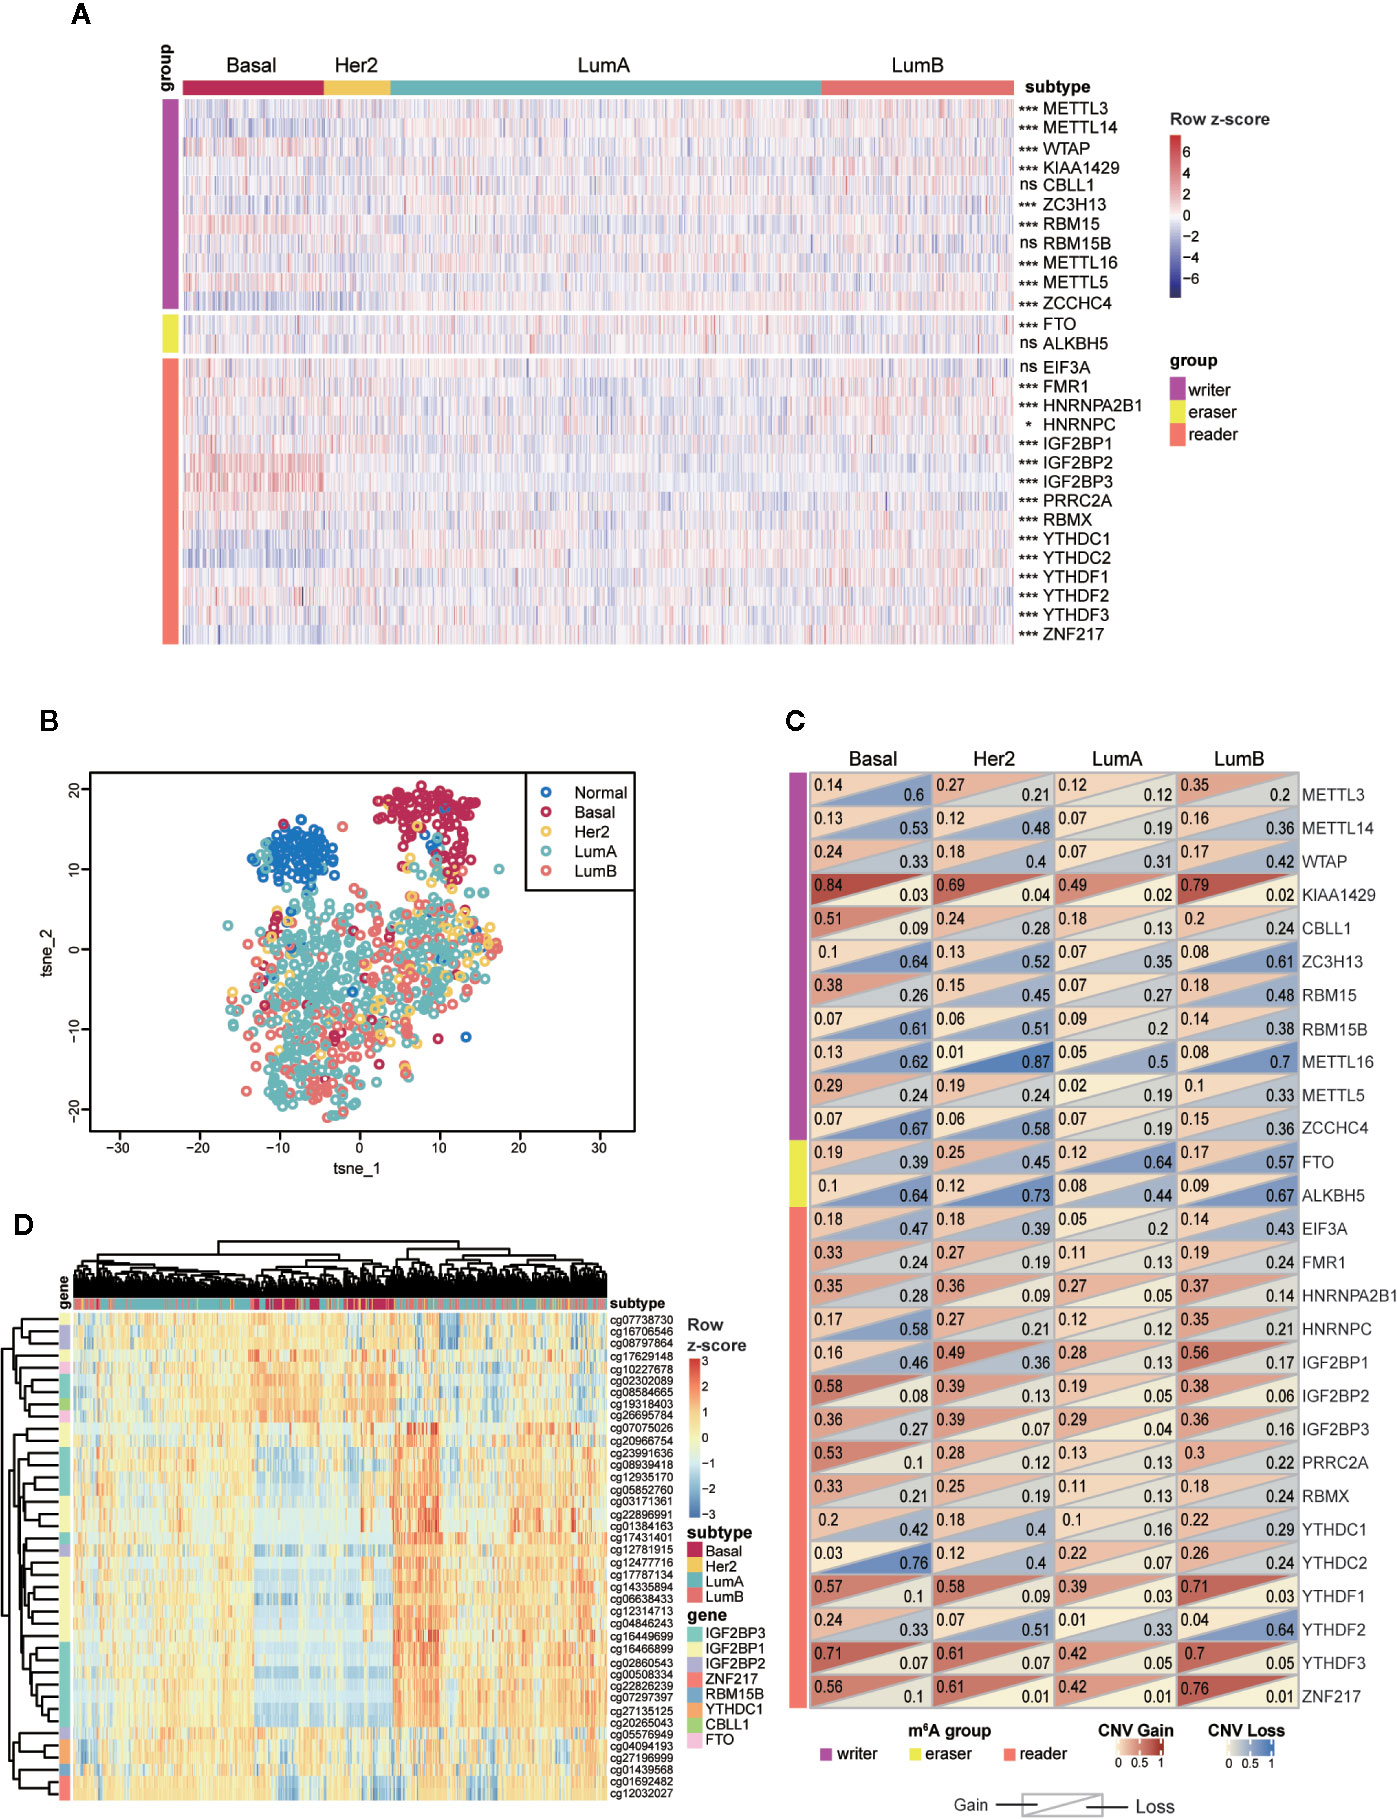
Figure 4 Expressions and genetic variations of m6A regulators among the four subtypes in breast cancer. (A) Heatmap showing the expression of m6A regulators and their differences among the four subtypes. ns, P > 0.05; *P < 0.05; **P < 0.01; ***P < 0.001. (B) t-SNE plot of normal and breast tumor samples showing the separation of normal and Basal-like samples from other groups. The colors were assigned according to sample type. (C) Frequencies of copy number gain/loss of m6A regulators in each subtype. The upper triangle of a single rectangle displays the frequency of copy number gain of each gene in each subtype, and the lower triangle displays the frequency of copy number loss. (D) Unsupervised hierarchical clustering analysis for four subtypes of tumors based on 40 highly variable DNA methylation probes (SD > 0.2). LumA, luminal A; LumB, luminal B; Her2, HER2-enriched; Basal, Basal-like.
Next, we examined the frequencies of copy number gain/loss in each subtype, respectively (Table S6). Although most genes showed high frequencies of CNV without apparent discrepancy among the four subtypes, we noticed that several genes involving CBLL1, RBM15, PRRC2A exhibited particularly high frequencies of copy number gain event in basal-like subtype. Of note, 51.1% of basal-like samples contained copy number gain of CBLL1, and other subtypes showed much lower proportion (23.9% of HER2, 18.3% of luminal A, and 19.8% of luminal B). Additionally, the frequency of copy number loss in METTL3 was higher (60.0%) in basal-like subtype than that in another three subtypes (HER2: 20.9%; luminal A: 11.6%; luminal B: 20.3%); copy number loss of YTHDC2 occurred in 75.6% of basal-like tumors while significantly less in other samples (HER2: 40.3%; luminal A: 7.2%; luminal B: 24.0%) (Figure 4C). In short, CNVs of m6A regulators were prevalent in breast tumors, and the basal-like subtype exhibited the highest frequencies compared to other subtypes.
Next, DNA methylation status of the m6A regulators was compared among the four subtypes. Among all the probes detected in the 28 regulators, we observed that most of the CpG loci exhibited similar methylation levels among all samples (Figure S3). Therefore, only the highly variable methylation loci that met the criteria of standard deviation greater than 0.2 (SD > 0.2) across all tumor samples were included for subsequent analysis. Unsupervised hierarchical clustering was performed on both samples and probes to reveal the diverse methylation patterns among tumor samples. As shown in Figure 4D, DNA methylation patterns of a cluster of CpG sites on IGF2BP1, IGF2BP2, and IGF2BP3 exhibited prominent variance among all clustered groups. As for the clustering results, the sharpest distinction was drawn between basal-like and other subtypes. Nevertheless, parts of luminal samples were clustered together with most basal-like samples and they shared similarities in methylation levels. The discrete distribution of luminal samples reflected the noticeable intragroup heterogeneity within luminal A/B subtype revealed by the DNA methylation levels of m6A regulators.
In general, the above results indicated that most m6A regulators examined in this study possessed distinct molecular characteristics among the four subtypes. Particularly, the basal-like subtype displayed a unique feature in the aspect of gene expression, CNV and DNA methylation. Of note, DNA methylation analysis distinguished a cluster of samples consisting of basal-like subtype and a part of luminal samples due to their similar DNA methylation patterns.
Subclassification of Luminal Subtype Breast Cancers Based on DNA Methylation of m6A Regulators
Although it is widely accepted that basal-like breast cancers have the highest tendency of recurrence and metastasis, some patients allocated to luminal subtype also suffer from early recurrence and metastasis which poses a big challenge in clinical practice. Given the unique profile of m6A regulators in basal-like subtype and high intragroup heterogeneity within luminal subtype, we asked if the m6A features of basal-like subtype could be applied to subclassify the luminal subtype and to distinguish the luminal samples which resembled basal-like subtype in the recurrent and metastatic property. To address this question, we firstly made efforts to obtain the basal-like subtype-featured m6A regulators. Based on the gene expression of 28 regulators, random forest machine learning was used to rank the gene importance and varSelRF method for variable selection. We consequently identified four genes (IGF2BP2, IGF2BP3, YTHDC2, and RBM15) as important predictors in distinguishing basal-like subtype from other subtypes (Figures 5A, B). Then, the expression values of those four genes were imported to consensus clustering analysis for both basal-like and luminal breast cancers. Unexpectedly, we failed to subclassify luminal samples in this way (Figures S4A, B).
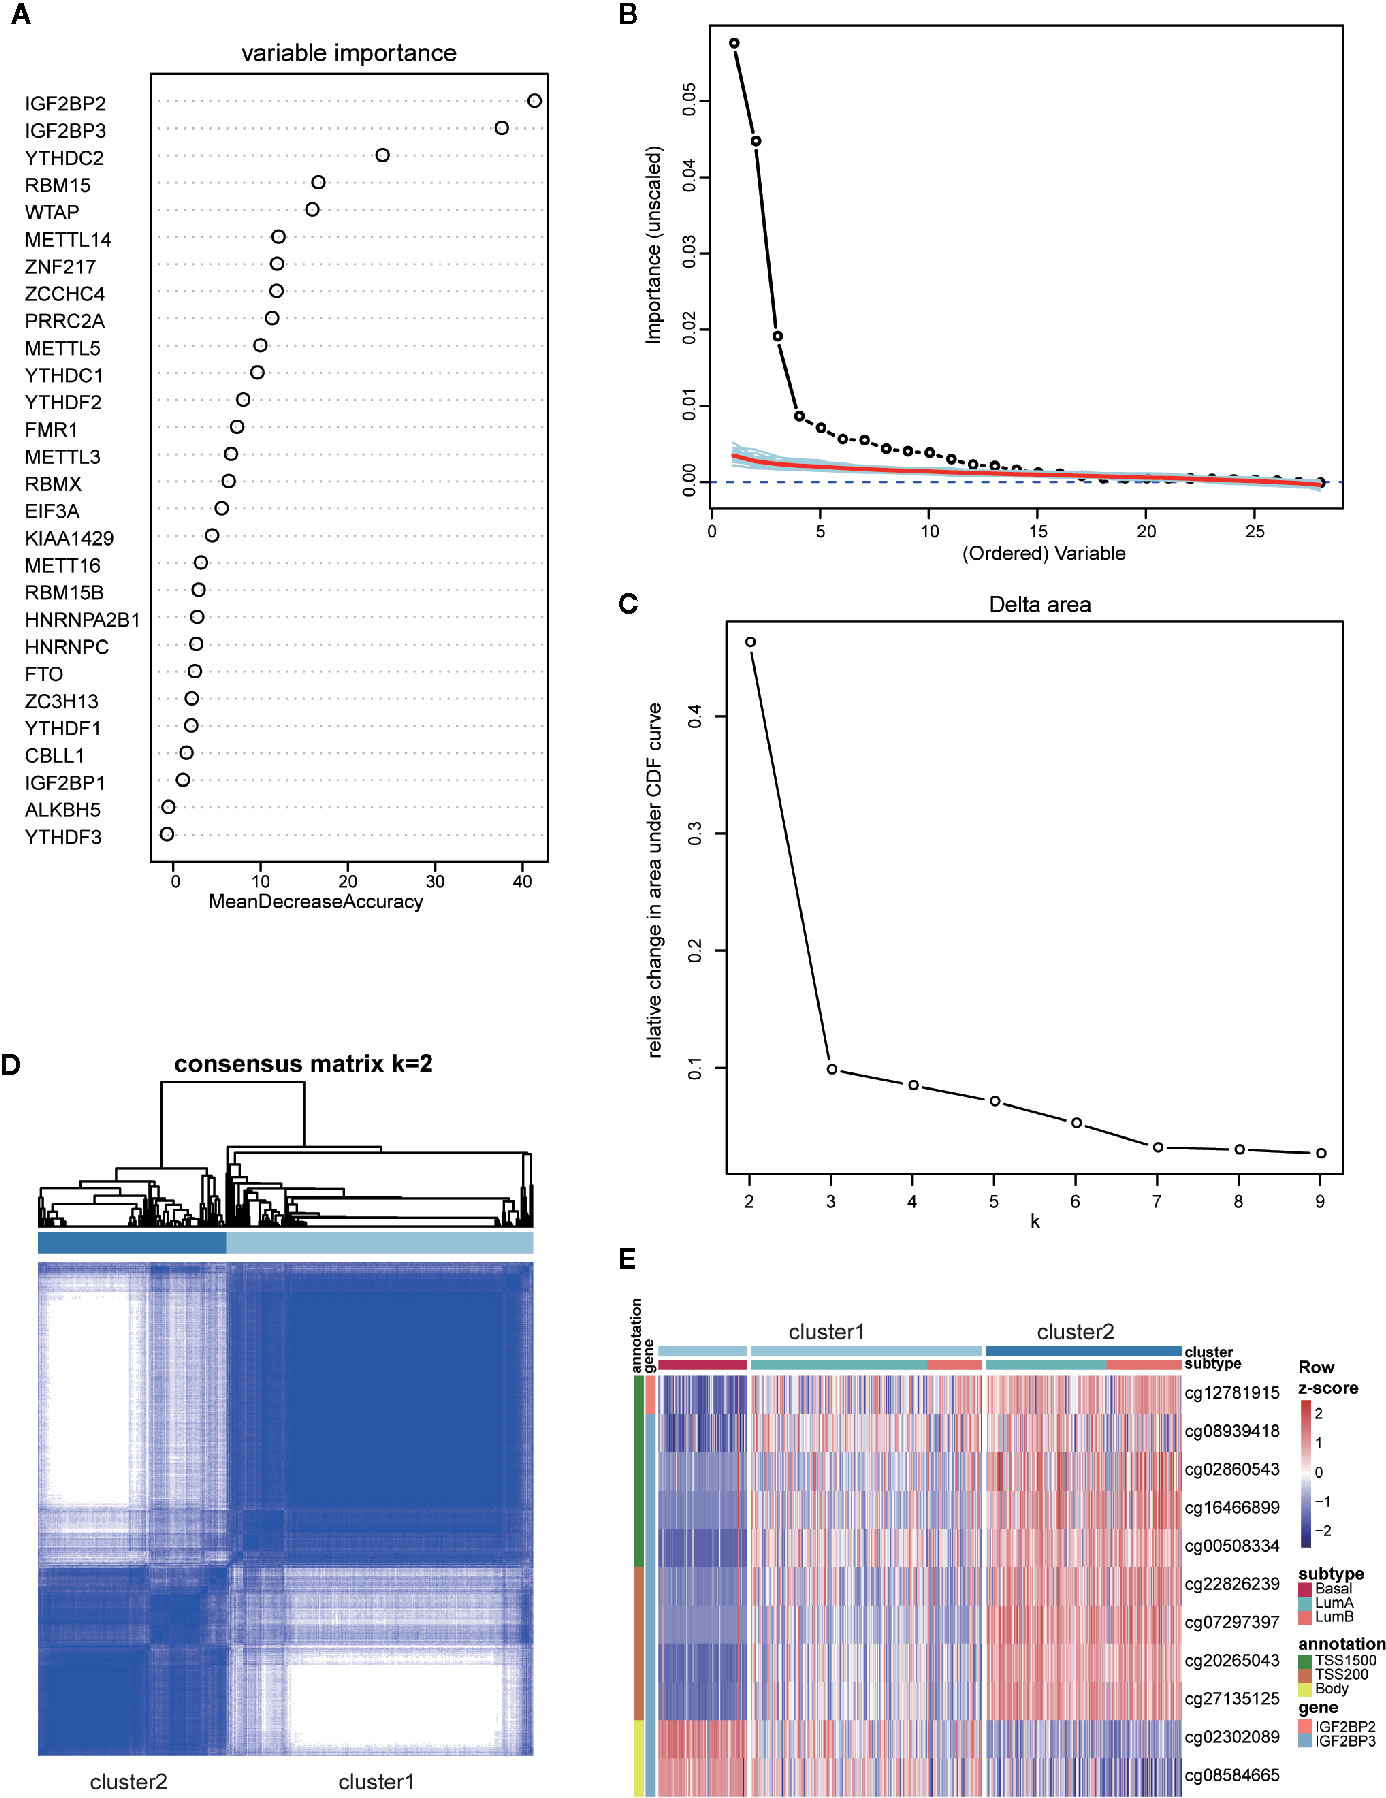
Figure 5 Identification and consensus clustering analysis of basal-featured m6A regulators. (A) Random forest analysis ranking the importance of m6A regulators in basal subtype segregation based on their gene expression levels. (B) Importance spectrum plots for optimizing the number of relevant variables according to random forest analysis. (C) Relative change in area under cumulative distribution function (CDF) curve based on results of consensus clustering for k = 2 to 9. (D) Consensus clustering matrix for k = 2. (E) Heatmap showing the methylation levels of 11 probes utilized for samples classification in the two clusters.
Our previous clustering analysis of DNA methylation sites revealed that a certain number of luminal samples exhibited similar patterns to basal-like subtype in their DNA methylation patterns of highly variable CpG loci (Figure 4D). Therefore, we examined the possibility of using the DNA methylation status on those four genes for patients’ subclassification. Following the criteria of large standard deviation (SD > 0.2) and high correlation with gene expression (|R| > 0.3), 11 probes located on IGF2BP2 and IGF2BP3 were screened out. Consensus clustering was subsequently implemented in R with the beta values of 11 probes, and k = 2 was the optimal result, with clustering stability increasing from k = 2 to 9 (Figures 5C, D). Strikingly, according to the clustering results, luminal subtypes were successfully divided into two clusters, in which cluster1 was composed of all basal-like samples and parts of luminal samples, while cluster2 was composed of luminal samples only (Figure 5E). As for these two clusters, the methylation patterns of 11 probes in luminal-cluster1 samples were similar to basal-like samples rather than luminal-cluster2 samples. Interestingly, both luminal A and luminal B subtypes were divided into two groups and distributed in the two clusters.
To better understand the differences between the two clusters, we performed differential expression analysis and identified 2,071 upregulated and 655 downregulated genes (adjusted P < 0.05 and FoldChange > 1.5 or < 0.66) (Table S7). Next, KEGG functional enrichment analysis revealed that the upregulated genes in cluster1 of both luminal A and luminal B subtypes were mostly enriched in immune-related and cell adhesion-related pathways (Figure 6A and Table S8). To further decipher the distinct immune traits between the two clusters, we took advantage of GSVA method to evaluate the relative quantity of immune cell populations infiltrated in each sample. The results showed that samples in cluster1, similar to that in basal-like subtype, had higher enrichment in most kinds of immune cells than those in cluster2 (Figure 6B).
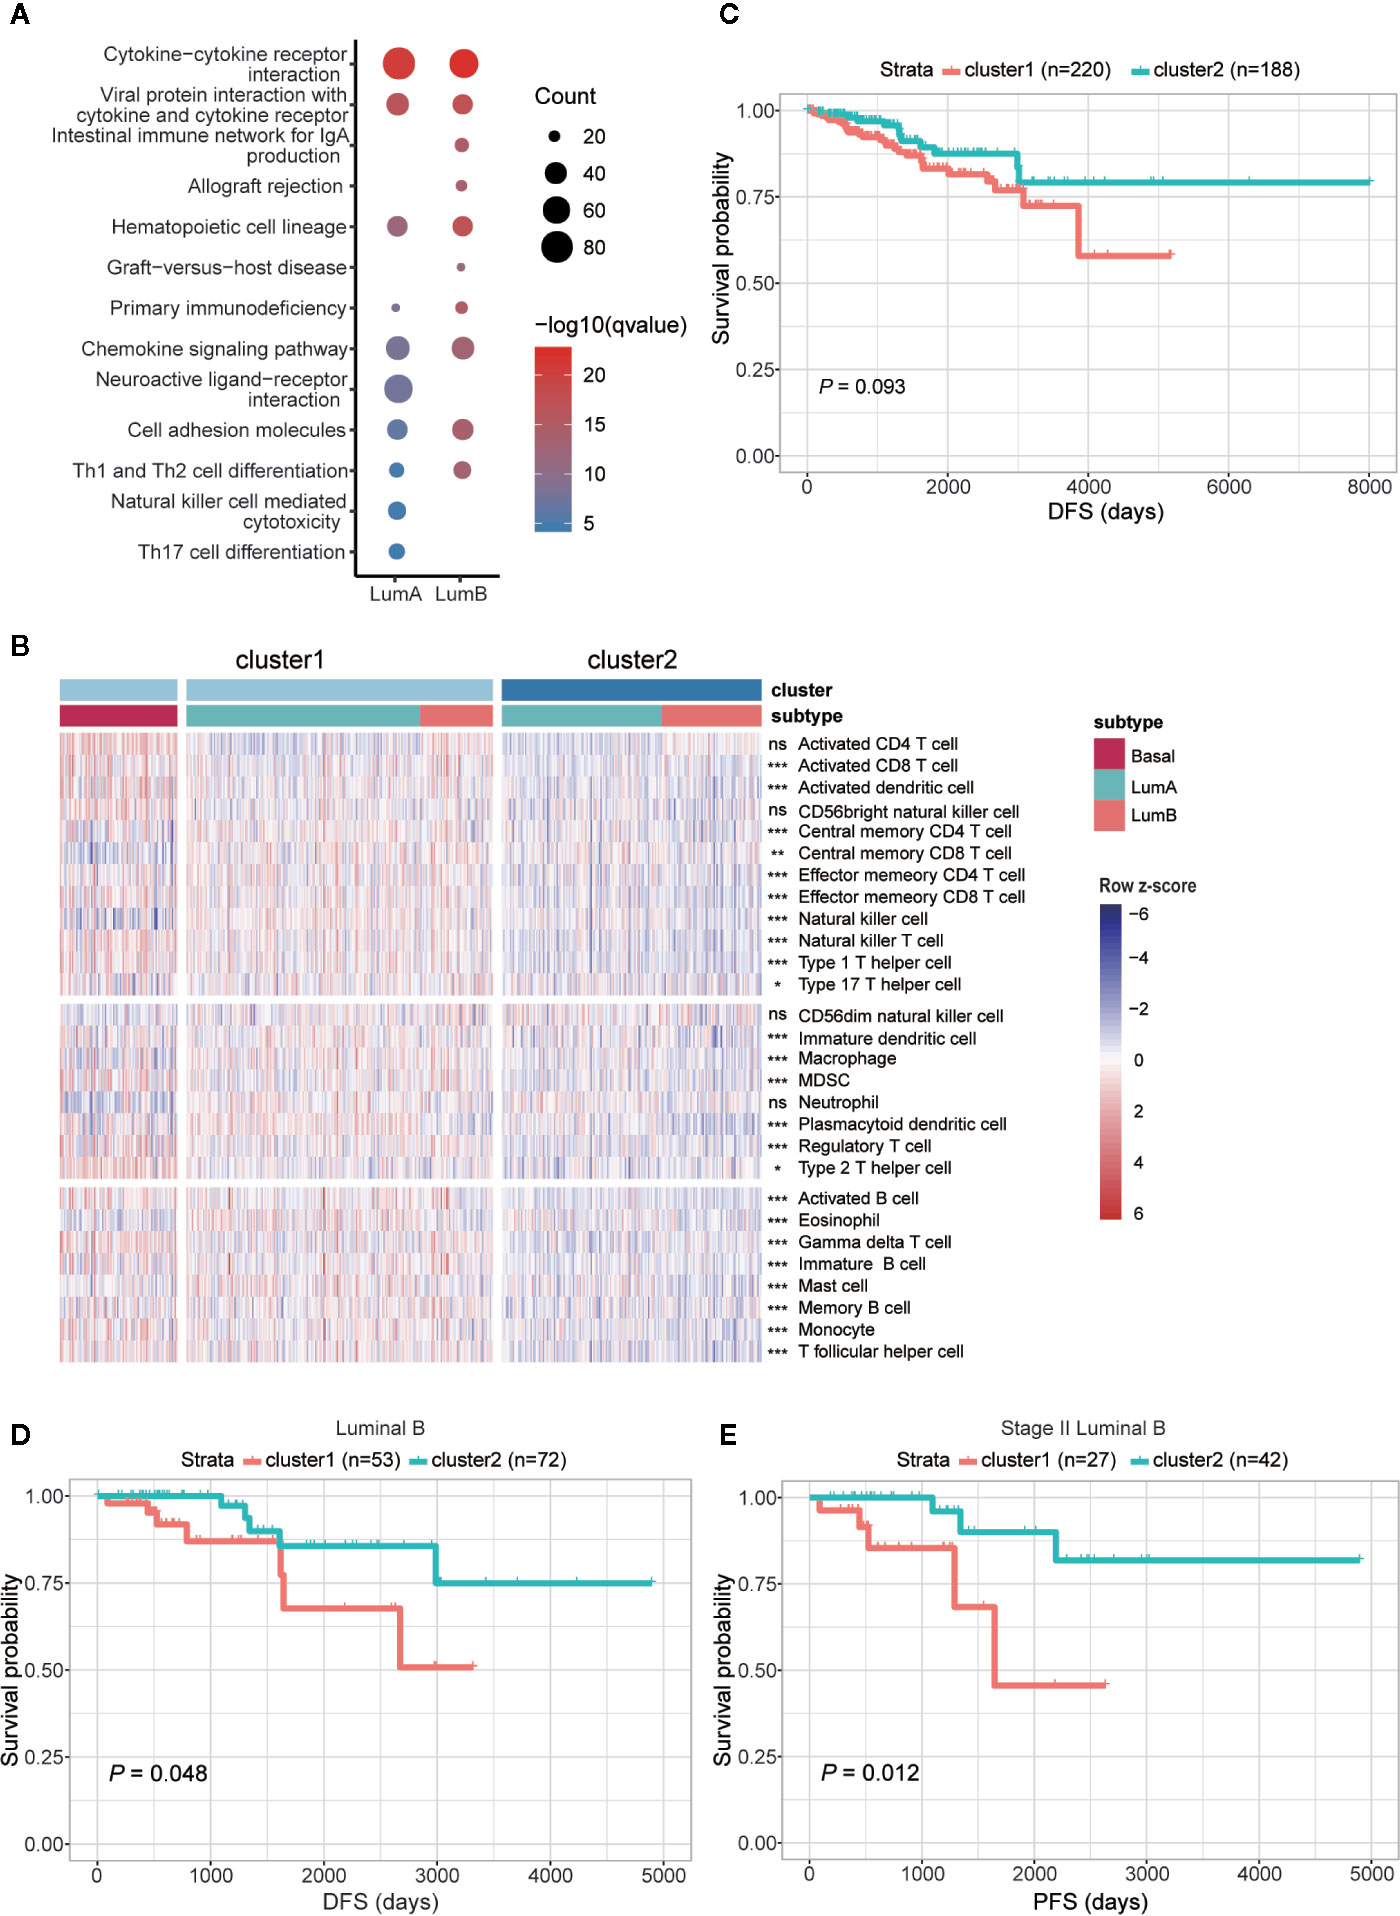
Figure 6 Comparison of functional and clinical relevance between the two clusters in luminal samples. (A) KEGG enrichment analysis of genes upregulated in cluster1 within luminal A and luminal B subtypes, respectively. (B) Heatmap showing relative quantities of infiltrated lymphocytes in the two clusters. (C) Comparison of DFS between the two clusters. (D) Comparison of DFS between cluster1 and cluster2 samples in luminal B subtype. (E) Comparison of PFS between the two clusters among patients diagnosed as stage II in luminal B subtype. The sample size of each group was marked in brackets.
Given that cluster1 possessed similar m6A features with basal-like subtype and higher expression of immune-related genes, we further examined their clinical relevance in the two clusters. Comparison of survival status revealed that patients fitting in cluster1 had worse DFS than those in cluster2 (Figure 6C), but the difference of OS and PFS between the two clusters was indistinct (Figures S5A, B). To rule out the impact of different subtypes on prognosis, we next compared the two clusters within each subtype separately. It turned out that within luminal B subtype, patients in cluster1 had worse DFS than cluster 2 (Figure 6D), although no significant difference was observed in luminal A subtype (Figures S5C–E). Furthermore, in further consideration of the impact of disease stage to patient prognosis, comparisons were processed within each stage of luminal B subtype. Consequently, the most significant difference in both DFS and PFS was observed within the patients diagnosed with stage II of luminal B subtype (Figures 6E, S5F–G).
Overall, we identified basal-like subtype-featured m6A regulators, and further utilized their methylation patterns to successfully subclassify the luminal A/B tumors into two clusters, respectively. In line with the enrichment of immune-related genes, cell adhesion molecules and higher enrichment of tumor infiltrating lymphocytes, cluster1 samples, especially those allocated to luminal B subtype, had higher risk of disease recurrence.
Discussion
With our increasing knowledge of m6A methylation in modulating RNA metabolism, how dysregulated m6A is involved in cancer has attracted much more attention than ever. Here, we examined the distinctive expression of m6A regulators and the multilayered regulation on them in breast cancer. Comparison among the four subtypes revealed a unique m6A feature of basal-like subtype from others. Furthermore, according to the DNA methylation status of 11 probes located on basal-featured m6A regulators, luminal subtypes were subclassified into two clusters with significantly different prognosis.
Till now, a few of studies have shown aberrant expression of five m6A regulators in breast cancer and clarified the molecular mechanism of ALKBH5- and ZNF217-mediated tumor occurrence (23, 25, 26, 28–30). Here we found a total of 17 m6A regulators exhibiting aberrant gene expression in breast cancer. Despite that some of them have been confirmed an oncogenic or tumor-suppressive role in hepatocellular carcinoma, leukemia, glioblastoma, and others (21), how these regulators are involved in the onset and progression of breast cancer remains elusive yet. Besides, we reported for the first time that CNV and DNA methylation change of m6A regulators might participate in tumorigenesis of breast cancer by shaping the gene expression. For instance, the highest correlation between copy numbers and gene expression levels was observed in YTHDF1, while IGF2BP2 has the strongest negative correlation between its DNA methylation and gene expression levels. Therefore, characterization of their functions and associated regulatory mechanism will shed new light into the mechanistic study of breast cancer from the viewpoint of RNA m6A methylation. In addition, we found that gene expression, copy numbers, DNA methylation levels and protein expression of several m6A regulators had significant correlation with either poor or improved disease outcomes, which could provide additional prognostic information and assist with precise medicine of breast cancer. It’s worth noting that, since gene expression and copy numbers or DNA methylation levels are not always correlated, they may have different or even opposite prognostic values. This inconsistency may arise from the complicated regulatory network of gene expression. For instance, multiple copies of a gene could be regulated differentially due to their corresponding chromatin environments (54). Furthermore, gene duplications that do not include distal regulatory elements important for the gene expression will not contribute to higher expression (55). On the other side, the effects of DNA methylation on gene expression are dependent to a large extent on the genomic locations of DNA methylation sites. Concretely, methylation in promoter region usually negatively correlates with gene expression, while methylation in the gene body does not block and might even stimulate transcription elongation (56). For example, among the 15 DNA methylation probes of IGF2BP3 identified in our study, the levels of 10 methylation occurring in the promoter region showed a strong negative correlation with gene expression, while the opposite trend was observed with the four methylation sites in the gene body. Hence, although luminal subtype could be subclassified into two clusters based on the methylation levels at specified CpG loci of IGF2P2 and IGF2BP3, we did not observe apparent difference in their gene expression levels between the two clusters.
Among the 28 regulators, IGF2BP2, IGF2BP3, YTHDC2, and RBM15 were identified as basal-like subtype-featured m6A regulators. Among them, IGF2BP2, IGF2BP3 and RBM15 were highly expressed in basal-like tumors while YTHDC2 was lowly expressed in them (Figure 4A). Consistent with our findings, Barghash et al. reported that increased expression of IGF2BP2 was regarded as a feature of basal-like subtype and correlated with short survival (57). In addition, suppressed IGF2BP2 could hinder cell proliferation and invasion in breast cancer (58). As to IGF2BP3, despite the comparable expression between breast cancer and normal samples in our data, its expression in basal-like subtype was significantly higher than that in other subtypes (Figure 4A). In agreement with that, tumors with higher IGF2BP3 expression were characterized by increased tumor size, advanced tumor stage, and lymph node metastasis (59). Similarly, higher protein levels of IGF2BP2 and IGF2BP3 were also proved to be associated with high-risk prognosis in our results (Figure 3B). Different from IGF2BP2 and IGF2BP3, although the oncogenic roles of YTHDC2 and RBM15 have been identified in colon cancer (60) and acute megakaryoblastic leukemia (61–63), their functions in breast cancer await to be identified.
Breast cancer is a complex disease with large degree of intertumoral and intratumoral heterogeneity. In recent years, molecular subtyping distinguished by gene expression profiling in breast cancer has contributed a lot to prolong patients’ survival due to the improvement in precise diagnosis and targeting therapy (6). Nevertheless, within each subtype, there still exists substantial heterogeneity and therefore requires more extensive and thorough investigation of breast cancer. In this study, in addition to the significant difference between normal and cancer samples, the performances of these m6A regulators in the four subtypes were distinct from each other as well. Particularly, basal-like subtype is unique in its gene expression, copy number, and DNA methylation. Given the fact that basal-like subtype is more aggressive and has a worse prognosis than other subtypes (1, 4, 5), the unique features of m6A regulators in basal-like subtype suggest their possible involvement in tumor invasion and metastasis. In line with that, higher expression of cell adhesion molecules was detected in samples assigned to cluster1, further indicating the correlation between m6A regulators and breast cancer malignancy.
Luminal breast tumors are the most common subtypes (64); meanwhile, they are also highly heterogeneous in the aspect of histology, gene expression profiles, genetic alterations, and clinical outcomes (65). Despite endocrine therapy and chemotherapy available for them, some patients of this subtype still suffer from relapse and poor prognosis (7, 66), thereby highlighting the emergent need for early prediction for those latent patients. Effective biomarkers can accurately instruct patients to access suitable therapies, thus helping advanced patients to achieve positive clinical response to treatment in a short time. As DNA is more stable than RNAs or proteins and easily quantified, DNA methylation is considered as a robust biomarker and promising biomarker for early detection and diagnosis (67). In this study, based on DNA methylation of m6A regulators, luminal samples were subclassified into two clusters with distinct expression levels of immune-related genes. According to previous studies, immune environment of breast tumors has profound effects on patients’ prognosis and varies among the four subtypes. Accordingly, basal-like subtype has the highest rate of TILs than other subtypes (68). In the luminal-HER2- patients, a higher TIL number was associated with shorter overall survival as well (69). This is consistent with our results that cluster1 in luminal samples had higher number of TILs and worse prognosis. Since the presence of TILs indicates better sensitivity to neoadjuvant chemotherapy (69), our subclassification strategy may provide a clue to recognize those luminal tumors more suitable for neoadjuvant therapy. The unveiled immune variance within luminal subtype in our study was also illustrated in two published research. One of them performed segregation analysis of luminal group based on immune-related genes and identified three immune subtypes which owned distinct clinical characteristics (11). The other study highlighted that even within luminal A subtype, immune heterogeneity could not be ignored either, as revealed by a large-scale transcriptome analysis. Both gene expression and DNA methylation profiles were successfully applied to segregate luminal A samples into two biologically distinct subgroups with different expression patterns of immune-related genes (14). However, this method exploited a large number of partitioning genes for subclassification, which made it difficult to be translated into clinical application. By contrast, our study put forward a small gene set that could be applied to luminal subtype partition and thereby is of more practical use. Mechanistically, as sample clustering was implemented with DNA methylation of m6A regulators, the different enrichment of TILs in luminal tumors between the two clusters may be associated with the m6A RNA methylation. RNA m6A methylation has already been reported to be correlated with immune responses, such as T cell homeostasis (70, 71), inflammatory response (72), antiviral immunity (73–77), and anti-tumor immune response (78). Thereby, intensive mechanistic studies are necessary to uncover the mechanism of how m6A impacts tumor relapse or metastasis via its modulatory roles on immune response.
Although our strategy could be successfully applied to subclassify the luminal subtype and has predictive value in clinical, some limitations should be noted here. First, given the existing inconsistency between RNA and protein levels observed in other types of cancers (79–81), it is important to depict the performance of m6A regulators in breast cancers at protein level. Although the additionally obtained two proteomic datasets provided certain information about the function of m6A regulators in breast cancer at protein levels, the sample size was not sufficient. So the conclusions needed to be assured by well-designed experiments later on. Second, there was a lack of validation cohorts in our study. We searched out for Gene Expression Omnibus (GEO), International Cancer Genome Consortium (ICGC) and Cell-Free Epigenome Atlas (CFEA) databases to filter the datasets that provided detailed clinical information including intrinsic subtypes, survival status and supported by platform Illumina HumanMethylation450 BeadChip. While in consideration of all kinds of criteria, no proper data was available. Third, due to the limited information of miRNA-mRNA interactions available from database, miRNA-mRNA regulatory network specifically existing in breast cancer may not be completely included in our datasets. So extended interaction information, particularly breast tissue-specific data is necessary for more thorough studies. Last, the heterogeneity of breast tumors represents a formidable challenge of successful cancer treatment. Although our research has made efforts to explain the intertumoral heterogeneity in luminal subtype, the intratumoral heterogeneity remains elusive yet since the data analyzed here was obtained based on mixed cell population rather than single cells.
In summary, our study explored the alteration of m6A regulators at multiple levels in breast cancer and revealed their potential prognostic values. Furthermore, by taking advantage of DNA methylation of basal-featured m6A regulators, luminal A and luminal B subtypes were both segregated into two clusters, which are associated with different abundance of immune infiltrating lymphocytes and prognosis of patients. Together, our study expands the realm of mechanistic study in breast cancer and discovers novel strategy in subclassifying luminal subtype for the sake of personalized treatment.
Data Availability Statement
Publicly available datasets were analyzed in this study. This data can be found here: https://xenabrowser.net/.
Author Contributions
YN and W-MT conceived and designed the project. LY performed the bioinformatics analyses with the help of SS and CM. LY, YN, SW, FJ, and W-MT wrote the manuscript. All authors contributed to the article and approved the submitted version.
Funding
This study was supported by the Medical Epigenetics Research Center, Chinese Academy of Medical Sciences (2019PT310017, to YN).
Conflict of Interest
The authors declare that the research was conducted in the absence of any commercial or financial relationships that could be construed as a potential conflict of interest.
Supplementary Material
The Supplementary Material for this article can be found online at: https://www.frontiersin.org/articles/10.3389/fonc.2020.611191/full#supplementary-material
Abbreviations
m6A, N6-methyladenosine; TCGA, The Cancer Genome Atlas; CNV, copy number variation; HER2, human epidermal growth factor 2; PR, progesterone receptor; MAF, Mutation Annotation Format; t-SNE, t-distributed Stochastic Neighbor Embedding; SD, standard deviation; CDF, cumulative distribution function; KEGG, Kyoto Encyclopedia of Genes and Genomes; TILs, tumor infiltrating lymphocytes; ssGSEA, single sample gene set enrichment analysis; TSS, Transcription Start Site; NS, not significant; OS, overall survival; DFS, disease-free survival; PFS, progression-free survival; UTR, untranslated region; HR, hazard ratio; GEO, Gene Expression Omnibus; ICGC, International Cancer Genome Consortium; CFEA, Cell-Free Epigenome Atlas.
References
1. Sørlie T, Perou CM, Tibshirani R, Aas T, Geisler S, Johnsen H, et al. Gene expression patterns of breast carcinomas distinguish tumor subclasses with clinical implications. Proc Natl Acad Sci (2001) 98(19):10869–74. doi: 10.1073/pnas.191367098
2. Perou CM, Sørlie T, Eisen MB, van de Rijn M, Jeffrey SS, Rees CA, et al. Molecular portraits of human breast tumours. Nature (2000) 406(6797):747–52. doi: 10.1038/35021093
3. Dean-Colomb W, Esteva FJ. Her2-positive breast cancer: Herceptin and beyond. Eur J Cancer (2008) 44(18):2806–12. doi: 10.1016/j.ejca.2008.09.013
4. Sorlie T, Tibshirani R, Parker J, Hastie T, Marron JS, Nobel A, et al. Repeated observation of breast tumor subtypes in independent gene expression data sets. Proc Natl Acad Sci USA (2003) 100(14):8418–23. doi: 10.1073/pnas.0932692100
5. Fan C, Oh DS, Wessels L, Weigelt B, Nuyten DSA, Nobel AB, et al. Concordance among gene-expression-based predictors for breast cancer. N Engl J Med (2006) 355(6):560–9. doi: 10.1056/NEJMoa052933
6. Waks AG, Winer EP. Breast Cancer Treatment: A Review. JAMA (2019) 321(3):288–300. doi: 10.1001/jama.2018.19323
7. Ciriello G, Sinha R, Hoadley KA, Jacobsen AS, Reva B, Perou CM, et al. The molecular diversity of Luminal A breast tumors. Breast Cancer Res Treat (2013) 141(3):409–20. doi: 10.1007/s10549-013-2699-3
8. Fleischer T, Klajic J, Aure MR, Louhimo R, Pladsen AV, Ottestad L, et al. DNA methylation signature (SAM40) identifies subgroups of the Luminal A breast cancer samples with distinct survival. Oncotarget (2017) 8(1):1074–82. doi: 10.18632/oncotarget.13718
9. Aure MR, Vitelli V, Jernström S, Kumar S, Krohn M, Due EU, et al. Integrative clustering reveals a novel split in the luminal A subtype of breast cancer with impact on outcome. Breast Cancer Res (2017) 19(1):44. doi: 10.1186/s13058-017-0812-y
10. Feeley LP, Mulligan AM, Pinnaduwage D, Bull SB, Andrulis IL. Distinguishing luminal breast cancer subtypes by Ki67, progesterone receptor or TP53 status provides prognostic information. Mod Pathol (2014) 27(4):554–61. doi: 10.1038/modpathol.2013.153
11. Zhu B, Tse LA, Wang D, Koka H, Zhang T, Abubakar M, et al. Immune gene expression profiling reveals heterogeneity in luminal breast tumors. Breast Cancer Res (2019) 21(1):147. doi: 10.1186/s13058-019-1218-9
12. Lehmann BD, Bauer JA, Chen X, Sanders ME, Chakravarthy AB, Shyr Y, et al. Identification of human triple-negative breast cancer subtypes and preclinical models for selection of targeted therapies. J Clin Invest (2011) 121(7):2750–67. doi: 10.1172/JCI45014
13. Burstein MD, Tsimelzon A, Poage GM, Covington KR, Contreras A, Fuqua SAW, et al. Comprehensive genomic analysis identifies novel subtypes and targets of triple-negative breast cancer. Clin Cancer Res (2015) 21(7):1688–98. doi: 10.1158/1078-0432.CCR-14-0432
14. Netanely D, Avraham A, Ben-Baruch A, Evron E, Shamir R. Expression and methylation patterns partition luminal-A breast tumors into distinct prognostic subgroups. Breast Cancer Res (2016) 18(1):74. doi: 10.1186/s13058-016-0724-2
15. Wang P, Doxtader Katelyn A, Nam Y. Structural Basis for Cooperative Function of Mettl3 and Mettl14 Methyltransferases. Mol Cell (2016) 63(2):306–17. doi: 10.1016/j.molcel.2016.05.041
16. Wang X, Feng J, Xue Y, Guan Z, Zhang D, Liu Z, et al. Structural basis of N6-adenosine methylation by the METTL3–METTL14 complex. Nature (2016) 534(7608):575–8. doi: 10.1038/nature18298
17. Śledź P, Jinek M. Structural insights into the molecular mechanism of the m6A writer complex. Elife (2016) 5:e18434. doi: 10.7554/eLife.18434
18. Ping X-L, Sun B-F, Wang L, Xiao W, Yang X, Wang W-J, et al. Mammalian WTAP is a regulatory subunit of the RNA N6-methyladenosine methyltransferase. Cell Res (2014) 24(2):177–89. doi: 10.1038/cr.2014.3
19. Jia G, Fu Y, Zhao X, Dai Q, Zheng G, Yang Y, et al. N6-Methyladenosine in nuclear RNA is a major substrate of the obesity-associated FTO. Nat Chem Biol (2011) 7(12):885–7. doi: 10.1038/nchembio.687
20. Zheng G, Dahl John A, Niu Y, Fedorcsak P, Huang C-M, Li Charles J, et al. ALKBH5 Is a Mammalian RNA Demethylase that Impacts RNA Metabolism and Mouse Fertility. Mol Cell (2013) 49(1):18–29. doi: 10.1016/j.molcel.2012.10.015
21. Huang H, Weng H, Chen J. m6A Modification in Coding and Non-coding RNAs: Roles and Therapeutic Implications in Cancer. Cancer Cell (2020) 37(3):270–88. doi: 10.1016/j.ccell.2020.02.004
22. Liu L, Wang Y, Wu J, Liu J, Qin Z, Fan H. N6-Methyladenosine: A Potential Breakthrough for Human Cancer. Mol Ther Nucleic Acids (2020) 19:804–13. doi: 10.1016/j.omtn.2019.12.013
23. Wu L, Wu D, Ning J, Liu W, Zhang D. Changes of N6-methyladenosine modulators promote breast cancer progression. BMC Cancer (2019) 19(1):326–. doi: 10.1186/s12885-019-5538-z
24. Liu L, Liu X, Dong Z, Li J, Yu Y, Chen X, et al. N6-methyladenosine-related Genomic Targets are Altered in Breast Cancer Tissue and Associated with Poor Survival. J Cancer (2019) 10(22):5447–59. doi: 10.7150/jca.35053
25. Cai X, Wang X, Cao C, Gao Y, Zhang S, Yang Z, et al. HBXIP-elevated methyltransferase METTL3 promotes the progression of breast cancer via inhibiting tumor suppressor let-7g. Cancer Lett (2018) 415:11–9. doi: 10.1016/j.canlet.2017.11.018
26. Niu Y, Lin Z, Wan A, Chen H, Liang H, Sun L, et al. RNA N6-methyladenosine demethylase FTO promotes breast tumor progression through inhibiting BNIP3. Mol Cancer (2019) 18(1):46–. doi: 10.1186/s12943-019-1004-4
27. Sun T, Wu Z, Wang X, Wang Y, Hu X, Qin W, et al. LNC942 promoting METTL14-mediated m6A methylation in breast cancer cell proliferation and progression. Oncogene (2020) 39(31):5358–72. doi: 10.1038/s41388-020-1338-9
28. Yi D, Wang R, Shi X, Xu L, Yilihamu YE, Sang J. METTL14 promotes the migration and invasion of breast cancer cells by modulating N6−methyladenosine and hsa−miR−146a−5p expression. Oncol Rep (2020) 43(5):1375–86. doi: 10.3892/or.2020.7515
29. Zhang C, Samanta D, Lu H, Bullen JW, Zhang H, Chen I, et al. Hypoxia induces the breast cancer stem cell phenotype by HIF-dependent and ALKBH5-mediated m6A-demethylation of NANOG mRNA. Proc Natl Acad Sci USA (2016) 113(14):E2047–E56. doi: 10.1073/pnas.1602883113
30. Zhang C, Zhi WI, Lu H, Samanta D, Chen I, Gabrielson E, et al. Hypoxia-inducible factors regulate pluripotency factor expression by ZNF217- and ALKBH5-mediated modulation of RNA methylation in breast cancer cells. Oncotarget (2016) 7(40):64527–42. doi: 10.18632/oncotarget.11743
31. Zhou J, Wang J, Hong B, Ma K, Xie H, Li L, et al. Gene signatures and prognostic values of m6A regulators in clear cell renal cell carcinoma - a retrospective study using TCGA database. Aging (Albany NY) (2019) 11(6):1633–47. doi: 10.18632/aging.101856
32. Liu G-M, Zeng H-D, Zhang C-Y, Xu J-W. Identification of METTL3 as an Adverse Prognostic Biomarker in Hepatocellular Carcinoma. Dig Dis Sci (2020). doi: 10.1007/s10620-020-06260-z
33. Huang G-Z, Wu Q-Q, Zheng Z-N, Shao T-R, Chen Y-C, Zeng W-S, et al. m6A-related bioinformatics analysis reveals that HNRNPC facilitates progression of OSCC via EMT. Aging (Albany NY) (2020) 12(12):11667–84. doi: 10.18632/aging.103333
34. Geng Y, Guan R, Hong W, Huang B, Liu P, Guo X, et al. Identification of m6A-related genes and m6A RNA methylation regulators in pancreatic cancer and their association with survival. Ann Trans Med (2020) 8(6):387. doi: 10.21037/atm.2020.03.98
35. Chai R-C, Wu F, Wang Q-X, Zhang S, Zhang K-N, Liu Y-Q, et al. m6A RNA methylation regulators contribute to malignant progression and have clinical prognostic impact in gliomas. Aging (Albany NY) (2019) 11(4):1204–25. doi: 10.18632/aging.101829
36. Daniel CK, Robert SF, Michael DM, Heather S, Joelle KV, Joshua FM, et al. Comprehensive molecular portraits of human breast tumours. Nature (2012) 490(7418):61–70. doi: 10.1038/nature11412
37. Goldman MJ, Craft B, Hastie M, Repečka K, McDade F, Kamath A, et al. Visualizing and interpreting cancer genomics data via the Xena platform. Nat Biotechnol (2020) 38(6):675–8. doi: 10.1038/s41587-020-0546-8
38. Mermel CH, Schumacher SE, Hill B, Meyerson ML, Beroukhim R, Getz G. GISTIC2.0 facilitates sensitive and confident localization of the targets of focal somatic copy-number alteration in human cancers. Genome Biol (2011) 12(4):R41. doi: 10.1186/gb-2011-12-4-r41
39. Chou C-H, Shrestha S, Yang C-D, Chang N-W, Lin Y-L, Liao K-W, et al. miRTarBase update 2018: a resource for experimentally validated microRNA-target interactions. Nucleic Acids Res (2017) 46(D1):D296–302. doi: 10.1093/nar/gkx1067
40. Tang W, Zhou M, Dorsey TH, Prieto DA, Wang XW, Ruppin E, et al. Integrated proteotranscriptomics of breast cancer reveals globally increased protein-mRNA concordance associated with subtypes and survival. Genome Med (2018) 10(1):94. doi: 10.1186/s13073-018-0602-x
41. Mertins P, Mani DR, Ruggles KV, Gillette MA, Clauser KR, Wang P, et al. Proteogenomics connects somatic mutations to signalling in breast cancer. Nature (2016) 534(7605):55–62. doi: 10.1038/nature18003
42. Haunsberger S. miRBaseVersions.db: Collection of mature miRNA names of 22 different miRBase release versions. R Package version 110 (2018).
44. Diaz-Uriarte R. GeneSrF and varSelRF: a web-based tool and R package for gene selection and classification using random forest. BMC Bioinform (2007) 8:328–34. doi: 10.1186/1471-2105-8-328
45. Krijthe JH. Rtsne: T-Distributed Stochastic Neighbor Embedding using a Barnes-Hut Implementation. (2015).
46. Wilkerson MD, Hayes DN. ConsensusClusterPlus: a class discovery tool with confidence assessments and item tracking. Bioinformatics (2010) 26(12):1572–3. doi: 10.1093/bioinformatics/btq170
47. Love MI, Huber W, Anders S. Moderated estimation of fold change and dispersion for RNA-seq data with DESeq2. Genome Biol (2014) 15(12):550–. doi: 10.1186/s13059-014-0550-8
48. Yu G, Wang L-G, Han Y, He Q-Y. clusterProfiler: an R package for comparing biological themes among gene clusters. OMICS (2012) 16(5):284–7. doi: 10.1089/omi.2011.0118
49. Charoentong P, Finotello F, Angelova M, Mayer C, Efremova M, Rieder D, et al. Pan-cancer Immunogenomic Analyses Reveal Genotype-Immunophenotype Relationships and Predictors of Response to Checkpoint Blockade. Cell Rep (2017) 18(1):248–62. doi: 10.1016/j.celrep.2016.12.019
50. Barbie DA, Tamayo P, Boehm JS, Kim SY, Moody SE, Dunn IF, et al. Systematic RNA interference reveals that oncogenic KRAS-driven cancers require TBK1. Nature (2009) 462(7269):108–12. doi: 10.1038/nature08460
51. Therneau TM, Grambsch PM. Modeling Survival Data: Extending the Cox Model. New York: Springer (2000).
52. Brenet F, Moh M, Funk P, Feierstein E, Viale AJ, Socci ND, et al. DNA Methylation of the First Exon Is Tightly Linked to Transcriptional Silencing. PloS One (2011) 6(1):e14524. doi: 10.1371/journal.pone.0014524
53. Ball MP, Li JB, Gao Y, Lee J-H, LeProust EM, Park I-H, et al. Targeted and genome-scale strategies reveal gene-body methylation signatures in human cells. Nat Biotechnol (2009) 27(4):361–8. doi: 10.1038/nbt.1533
54. Henrichsen CN, Chaignat E, Reymond A. Copy number variants, diseases and gene expression. Hum Mol Genet (2009) 18(R1):R1–8. doi: 10.1093/hmg/ddp011
55. Handsaker RE, Van Doren V, Berman JR, Genovese G, Kashin S, Boettger LM, et al. Large multiallelic copy number variations in humans. Nat Genet (2015) 47(3):296–303. doi: 10.1038/ng.3200
56. Jones PA. Functions of DNA methylation: islands, start sites, gene bodies and beyond. Nat Rev Genet (2012) 13(7):484–92. doi: 10.1038/nrg3230
57. Barghash A, Helms V, Kessler SM. Overexpression of IGF2 mRNA-Binding Protein 2 (IMP2/p62) as a Feature of Basal-like Breast Cancer Correlates with Short Survival. Scand J Immunol (2015) 82(2):142–3. doi: 10.1111/sji.12307
58. Li X, Li Y, Lu H. miR-1193 Suppresses Proliferation and Invasion of Human Breast Cancer Cells Through Directly Targeting IGF2BP2. Oncol Res (2017) 25(4):579–85. doi: 10.3727/97818823455816X14760504645779
59. Mancarella C, Scotlandi K. IGF2BP3 From Physiology to Cancer: Novel Discoveries, Unsolved Issues, and Future Perspectives. Front Cell Dev Biol (2019) 7:363:363. doi: 10.3389/fcell.2019.00363
60. Tanabe A, Tanikawa K, Tsunetomi M, Takai K, Ikeda H, Konno J, et al. RNA helicase YTHDC2 promotes cancer metastasis via the enhancement of the efficiency by which HIF-1α mRNA is translated. Cancer Lett (2016) 376(1):34–42. doi: 10.1016/j.canlet.2016.02.022
61. Ma Z, Morris SW, Valentine V, Li M, Herbrick JA, Cui X, et al. Fusion of two novel genes, RBM15 and MKL1, in the t(1;22)(p13;q13) of acute megakaryoblastic leukemia. Nat Genet (2001) 28(3):220–1. doi: 10.1038/90054
62. Lee J-H, Skalnik DG. Rbm15-Mkl1 Interacts with the Setd1b Histone H3-Lys4 Methyltransferase via a SPOC Domain That Is Required for Cytokine-Independent Proliferation. PloS One (2012) 7(8):e42965. doi: 10.1371/journal.pone.0042965
63. Takeda A, Shimada A, Hamamoto K, Yoshino S, Nagai T, Fujii Y, et al. Detection of RBM15-MKL1 fusion was useful for diagnosis and monitoring of minimal residual disease in infant acute megakaryoblastic leukemia. Acta Med Okayama (2014) 68(2):119–23. doi: 10.18926/AMO/52408
64. Yersal O, Barutca S. Biological subtypes of breast cancer: Prognostic and therapeutic implications. World J Clin Oncol (2014) 5(3):412–24. doi: 10.5306/wjco.v5.i3.412
65. Ignatiadis M, Sotiriou C. Luminal breast cancer: from biology to treatment. Nat Rev Clin Oncol (2013) 10(9):494–506. doi: 10.1038/nrclinonc.2013.124
66. Haque R, Ahmed SA, Inzhakova G, Shi J, Avila C, Polikoff J, et al. Impact of breast cancer subtypes and treatment on survival: an analysis spanning two decades. Cancer Epidemiol Biomarkers Prev (2012) 21(10):1848–55. doi: 10.1158/1055-9965.EPI-12-0474
67. Szyf M. DNA methylation signatures for breast cancer classification and prognosis. Genome Med (2012) 4(3):26–. doi: 10.1186/gm325
68. Stanton SE, Disis ML. Clinical significance of tumor-infiltrating lymphocytes in breast cancer. J Immunother Cancer (2016) 4:59. doi: 10.1186/s40425-016-0165-6
69. Denkert C, von Minckwitz G, Darb-Esfahani S, Lederer B, Heppner BI, Weber KE, et al. Tumour-infiltrating lymphocytes and prognosis in different subtypes of breast cancer: a pooled analysis of 3771 patients treated with neoadjuvant therapy. Lancet Oncol (2018) 19(1):40–50. doi: 10.1016/S1470-2045(17)30904-X
70. Li H-B, Tong J, Zhu S, Batista PJ, Duffy EE, Zhao J, et al. m6A mRNA methylation controls T cell homeostasis by targeting the IL-7/STAT5/SOCS pathways. Nature (2017) 548(7667):338–42. doi: 10.1038/nature23450
71. Tong J, Cao G, Zhang T, Sefik E, Amezcua Vesely MC, Broughton JP, et al. m6A mRNA methylation sustains Treg suppressive functions. Cell Res (2018) 28(2):253–6. doi: 10.1038/cr.2018.7
72. Feng Z, Li Q, Meng R, Yi B, Xu Q. METTL3 regulates alternative splicing of MyD88 upon the lipopolysaccharide-induced inflammatory response in human dental pulp cells. J Cell Mol Med (2018) 22(5):2558–68. doi: 10.1111/jcmm.13491
73. Zheng Q, Hou J, Zhou Y, Li Z, Cao X. The RNA helicase DDX46 inhibits innate immunity by entrapping mA-demethylated antiviral transcripts in the nucleus. Nat Immunol (2017) 18(10):1094–103. doi: 10.1038/ni.3830
74. Shah A, Rashid F, Awan HM, Hu S, Wang X, Chen L, et al. The DEAD-Box RNA Helicase DDX3 Interacts with m6A RNA Demethylase ALKBH5. Stem Cells Int (2017) 2017:8596135. doi: 10.1155/2017/8596135
75. Winkler R, Gillis E, Lasman L, Safra M, Geula S, Soyris C, et al. m6A modification controls the innate immune response to infection by targeting type I interferons. Nat Immunol (2019) 20(2):173–82. doi: 10.1038/s41590-018-0275-z
76. Lichinchi G, Gao S, Saletore Y, Gonzalez GM, Bansal V, Wang Y, et al. Dynamics of the human and viral m6A RNA methylomes during HIV-1 infection of T cells. Nat Microbiol (2016) 1:16011. doi: 10.1038/nmicrobiol.2016.11
77. Hesser CR, Karijolich J, Dominissini D, He C, Glaunsinger BA. N6-methyladenosine modification and the YTHDF2 reader protein play cell type specific roles in lytic viral gene expression during Kaposi’s sarcoma-associated herpesvirus infection. PloS Pathog (2018) 14(4):e1006995. doi: 10.1371/journal.ppat.1006995
78. Han D, Liu J, Chen C, Dong L, Liu Y, Chang R, et al. Anti-tumour immunity controlled through mRNA m6A methylation and YTHDF1 in dendritic cells. Nature (2019) 566(7743):270–4. doi: 10.1038/s41586-019-0916-x
79. Zhang B, Wang J, Wang X, Zhu J, Liu Q, Shi Z, et al. Proteogenomic characterization of human colon and rectal cancer. Nature (2014) 513(7518):382–7. doi: 10.1038/nature13438
80. Archer TC, Ehrenberger T, Mundt F, Gold MP, Krug K, Mah CK, et al. Proteomics, Post-translational Modifications, and Integrative Analyses Reveal Molecular Heterogeneity within Medulloblastoma Subgroups. Cancer Cell (2018) 34(3):396–410.e8. doi: 10.1016/j.ccell.2018.08.004
Keywords: RNA methylation, m6A regulators, genomic regulation, breast cancer subtypes, subclassification, survival
Citation: Yang L, Wu S, Ma C, Song S, Jin F, Niu Y and Tong W-M (2021) RNA m6A Methylation Regulators Subclassify Luminal Subtype in Breast Cancer. Front. Oncol. 10:611191. doi: 10.3389/fonc.2020.611191
Received: 28 September 2020; Accepted: 07 December 2020;
Published: 29 January 2021.
Edited by:
Shicheng Guo, University of Wisconsin-Madison, United StatesReviewed by:
Jun Wan, Wuhan Textile University, ChinaJianfeng Huang, Sanford Burnham Prebys Medical Discovery Institute, United States
Copyright © 2021 Yang, Wu, Ma, Song, Jin, Niu and Tong. This is an open-access article distributed under the terms of the Creative Commons Attribution License (CC BY). The use, distribution or reproduction in other forums is permitted, provided the original author(s) and the copyright owner(s) are credited and that the original publication in this journal is cited, in accordance with accepted academic practice. No use, distribution or reproduction is permitted which does not comply with these terms.
*Correspondence: Yamei Niu, niuym@ibms.pumc.edu.cn; Wei-Min Tong, wmtong@ibms.pumc.edu.cn