 Jia-An Zhang†
 Xu-Yue Zhou
- Institute of Dermatology, Jiangsu Key Laboratory of Molecular Biology for Skin Diseases and STIs, Chinese Academy of Medical Science and Peking Union Medical College, Nanjing, China
Melanoma remains a potentially deadly malignant tumor. The incidence of melanoma continues to rise. Immunotherapy has become a new treatment method and is widely used in a variety of tumors. Original melanoma data were downloaded from TCGA. ssGSEA was performed to classify them. GSVA software and the "hclust" package were used to analyze the data. The ESTIMATE algorithm screened DEGs. The edgeR package and Venn diagram identified valid immune-related genes. Univariate, LASSO and multivariate analyses were used to explore the hub genes. The "rms" package established the nomogram and calibrated the curve. Immune infiltration data were obtained from the TIMER database. Compared with that of samples in the high immune cell infiltration cluster, we found that the tumor purity of samples in the low immune cell infiltration cluster was higher. The immune score, ESTIMATE score and stromal score in the low immune cell infiltration cluster were lower. In the high immune cell infiltration cluster, the immune components were more abundant, while the tumor purity was lower. The expression levels of TIGIT, PDCD1, LAG3, HAVCR2, CTLA4 and the HLA family were also higher in the high immune cell infiltration cluster. Survival analysis showed that patients in the high immune cell infiltration cluster had shorter OS than patients in the low immune cell infiltration cluster. IGHV1-18, CXCL11, LTF, and HLA-DQB1 were identified as immune cell infiltration-related DEGs. The prognosis of melanoma was significantly negatively correlated with the infiltration of CD4+ T cells, CD8+ T cells, dendritic cells, neutrophils and macrophages. In this study, we identified immune-related melanoma core genes and relevant immune cell subtypes, which may be used in targeted therapy and immunotherapy of melanoma.
Introduction
Melanoma still remains a potentially deadly malignant tumor at the beginning of the 21st century. The incidence of melanoma unfortunately continues to rise, while the incidence of many tumor types is declining (1). Melanoma is mainly seen in young and middle-aged people, and the median age at diagnosis is 57 years old. It has been observed that the incidence increases linearly from 25 to 50 years old and then slows down, especially in women (2). Although most patients have localized disease at the time of diagnosis and are treated by surgically removing the primary tumor, many patients develop metastasis (3). It is generally understood that the normal function of a healthy immune system can protect and prevent the development of malignant tumors, and people with a genetically compromised immune system may have increased susceptibility to tumors (4). Immunotherapy has become a new treatment method and is widely used in a variety of tumors, such as gastric and esophageal cancer, pancreatic cancer and ovarian cancer (5–7). Experiments have shown that immune stimulation can participate in the treatment of melanoma (8). Targeted therapy for specific genes is also a research hotspot (9). Combining targeted therapy and immunotherapy is an important strategy to treat melanoma (10–12). Therefore, screening immune-related biological targets has become particularly important.
Materials and Method
Data Collection
RNA sequence and clinical data of melanoma were collected from TCGA (13). We downloaded the expression profiles of mRNAs (level 3) in cases including tumor tissues and normal tissues from TCGA database (http://cancergenome.nih.gov/) on april 15, 2019. The sequenced data were obtained from Illumina HiSeqRNASeq. The corresponding clinical information of patients was also downloaded from TCGA database. ssGSEA groups TCGA melanoma transcriptome data. From the results of Bindea et al (14), we used a set of marker genes for immune cell types. We utilized 29 immune data sets (including immune-related pathways, immune cell types and immune-related functions) and the ssGSEA method with the R software gene set variation analysis (GSVA) package to operate the related expression pathways, penetration levels of different immune cells and Activity of immune-related functions. The melanoma samples from TCGA were divided into low- and high- immune cell infiltration cluster by "hclust" package (15). GSE15605 from the GEO database including 58 melanoma samples was recruited for external validation.
Verification of Effective Immune Grouping
The ESTIMATE algorithm was for identification of the differentially expressed genes (DEGs) in the melanoma expression profile data. The ESTIMATE algorithm was used to analyze the Immune Score, Stromal Score, Tumor Purity and ESTIMATE Score, and cluster heat maps and statistics were drawn for effective grouping.
Selection of Immune-Related Genes in Melanoma
TCGA data was divided into high- and low- immune cell infiltration cluster. According to the standards of p <0.05 and| log2FC |> 2, we used the edgeR package to analyze DEGs. We used the same criteria to perform differential analysis on cancer groups and para-cancer groups to screen immune-related cancerous genes. The Venn diagram identified real immune-related genes from the above two analyses.
Screen Prognostic Genes and Tap Their Characteristics
We utilized Univariate, lasso and multivariate analysis to dig out the correlation between the OS of patients and the expression level of immune-related genes. We calculated the regression coefficient and hazard ratio (HRs) of each gene, and finally the satisfactory mRNAs was identifed.
Construct a Prognostic Model of Immune-Related Genes
The prognostic risk scoring model of melanoma patients in training cohort is a collection of each optimal prognosis mRNA expression level and relative regression coefficient weights calculated from the multivariate model as the following method:
Relying on the median risk score, all patients in the cohort were classified into high- and low-risk groups. Kaplan–Meier survival curves of the two groups were completed. We proposed ROC curves (16) to evaluate the specificity and sensitivity of the model. We also conducted a multivariate analysis of several clinical characteristics of melanoma patients to check the independence of the prognostic models without their clinical characteristics.
Verify the Effect of Prognostic Models
With the cut-off values calculated from the training cohort, we compared the risk scores from the testing and entire cohort and then patient can be classified into high- or low-risk groups. Kaplan-Meier curve, Time-dependent ROC and Cox multivariate analysis were all conducted. Based on the clinicopathological characteristics, we conducted a stratification analysis of the entire cohort samples.
Confirmation of Hub Immune Related Genes
The "rms" package established the nomogram and calibrate curve, checking the accuracy and the consistency index between the predicted probability and the actual observation frequency. We next displayed the results in the calibration curve, in order to represent the performance of nomogram.
Analysis of Correlation With Immune Cell Infiltration
Immune infiltration data can be obtained from the tumor obtained from immune estimation resource (TIMER) database (17). We rely on the Pearson correlation coefficient to calculate the degree of correlation between immune infiltration and risk score. Meanwhile, we used the tumor-immune system interactions and drugbank (TISIDB) database to investigate the expression of these core immune-related genes in different molecular subtypes of cutaneous melanoma (18).
RNA Extraction, cDNA Synthesis, and qRT-PCR
Total RNA was extracted respectively from melanoma cell line A375, A815, SK-MEL-28 and normal human epidermal melanocytes (NHEM) using TRIzol® reagent (Invitrogen, Carlsbad, CA) according to the manufacturer’s protocol. cDNA was synthesized using reverse transcription kit (TaKaRa Biotechnology, Shiga, Japan). RNA expression levels were detected using the SYBR Green Mix (TaKaRa Biotechnology, Shiga, Japan). Target gene expression values were normalized to human GAPDH. The primer sequences were as follows: GAPDH (forward: 5′‐ACTTTGGTATCGTGGAAGGACTA‐3′, reverse: 5′‐GTCTCTCTCTTCCTCTTGTGCTC‐3′); IGHV1-18((forward: 5′‐AACCAGGCCAGTCATGTGAG‐3′, reverse: 5′‐TGTAAGCGCTGATCCATCCC‐3′); CXCL11(forward: 5′‐GACGCTGTCTTTGCATAGGC‐3′, reverse: 5′‐GGATTTAGGCATCGTTGTCCTTT‐3′); LTF(forward: 5′‐AGTCTACGGGACCGAAAGACA‐3′, reverse: 5′‐CAGACCTTGCAGTTCGTTCAG‐3′); and HLA-DQB1(forward: 5′‐GCGGGATCTTGCAGAGGAG‐3′, reverse: 5′‐ACTTTGATCTGGCCTGGATAGAA‐3′).
Results
Differentiated Grouping of Melanoma Tissue
We obtained melanoma samples and normal skin tissue samples from the TCGA database. We used ssGSEA to analyze the transcriptome data of melanoma tissue samples to assess the immune cell infiltration state. After controlling for the enrichment of multiple immune cell types, melanoma samples were divided into high and low immune cell infiltration clusters according to the degree of immune infiltration (Figure 1A). To test the authenticity of the above grouping scheme, we used the ESTIMATE algorithm to analyze the expression profile of melanoma and calculated the immune score, ESTIMATE score, stromal score, and tumor purity. The results suggested that the tumor purity of the high immune cell infiltration group was lower than that of the low immune cell infiltration cluster. In contrast, the values of the ESTIMATE score, immune score and stromal score were higher in the high immune cell infiltration cluster than in the low immune cell infiltration cluster (Figure 1A). The box chart shows that the high immune cell infiltration cluster had significantly higher immune score, ESTIMATE score and stromal score and lower tumor purity than the low immune cell infiltration cluster (Figure 1B). There were more immune components in the high immune cell infiltration cluster than in the low immune cell infiltration cluster, but the tumor purity of the high immune cell infiltration cluster was lower, and the expression levels of TIGIT, PDCD1, LAG3, HAVCR2, CTLA4 and the HLA family were also higher in the high immune cell infiltration cluster (Figures 1C, D). The CIBERSORT method was used to analyze the above two clusters and showed that there were more types of immune cells in the high immune cell infiltration cluster (Figure 1E). Survival analysis demonstrated that patients from the low immune cell infiltration cluster had worse prognosis than patients in the high immune cell infiltration cluster (Figure 1F).
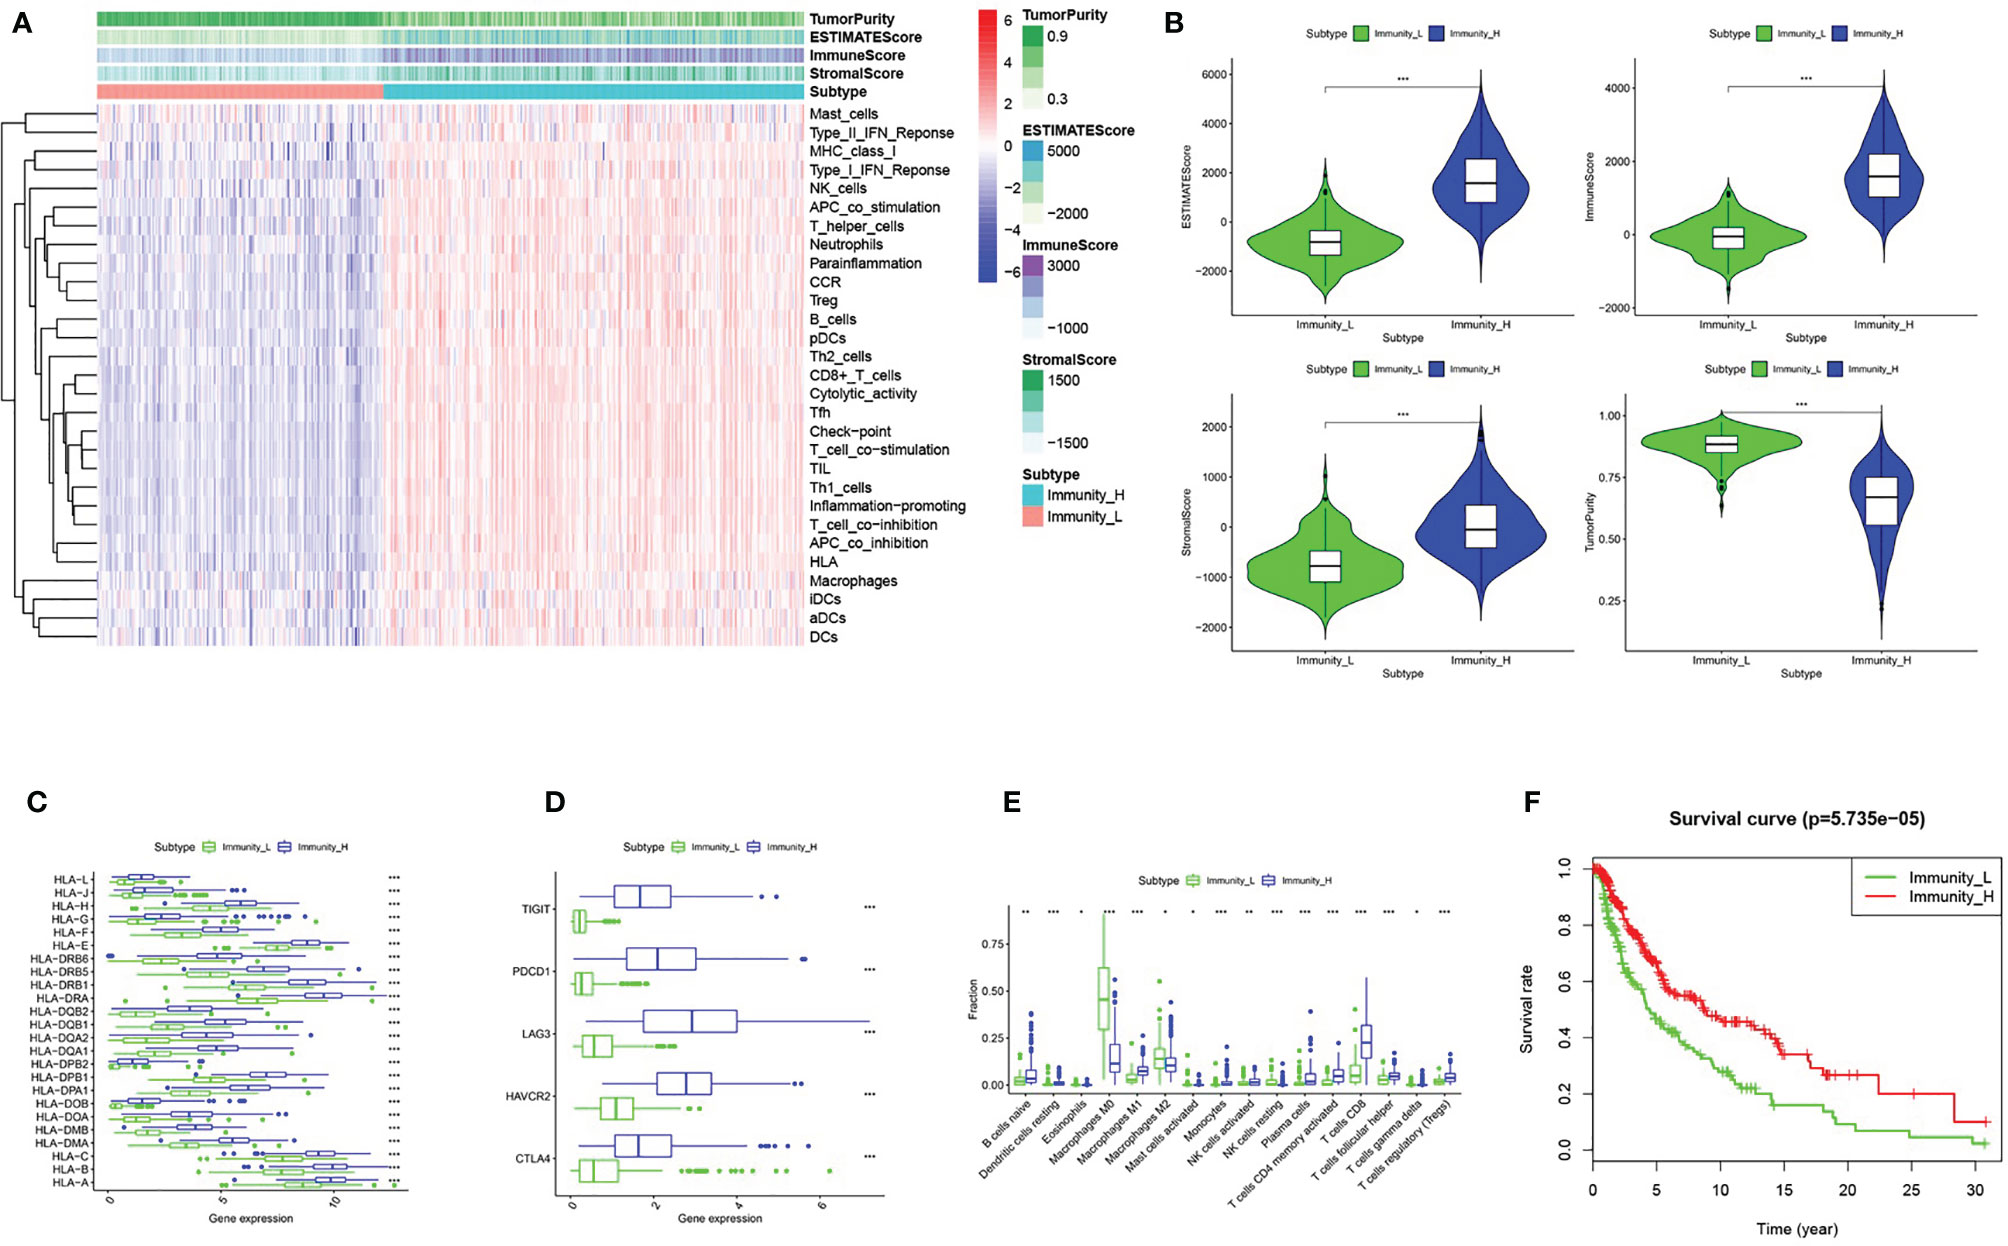
Figure 1 Grouping and verification of melanoma. (A) The immune cells were highly expressed in the high immune cell infiltration group (Immunity_H), and the low expression in the low immune cell infiltration group (Immunity_L). The Tumor Purity, ESTIMATE Score, Immune Score and Stromal Score were illustrated along with the grouping information. (B) There is a statistical difference of the Tumor Purity, ESTIMATE Score, Immune Score and Stromal Score between the high immune cell infiltration cluster and the low immune cell infiltration cluster (C, D) The expression of HLA family genes, TIGIT, PDCD1, LAG3, HAVCR2, and CTLA4 in the high immune cell infiltration cluster (red) were significantly higher than that of the low immune cell infiltration cluster (green) (E) The statistical graph shows the difference in the proportion of each immune cell between the high immune cell infiltration cluster (red) and the low immune cell infiltration cluster (green). (F) Survival difference between high immune cell infiltration cluster and low immune cell infiltration cluster. *P < 0.05, **P < 0.01, ***P < 0.001.
Analysis of DEGs With High and Low Immune Cell Infiltration
Based on the cutoff, which was |log2FC| > 2 and FDR < 0.05, we identified 1120 DEGs between the low and high immune cell infiltration clusters, which included 1116 upregulated DEGs and 4 downregulated DEGs (Figure 2A). We conducted a Venn analysis based on the immune genes from the import database and the DEGs from the high and low immune cell infiltration clusters. Then, we found 388 overlapping genes (Figure 2B), which were considered to be real DEGs.
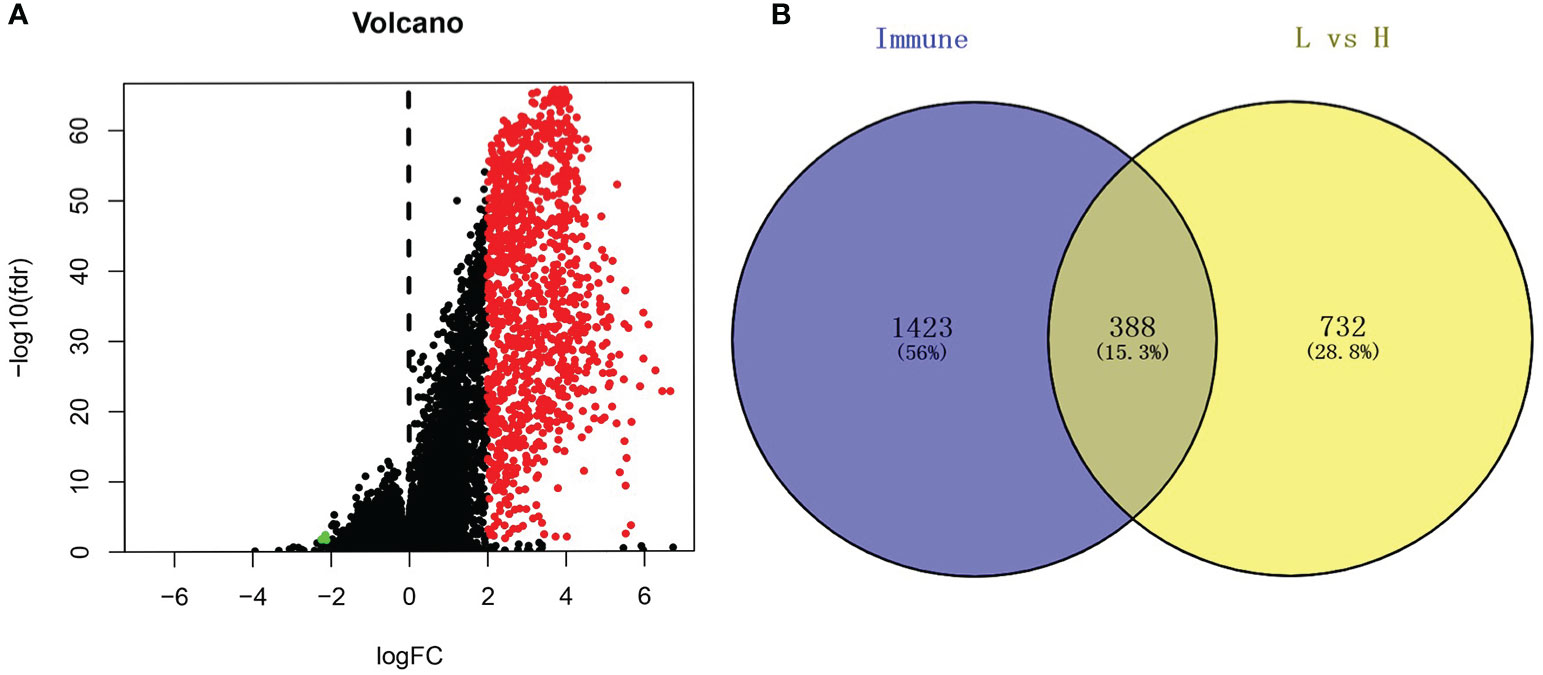
Figure 2 Analysis of differentially expressed genes. (A) The volcano graph shows the distribution of differential genes between high immune cell infiltration cluster and low immune cell infiltration cluster, red dots represent up-regulated genes, green dots represent down-regulated genes. (B) Using the Venn diagram to extract intersection points, we obtained a total of 388 differentially expressed genes.
Prognosis Models of Immune Cell Infiltration-Related DEGs
After integrating clinical information into gene expression profiles, we obtained 453 samples. We randomly selected 228 samples as the training cohort and the remaining 225 samples comprised the test cohort. All the samples together are referred to as the entire cohort. Then, we built a prognostic model with each cohort. In the training cohort, based on p < 0.05, univariate Cox regression analysis identified 171 genes (Table 1). The LASSO Cox regression algorithm was performed next (Figures 3A, B). Finally, multivariate Cox proportional hazards regression analysis was conducted, and the risk scores were calculated (Figure 3C). IGHV1-18, CXCL11, LTF and HLA-DQB1 were identified as immune cell infiltration-related DEGs. The risk score was calculated using the following formula: -0.000600085×IGHV1-18-0.032242183×CXCL11+0.003776394×LTF-0.007893899×HLA-DQB1. The survival status and risk score calculated by the prognostic model are illustrated in Figure 4A. Samples were classified into low- and high-risk clusters according to the median risk score. Survival analysis indicated that low-risk patients had significantly longer overall survival times than high-risk patients (Figure 4B). ROC curve analysis showed that the specificity and sensitivity were highest when the risk score was 0.72, 0.72, and 0.696 according to the 1-, 3-, and 5-year survival of the area under the receiver operating characteristic curve (AUC) value, respectively (Figure 4C). For the testing cohort, the risk score and survival status indicated by the prognostic model are displayed in Figure 4D. Samples were divided into low- and high-risk clusters according to the median risk score. Survival analysis indicated that low-risk patients had significantly longer overall survival times than high-risk patients (Figure 4E). ROC curve analysis showed that the specificity and sensitivity were highest when the risk score was 0.669, 0.622, and 0.599 according to the 1-, 3-, and 5-year survival of the area under the AUC value, respectively (Figure 4F). For the entire cohort, the risk score and survival status are illustrated in Figure 4G. Samples were classified into low- and high-risk clusters according to the median risk score. Survival analysis indicated that low-risk patients had significantly longer overall survival times than high-risk patients (Figure 4H). ROC curve analysis showed that the specificity and sensitivity were highest when the risk score was 0.694, 0.67, and 0.647 according to the 1-, 3-, and 5-year survival of the area under the AUC value, respectively (Figure 4I). The univariate model of the training, testing and entire cohorts is shown in Figures 5A–C, while the multivariate model of the training, testing and entire cohorts is shown in Figures 5D–F. The results all demonstrated that the prognostic model has independent and moderate prognostic power for immune cell infiltration. Taking the median risk score as the standard, we divided the sample of the entire cohort into a high-risk cluster and a low-risk cluster. Based on different clinical factors, we conducted a survival analysis of the two groups of samples. In the subgroup analysis stage II, stage III, stage IV, age ≤ 60, age > 60, female, male, with tumor and free of tumor, patients in the high-risk group had shorter overall survival times than those in the low-risk group (Figure 6).

Table 1 Univariate Cox proportional hazards regression analysis.
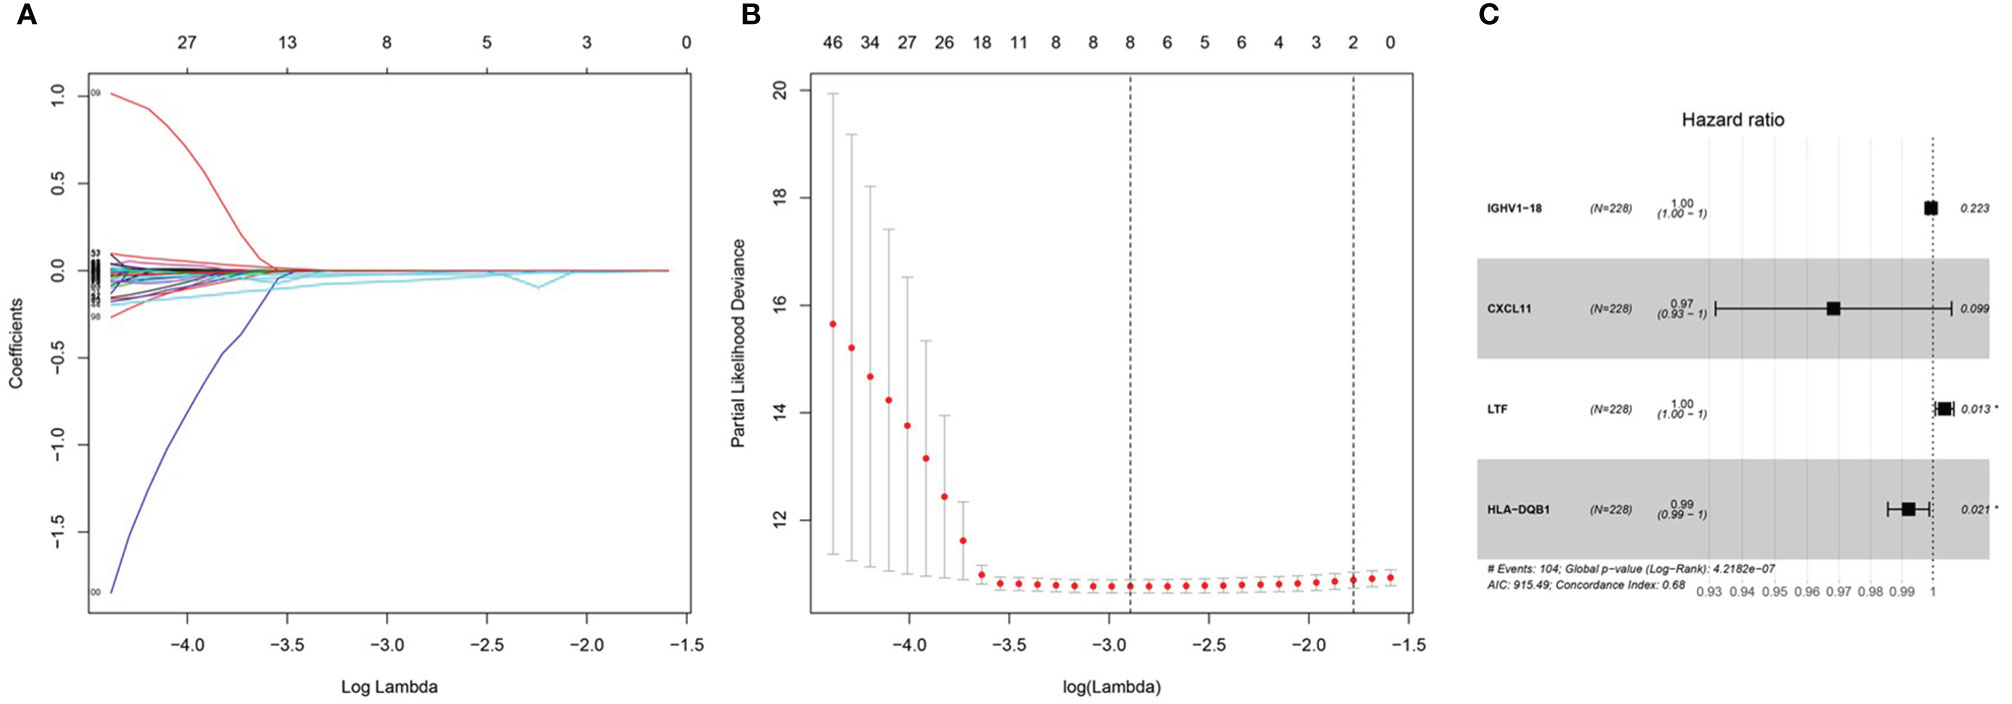
Figure 3 Prognosis model of training cohort. (A, B) LASSO Cox regression analysis of training cohort. (C) multivariate Cox proportional hazards regression analysis of training cohort.
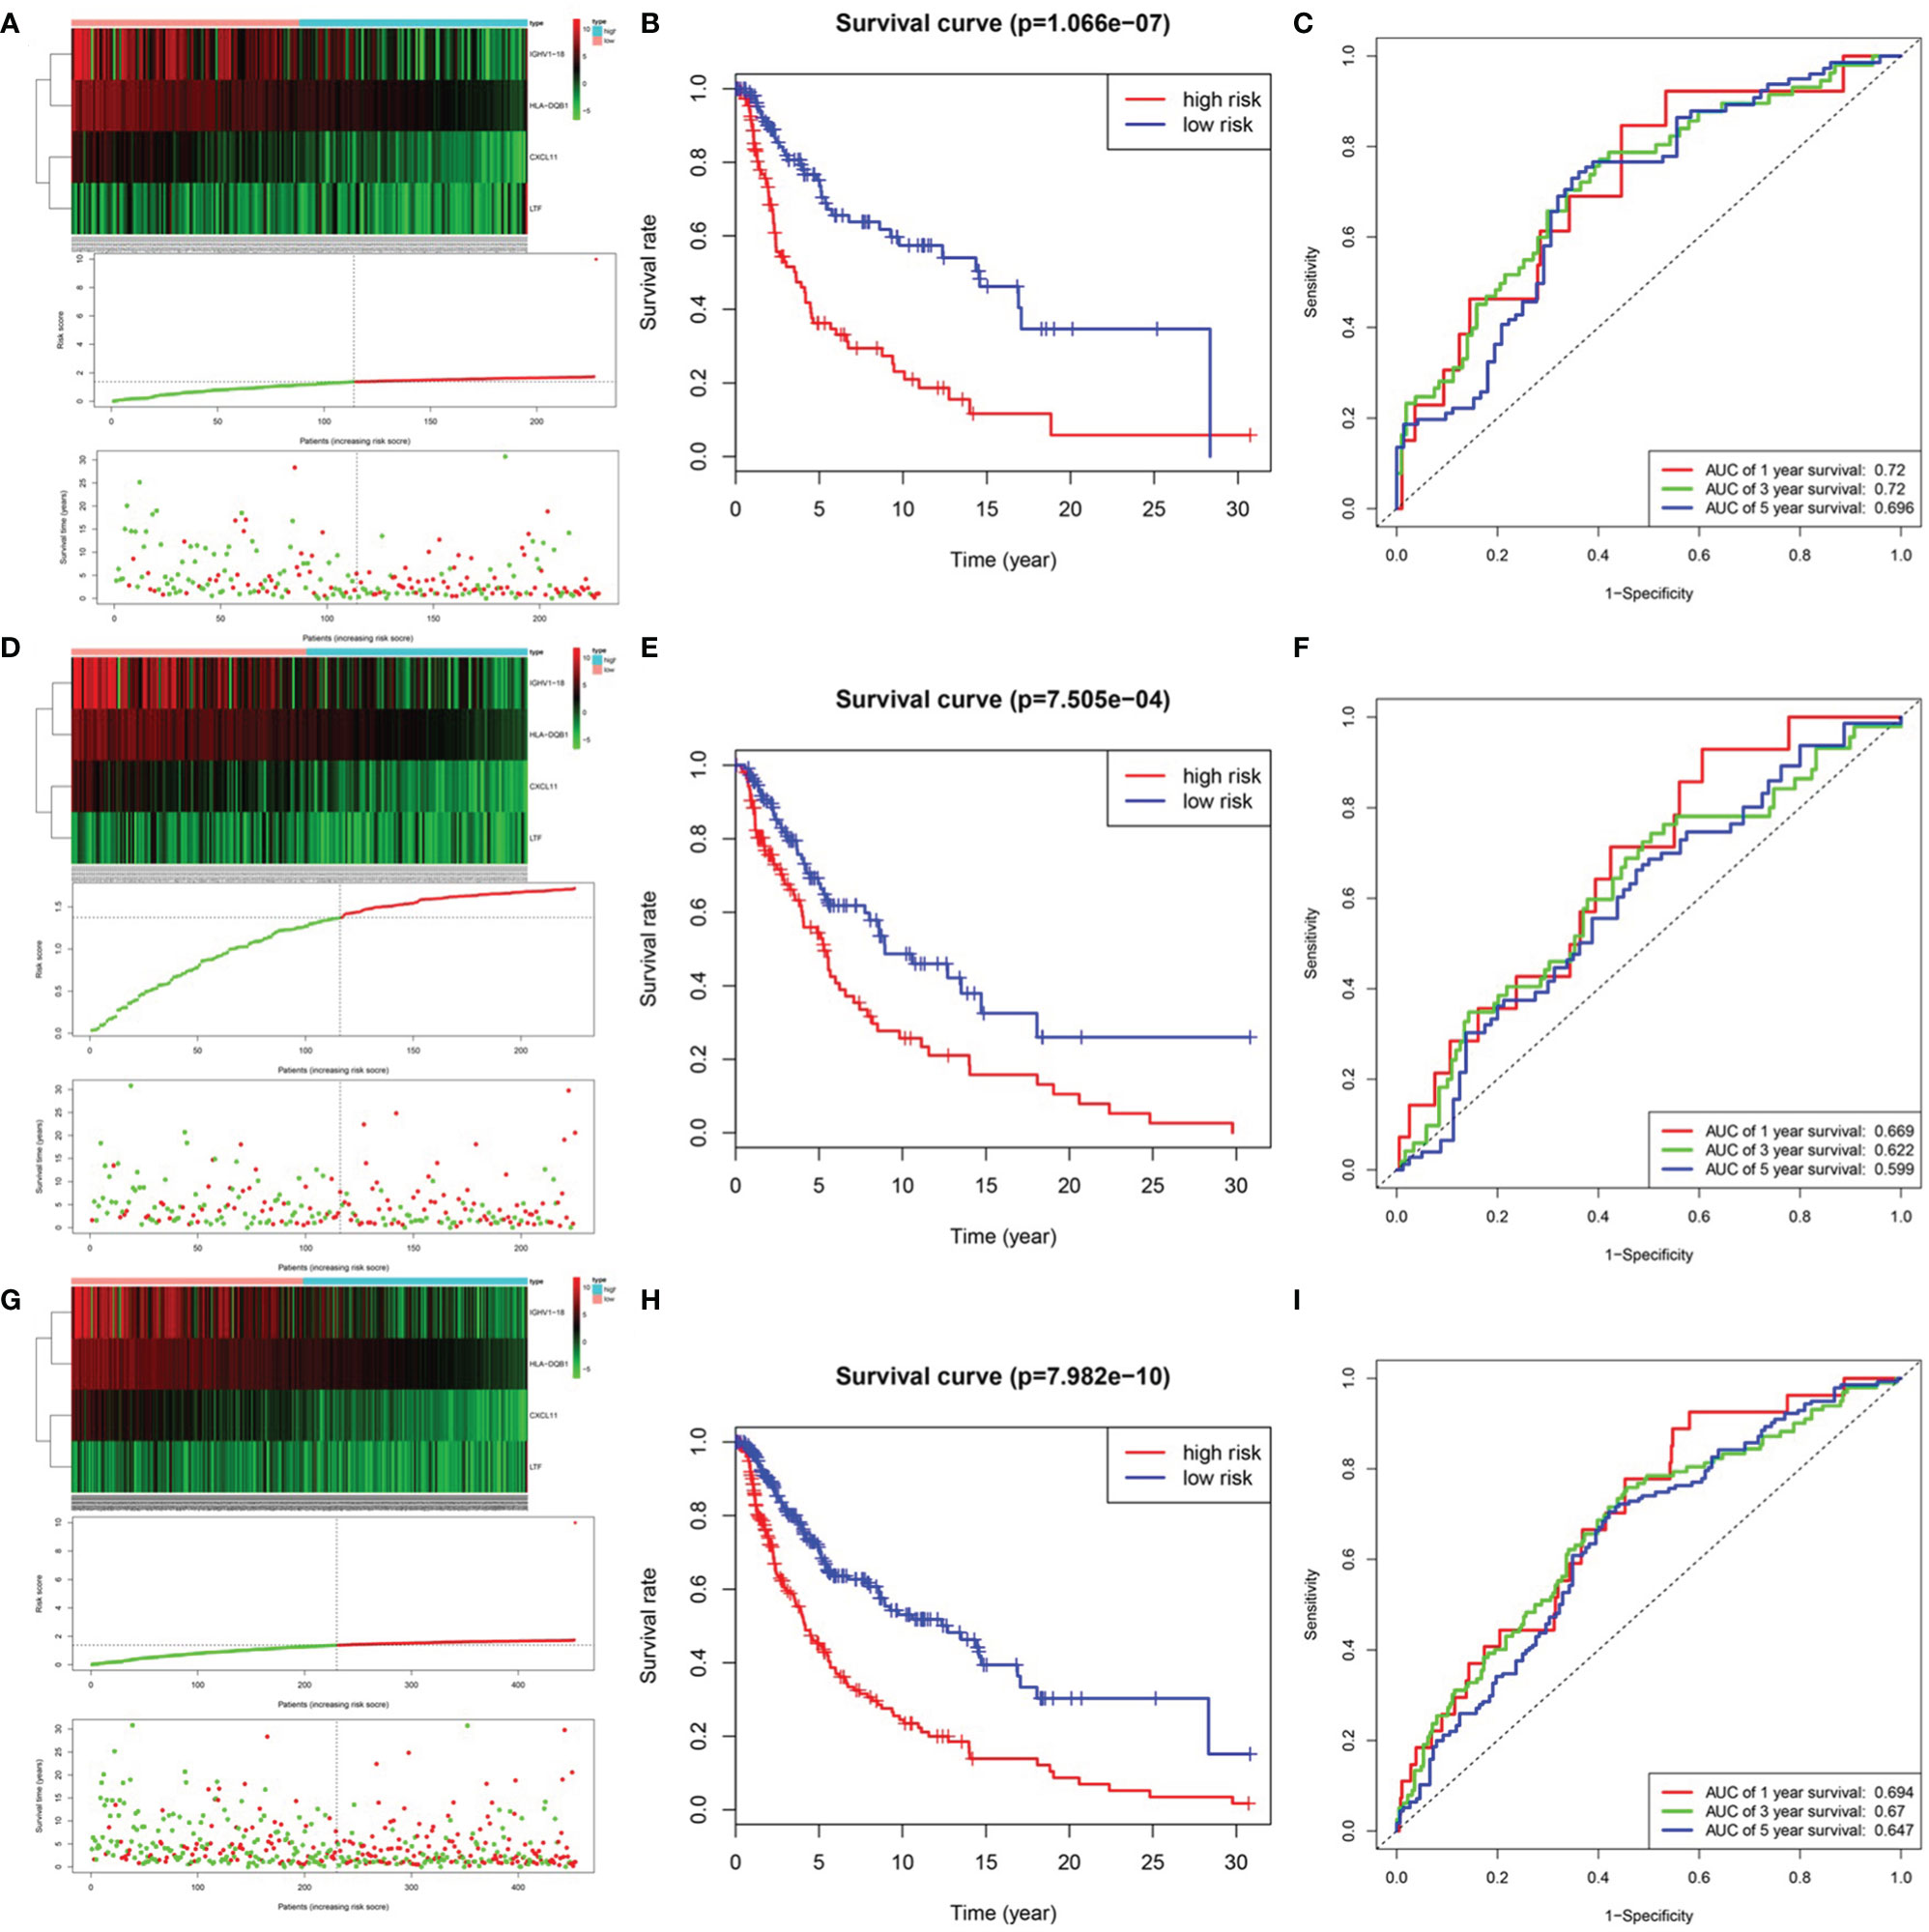
Figure 4 Prognosis model of training, testing and entire cohort. (A) The risk score and survival status of training cohort. (B) Survival analysis between low-risk patients and high-risk patients of training cohort. (C) ROC curve analysis of training cohort. (D) The risk score and survival status of testing cohort. (E) Survival analysis between low-risk patients and high-risk patients of testing cohort (F) ROC curve analysis of testing cohort. (G) The risk score and survival status of entire cohort. (B) Survival analysis between low-risk patients and high-risk patients of entire cohort (H) Survival analysis between low-risk patients and high-risk patients of training cohort (I) ROC curve analysis of entire cohort.
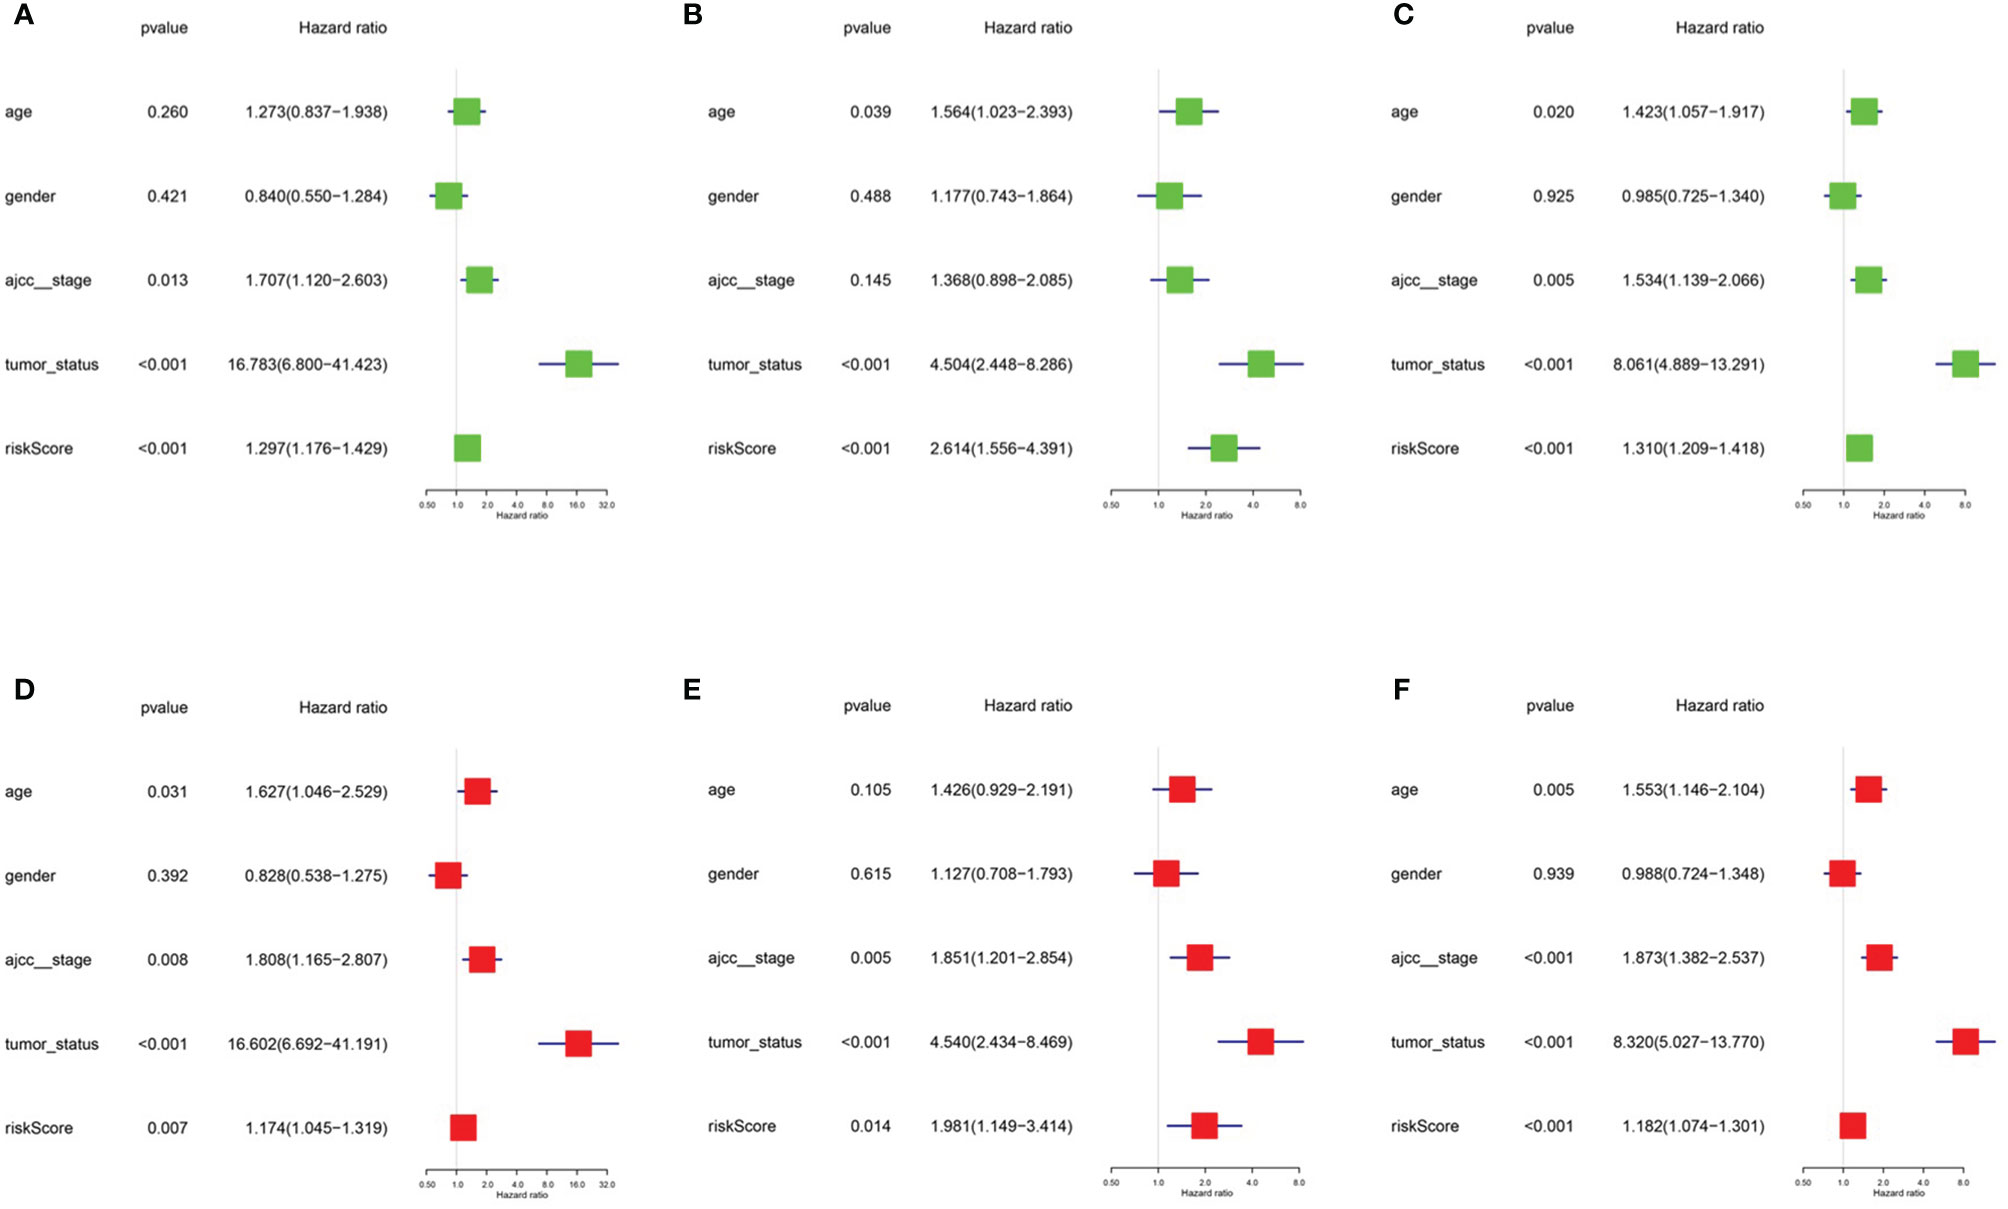
Figure 5 Univariate model and multivariate model of the training, testing and entire cohort. (A) Univariate model of training cohort. (B) Univariate model of testing cohort (C) Univariate model of entire cohort (D) multivariate model of training cohort (E) multivariate model of testing cohort (F) multivariate model of entire cohort.
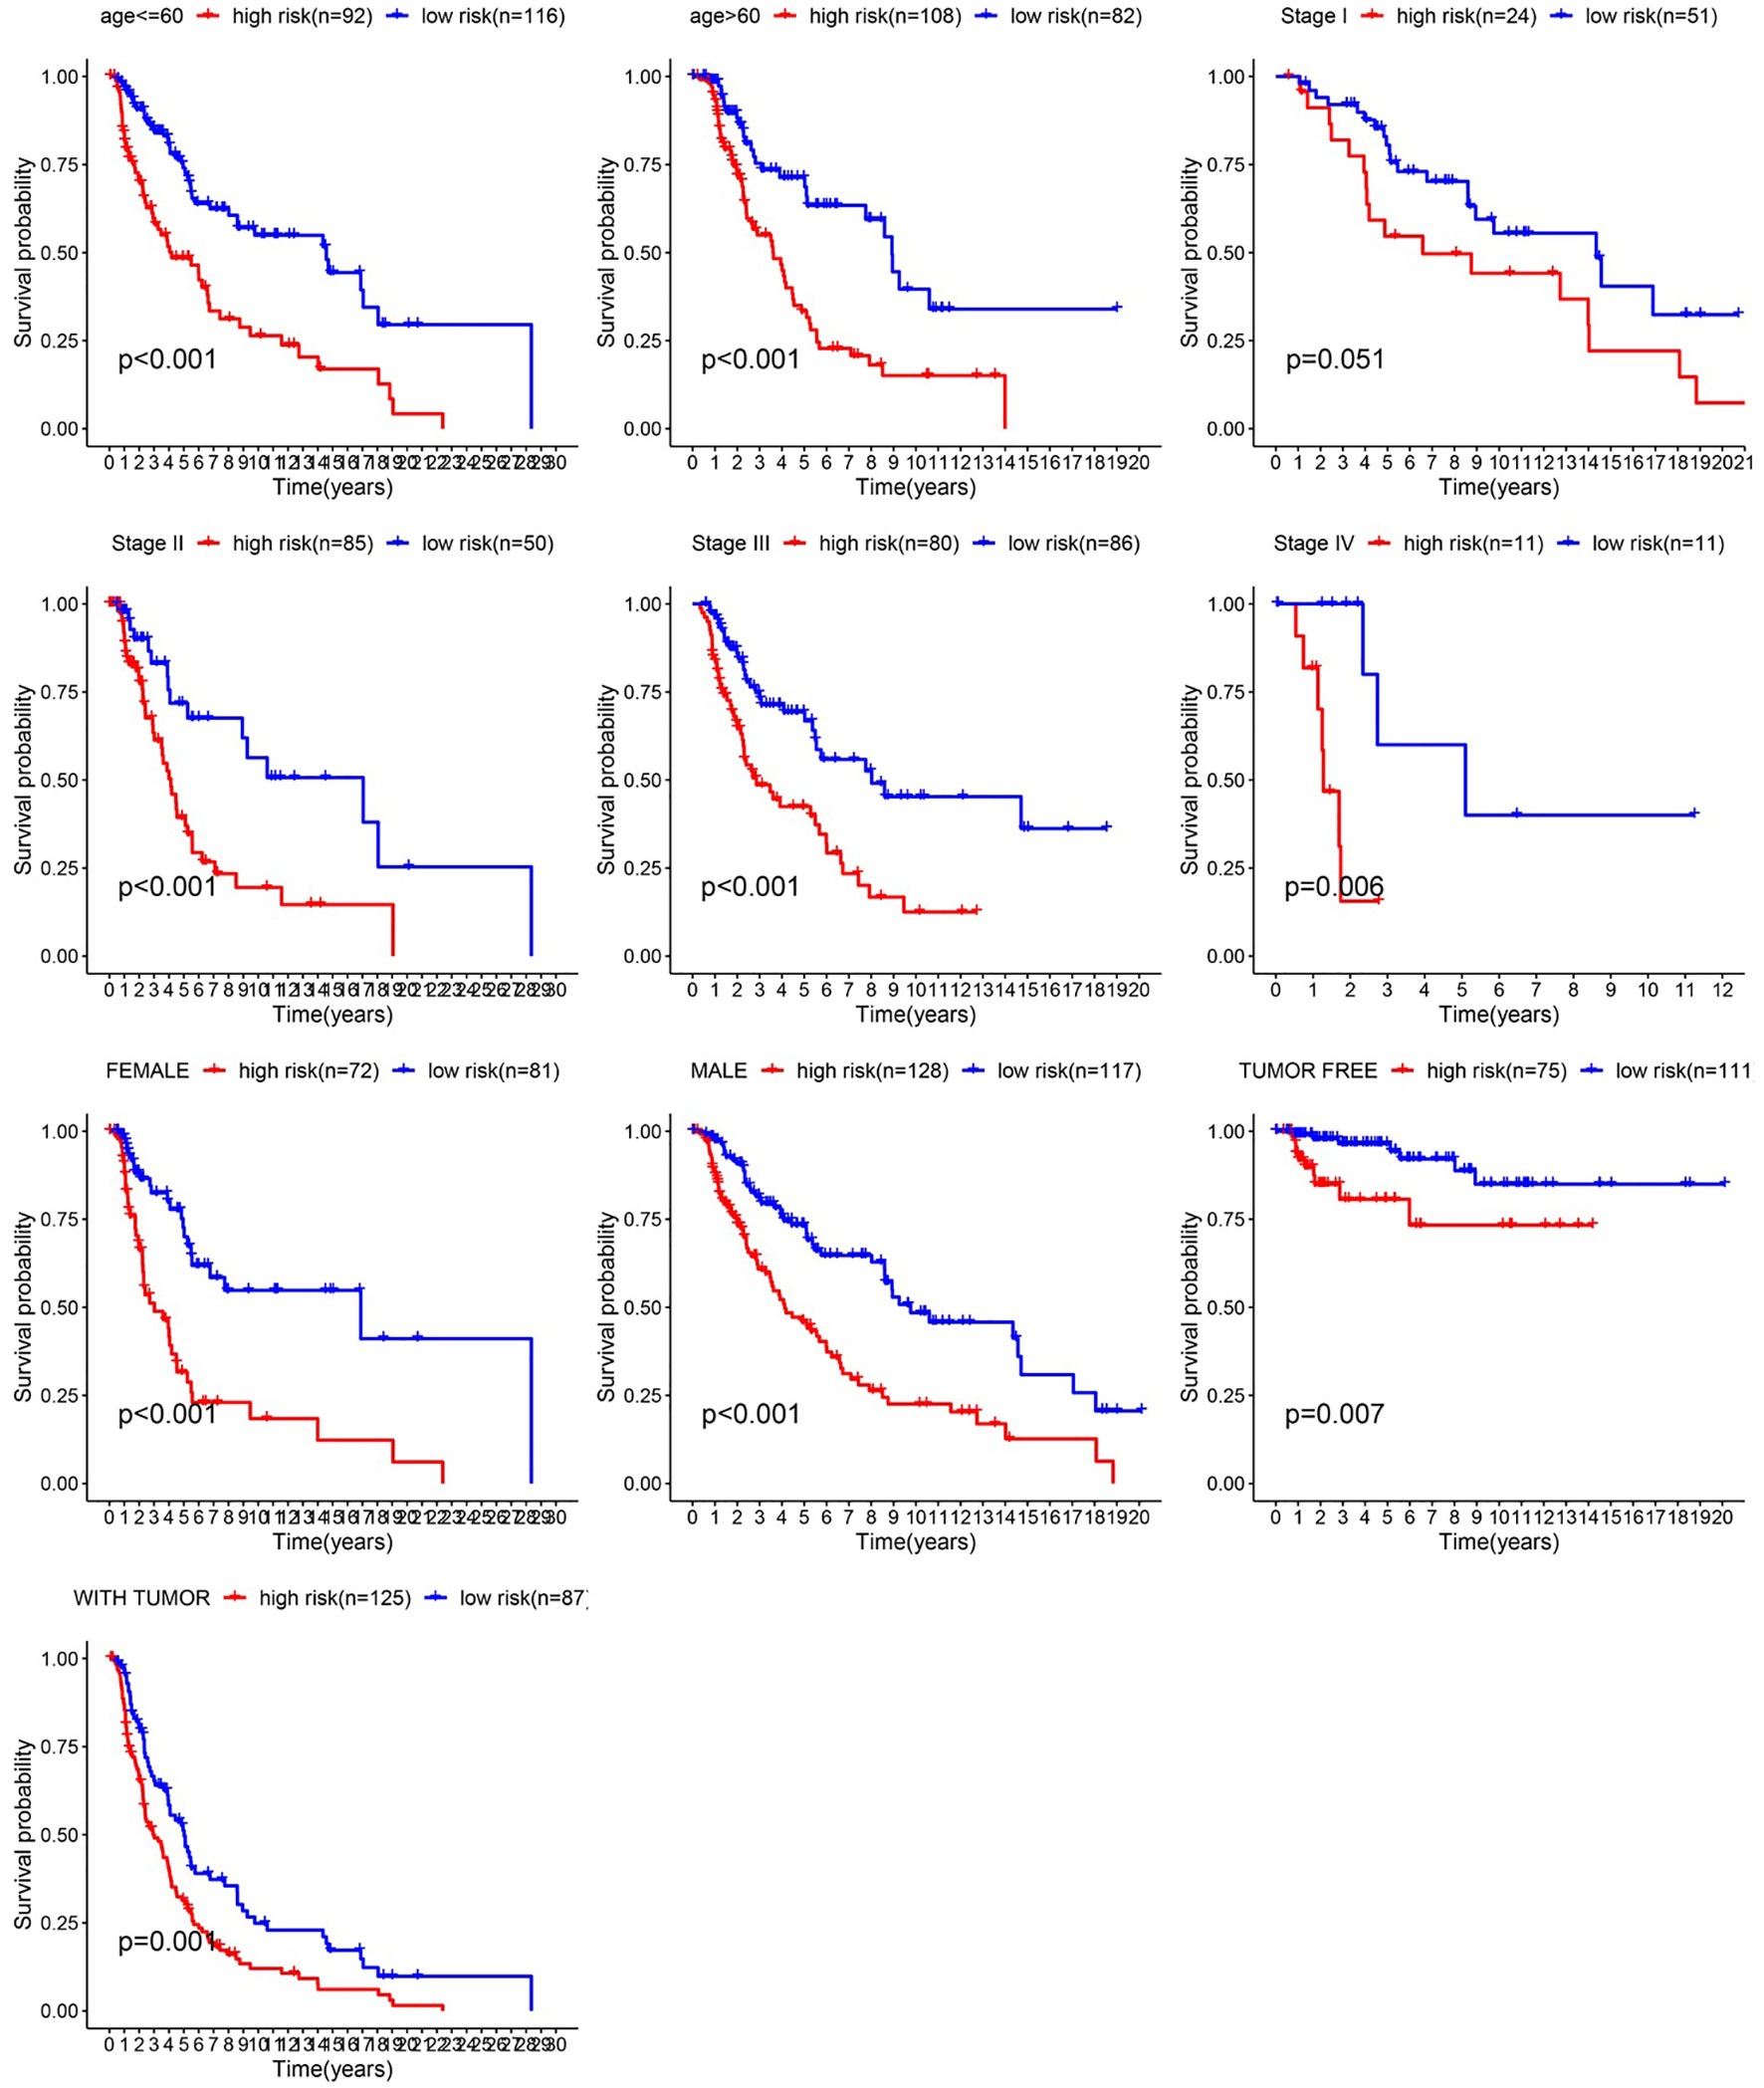
Figure 6 Survival time of patients in high-risk and low-risk cluster of different subgroups.
Construction of the Predictive Nomogram
To predict the survival rate of melanoma patients from a clinical point of view, we constructed a nomogram using TCGA data to estimate the likelihood that the OS will last for 1, 3, and 5 years. We used the following six independent prognostic factors to predict the nomogram: age, AJCC stage, grade, histological type, risk score and tumor status (Figure 7A). The calibration chart shows that the effectiveness of the nomogram was very good, and the 45° line represents the best predicted case. (Figure 7B). ROC curve analysis illustrated that the 1-, 3-, and 5-year risk score AUC values were 0.719, 0.675 and 0.688, respectively. The AUC values for the 1-, 3- and 5-year clinical factors were 0.622, 0.731 and 0.753, respectively (Figures 8D–F). The 1-, 3-, and 5-year AUC values for age, gender, AJCC stage, and tumor status are shown in Figures 8A–C.
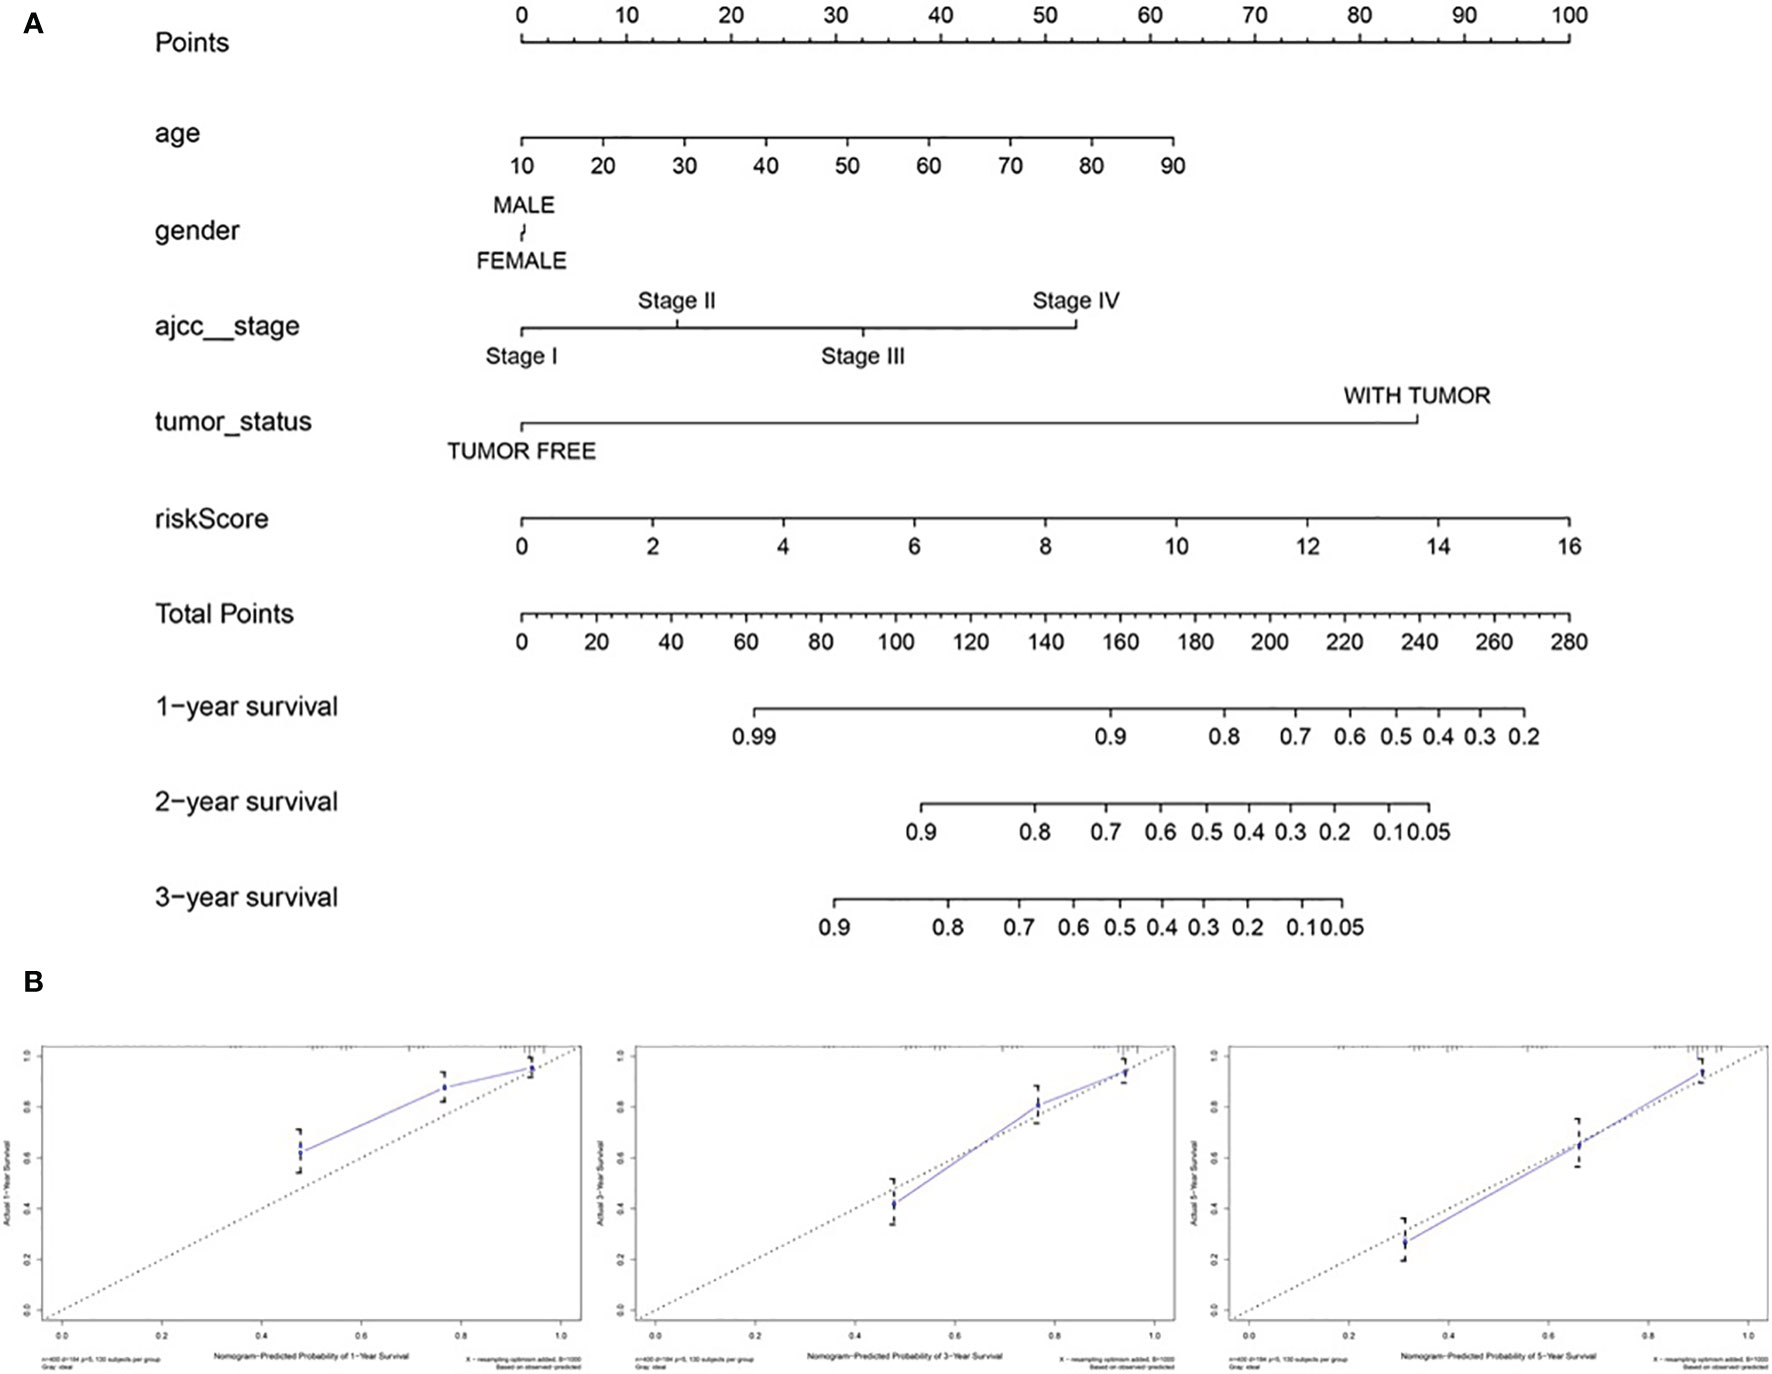
Figure 7 The nomogram of predicting 1-, 3‐, or 5‐year OS and prognostic value of 4 genes in the entire set. (A) The nomogram for predicting 1-, 3‐, or 5‐year OS. (B) The calibration plots for predicting 1-, 3‐ or 5‐ year OS. Nomogram‐predicted probability of survival is plotted on the x‐axis; actual survival is plotted on the y‐axis.
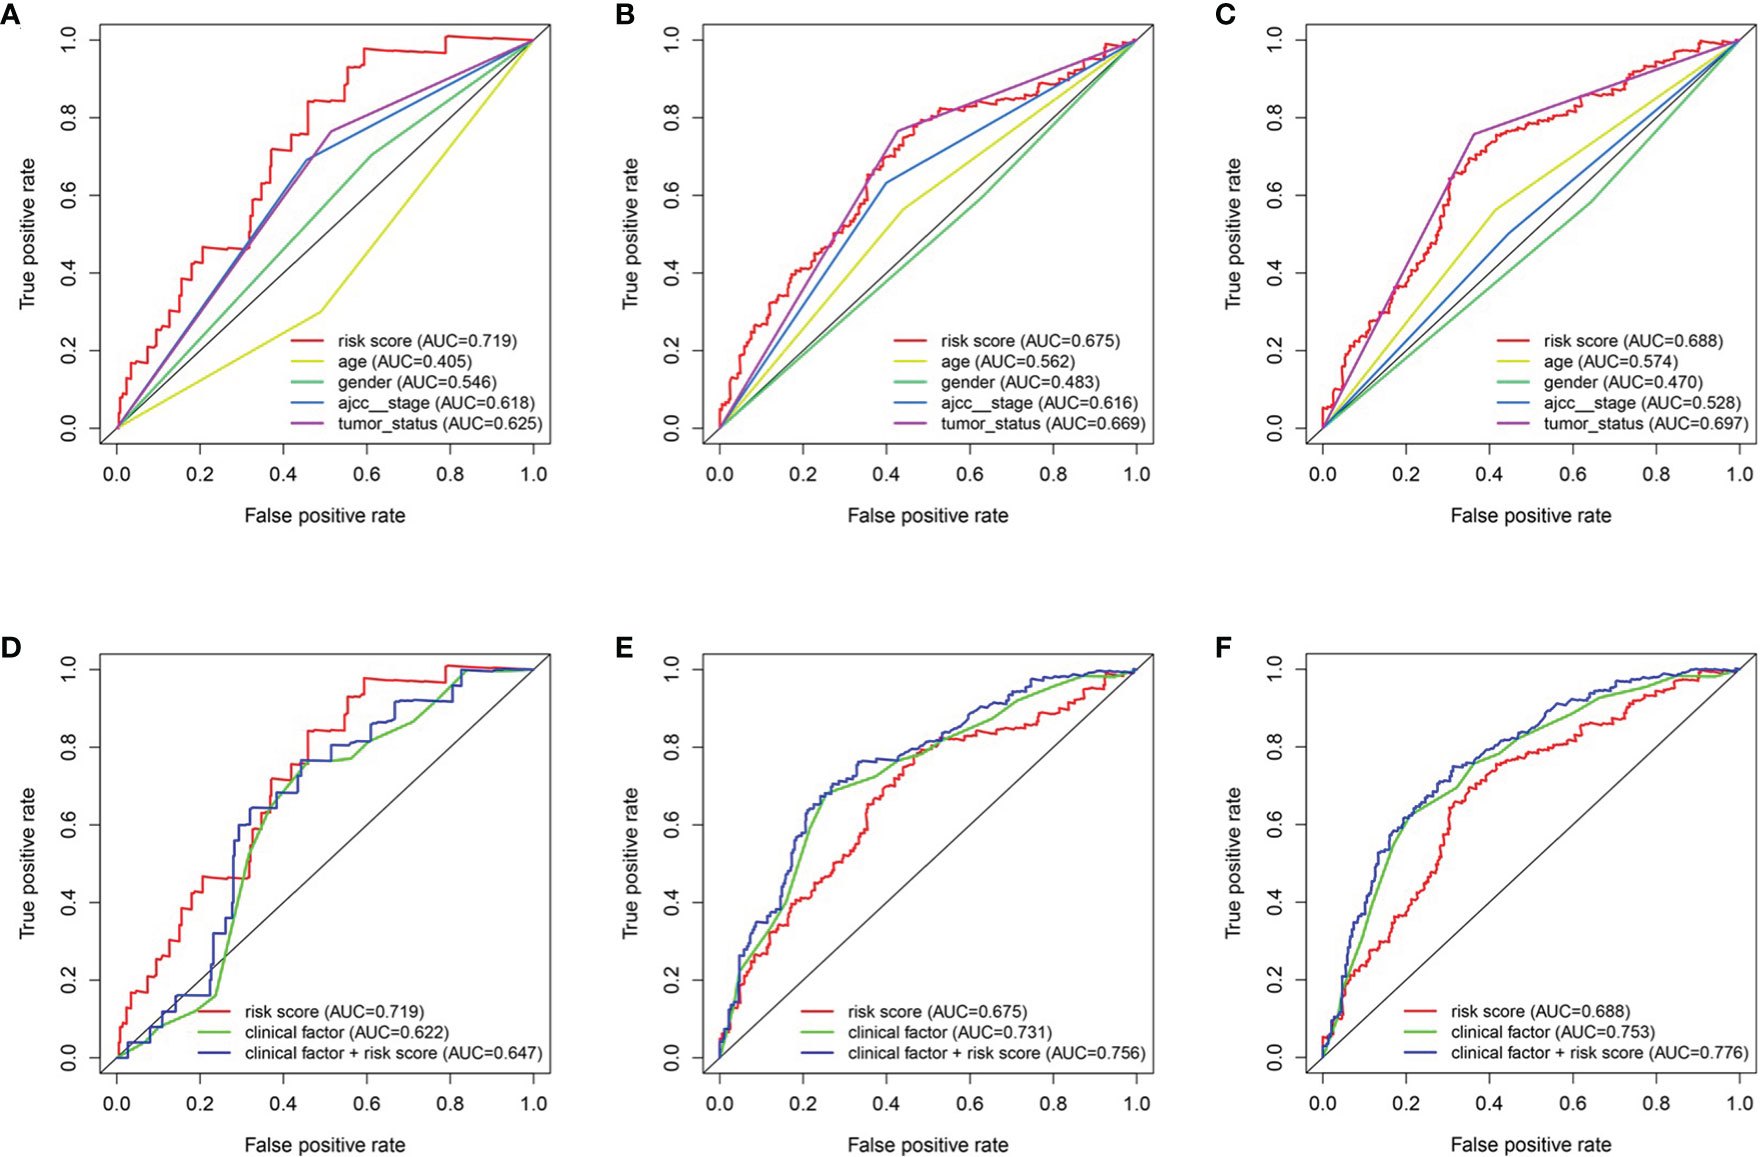
Figure 8 The relationship between four genes mRNA signature and different clinical features. (A, D) training cohort. (B, E) testing cohort. (C, F) entire cohort.
Validation of the Screened Genes by qRT-PCR and External Melanoma Database
Compared with the normal melanocytes, IGHV1-18, CXCL11 and HLA-DQB1 were highly expressed in melanoma cell line A375, A815 and SK-MEL-28, and LTF was downregulated in melanoma cell line A375, A815 and SK-MEL-28 (Figure 9), and both had statistical significance (P < 0.05). And the stability of the identified prognostic immune-related genes were substantiated by the external validation dataset GSE15605 containing 58 melanoma samples. Consistent with previous results, the expression of CXCL11 was higher while LTF was lower in the melanoma samples compared with normal samples. (Figure S1).
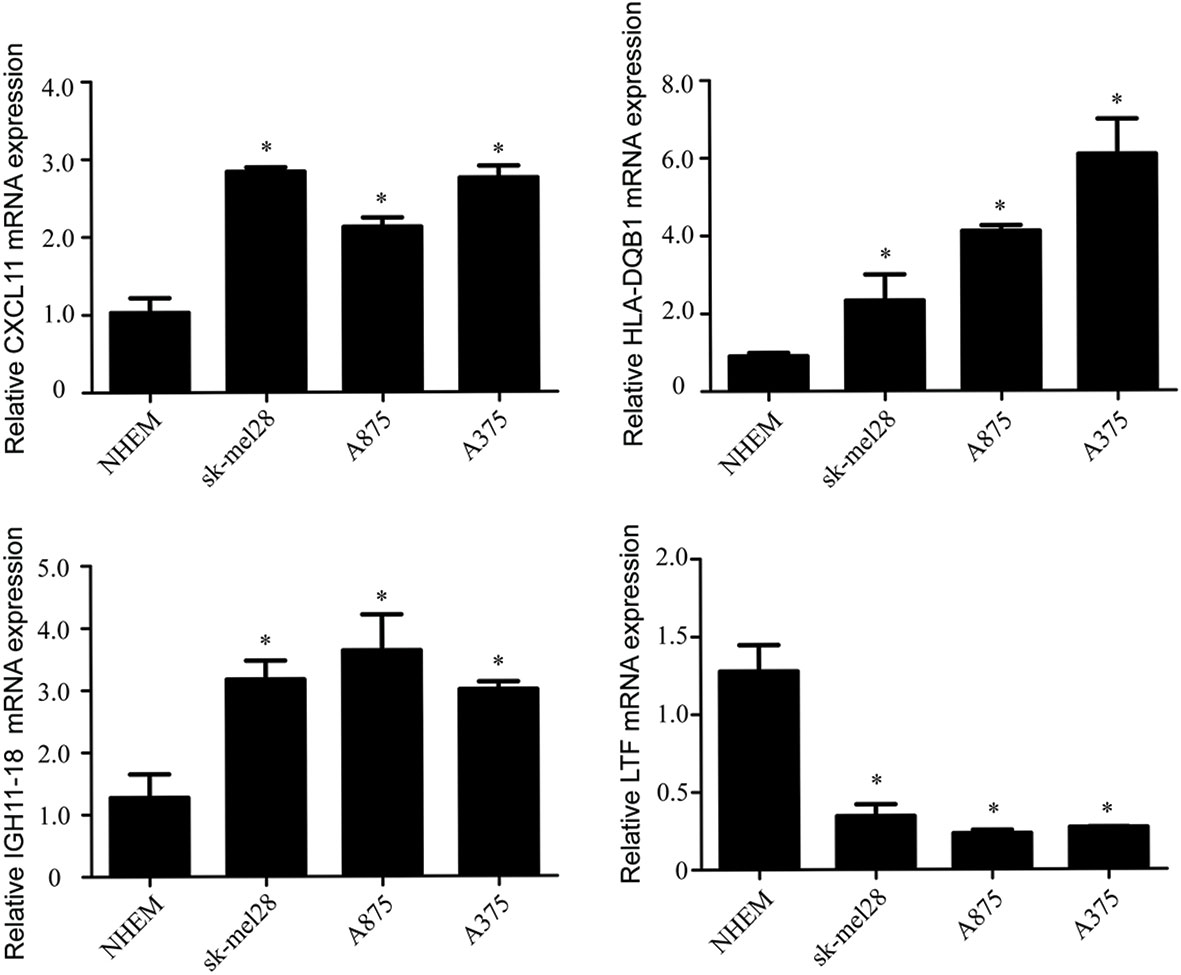
Figure 9 The mRNA levels of IGHV1-18, CXCL11, LTF and HLA-DQB1 in melanoma cell line A375, A815, SK-MEL-28 and NHEM. Data are expressed as mean ± SEM. *P < 0.05. NHEM, normal human epidermal melanocytes.
Correlation of the Identified Prognostic Immune-Related Genes With the Immune Cell Subtypes That Infiltrate Melanoma and the Molecular Subtypes of Cutaneous Melanoma
Because the 4 genes IGHV1-18, CXCL11, LTF and HLA-DQB1 are associated with tumor immunity, we used the TIMER database to analyze the correlation between the prognosis of these 4 genes and the infiltration of immune cell subtypes in melanoma (Figure 10). The correlation value of B cells with the risk score was −0.241, and the correlation value of CD4+ T cells with the risk score was −0.235. The correlation value of CD8+ T cells with the risk score was -0.422. The correlation values of dendritic cells with the risk score was −0.511. The correlation value of macrophages with the risk score was −0.255, and the correlation value of neutrophils with the risk score was −0.442. The above results suggest that the prognosis of melanoma is significantly negatively correlated with infiltration by these immune cell subtypes. In addition, compared with the normal control, the expression of IGHV1-18, CXCL11 and HLA-DQB1 were higher in the patients with cutaneous melanoma, while the expression of LTF was lower (Figure S2). We divide cutaneous melanoma into four subtypes (BRAF-mutant, NF1-deficient, NRAS-mutant and triple wild-type). We found that the expression of CXCL11 (P = 0.1), LTF (P = 0.28), and HLA-DQB1 (P = 0.67) had no significant relation to the subtypes of cutaneous melanoma through TISIDB database (Figure S3).
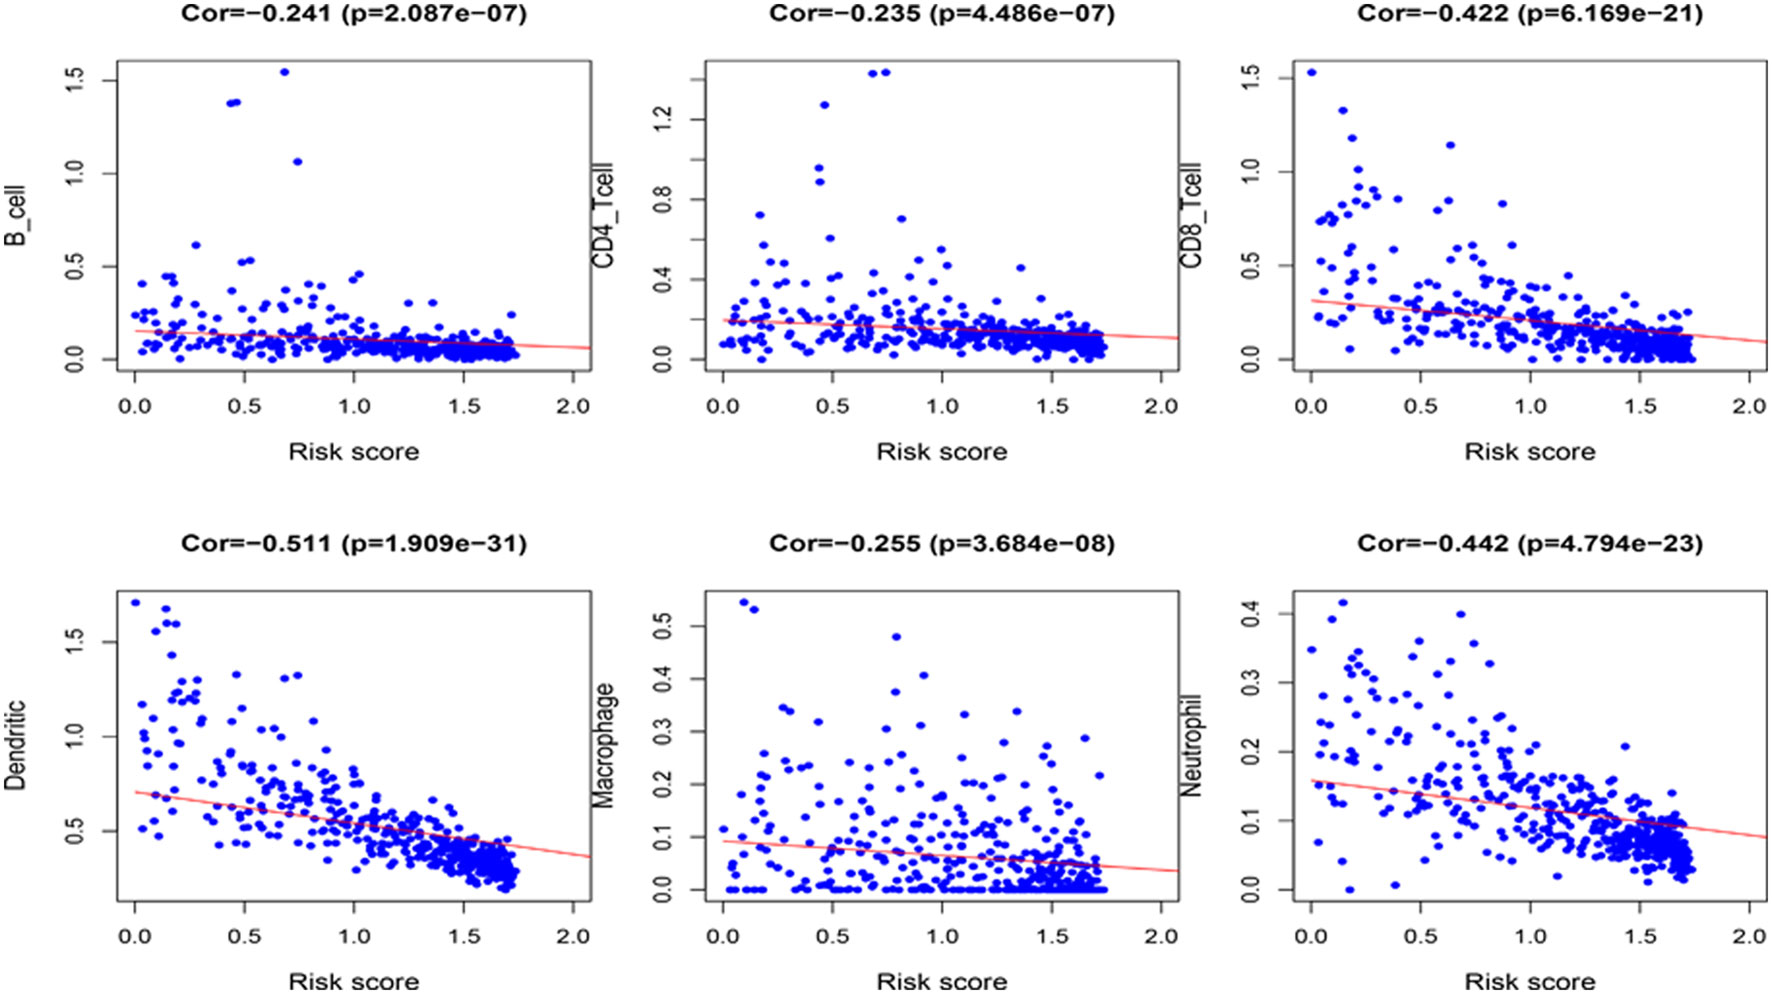
Figure 10 Correlation between the 4 immune-related genes prognostic signature for melanoma and the infiltration of immune cell subtypes. The six most relevant infiltration of immune cell subtypes are shown in the figure.
Discussion
Melanoma is the most invasive form of skin cancer, and the incidence continues to rise worldwide. Although intense intermittent sun exposure is the main risk factor for melanoma, family history of melanoma, genetic susceptibility, environmental factors, and immunosuppression are other factors that affect the incidence (19). In recent years, immunotherapy and targeted therapy of specific factors have been increasingly used to treat melanoma. Liao et al. developed a predictive model based on two gene signatures including CCL8 and DEFB1 but lacked an exploration of its relationship with immune cells (20). Meng et al. established a signature consisted of 33 immune-related gene (IRG) pairs which associated with OS in malignant melanoma and analyzed the variations of the abundance of immune cells (21). Liu et al. identified 10 DE IRGs between primary and metastatic melanoma, and investigated the immune infiltration and tumor mutation burden in different risk groups (22).
In this study, we focused on the immune infiltrating status in melanoma and selected IGHV1-18, CXCL11, LTF and HLA-DQB1 from immune cell infiltration cluster as immune cell infiltration-related DEGs through the analysis of differences in melanoma samples and the construction of prognostic models. In addition, we further explored the correlation of the immune cell infiltration-related DEGs with the specific immune cell subtypes, which may provide more details for the exploration of the mechanisms by which DEGs regulate the development and prognosis of melanoma.
The CXCL9, -10, -11/CXCR3 axis is involved in inflammatory responses, leukocyte trafficking, adaptive resistance, hematopoiesis, cancer cell transfer and angiogenesis. Tokunaga et al. found that the CXCL9, CXCL10, and CXCL11/CXCR3 axis can be used as novel tumor treatment targets (23). C-X-C motif chemokine 11 (CXCL11) is regarded as the dominant CXCR3 agonist and can be induced by IFN-γ and type I interferons (24). CXCL11 has been found uniquely expressed in the melanoma with rich lymphocyte, and may play a potential role in the construction of tumor microenvironment by recruiting activated T-cells (25). Kremenovic et al. revealed that CXCL11, as a myeloid activation (MA) signature gene, had a positive correlation with the presence of M1 macrophages, mature dendritic cells (DC) and CD8+ T cells in cutaneous melanoma patients (26).
The lactoferrin (LTF) gene, located at 3p21.3, acts as a tumor suppressor gene in diverse tumors. Zhang et al. demonstrated that LTF is dysregulated in nasopharyngeal carcinoma cell lines (27). Yi HM and others discovered expression, genetic and epigenetic alterations of the LTF gene in nasopharyngeal carcinoma cell lines (28). Wei et al. found that in B16-F10 melanoma metastasis model, the metastatic rate was higher in the LTF knockout mice (29). LTF may play a protective role in melanoma metastasis by inducing differentiation and apoptosis of myeloid-derived suppressor cells (MDSCs) and up-regulating TLR9 expression.
Polymorphisms of human leukocyte antigen (HLA) genes are thought to be associated with the susceptibility to a variety of malignancies and involved in the progress of carcinogenesis, tumor proliferation and immune escape (30). HLA-DQB1 is more extensively studied in gastric cancer and cervical cancer (31, 32). HLA-DQB1 * 0301 has been reported to be closely associated with the risk of melanoma development and progression (33). As far as we know there are indeed few reports on IGHV1-18 in melanoma. IGHV1-18 is commonly expressed in normal B cells, and the tumor or inflammatory conditions can affect B cells, which may result in mutations in the heavy chain clone gene and influence the antibody gene family usage preference (34, 35). Although IGHV1-18 has not been reported in melanoma, current studies suggest that the dynamic balance of B cells and antibodies may be related to the occurrence, development and prognosis of melanoma. In melanoma, B-cells can be polarized to produce IgG4, which has low anti-tumor efficacy and may represent a possible mechanism of tumor escape (36). In addition, although it is generally believed that Ig is produced only by B lymphocytes, recent studies have reported that IgG can also be produced by non-B cells, such as epithelial cancer cells. For example, compared with normal epithelial cells, IgG from cancer cells often show unique V(D)J rearrangement or mutation hotspots (37). Therefore, further research on IGHV1-18 changes in melanoma patients may be helpful for the diagnosis and prognosis of melanoma. We have included this part of discussion in our revised manuscript accordingly.
Immunotherapy, along with surgery, radiation therapy and chemotherapy, is rapidly becoming the standard treatment for cancer. In recent years, it has been demonstrated in a variety of tumor types that the level of immune cell infiltration is inversely related to tumor purity but positively correlated with responsiveness to immune checkpoint inhibitors, which results in better prognosis and immune response (38, 39). Our results showed that the status of overall increased infiltrating immune cells in melanoma has the potential to predict clinical prognosis. Melanoma could be divided into ”hot” and “cold” status (enrich in or lack of immune cells infiltration), and the hot status is likely to correlate with antigen processing and higher expression of interferons, TNF and chemokines pathways (40). We further analyzed the infiltrating immune cell subtypes which correlated with the prognosis of melanoma. CD8+ cytotoxic T lymphocytes (CTLs) are the preferred tool for targeting tumors, and effective antitumor immunity also requires CD4+ T cells (41). Experiments have shown that CD8+ T cells and CD4+ T cells play a role in the treatment of breast cancer, colon cancer, etc. (42, 43), especially in melanoma (44, 45). Enhanced dendritic actin network formation is clearly proven to have an effect on melanoma (46). Samaniego R and others found that macrophage expression can predict human primary cutaneous melanoma progression (47). Protumor activities of macrophages have also been detected in the progression of melanoma (48). Forsthuber A and others found that CXCL5 played a role as a regulator of neutrophil function in cutaneous melanoma (49). Soler-Cardona A and others also confirmed that this mechanism is related to lymph node metastasis (50). The above results indicate that our screening and prediction about immune cell subtypes are reliable, which is beneficial to further research on melanoma immunotherapy.
Nevertheless, our study remains certain limitations. First, the data on which the prediction model was established were obtained from available public databases, though we validated it in melanoma cell lines through qRT-PCR and other external datasets, the immunohistochemistry staining of the protein level associated with DEGs and infiltrating immune cell in tumor tissues also deserves further validation. In addition, the immune cell types were identified by marker genes, but the expression level of them may not constant per cell, and hence, the cell number may be incompletely relevant to the expression level of marker genes (51). Further, a more comprehensive analysis of more types of immune cells and the stromal cells should be a focus of future research.
Conclusion
In this study, by analyzing the differences between melanoma samples and immune cell infiltration data, we constructed a prognostic model and identified immune-related melanoma core genes. Relevant immune cell subtypes were also identified. In the future, the identified genes and subtypes may be used in targeted therapy and immunotherapy to provide new clinical treatment ideas.
Data Availability Statement
The original contributions presented in the study are included in the article/Supplementary Material. Further inquiries can be directed to the corresponding authors.
Author Contributions
J-AZ and X-YZ contributed equally to this work. J-AZ and MJ together with KC designed the experiment. DH, CL, and HG provided conceptual advice and critically reviewed the article. J-AZ, X-YZ and MJ together with KC conceptually designed the study and prepared the article. All authors contributed to the article and approved the submitted version.
Funding
This study was supported by CAMS Innovation Fund for Medical Sciences (CIFMS-2017-I2M-1-017), the National Natural Science Foundation of China (grant nos. 81703152, 81872545 and 82073445), and the Jiangsu Province Natural Science Foundation (No. BK20170161).
Conflict of Interest
The authors declare that the research was conducted in the absence of any commercial or financial relationships that could be construed as a potential conflict of interest.
Supplementary Material
The Supplementary Material for this article can be found online at: https://www.frontiersin.org/articles/10.3389/fonc.2020.602555/full#supplementary-material
Supplementary Figure 1 | The expression of CXCL11and LTF in melanoma patients from the GEO cohort (GSE15605), P < 0.001.
Supplementary Figure 2 | The expression of CXCL11, LTF, and HLA-DQB1 in the group of cutaneous melanoma and normal control.
Supplementary Figure 3 | Analysis of the expression of IGHV1-18, CXCL11, LTF, and HLA-DQB1 in different molecular subtypes of cutaneous melanoma.
References
1. Rastrelli M, Tropea S, Rossi CR, Alaibac M. Melanoma: epidemiology, risk factors, pathogenesis, diagnosis and classification. In Vivo (2014) 28(6):1005–11.
2. Ribero S, Glass D, Bataille V. Genetic epidemiology of melanoma. Eur J Dermatol (2016) 26(4):335–9. doi: 10.1684/ejd.2016.2787
3. Duncan LM. The classification of cutaneous melanoma. Hematol Oncol Clin North Am (2009) 23(3):501–13, ix. doi: 10.1016/j.hoc.2009.03.013
4. Haas OA. Primary Immunodeficiency and Cancer Predisposition Revisited: Embedding Two Closely Related Concepts Into an Integrative Conceptual Framework. Front Immunol (2018) 9:3136. doi: 10.3389/fimmu.2018.03136
5. Odunsi K. Immunotherapy in ovarian cancer. Ann Oncol (2017) 28(suppl_8):viii1–7. doi: 10.1093/annonc/mdx444
6. Morrison AH, Byrne KT, Vonderheide RH. Immunotherapy and Prevention of Pancreatic Cancer. Trends Cancer (2018) 4(6):418–28. doi: 10.1016/j.trecan.2018.04.001
7. Park R, Williamson S, Kasi A, Saeed A. Immune Therapeutics in the Treatment of Advanced Gastric and Esophageal Cancer. Anticancer Res (2018) 38(10):5569–80. doi: 10.21873/anticanres.12891
8. Pampena MB, Cartar HC, Cueto GR, Levy EM, Blanco PA, Barrio MM, et al. Dissecting the Immune Stimulation Promoted by CSF-470 Vaccine Plus Adjuvants in Cutaneous Melanoma Patients: Long Term Antitumor Immunity and Short Term Release of Acute Inflammatory Reactants. Front Immunol (2018) 9:2531. doi: 10.3389/fimmu.2018.02531
9. Lee YT, Tan YJ, Oon CE. Molecular targeted therapy: Treating cancer with specificity. Eur J Pharmacol (2018) 834:188–96. doi: 10.1016/j.ejphar.2018.07.034
10. Atherton MJ, Morris JS, McDermott MR, Lichty BD. Cancer immunology and canine malignant melanoma: A comparative review. Vet Immunol Immunopathol (2016) 169:15–26. doi: 10.1016/j.vetimm.2015.11.003
11. da Silveira Nogueira Lima JP, Georgieva M, Haaland B, de Lima Lopes G. A systematic review and network meta-analysis of immunotherapy and targeted therapy for advanced melanoma. Cancer Med (2017) 6(6):1143–53. doi: 10.1002/cam4.1001
12. Sullivan RJ. The role of targeted therapy for melanoma in the immunotherapy era. Semin Cutan Med Surg (2018) 37(2):112–9. doi: 10.12788/j.sder.2018.021
13. Tomczak K, Czerwińska P, Wiznerowicz M. The Cancer Genome Atlas (TCGA): an immeasurable source of knowledge. Contemp Oncol (Pozn) (2015) 19(1a):A68–77. doi: 10.5114/wo.2014.47136
14. Bindea G, Mlecnik B, Tosolini M, Kirilovsky A, Waldner M, Obenauf AC, et al. Spatiotemporal dynamics of intratumoral immune cells reveal the immune landscape in human cancer. Immunity (2013) 39(4):782–95. doi: 10.1016/j.immuni.2013.10.003
15. Gonnord P, Costa M, Abreu A, Peres M, Ysebaert L, Gadat S, et al. Multiparametric analysis of CD8(+) T cell compartment phenotype in chronic lymphocytic leukemia reveals a signature associated with progression toward therapy. Oncoimmunology (2019) 8(4):e1570774. doi: 10.1080/2162402x.2019.1570774
16. Heagerty PJ, Zheng Y. Survival model predictive accuracy and ROC curves. Biometrics (2005) 61(1):92–105. doi: 10.1111/j.0006-341X.2005.030814.x
17. Li T, Fan J, Wang B, Traugh N, Chen Q, Liu JS, et al. TIMER: A Web Server for Comprehensive Analysis of Tumor-Infiltrating Immune Cells. Cancer Res (2017) 77(21):e108–e10. doi: 10.1158/0008-5472.Can-17-0307
18. Ru B, Wong CN, Tong Y, Zhong JY, Zhong SSW, Wu WC, et al. TISIDB: an integrated repository portal for tumor-immune system interactions. Bioinformatics (2019) 35(20):4200–2. doi: 10.1093/bioinformatics/btz210
19. Schadendorf D, Fisher DE, Garbe C, Gershenwald JE, Grob JJ, Halpern A, et al. Melanoma. Nat Rev Dis Primers (2015) 1:15003. doi: 10.1038/nrdp.2015.3
20. Liao M, Zeng F, Li Y, Gao Q, Yin M, Deng G, et al. A novel predictive model incorporating immune-related gene signatures for overall survival in melanoma patients. Sci Rep (2020) 10(1):12462. doi: 10.1038/s41598-020-69330-2
21. Meng L, He X, Zhang X, Zhang X, Wei Y, Wu B, et al. Predicting the clinical outcome of melanoma using an immune-related gene pairs signature. PloS One (2020) 15(10):e0240331. doi: 10.1371/journal.pone.0240331
22. Liu N, Liu Z, Liu X, Duan X, Huang Y, Jin Z, et al. Identification of an Immune-Related Prognostic Signature Associated With Immune Infiltration in Melanoma. Front Genet (2020) 11:1002. doi: 10.3389/fgene.2020.01002
23. Tokunaga R, Zhang W, Naseem M, Puccini A, Berger MD, Soni S, et al. CXCL9, CXCL10, CXCL11/CXCR3 axis for immune activation - A target for novel cancer therapy. Cancer Treat Rev (2018) 63:40–7. doi: 10.1016/j.ctrv.2017.11.007
24. Kuo PT, Zeng Z, Salim N, Mattarollo S, Wells JW, Leggatt GR. The Role of CXCR3 and Its Chemokine Ligands in Skin Disease and Cancer. Front Med (Lausanne) (2018) 5:271. doi: 10.3389/fmed.2018.00271
25. Harlin H, Meng Y, Peterson AC, Zha Y, Tretiakova M, Slingluff C, et al. Chemokine expression in melanoma metastases associated with CD8+ T-cell recruitment. Cancer Res (2009) 69(7):3077–85. doi: 10.1158/0008-5472.Can-08-2281
26. Kremenovic M, Rombini N, Chan AA, Gruber T, Bäriswyl L, Lee DJ, et al. Characterization of a Myeloid Activation Signature that Correlates with Survival in Melanoma Patients. Cancers (Basel) (2020) 12(6):1431. doi: 10.3390/cancers12061431
27. Zhang H, Feng X, Liu W, Jiang X, Shan W, Huang C, et al. Underlying mechanisms for LTF inactivation and its functional analysis in nasopharyngeal carcinoma cell lines. J Cell Biochem (2011) 112(7):1832–43. doi: 10.1002/jcb.23101
28. Yi HM, Li YC, Zhong RH. [Expression, genetic and epigenetic alterations of LTF gene in nasopharyngeal carcinoma cell lines]. Zhonghua Zhong Liu Za Zhi (2010) 32(10):729–33. doi: 10.3760/cma.j.issn.0253-3766.2010.10.003
29. Wei L, Zhang X, Wang J, Ye Q, Zheng X, Peng Q, et al. Lactoferrin deficiency induces a pro-metastatic tumor microenvironment through recruiting myeloid-derived suppressor cells in mice. Oncogene (2020) 39(1):122–35. doi: 10.1038/s41388-019-0970-8
30. Sabbatino F, Liguori L, Polcaro G, Salvato I, Caramori G, Salzano FA, et al. Role of Human Leukocyte Antigen System as A Predictive Biomarker for Checkpoint-Based Immunotherapy in Cancer Patients. Int J Mol Sci (2020) 21(19):7295. doi: 10.3390/ijms21197295
31. Zhou SK, Yang LL, Chen R, Lu Y, Zheng YH. HLA-DQB1*03 genotype and perioperative blood transfusion are not conducive to the prognosis of patients with gastric cancer. J Clin Lab Anal (2018) 32(7):e22443. doi: 10.1002/jcla.22443
32. Shim H, Park B, Shin HJ, Joo J, Yoon KA, Kim YM, et al. Protective association of HLA-DRB1*13:02, HLA-DRB1*04:06, and HLA-DQB1*06:04 alleles with cervical cancer in a Korean population. Hum Immunol (2019) 80(2):107–11. doi: 10.1016/j.humimm.2018.10.013
33. Lee JE, Reveille JD, Ross MI, Platsoucas CD. HLA-DQB1*0301 association with increased cutaneous melanoma risk. Int J Cancer (1994) 59(4):510–3. doi: 10.1002/ijc.2910590413
34. Ghia P, Stamatopoulos K, Belessi C, Moreno C, Stella S, Guida G, et al. Geographic patterns and pathogenetic implications of IGHV gene usage in chronic lymphocytic leukemia: the lesson of the IGHV3-21 gene. Blood (2005) 105(4):1678–85. doi: 10.1182/blood-2004-07-2606
35. Feng J, Fan S, Sun Y, Zhang Z, Ren H, Li W, et al. Study of B Cell Repertoire in Patients With Anti-N-Methyl-D-Aspartate Receptor Encephalitis. Front Immunol (2020) 11:1539. doi: 10.3389/fimmu.2020.01539
36. Karagiannis P, Gilbert AE, Josephs DH, Ali N, Dodev T, Saul L, et al. IgG4 subclass antibodies impair antitumor immunity in melanoma. J Clin Invest (2013) 123(4):1457–74. doi: 10.1172/jci65579
37. Geng ZH, Ye CX, Huang Y, Jiang HP, Ye YJ, Wang S, et al. Human colorectal cancer cells frequently express IgG and display unique Ig repertoire. World J Gastrointest Oncol (2019) 11(3):195–207. doi: 10.4251/wjgo.v11.i3.195
38. Sharma P, Allison JP. The future of immune checkpoint therapy. Science (2015) 348(6230):56–61. doi: 10.1126/science.aaa8172
39. Zhou X, Qiu S, Nie L, Jin D, Jin K, Zheng X, et al. Classification of Muscle-Invasive Bladder Cancer Based on Immunogenomic Profiling. Front Oncol (2020) 10:1429. doi: 10.3389/fonc.2020.01429
40. Olbryt M, Rajczykowski M, Widłak W. Biological Factors behind Melanoma Response to Immune Checkpoint Inhibitors. Int J Mol Sci (2020) 21(11):4071. doi: 10.3390/ijms21114071
41. Borst J, Ahrends T, Bąbała N, Melief CJM, Kastenmüller W. CD4(+) T cell help in cancer immunology and immunotherapy. Nat Rev Immunol (2018) 18(10):635–47. doi: 10.1038/s41577-018-0044-0
42. Jagtap SV. Evaluation of CD4+ T-cells and CD8+ T-cells in triple-negative invasive breast cancer. Indian J Pathol Microbiol (2018) 61(4):477–8. doi: 10.4103/ijpm.Ijpm_201_18
43. Zhang L, Yu X, Zheng L, Zhang Y, Li Y, Fang Q, et al. Lineage tracking reveals dynamic relationships of T cells in colorectal cancer. Nature (2018) 564(7735):268–72. doi: 10.1038/s41586-018-0694-x
44. Veatch JR, Lee SM, Fitzgibbon M, Chow IT, Jesernig B, Schmitt T, et al. Tumor-infiltrating BRAFV600E-specific CD4+ T cells correlated with complete clinical response in melanoma. J Clin Invest (2018) 128(4):1563–8. doi: 10.1172/jci98689
45. Li H, van der Leun AM, Yofe I, Lubling Y, Gelbard-Solodkin D, van Akkooi ACJ, et al. Dysfunctional CD8 T Cells Form a Proliferative, Dynamically Regulated Compartment within Human Melanoma. Cell (2019) 176(4):775–89.e18. doi: 10.1016/j.cell.2018.11.043
46. Mohan AS, Dean KM, Isogai T, Kasitinon SY, Murali VS, Roudot P, et al. Enhanced Dendritic Actin Network Formation in Extended Lamellipodia Drives Proliferation in Growth-Challenged Rac1(P29S) Melanoma Cells. Dev Cell (2019) 49(3):444–60.e9. doi: 10.1016/j.devcel.2019.04.007
47. Samaniego R, Gutiérrez-González A, Gutiérrez-Seijo A, Sánchez-Gregorio S, García-Giménez J, Mercader E, et al. CCL20 Expression by Tumor-Associated Macrophages Predicts Progression of Human Primary Cutaneous Melanoma. Cancer Immunol Res (2018) 6(3):267–75. doi: 10.1158/2326-6066.Cir-17-0198
48. Wang H, Yang L, Wang D, Zhang Q, Zhang L. Pro-tumor activities of macrophages in the progression of melanoma. Hum Vaccin Immunother (2017) 13(7):1556–62. doi: 10.1080/21645515.2017.1312043
49. Forsthuber A, Lipp K, Andersen L, Ebersberger S, Graña C, Ellmeier W, et al. CXCL5 as Regulator of Neutrophil Function in Cutaneous Melanoma. J Invest Dermatol (2019) 139(1):186–94. doi: 10.1016/j.jid.2018.07.006
50. Soler-Cardona A, Forsthuber A, Lipp K, Ebersberger S, Heinz M, Schossleitner K, et al. CXCL5 Facilitates Melanoma Cell-Neutrophil Interaction and Lymph Node Metastasis. J Invest Dermatol (2018) 138(7):1627–35. doi: 10.1016/j.jid.2018.01.035
Keywords: melanoma, immune gene, tumor environment, prognostic, ssGSEA
Citation: Zhang J-A, Zhou X-Y, Huang D, Luan C, Gu H, Ju M and Chen K (2021) Development of an Immune-Related Gene Signature for Prognosis in Melanoma. Front. Oncol. 10:602555. doi: 10.3389/fonc.2020.602555
Received: 04 September 2020; Accepted: 14 December 2020;
Published: 21 January 2021.
Edited by:
Suzie Chen, The State University of New Jersey, United StatesReviewed by:
Gagan Chhabra, University of Wisconsin-Madison, United StatesLixin Wan, Moffitt Cancer Center, United States
Copyright © 2021 Zhang, Zhou, Huang, Luan, Gu, Ju and Chen. This is an open-access article distributed under the terms of the Creative Commons Attribution License (CC BY). The use, distribution or reproduction in other forums is permitted, provided the original author(s) and the copyright owner(s) are credited and that the original publication in this journal is cited, in accordance with accepted academic practice. No use, distribution or reproduction is permitted which does not comply with these terms.
*Correspondence: Mei Ju, anVtZWl3ZW5nQDE2My5jb20=; Kun Chen, a3VuY2hlbjE4MUBhbGl5dW4uY29t
†These authors have contributed equally to this work