 Nicolas Aide1,2†Nicolas Elie3†Cécile Blanc-Fournier4
 Christelle Levy5
 Thibault Salomon6
 Charline Lasnon2,7*
- 1Nuclear Medicine Department, University Hospital, Caen, France
- 2INSERM 1086 ANTICIPE, Normandy University, Caen, France
- 3Université de Caen Normandie, UNICAEN, SF 4206 ICORE, CMABIO3, Caen, France
- 4Pathology Department, François Baclesse Cancer Centre, Caen, France
- 5Breast Cancer Unit, François Baclesse Cancer Centre, Caen, France
- 6Nuclear Medicine Department, Hospital Centre, Versailles, France
- 7Nuclear Medicine Department, François Baclesse Cancer Centre, Caen, France
Introduction: We aimed to investigate whether 18F-FDG PET metabolic heterogeneity reflects the heterogeneity of estrogen receptor (ER) and progesterone receptor (PR) expressions within luminal non-metastatic breast tumors and if it could help in identifying patients with worst event-free survival (EFS).
Materials and methods: On 38 PET high-resolution breast bed positions, a single physician drew volumes of interest encompassing the breast tumors to extract SUVmax, histogram parameters and textural features. High-resolution immunochemistry (IHC) scans were analyzed to extract Haralick parameters and descriptors of the distribution shape. Correlation between IHC and PET parameters were explored using Spearman tests. Variables of interest to predict the EFS status at 8 years (EFS-8y) were sought by means of a random forest classification. EFS-8y analyses were then performed using univariable Kaplan-Meier analyses and Cox regression analysis. When appropriate, Mann-Whitney tests and Spearman correlations were used to explore the relationship between clinical data and tumoral PET heterogeneity variables.
Results: For ER expression, correlations were mainly observed with 18F-FDG histogram parameters, whereas for PR expression correlations were mainly observed with gray-level co-occurrence matrix (GLCM) parameters. The strongest correlations were observed between skewness_ER and uniformity_HISTO (ρ = −0.386, p = 0.017) and correlation_PR and entropy_GLCM (ρ = 0.540, p = 0.001), respectively. The median follow-up was 6.5 years and the 8y-EFS was 71.0%. Random forest classification found age, clinical stage, SUVmax, skewness_ER, kurtosis_ER, entropy_HISTO, and uniformity_HISTO to be variables of importance to predict the 8y-EFS. Univariable Kaplan-Meier survival analyses showed that skewness_ER was a predictor of 8y-EFS (66.7 ± 27.2 versus 19.1 ± 15.2, p = 0.018 with a cut-off value set to 0.163) whereas other IHC and PET parameters were not. On multivariable analysis including age, clinical stage and skewness_ER, none of the parameters were independent predictors. Indeed, skewness_ER was significantly higher in youngest patients (ρ = −0.351, p = 0.031) and in clinical stage III tumors (p = 0.023).
Conclusion: A heterogeneous distribution of ER within the tumor in IHC appeared as an EFS-8y prognosticator in luminal non-metastatic breast cancers. Interestingly, it appeared to be correlated with PET histogram parameters which could therefore become potential non-invasive prognosticator tools, provided these results are confirmed by further larger and prospective studies.
Introduction
Breast cancer is the most frequently diagnosed cancer in women (16% of all women’s cancers) in all world regions.1 Its incidence is rising as a result of longer life expectancy and changes in risk factors. Breast cancer treatment recommendations are based on histological subtype (ER-positive, HER-2 positive, or triple negative tumors), tumor grade, and stage of the disease. More recently, with the development of DNA microarray gene expression analysis, a molecular classification has been proposed and validated (1–3). However, its clinical use is limited, since these techniques are currently expensive as compared to conventional immunohistochemistry (IHC). An attempt to replicate molecular classification using conventional IHC characteristics of the tumor, including ER, PR, HER-2, and Ki67 showed low concordance with gene expressions profile (4, 5). When it comes to breast cancer staging, 2-deoxy-2[18F]-fluoro-D-glucose (18F-FDG) PET/CT is a well-established examination for the initial staging of locally advanced breast cancer (6–9), as it displays excellent capabilities for extra-axillary nodal and distance metastases detection. On the contrary, for the local evaluation of primary breast lesion, 18F-FDG PET/CT has so far been outperformed by echography and MRI mainly because of its lack of sensitivity (10, 11). However, with the newly growing development of metabolic heterogeneity features in nuclear medicine, the PET community is regaining interest in the value of 18F-FDG PET/CT for the non-invasive biological characterization of primary breast tumors. Until now, PET radiomics have always been confronted with the expression of ER, PR, HER2, and Ki67 (12–15) and PET radiomics certainly seem to represent more than just a binary expression of receptors. Meanwhile, improvement in high-resolution scanning of pathological sections and digital imaging analysis is leading to the rise of digital-IHC. Even though it demands further validation and standardization, this technique can provide computation of texture and distribution parameters for hormonal receptors intra-tumoral heterogeneity (16, 17).
The objective of the present study was therefore to investigate (i) if PET metabolic heterogeneity features reflect the heterogeneity of ER and PR expression within luminal breast tumors and (ii) if PET metabolic heterogeneity features could help in non-invasively identifying patients with the worst event-free survival (EFS).
Material and Methods
Study Population
This study is an ancillary study to a previous monocentric and prospective one conducted in our PET unit (18). From April 2009 to June 2012, that study included newly diagnosed and histologically proven breast cancer for which surgery was indicated in first place without neo-adjuvant chemotherapy. It was approved by the Ethics Committee (CPP Nord Ouest III, reference 2009-10) and all patients gave informed and signed consent.
PET/CT Acquisitions
All 18F-FDG PET/CT acquisitions were performed on a Biograph TrueV (Siemens Healthineers) before any treatment. Patients were fasted during at least 6 h. A high-resolution (HR) breast-dedicated bed position (6 min per bed position) was acquired 75 min after the radiopharmaceutical injection. Data were reconstructed using an algorithm with point spread function (PSF) modeling (HD; TrueX, Siemens Healthineers, 3 iterations, and 21 subsets) with no post-filtering and a 5122 matrix size leading to voxels of 1.3 × 1.3 × 1.9 mm (19).
PET-CT Analysis
Injected dose, time between injection and acquisition and capillary glycaemia were recorded to seek EANM recommendations fulfilment (20). A single observer delineated volumes of interest (VOIs) that encompassed the entire breast tumor by using a gradient-based method implemented in MIM software (MIM software, version 5.6.5). When multiple lesions were depicted, only the biggest lesion was considered. VOIs were then saved as DICOM RT structures and loaded in LifeX v5.10 software (21) (www.lifexsoft.org) to extract SUVmax, histogram parameters and the following TFs:
- Inverse difference, angular second moment, variance, correlation, entropy, dissimilarity from gray-level co-occurrence matrix (GLCM) that considers the arrangements of pairs of voxels
- coarseness, contrast and busyness from neighborhood gray-level different matrix (NGLDM) that corresponds to the difference of gray-level between one voxel and its 26 neighbors in 3 dimensions.
All textural features fulfilled the benchmark of the image biomarkers standardization initiative (22). Absolute resampling using 64 bins between 0 and 32 (corresponding to the maximum SUV units recorded within PET data) was used for all TFs leading to a size of bin 0.5 (23, 24).
Immunochemistry
Automated immunohistochemistry using a Ventana Bench Mark Ultra was performed on 4-μm-thick paraffin sections of tumor resection with clone SP1 Ventana for ER (pre-diluted) and clone 1E2 Ventana for PR (pre-diluted). The slides were controlled by an experienced pathologist.
Digital-Immunochemistry Computation
The ScanScope CS microscope slide scanner (Leica Biosystems) was used to digitize whole slide images of histological sections at 20 × (0.5 µm/pixel) and record them as tiled tiff images.
For each image, regions of interest (ROIs) were drawn using the ImageScope software (Leica Biosystems) in order to select only tumor tissues and remove the artifacts. The images were processed as reported in the previous study (25). Briefly, squares of 2000 pixels size corresponding to 1 mm2 area were used in this study. The squares were generated to fit the area of the ROI. A ratio between the stained area (brown color) and the surface of tissue was computed and assigned to each square based on their coordinates. Local ratio computed for each square was ranked according to the following ten intervals: level 0 (0–10%), level 1 (>10–20%), level 2 (>20–30%), level 3 (>30–40%), level 4 (>40–50%), level 5 (>50–60%), level 6 (>60–70%), level 7 (>70–80%), level 8 (>80–90%), and level 9 (>90–100%). The ranks then formed the basis for the co-occurrence matrix used to compute Haralick texture parameters. The classical Haralick parameters (26) were computed from the normalized co-occurrence matrix: contrast, homogeneity, dissimilarity, entropy, energy, and correlation. The descriptors of the distribution shape were also computed: skewness and kurtosis.
Statistical Analysis
Quantitative data are presented as mean (standard deviation). Correlation between immunochemistry parameters and PET parameters were explored using Spearman correlation tests and matrixes. Variables of interest to predict the occurrence of an event at 8 years (EFS-8y) were sought by means of a random forest classification incorporating the following variables: age, histology, clinical stage, Elston and Ellis grade, molecular subtype classification (27), all immunochemistry parameters and all PET parameters. This analysis implemented classification and regression trees (CART, n = 100) as well as the bootstrapping aggregating (bagging) method previously proposed by Breiman (28–30). For the validation, i.e. the training accuracy, the internal check in RF itself was used, based on the prediction error using the Out-Of-Bag (OOB) estimates of classification error: the smaller the OOB error rate, the better the model is able to classify patients according to their EFS at 8 years (8y-EFS 0 and 8y-EFS 1). The importance of variables in classification was assessed by measuring the mean decrease accuracy (31) of class prediction. Variables of importance were compared between 8y-EFS 0 and 8y-EFS 1 groups using non-parametric Mann-Whitney tests. Receiving operating characteristics (ROC) analyses for 8y-EFS were then undertaken on variables identified as significantly different between groups to define optimal cut-off values based on the Youden index. Eight-year EFS analyses were finally performed using univariable Kaplan-Meier analyses, log-rank tests for comparison of survival curves and finally multivariable Cox regression analysis. The end-point used for survival analysis was the time from diagnosis until relapse or progression, unplanned retreatment, or death as a result of breast cancer. When appropriate, non-parametric Mann-Whitney tests and Spearman correlation tests were used to explore the relationship between clinical data and tumoral heterogeneity variables. Graph and statistical analysis were performed on XLSTAT Software (XLSTAT: Data Analysis and Statistical Solutions for Microsoft Excel. Addinsoft (2017)). For all statistical tests, we retained a two-tailed p value of less than 0.05 as statistically significant. Statistical process is summarized in Figure 1.
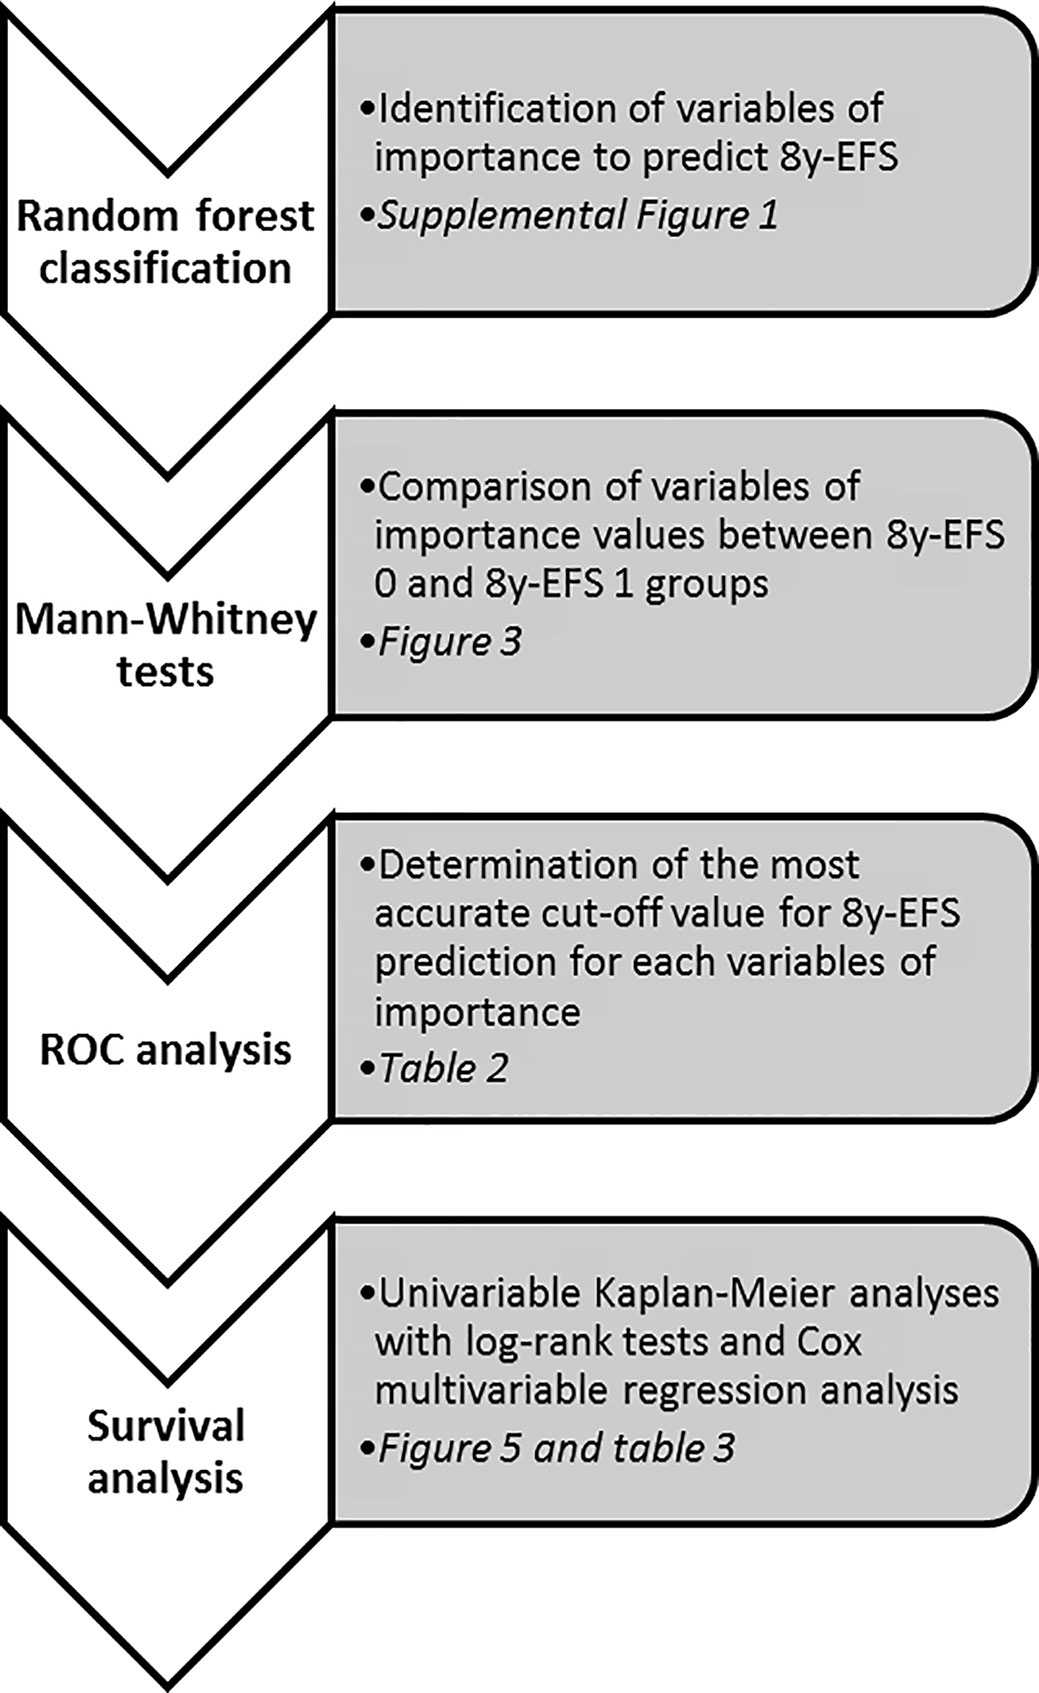
Figure 1 Statistical process summary.
Results
Patients and PET Characteristics
Sixty-three patients were referred for the staging of breast carcinoma from April 2009 to June 2012. Twenty-five patients were excluded from the analysis, leading to a final database of 38 patients. The causes of exclusion were as follows: PET-CT not performed prior to surgery (n = 8), metastatic tumors on initial staging (n = 4), missing data (n = 1), breast lesions not 18F-FDG avid (n = 3), hormonal receptors (ER and PR) negative tumors (n = 7), IHC slide unusable (n = 1), and volume of interest too small to be analyzed with LifeX software (n = 1). Patient characteristics are displayed in Table 1. Thirty-four tumors were ER+/PR+ and 4 tumors were ER+/PR−. All patients underwent an adjuvant treatment: radiotherapy and hormonotherapy in 10 patients (26.3%) or chemotherapy, radiotherapy and hormonotherapy +/− trastuzumab in case of HER2+ tumors in 28 patients (73.7%). Mean injected dose and uptake time was 4.10 (0.56) MBq/kg and 81.6 (8.4) min, respectively.
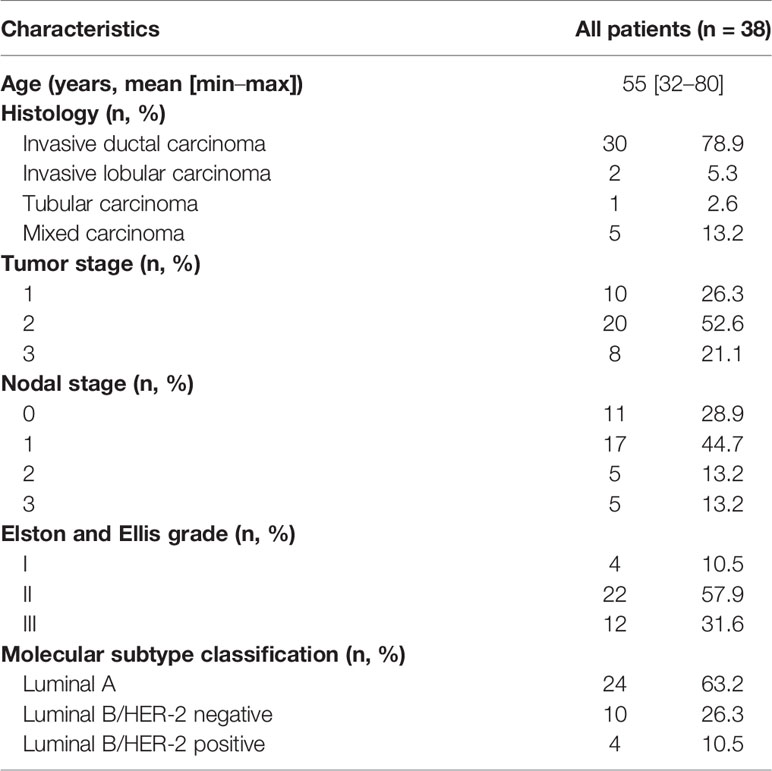
Table 1 Patients characteristics.
Correlations Among Descriptors of the Distribution Shape and Haralick Texture Parameters of Estrogen and Progesterone Receptors Expression
Apart from skewness_ER that fairly correlated with both skewness_PR and kurtosis_PR with Spearman coefficients equal to 0.396 and 0.361 (p = 0.015 and p = 0.026), respectively, none of the ER and PR distribution descriptors or Haralick texture parameters were correlated to each other (Figure 2A).
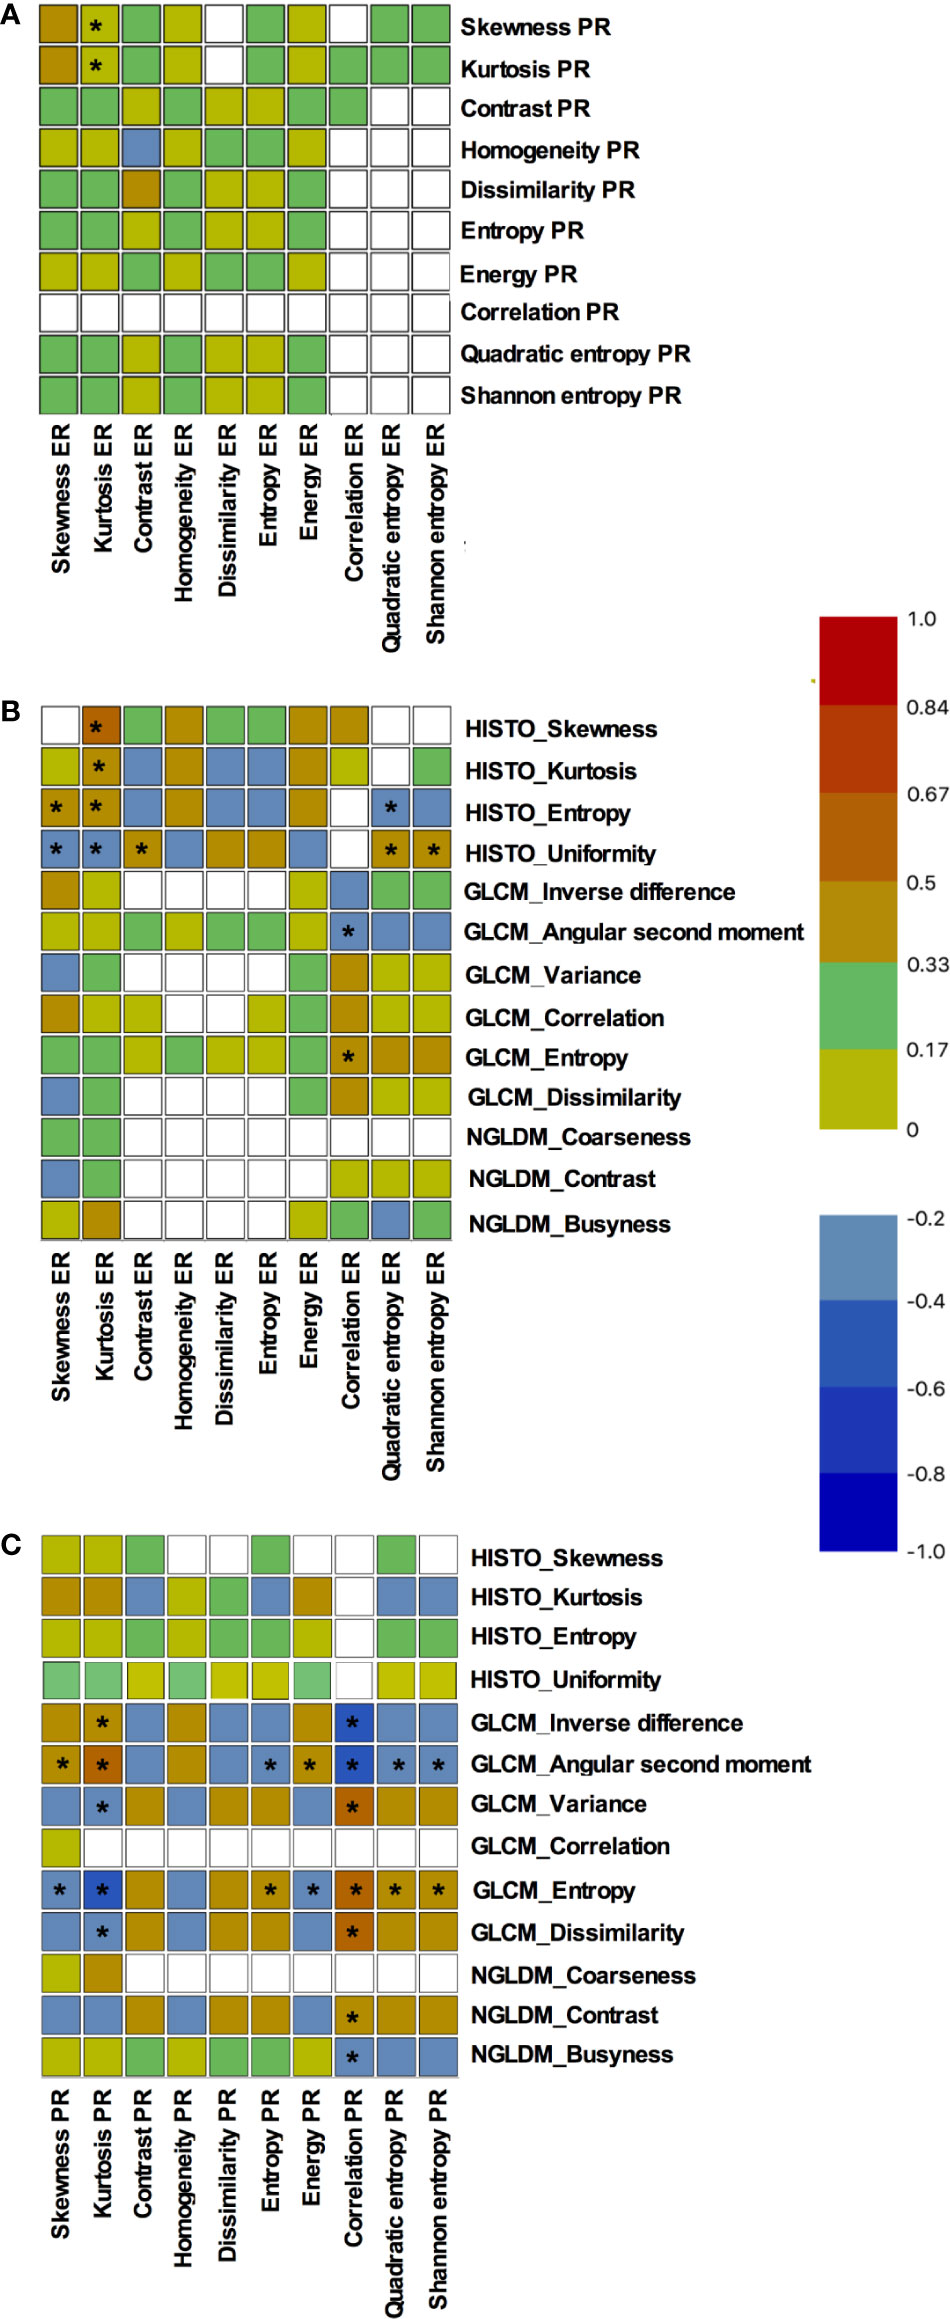
Figure 2 Correlations among distribution descriptors and Haralick texture parameters of estrogen and progesterone receptors expression. Results are presented as Spearman correlations maps: (A) correlations between estrogen and progesterone receptors expression parameters, (B) correlations between 18F-FDG textural parameters and estrogen receptors expression parameters, (C) correlations between 18F-FDG textural parameters and progesterone receptors expression parameters. The blue color corresponds to a correlation close to −1 and the red color corresponds to a correlation close to 1. The green corresponds to a correlation close to 0. * represents significant correlations (p < 0.05).
Relation Between 18F-FDG Textural Parameters and Intra-Tumoral Estrogen Receptors Expression
Relationship between variables can be seen in Figure 2B. Correlations were mainly observed with 18F-FDG histogram parameters. Indeed, all PET histogram parameters were fairly correlated to kurtosis_ER with Spearman coefficients ranging from −0.338 to 0.410. Moreover, uniformity_HISTO was significantly but fairly correlated to skewness_ER, contrast_ER, quadratic entropy_ER and shannon entropy_ER (ρ = −0.386, p = 0.017; ρ = 0.329, p = 0.044; ρ = 0.361, p = 0.027, and ρ = 0.333, p = 0.042, respectively). Finally, entropy_HISTO was also fairly correlated to skewness_ER and quadratic entropy_ER (ρ = 0.369, p = 0.023; ρ = −0.344, p = 0.035, respectively).
When considering GLCM PET parameters, we observed correlations only between correlation_ER and both angular second moment_GCLM and entropy_GLCM. Overall the PET parameter displaying the more numerous statistically significant correlations (n = 5) with intra-tumoral estrogen receptors expression was uniformity_HISTO with the strongest correlation being observed with skewness_ER: ρ = −0.386, p = 0.017.
Relation Between 18F-FDG Textural Parameters and Intra-Tumoral Progesterone Receptors Expression
Relationship between variables can be seen in Figure 2C. None of histogram PET parameters were correlated to intra-tumoral progesterone receptors expression parameters. Correlation_PR was the parameter displaying the maximal rate of statistically significant correlations with PET parameters (n = 7). It was fairly correlated to inverse difference_GLCM, angular second moment_GLCM, variance_GLCM, entropy_GLCM, dissimilarity_GLCM, contrast_NGLDM and busyness_NGLDM (ρ = −0.449, p = 0.005; ρ = −0.525, p = 0.001; ρ = 0.469, p = 0.003; ρ = 0.540, p = 0.001; ρ = 0.456, p = 0.004; ρ = 0.398, p = 0.014; ρ = −0.322, p = 0.049).
Angular second moment_GLCM and entropy_GLCM were the PET parameters displaying the more numerous statistically significant correlations with intra-tumoral progesterone receptors expression. They both correlated to all IHC parameters, with the exception of contrast_PR, homogeneity_PR, and dissimilarity_PR. The strongest correlation was observed between entropy_GLCM and correlation_PR: ρ = 0.540, p = 0.001.
Survival Data Analysis
The statistical process for this specific part is summarized in Figure 1. The median follow-up was 6.5 years (range: 2.5–9.1 years) and with 11 recorded events, the 8y-EFS was 71.0% in the entire population. Among the 11 recorded events, 8 were metastatic recurrences, 2 were contralateral recurrences, and 1 was a local recurrence. The median time to recurrence from the date of diagnosis was 78 months ranging from 21 to 96 months. Of note, 4 deaths were recorded over the 8-year follow-up. Random forest classification found age, clinical stage, SUVmax, skewness_ER, kurtosis_ER, entropy_HISTO, and uniformity_HISTO to be variables of importance to predict the 8y-EFS (Supplemental Figure 1). The OOB estimate was equal to 28.9%. Mean skewness_ER and mean entropy_HISTO were significantly higher (p = 0.001 and p = 0.022, respectively), whereas mean uniformity_HISTO was significantly lower (p = 0.022) in 8y-EFS_1 patients (Figure 3). There were no significant difference in SUVmax and kurtosis_ER values between 8y-EFS_0 and 8y-EFS_1 patients (p = 0.760 and p = 0.052, respectively). Representative images of PET and digital-immunochemistry images are displayed in Figure 4. On ROC analyses, optimal cut-off values for skewness_ER, entropy_HISTO and uniformity_HISTO to predict 8y-EFS were equal to 0.163, 1.23, and 0.066, respectively (Table 2). Univariable Kaplan-Meier survival analyses found that skewness_ER was a predictor of 8y-EFS whereas entropy_HISTO and uniformity_HISTO were not, although statistical significance was almost reached (Figure 5). On multivariable analysis including skewness_ER and other well-known prognosticators [age, clinical stage (I–II versus III)], all the statistics for the test of the null hypothesis are significant and we can conclude that considering explanatory variables provides significant additional information. There was no violation of the proportional hazards assumption. However, regression coefficients showed that none of the parameters were independent predictors of 8y-EFS (Table 3). Indeed, we found a significant negative correlation between skewness_ER and age (ρ = −0.351, p = 0.031) with skewness_ER values higher in youngest patients (Figure 6A). Moreover, skewness_ER was significantly higher in clinical stage III tumors (p = 0.023, Figure 6B). Of note, ER expression was scored + in 2 patients (5.3%), ++ in 6 patients (15.8%), and +++ in 30 patients (78.9%) by IHC analysis. Skewness_ER was not significantly different between patients scored +, ++, or +++ (p = 0.508, Supplemental Figure 2). A quantification of ER expression in percentage was also available for 35 patients with a mean value equal to 88.5% (± 15.5). It was not significantly correlated with skewness_ER (p = 0.207, ρ = 0.048).
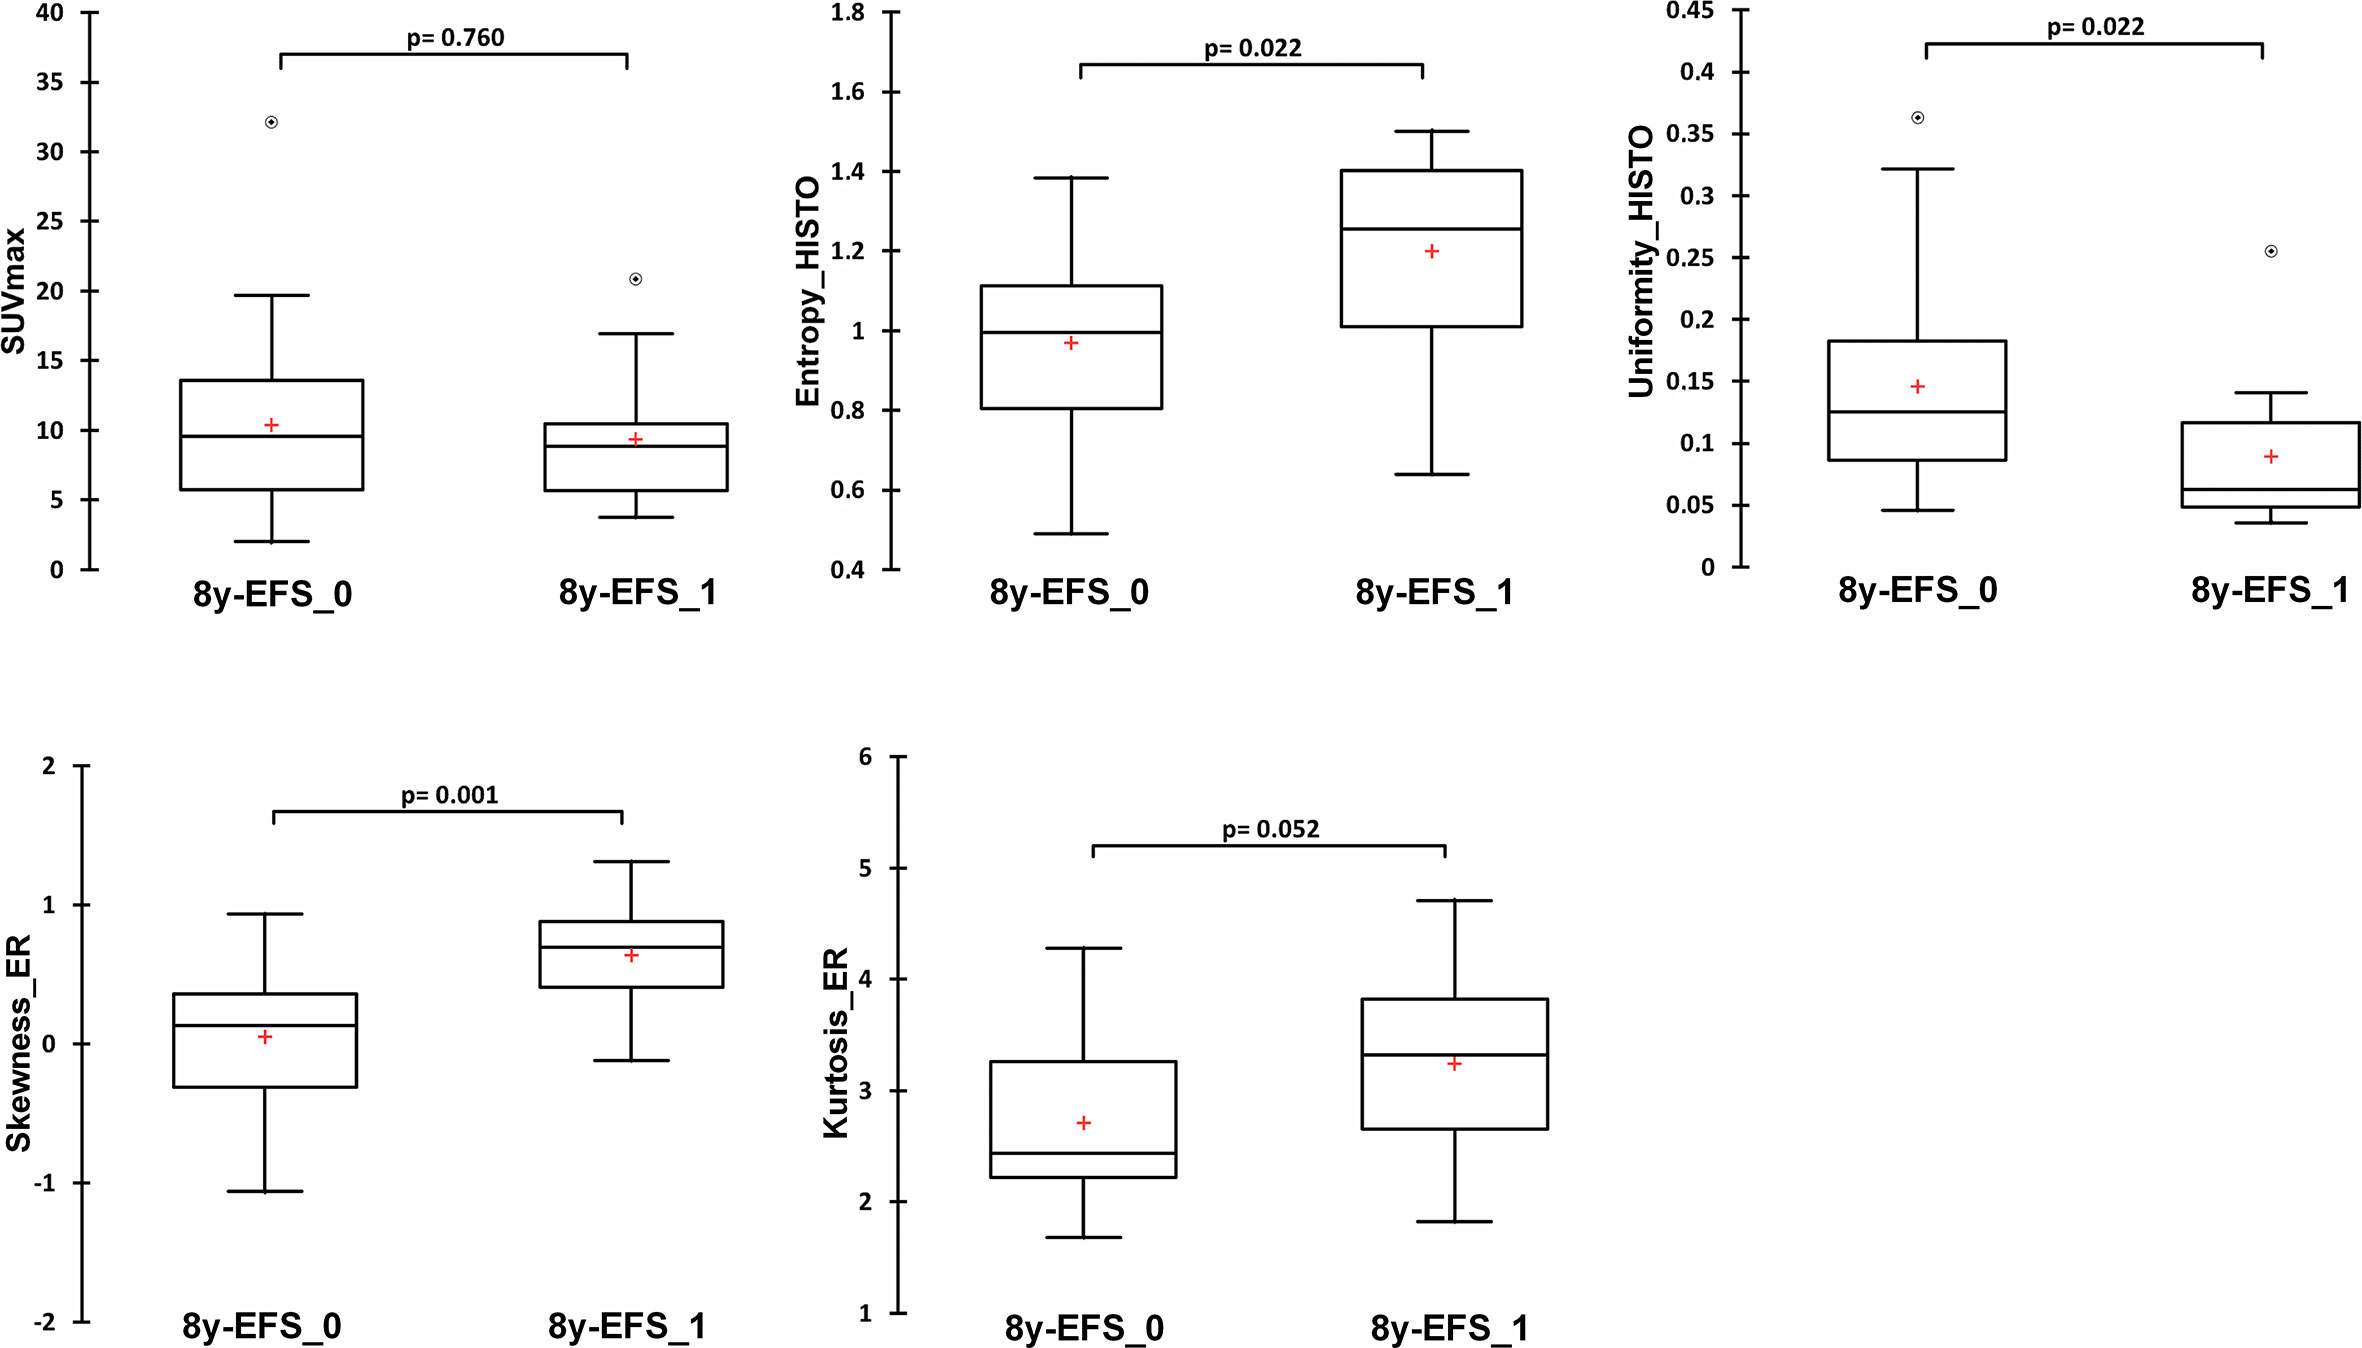
Figure 3 Comparison of immunochemistry and PET variables of importance identified by random forest analysis between 8y-EFS_0 and 8y-EFS_1 patients (SUVmax, entropy_HISTO, uniformity_HISTO, skewness_ER, and kurtosis_ER). Data are shown as Tukey boxplots with (○) representing outliers.
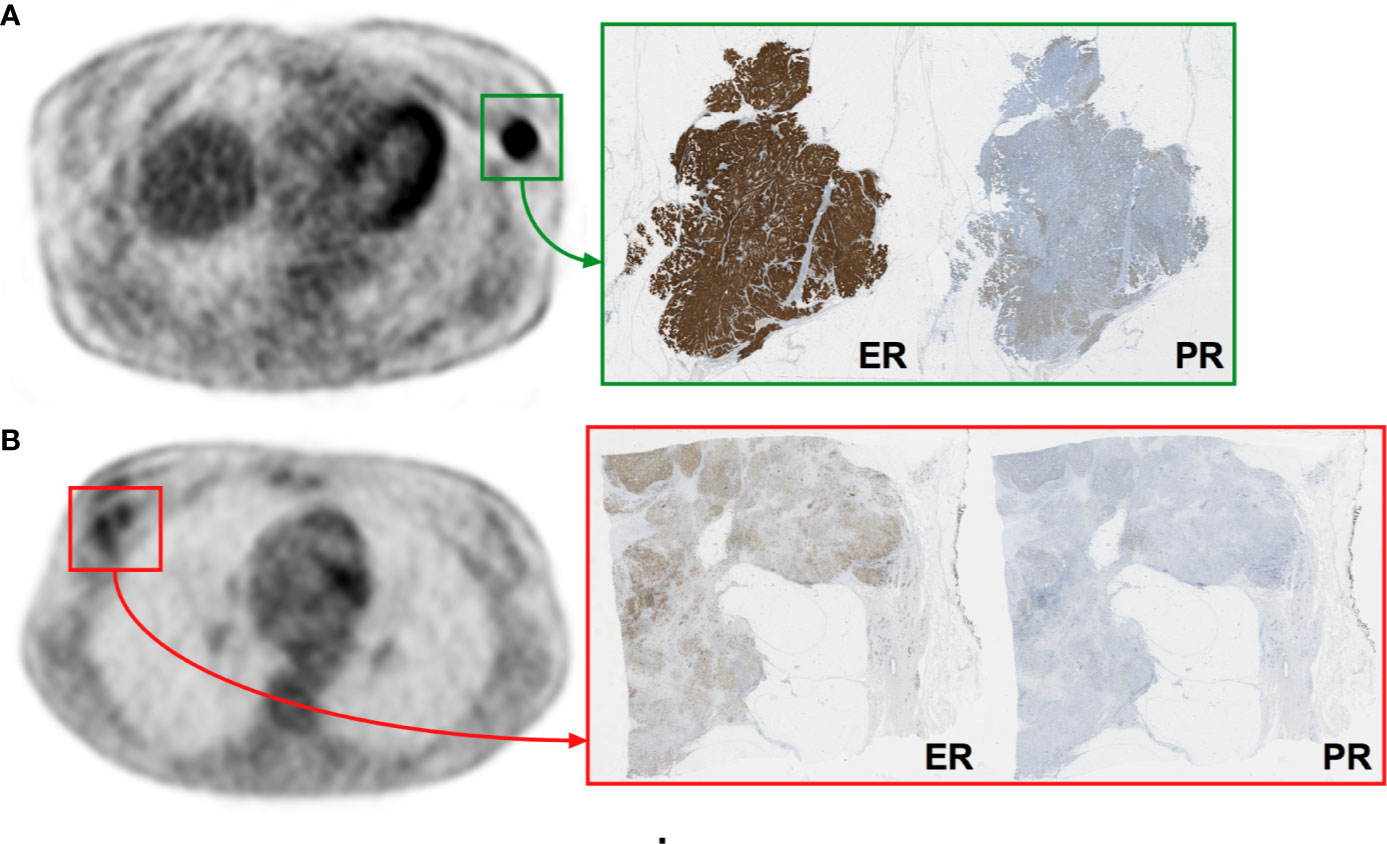
Figure 4 Representative images of PET and digital-immunochemistry images. Patient (A) was a 74-year-old women with a luminal ER+/PR+ tumor staged II presenting homogeneous IHC and PET characteristics (skewness_ER = −1.06, entropy_HISTO = 0.66, uniformity_HISTO = 0.24) who experienced no event at 8 years (8y-EFS_0). Patient (B) was a 34-year-old women with a luminal ER+/PR+ tumor staged III presenting heterogeneous IHC and PET characteristics (skewness_ER = 1.31, entropy_HISTO = 1.50, uniformity_HISTO = 0.04) who experienced an event at 8 years (8y-EFS_1).
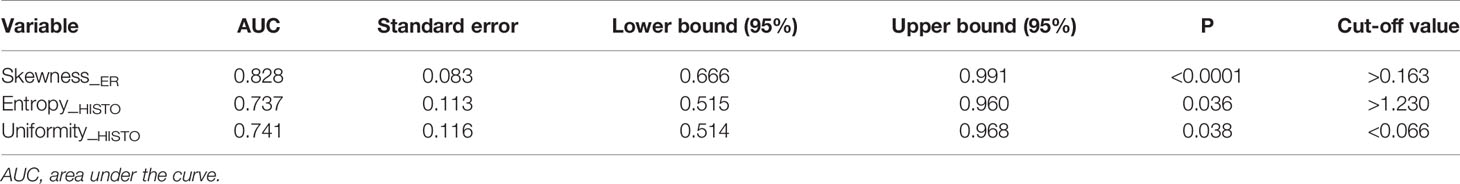
Table 2 ROC analyses for 8-year event free survival for skewness_ER, entropy_HISTO, and uniformity_HISTO.
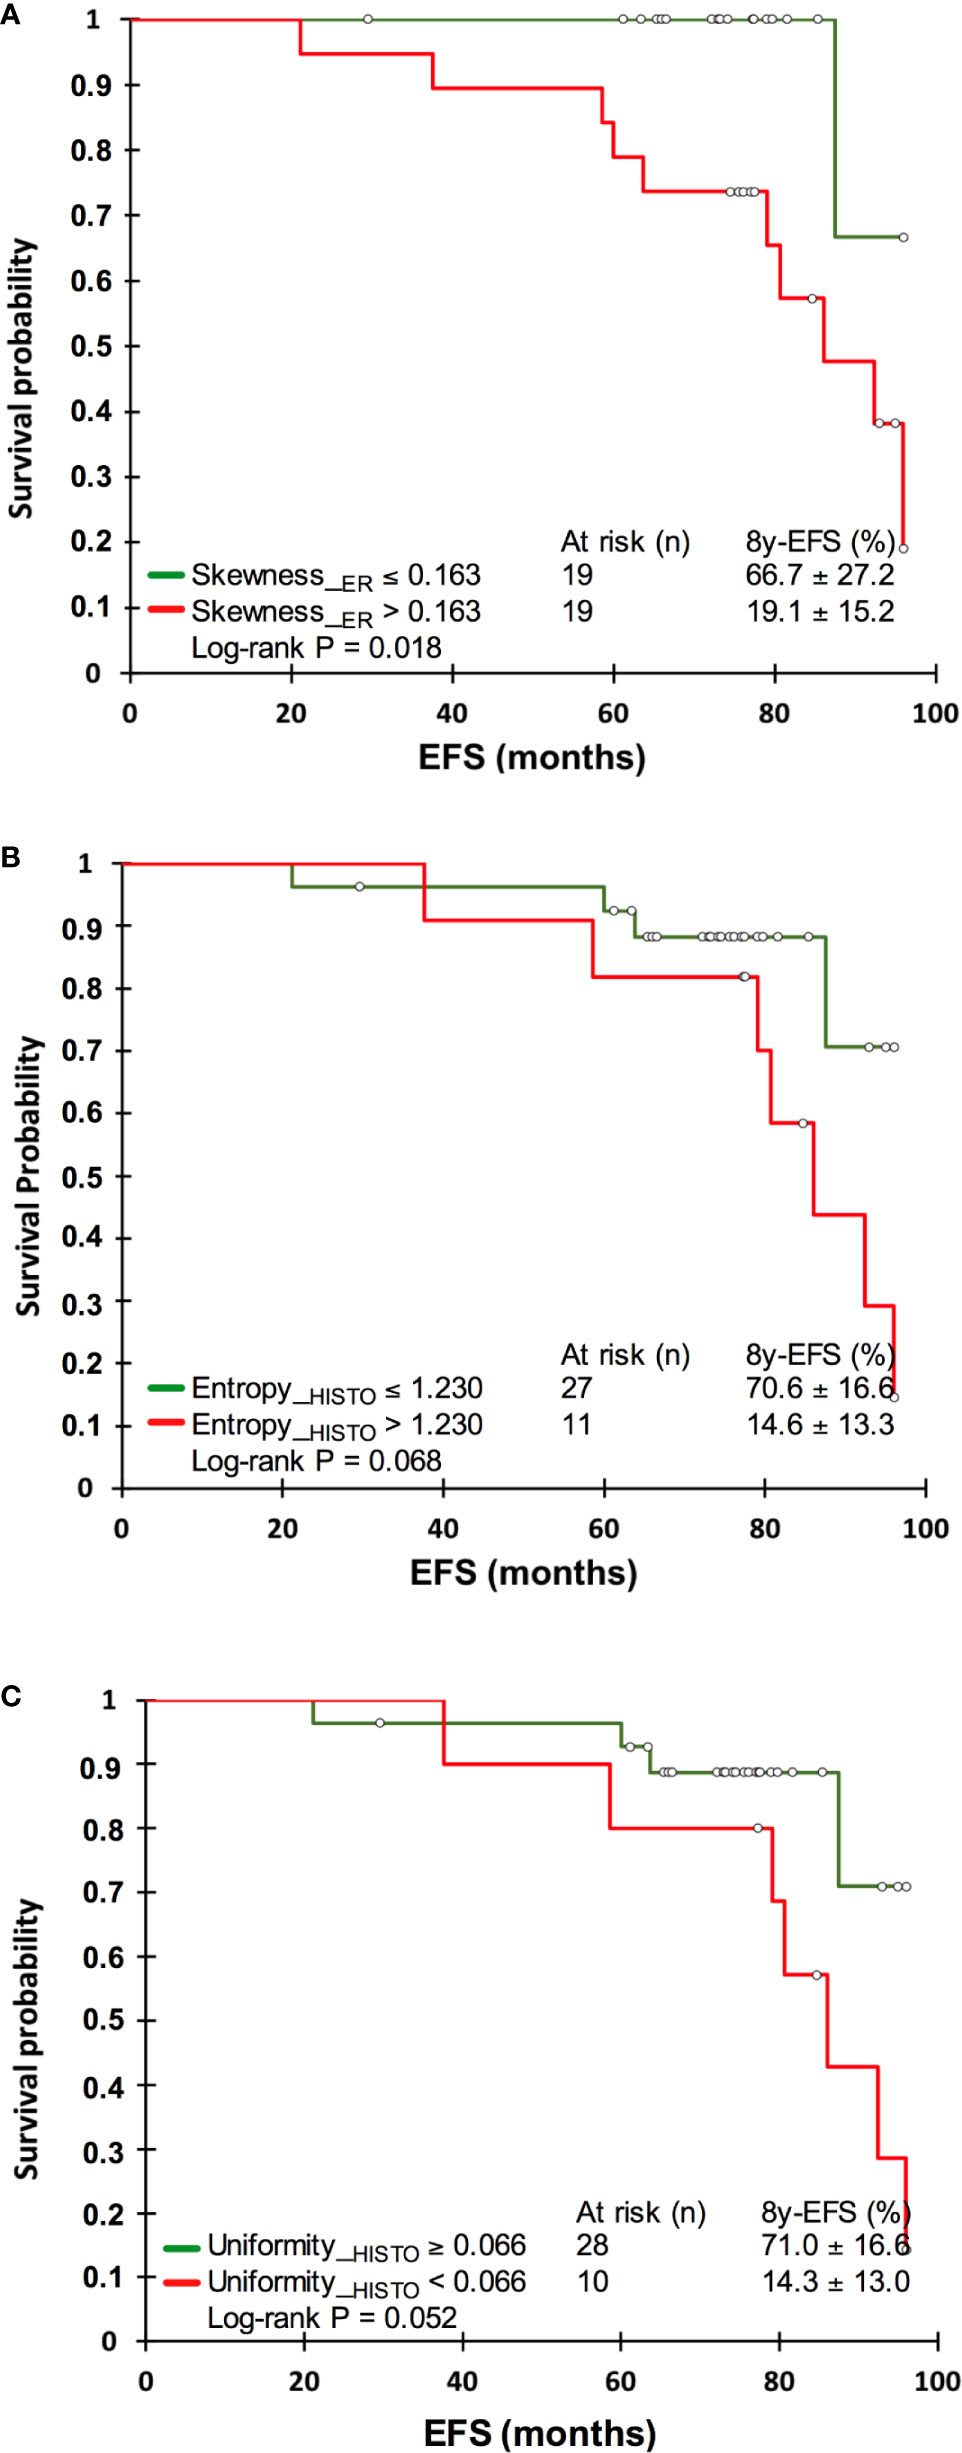
Figure 5 Kaplan-Meyer analyses for skewness_ER (A), entropy_HISTO (B), and uniformity_HISTO (C).
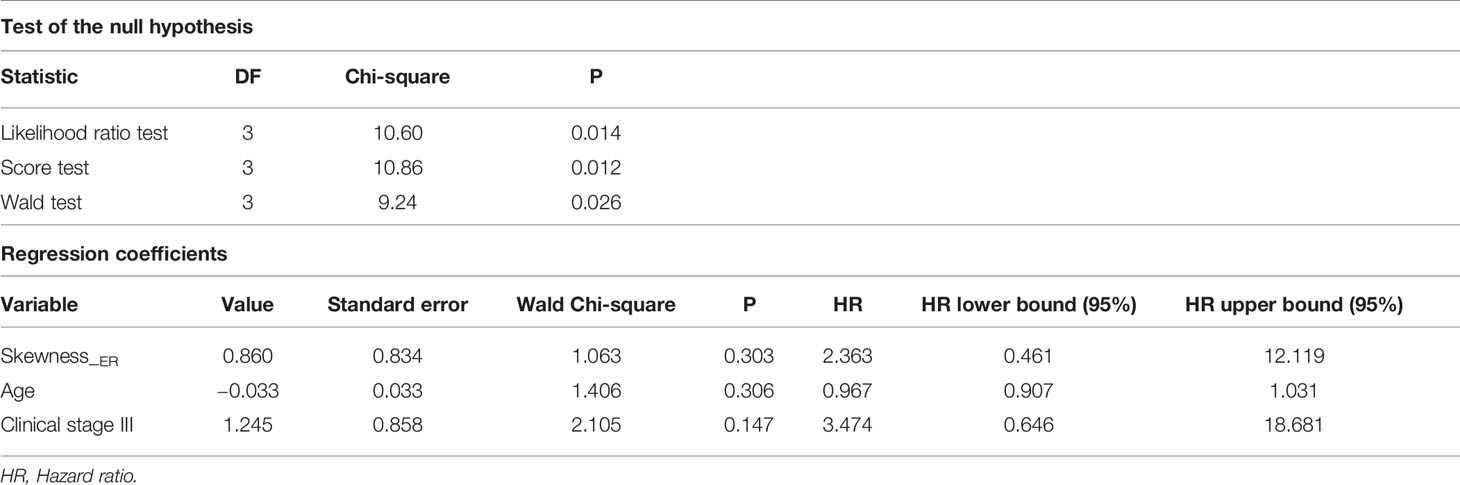
Table 3 Cox regression analysis.
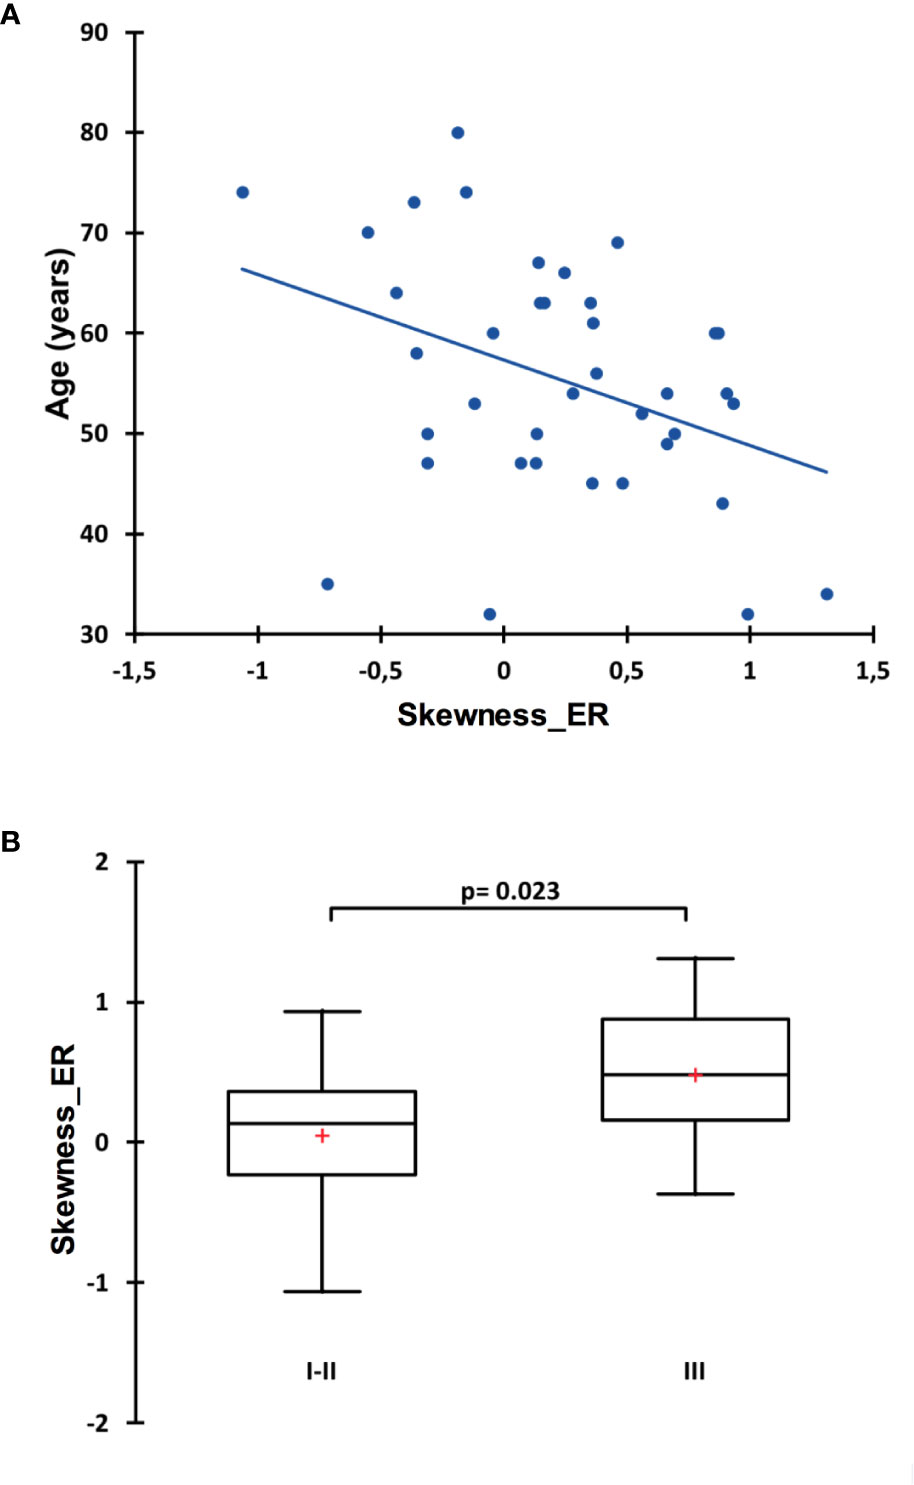
Figure 6 Spearman correlation between skewness_ER and the age at diagnosis (A) and comparison of skewness_ER between clinical staged I–II versus staged III patients. Data is shown as Tukey boxplots (B).
Discussion
The first and interesting finding of the present study is the quasi-absence of correlation between ER and PR descriptors of the distribution shape and Haralick texture parameters. This seems to indicate that their heterogeneity expressions are independent and could have different meanings and clinical consequences. Here, we decided to focus on EFS and it appeared that immunochemistry histogram parameters of estrogen receptors, and especially skewness, are predictors of 8y-EFS together with age and clinical stage, whereas none of the progesterone receptors were. Moreover, correlations of ER and PR parameters with PET histogram and textural parameters were clearly different. The ER immunochemistry heterogeneity was mainly correlated to PET histogram parameters, whereas PR immunochemistry heterogeneity was mainly correlated to second-order GLCM-derived PET textural features. Interestingly, skewness_ER was a significant predictor of 8y-EFS but not an independent one. Indeed, it was related to both the age of the patient at diagnosis and the clinical stage of the disease: estrogen receptors heterogeneity was higher in youngest patients and in higher-staged diseases. We can hypothesize that ER heterogeneity could be linked to more aggressive tumors. Returning to the PET methodology, the use of a HR PET acquisition to compute 18F-FDG heterogeneity parameters (PSF algorithm and 1.3 × 1.3 × 1.9 mm voxels) is a strength. Indeed, it has been previously shown that the type of reconstruction as well as the voxel size, are important considerations when computing 18F-FDG heterogeneity (19) especially in small lesions like those bearing breast cancer. However, even though high-resoluted histograms of PET parameters were significantly but fairly correlated to ER immunochemistry ones (especially skewness_ER, kurtosis_ER, entropy_HISTO and uniformity_HISTO), PET parameters appeared to be less discriminant for 8y-EFS than immunochemistry ones. Nevertheless, we can notice that log-rank tests for entropy_HISTO and uniformity_HISTO almost reached statistical significance and that a larger study could have displayed more discriminant results.
Previously in the study of Antunovic et al. (13), using PET metabolic heterogeneity features, two clusters were obtained by the unsupervised hierarchical clustering analyses with different imaging signatures. Besides, these signatures were significantly associated with different molecular subtypes. Ha et al. (14) also performed an unsupervised tumor clustering using a radiomics pattern which resulted in 3 tumor clusters. The expression of histopathological factors between their clusters was different for Ki67. Of note, one cluster displayed higher estrogen and progesterone receptors (ER and PR) expression, but statistical significance was not reached. Lemarignier et al. (15) found a trend for lower local heterogeneity in hormone-positive breast cancer even though statistical significance was no longer observed after correction for multiple testing. Thus, all these results together with ours are first-evidences of a complementary role of imaging features, together with standard PET metrics for a clinically relevant in vivo characterization of breast cancer that could lead to a personalization of therapeutic management. The perspectives would be (i) to assess the clinical impact of these results, in particular by offering patients deemed to be at risk of recurrence a closer post-therapeutic monitoring and (ii) to test other innovative tracers such as 18F-Fluoroestradiol. Data from a meta-analysis evaluating the ability of 18F-Fluoroestradiol for the determination of tumor ER status (32) suggested acceptable diagnostic performance of this radiopharmaceutical despite a weakness in terms of sensitivity [pooled sensitivity = 82% (95% CI: 74–88%), pooled specificity = 95% (95% CI: 86–99%)]. However, to date, there is no data clearly documenting the clinical consequences of patient management following diagnosis with 18F-Fluoroestradiol PET. Documenting the intra-tumoral heterogeneity of estrogen receptors using this tracer has not yet been investigated and could be of interest.
It is worth noticing that our findings, even if innovative, were observed in a small cohort and have to be validated by a larger clinical study. The lack of statistical significance might also be due to the limited spatial resolution of an analogic system and it could be wise to test innovative digital systems in future projects. Of note, PET third-order textural features were not considered in the present study because their computation was very far from that used for immunochemistry parameters. Indeed, immunochemistry parameters could only use histograms or co-occurrence matrixes. Also, inter-observer variability for the quantification of metabolic heterogeneity was not presently assessed. However, we have taken care to choose one of the most reproducible delineation methods, namely, a gradient-based method (33), thus limiting the variability linked to the operator. However, other sources of variability must be taken into account regarding the clinical export of such results: software, PET systems, reconstructions, etc. Therefore, we acknowledge that harmonization strategies will be necessary anyway. Finally concerning immunochemistry methodology, the age of the samples jeopardized the achievement of Ki67 expression heterogeneity exploration because of faint immunostaining, not enabling the digital-immunochemistry computation. For HER2 status, international standards require that it be tested at the time of diagnosis, therefore on biopsies. The recommendations say that it is not necessary to repeat it systematically on the piece of excision, because there is a good agreement between the HER2 status tested on the biopsy and remade on the piece, due to a usually homogeneous distribution when expressed (34–36).
To conclude, a heterogeneous distribution of estrogen receptors within the tumor in immunochemistry appeared as an event-free prognosticator in luminal non-metastatic breast cancers. Furthermore, estrogen receptors heterogeneity is higher in youngest patients and the highest-graded tumors. Interestingly, this appeared to be correlated with PET histogram parameters which could therefore become potential tools to reflect the tumor estrogen receptors heterogeneity, provided these results are confirmed by further larger and prospective studies.
Data Availability Statement
The raw data supporting the conclusions of this article will be made available by the authors, upon reasonable request.
Ethics Statement
The studies involving human participants were reviewed and approved by CPP Nord Ouest III, reference 2009-10. The patients/participants provided their written informed consent to participate in this study.
Author Contributions
Study conception and design: NA and CLa. Screening and inclusion of patients: CLe. Data collection: TS and CLa. PET/CT analysis: TS. Immunochemistry: CB-F. Digital-immunochemistry computation: NE. Statistical analysis: CLa. Manuscript editing and reviewing: CLa, CB-F, NE, NA, and CLe. All authors contributed to the article and approved the submitted version.
Funding
This project was funded by an internal call for tenders from the Center François Baclesse.
Conflict of Interest
The authors declare that the research was conducted in the absence of any commercial or financial relationships that could be construed as a potential conflict of interest.
Acknowledgments
Helen Lapasset is thanked for English editing.
Supplementary Material
The Supplementary Material for this article can be found online at: https://www.frontiersin.org/articles/10.3389/fonc.2020.599050/full#supplementary-material
Supplementary Figure 1 | Random forest variables of importance analysis displayed as mean decrease accuracy.
Supplementary Figure 2 | Comparison of skewness_ER by estrogen receptor expression score (+, ++ or +++). Data is shown as Tukey boxplots.
Abbreviations
PET, Positron Emission Tomography; ER, Estrogen Receptor; PR, Progesterone Receptor; SUV, Standardized Uptake Value; IHC, Immunohistochemistry; EFS, Event Free Survival; RF, Random Forest Classification; GLCM, Gray-Level Co-occurrence Matrix; 18F-FDG, 18Fluorodeoxyglucose; HER-2, Human Epidermal Growth Factor Receptor-2; HR, High Resolution; VOI, Volume of Interest; NGLDM, Neighborhood Gray-Level Different Matrix; TF, Textural Feature; ROI, Region Of Interest; SD, Standard Deviation; CART, Classification And Regression Trees; OOB, Out-Of-Bag; ROC, Receiver Operating characteristic Curve; CT, Computed Tomography.
Footnotes
References
1. Weigelt B, Baehner FL, Reis-Filho JS. The contribution of gene expression profiling to breast cancer classification, prognostication and prediction: a retrospective of the last decade. J Pathol (2010) 220(2):263–80. doi: 10.1002/path.2648
2. Sorlie T, Perou CM, Tibshirani R, Aas T, Geisler S, Johnsen H, et al. Gene expression patterns of breast carcinomas distinguish tumor subclasses with clinical implications. Proc Natl Acad Sci USA (2001) 98(19):10869–74. doi: 10.1073/pnas.191367098
3. Prat A, Pineda E, Adamo B, Galvan P, Fernandez A, Gaba L, et al. Clinical implications of the intrinsic molecular subtypes of breast cancer. Breast (Edinburgh Scotland) (2015) 24(Suppl 2):S26–35. doi: 10.1016/j.breast.2015.07.008
4. Provenzano E, Ulaner GA, Chin SF. Molecular Classification of Breast Cancer. PET Clin (2018) 13(3):325–38. doi: 10.1016/j.cpet.2018.02.004
5. Prat A, Perou CM. Deconstructing the molecular portraits of breast cancer. Mol Oncol (2011) 5(1):5–23. doi: 10.1016/j.molonc.2010.11.003
6. Groheux D, Martineau A, Teixeira L, Espie M, de Cremoux P, Bertheau P, et al. (18)FDG-PET/CT for predicting the outcome in ER+/HER2- breast cancer patients: comparison of clinicopathological parameters and PET image-derived indices including tumor texture analysis. Breast Cancer Res BCR (2017) 19(1):3. doi: 10.1186/s13058-016-0793-2
7. Groheux D, Hindie E. Breast Cancer Staging: To Which Women Should 18F-FDG PET/CT Be Offered? J Nucl Med (2015) 56(8):1293. doi: 10.2967/jnumed.115.160945
8. Groheux D, Cochet A, Humbert O, Alberini JL, Hindie E, Mankoff D. (1)(8)F-FDG PET/CT for Staging and Restaging of Breast Cancer. J Nucl Med (2016) 57(Suppl 1):17s–26s. doi: 10.2967/jnumed.115.157859
9. Groheux D. FDG-PET/CT for systemic staging of patients with newly diagnosed breast cancer. Eur J Nucl Med Mol Imaging (2017) 44(9):1417–9. doi: 10.1007/s00259-017-3731-3
10. Rosen EL, Eubank WB, Mankoff DA, FDG PET. PET/CT, and breast cancer imaging. Radiographics (2007) 27(Suppl 1):S215–29. doi: 10.1148/rg.27si075517
11. Avril N, Rose CA, Schelling M, Dose J, Kuhn W, Bense S, et al. Breast imaging with positron emission tomography and fluorine-18 fluorodeoxyglucose: use and limitations. J Clin Oncol (2000) 18(20):3495–502. doi: 10.1200/JCO.2000.18.20.3495
12. Acar E, Turgut B, Yigit S, Kaya G. Comparison of the volumetric and radiomics findings of 18F-FDG PET/CT images with immunohistochemical prognostic factors in local/locally advanced breast cancer. Nuclear Med Commun (2019) 40(7):764–72. doi: 10.1097/MNM.0000000000001019
13. Antunovic L, Gallivanone F, Sollini M, Sagona A, Invento A, Manfrinato G, et al. [(18)F]FDG PET/CT features for the molecular characterization of primary breast tumors. Eur J Nucl Med Mol Imaging (2017) 44(12):1945–54. doi: 10.1007/s00259-017-3770-9
14. Ha S, Park S, Bang JI, Kim EK, Lee HY. Metabolic Radiomics for Pretreatment (18)F-FDG PET/CT to Characterize Locally Advanced Breast Cancer: Histopathologic Characteristics, Response to Neoadjuvant Chemotherapy, and Prognosis. Sci Rep (2017) 7(1):1556. doi: 10.1038/s41598-017-01524-7
15. Lemarignier C, Martineau A, Teixeira L, Vercellino L, Espie M, Merlet P, et al. Correlation between tumour characteristics, SUV measurements, metabolic tumour volume, TLG and textural features assessed with (18)F-FDG PET in a large cohort of oestrogen receptor-positive breast cancer patients. Eur J Nucl Med Mol Imaging (2017) 44(7):1145–54. doi: 10.1007/s00259-017-3641-4
16. Laurinavicius A, Plancoulaine B, Herlin P, Laurinaviciene A. Comprehensive Immunohistochemistry: Digital, Analytical and Integrated. Pathobiol J Immunopathol Mol Cell Biol (2016) 83(2-3):156–63. doi: 10.1159/000442389
17. Plancoulaine B, Laurinaviciene A, Herlin P, Besusparis J, Meskauskas R, Baltrusaityte I, et al. A methodology for comprehensive breast cancer Ki67 labeling index with intra-tumor heterogeneity appraisal based on hexagonal tiling of digital image analysis data. Virchows Arch (2015) 711–22. doi: 10.1007/s00428-015-1865-x
18. Bellevre D, Blanc Fournier C, Switsers O, Dugue AE, Levy C, Allouache D, et al. Staging the axilla in breast cancer patients with (1)(8)F-FDG PET: how small are the metastases that we can detect with new generation clinical PET systems? Eur J Nucl Med Mol Imaging (2014) 41(6):1103–12. doi: 10.1007/s00259-014-2689-7
19. Aide N, Salomon T, Blanc-Fournier C, Grellard JM, Levy C, Lasnon C. Implications of reconstruction protocol for histo-biological characterisation of breast cancers using FDG-PET radiomics. EJNMMI Res (2018) 8(1):114. doi: 10.1186/s13550-018-0466-5
20. Boellaard R, O’Doherty MJ, Weber WA, Mottaghy FM, Lonsdale MN, Stroobants SG, et al. FDG PET and PET/CT: EANM procedure guidelines for tumour PET imaging: version 1.0. Eur J Nucl Med Mol Imaging (2010) 37(1):181–200. doi: 10.1007/s00259-010-1458-5
21. Nioche C, Orlhac F, Boughdad S, Reuze S, Goya-Outi J, Robert C, et al. LIFEx: A Freeware for Radiomic Feature Calculation in Multimodality Imaging to Accelerate Advances in the Characterization of Tumor Heterogeneity. Cancer Res (2018) 78(16):4786–9. doi: 10.1158/0008-5472.CAN-18-0125
22. Zwanenburg A. Radiomics in nuclear medicine: robustness, reproducibility, standardization, and how to avoid data analysis traps and replication crisis. Eur J Nucl Med Mol Imaging (2019) 46(13):2638–55. doi: 10.1007/s00259-019-04391-8
23. Orlhac F, Nioche C, Soussan M, Buvat I. Understanding Changes in Tumor Texture Indices in PET: A Comparison Between Visual Assessment and Index Values in Simulated and Patient Data. J Nucl Med (2017) 58(3):387–92. doi: 10.2967/jnumed.116.181859
24. Orlhac F, Soussan M, Chouahnia K, Martinod E, Buvat I. 18F-FDG PET-Derived Textural Indices Reflect Tissue-Specific Uptake Pattern in Non-Small Cell Lung Cancer. PLoS One (2015) 10(12):e0145063. doi: 10.1371/journal.pone.0145063
25. Laurinavicius A, Plancoulaine B, Laurinaviciene A, Herlin P, Meskauskas R, Baltrusaityte I, et al. A methodology to ensure and improve accuracy of Ki67 labelling index estimation by automated digital image analysis in breast cancer tissue. Breast Cancer Res BCR (2014) 16(2):R35. doi: 10.1186/bcr3639
26. Haralick RM, Shanmugam K, Dinstein I. Textural Features for Image Classification. IEEE Trans Syst Man Cybern (1973) SMC-3(6):610–21. doi: 10.1109/TSMC.1973.4309314
27. Goldhirsch A, Winer EP, Coates AS, Gelber RD, Piccart-Gebhart M, Thurlimann B, et al. Personalizing the treatment of women with early breast cancer: highlights of the St Gallen International Expert Consensus on the Primary Therapy of Early Breast Cancer 2013. Ann Oncol (2013) 24(9):2206–23. doi: 10.1093/annonc/mdt303
29. Hastie T, Tibshirani R, Friedman J. The Elements of Statistical Learning: Data Mining, Inference, and Prediction. New York: Springer-Verlag (2009).
31. Breiman L. Manual on setting up, using and understanding random forests, v 3.1. Berkeley, California: Statistical Department of the University of Berkeley (2002).
32. Evangelista L, Guarneri V, Conte PF. 18F-Fluoroestradiol Positron Emission Tomography in Breast Cancer Patients: Systematic Review of the Literature & Meta-Analysis. Curr Radiopharm (2016) 9(3):244–57. doi: 10.2174/1874471009666161019144950
33. Lasnon C, Enilorac B, Popotte H, Aide N. Impact of the EARL harmonization program on automatic delineation of metabolic active tumour volumes (MATVs). EJNMMI Res (2017) 7(1):30. doi: 10.1186/s13550-017-0279-y
34. Ramakrishna N, Temin S, Chandarlapaty S, Crews JR, Davidson NE, Esteva FJ, et al. Recommendations on Disease Management for Patients With Advanced Human Epidermal Growth Factor Receptor 2-Positive Breast Cancer and Brain Metastases: ASCO Clinical Practice Guideline Update. J Clin Oncol (2018) 36(27):2804–7. doi: 10.1200/JCO.2018.79.2713
35. Wolff AC, Hammond ME, Hicks DG, Dowsett M, McShane LM, Allison KH, et al. Recommendations for human epidermal growth factor receptor 2 testing in breast cancer: American Society of Clinical Oncology/College of American Pathologists clinical practice guideline update. J Clin Oncol (2013) 31(31):3997–4013. doi: 10.1200/JCO.2013.50.9984
36. Wolff AC, Hammond MEH, Allison KH, Harvey BE, Mangu PB, Bartlett JMS, et al. Human Epidermal Growth Factor Receptor 2 Testing in Breast Cancer: American Society of Clinical Oncology/College of American Pathologists Clinical Practice Guideline Focused Update. J Clin Oncol (2018) 36(20):2105–22. doi: 10.1200/JCO.2018.77.8738
Keywords: breast cancer, steroid receptors, image processing, computer-aided system, radiomics analysis; 18F-FDG PET imaging
Citation: Aide N, Elie N, Blanc-Fournier C, Levy C, Salomon T and Lasnon C (2021) Hormonal Receptor Immunochemistry Heterogeneity and 18F-FDG Metabolic Heterogeneity: Preliminary Results of Their Relationship and Prognostic Value in Luminal Non-Metastatic Breast Cancers. Front. Oncol. 10:599050. doi: 10.3389/fonc.2020.599050
Received: 26 August 2020; Accepted: 12 November 2020;
Published: 12 January 2021.
Edited by:
Laurent Dercle, Columbia University Irving Medical Center, United StatesReviewed by:
Laurence Champion, Hôpital René Huguenin, FranceAntoine Girard, Centre Eugène Marquis, France
Copyright © 2021 Aide, Elie, Blanc-Fournier, Levy, Salomon and Lasnon. This is an open-access article distributed under the terms of the Creative Commons Attribution License (CC BY). The use, distribution or reproduction in other forums is permitted, provided the original author(s) and the copyright owner(s) are credited and that the original publication in this journal is cited, in accordance with accepted academic practice. No use, distribution or reproduction is permitted which does not comply with these terms.
*Correspondence: Charline Lasnon, Yy5sYXNub25AYmFjbGVzc2UudW5pY2FuY2VyLmZy
†These authors have contributed equally to this work