
94% of researchers rate our articles as excellent or good
Learn more about the work of our research integrity team to safeguard the quality of each article we publish.
Find out more
ORIGINAL RESEARCH article
Front. Oncol. , 30 September 2020
Sec. Cancer Imaging and Image-directed Interventions
Volume 10 - 2020 | https://doi.org/10.3389/fonc.2020.593292
This article is part of the Research Topic Radiomics-Based Tumor Phenotyping in Precision Medicine View all 44 articles
 Lei Zhang1†
 Wei Xia2†Zhi-Ping Yan3,4†
 Jun-Hui Sun5†
 Bin-Yan Zhong1†
 Zhong-Heng Hou1Min-Jie Yang3,4
 Guan-Hui Zhou5Wan-Sheng Wang1Xing-Yu Zhao2Jun-Ming Jian2Peng Huang1Rui Zhang2Shen Zhang1Jia-Yi Zhang2Zhi Li1Xiao-Li Zhu1
 Xin Gao2*
 Cai-Fang Ni1*
Objectives: To develop and validate a deep learning-based overall survival (OS) prediction model in patients with hepatocellular carcinoma (HCC) treated with transarterial chemoembolization (TACE) plus sorafenib.
Methods: This retrospective multicenter study consisted of 201 patients with treatment-naïve, unresectable HCC who were treated with TACE plus sorafenib. Data from 120 patients were used as the training set for model development. A deep learning signature was constructed using the deep image features from preoperative contrast-enhanced computed tomography images. An integrated nomogram was built using Cox regression by combining the deep learning signature and clinical features. The deep learning signature and nomograms were also externally validated in an independent validation set of 81 patients. C-index was used to evaluate the performance of OS prediction.
Results: The median OS of the entire set was 19.2 months and no significant difference was found between the training and validation cohort (18.6 months vs. 19.5 months, P = 0.45). The deep learning signature achieved good prediction performance with a C-index of 0.717 in the training set and 0.714 in the validation set. The integrated nomogram showed significantly better prediction performance than the clinical nomogram in the training set (0.739 vs. 0.664, P = 0.002) and validation set (0.730 vs. 0.679, P = 0.023).
Conclusion: The deep learning signature provided significant added value to clinical features in the development of an integrated nomogram which may act as a potential tool for individual prognosis prediction and identifying HCC patients who may benefit from the combination therapy of TACE plus sorafenib.
Almost 80% of patients with hepatocellular carcinoma (HCC) are initially diagnosed at the intermediate or advanced stage, hence being unqualified for curative treatments such as resection and ablation (1, 2). As demonstrated by two controlled randomized trials and the BRIDGE study, transarterial chemoembolization (TACE) is the most common therapeutic option for unresectable hepatocellular carcinoma (HCC), and is recommended for intermediate stage HCC (Barcelona Clinic Liver Cancer (BCLC) stage B) by most guidelines (3–7). However, the release of angiogenic factors such as vascular endothelial growth factor (VEGF) induced by TACE may increase the recurrence and progression rate of HCC (8, 9).
Sorafenib, a multikinase inhibitor, was the first oral molecular targeting agent to significantly improve overall survival (OS) and time-to-tumor progression (TTP) in patients with advanced HCC (10, 11). Theoretically, owing to acute hypoxia triggered by TACE which leads to the upregulation of VEGF, the combination of TACE and sorafenib may inhibit both revascularization and tumor proliferation (12, 13). Recently, the TACTIS trial clearly showed that TACE plus sorafenib significantly improved clinical outcomes in patients with unresectable HCC, which indicated that this combination therapy was effective and feasible in routine practice (14). However, several clinical trials failed to contribute compelling evidence for the combination of sorafenib and TACE, apart from the trial design which described the duration of sorafenib administration and TACE treatment regimen, the failure could be mainly due to the vast heterogeneity of unresectable HCCs, leading to differences in individual response (15–18). Therefore, a personalized prediction biomarker or model which can identify patients who may benefit from the combination therapy is crucial for treatment decision. Previous studies indicated that there was a potential link between adverse events (AEs) and favorable outcomes, which concluded that the earlier the AEs such as dermatological AEs and hypertension occurred, the longer the overall survival (OS) of patients on the combination therapy (19, 20). Nevertheless, biomarkers or models which provide accurate prognosis predictions are still lacking.
As a non-invasive examination tool used routinely in clinical practice, medical imaging can provide comprehensive evaluations of tumor heterogeneity, and previous studies found that image-based deep learning technologies showed promising capabilities in the development of accurate prediction models (21, 22). Specifically, the transfer learning strategy makes it possible to implement deep learning on relatively small datasets (22, 23). In this study, we conducted a multicenter study to establish and validate a deep learning-based prognosis prediction model for HCC patients treated with the combination of TACE and sorafenib.
This retrospective multicenter study enrolled consecutive treatment-naïve HCC patients who were treated with the combination of TACE and sorafenib between 2011 and 2016. Data of patients from center A and B were used as the training set for the development of the prognosis prediction model, and data of patients from center C were used as the validation set for independent model test. The study was approved by the Institution Ethics Review Boards of the three mentioned centers. The need for informed consent was waived due to the retrospective nature of the study.
The diagnosis of HCC was confirmed according to the European Association for the Study of the Liver (EASL) or the American Association for the Study of Liver Disease (AASLD) criteria (6, 7). The inclusion criteria were as follows: 1) patients were 18 years or older; 2) the Eastern Cooperative Oncology Group (ECOG) scores were 0 or 1; 3) patients with unresectable HCC which is clinically a heterogeneous group including those with inter-mediate and advanced stage (6); 4) Child-Pugh class A to B7; 5) adequate hematological, clotting, and renal function. Patients were excluded from the study if the following criteria were present: (1) absence of baseline imaging and clinical data; (2) comorbidity with other primary malignancies; (3) infiltrative HCCs with obscure borders; (4) contraindications to TACE or sorafenib treatment; (5) having received previous HCC-related treatment, including resection, ablation, TACE, and radiotherapy.
Relevant information was retrieved from the clinical database, including ECOG scores, Child Pugh class, number of tumors, tumor size, BCLC stage, hepatitis B virus (HBV) status, liver cirrhosis status, tumor distribution status, serum α-fetoprotein (AFP), alanine aminotransferase (ALT), aspartate aminotransferase (AST), and hepatitis B surface antigen (HBsAg) level. Continuous variables were transformed into categorical variables based on recognized cutoff values (24).
Preoperative contrast-enhanced computed tomography (CECT) scans were performed before treatment and both arterial and portal phases of CECT were obtained.
The details of CECT protocol was showed in the supplements.
Sorafenib (Bayer Healthcare, Leverkusen, Germany) was administrated orally to patients within 1 week after every session of TACE. To preserve liver function, sorafenib administration was stopped before the day of each TACE session. In principle, the dose of sorafenib was 400 mg twice daily (800 mg/day). Nevertheless, treatment interruptions and dose reductions (400 mg once-daily, 400 mg alternated days) were permitted for drug-related adverse events (AEs), which were graded per Common Terminology Criteria of Adverse Events (CTCAE) version 5.0. Patients were excluded if they did not adhere to the regimen.
TACE was performed based on “on demand” mode. No patients underwent TACE using drug-eluting beads. Before chemoembolization, a diagnostic angiograph was performed to ensure the main portal vein was unobstructed and to determine the anatomy of the tumor vessels and hepatic artery. With a super-selection of segment or subsegment, a 2.7 F microcatheter (Progreat, Terumo, United States) was advanced into the feeding vessels. As selected according to the practice of each center, chemoembolization was performed with intra-arterial doxorubicin (10–50 mg) and oxaliplatin (100–200 mg) mixed with lipiodol (2–20 ml, lipiodol ultra-fluid; Guerbet, France) followed by injection of gelfoam particles. The injection volume of the emulsion was determined based on the tumor volume. Before performing additional TACE sessions, good performance status was essential. Patients would receive the best supportive care if they were not candidates for further TACE sessions. All TACE procedures were performed by several interventional radiologists with more than 8 years of experience.
The primary endpoint of the study was OS and the prediction models, which were built based on it. OS was defined as the time from the initial TACE treatment of HCC until any cause of death. In surviving patients, the censoring date was defined as the last follow-up (September 30, 2019). The secondary endpoint was progression-free survival (PFS). PFS was defined as the time from the date of TACE until the time of radiological progression by the modified Response Evaluation Criteria in Solid Tumors (mRECIST). Radiological progression was assessed by two independent radiologists who were blinded to the clinical information. In patients without death or progression, the censoring date was defined as the last radiological assessment date. Patients received follow-up of CECT every 4 weeks after each TACE session and every 8–12 weeks after disease stability has been attained. Follow-up duration was measured from the day of diagnosis to last visit or death.
The modeling workflow of this study is shown in Figure 1. The CECT images of the arterial and portal phases were aligned using open-source Insight Segmentation and Registration Toolkit (ITK, version 4.7.21)(25). The tumor region of interest (ROI) was manually delineated in 2D slices of both AP and PVP using MITK software (version 2016.11.32) by a radiologist with 10 years of experience, and then confirmed by a radiologist with 23 years of experience. The representative slices with the largest tumor ROI were selected, and square images with the size of 224 × 224 pixels whose center was located at the centroid of tumor ROI were generated. All images were processed by a z-score standardization, which consisted of subtracting the mean intensity and division by the standard deviation of intensity.
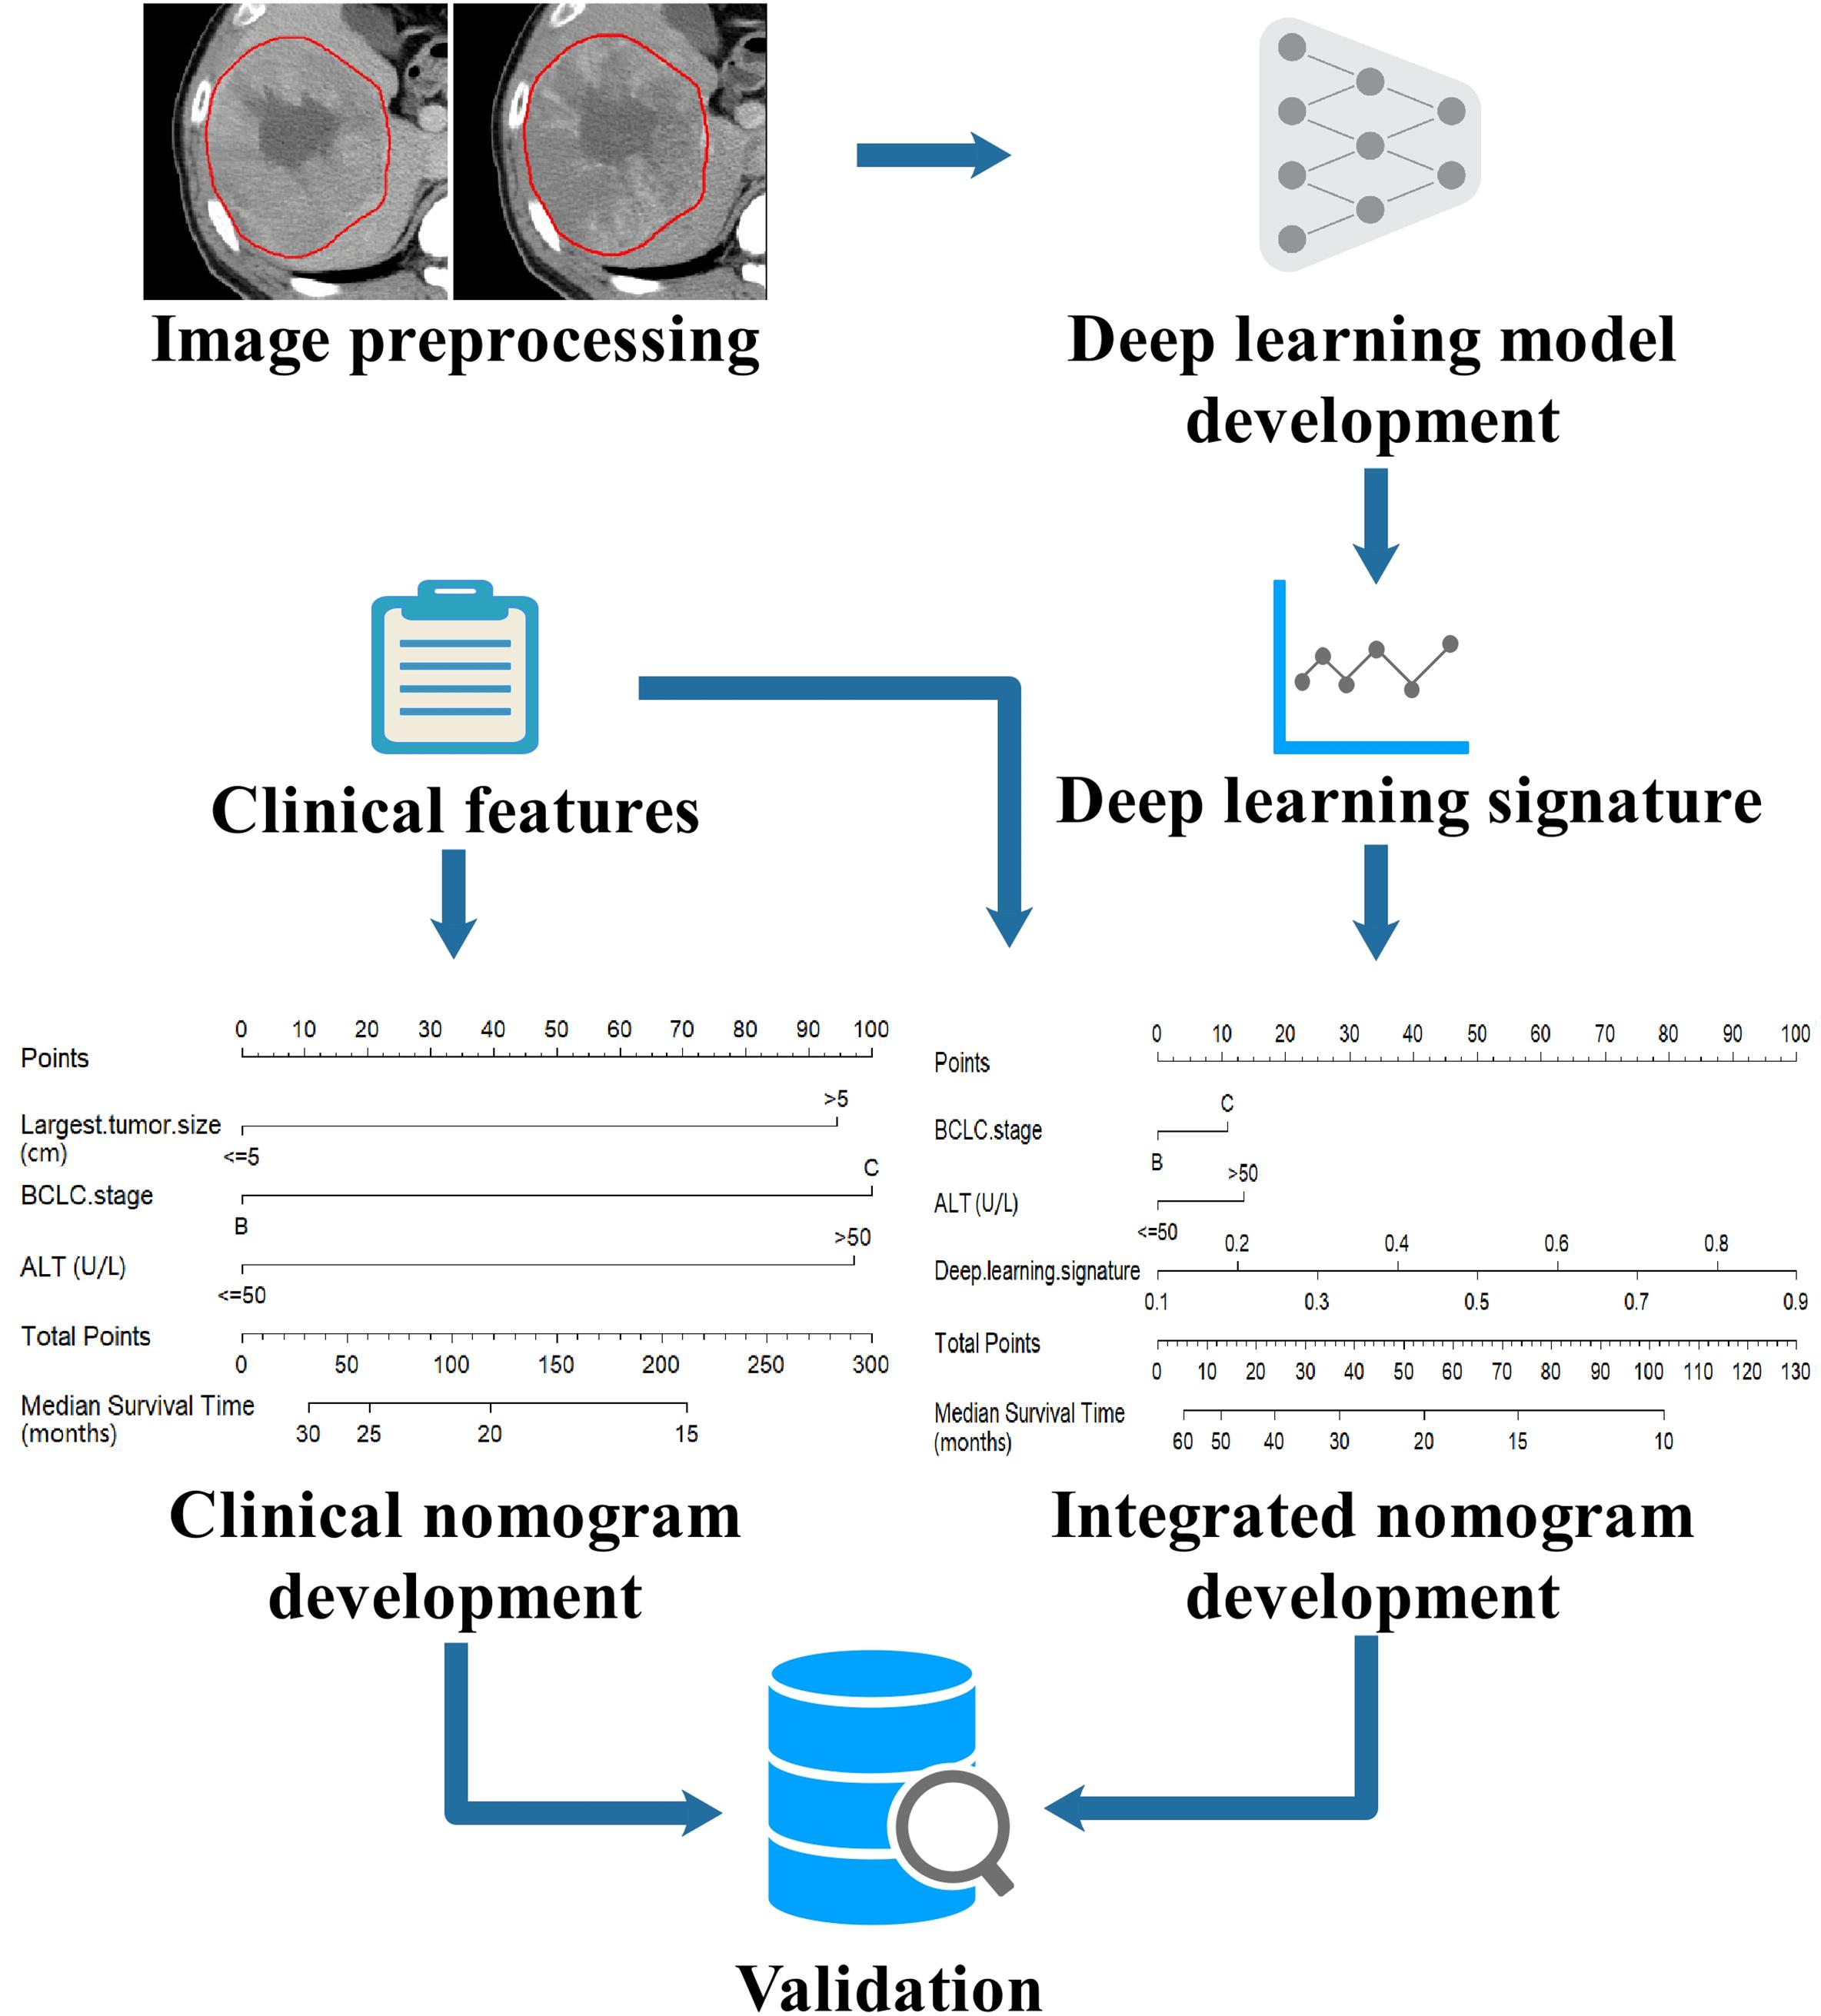
Figure 1. Workflow of modeling in this study. The CECT images were preprocessed by image registration, tumor delineation and image standardization, then the images were input into a deep learning model to build the deep learning signature. The deep learning signature and the clinical features were combined to develop an integrated nomogram. For comparison, a clinical nomogram was also built using only the clinical features. The nomograms were externally validated in an independent validation set.
The deep learning model was adapted to decode the prognostic signal of tumors on CECT images. The training of deep learning models is computationally expensive and requires large number of images because of its millions of learnable parameters to estimate. To address the lack of data, a highly effective technique known as transfer learning was employed by leveraging large data set from computer vision domain (23). In this way, a deep learning model with DenseNet-121 architecture (26) was trained using ImageNet dataset3. DenseNet is a state-of-the-art convolutional neural network (CNN) which demonstrates significant improvements over traditional CNNs on highly competitive object recognition benchmark tasks, and it requires less computational cost and has fewer parameters which confers the model a smaller size and easier accessibility for application. ImageNet is a dataset for image classification which contains more than 14 million labeled natural images. The ImageNet dataset was used to train the DenseNet-121 model to derive model parameters, which conferred the general ability of image interpretation to the model, thus, the deep learning model can recognize the unique features of a specific category of images. In the DenseNet-121 model, the fully connected layer and softmax layer were removed, and the feature extraction module was used as deep image feature extractors. The DenseNet-121 model was used to extract 1024 deep image features from CECT images at each phase, respectively. The deep learning was implemented using Keras4 in Python with TensorFlow5 as the backend. The trained DenseNet-121 model is available online6. The technical details were described in the supplements.
An efficient two-stage modeling procedure was conducted to build the deep learning signature. In the first stage, the deep image features were ranked by mRMR, a multivariate ranking method (27). In the second stage, the top-ranked features were input into ElasticNet for the determination of feature weights and the building of the deep learning signature (28). 5-fold cross-validation was performed in modeling procedures to determine the optimal parameter configuration. The technical details were described in the supplements.
As the tumor ROI was manually delineated, the inter-observer and intra-observer correlation coefficient (ICC) were introduced to examine the reproducibility of deep image features in the deep learning signature. Two radiologists with 10 years of experience performed the same delineation of the tumor ROI for all patients: radiologist 1 delineated the ROI twice at different times and radiologist 2 carried out the delineation once. The deep image features were extracted after each delineation. The inter-observer and intra-observer ICC of deep image features were computed to determine the reproducibility of features, and the features with intra or inter-observer ICC above 0.75 were considered to have high reproducibility.
For an intuitive understanding of mechanisms of the deep learning signature, the strategy of class activation map (CAM) was used to generate heat maps which could give a coarse location of the image area relevant to unfavorable prognosis (29). The technical details of heat map generation were documented in the supplements.
The Cox regression method was used to build the OS prediction nomogram. The clinical features and the deep learning signature were utilized as the candidate prognostic factors and tested by univariate Cox regression analysis to select the factors which were significantly correlated to OS. Then, the selected prognostic factors were used in multivariate Cox regression analysis to obtain an integrated nomogram by a stepwise feature selection algorithm based on the Akaike information criterion (AIC) (30). For comparison, a clinical nomogram was also built using only the clinical features.
The performance of models in predicting OS was evaluated by calculating the C-index (31). The deep learning signature and nomograms built on the training set were independently tested on the validation set. The calibration of nomograms was assessed by comparing observed and predicted survival using root mean square error (RMSE), where a lower RMSE reflects better agreement between observations and predictions (32).
In statistical tests, the Mann–Whitney U test was used for numerical variables, and Fisher’s exact test was used for categorical variables. All statistical tests were two-sided and P < 0.05 was used to indicate statistical significance.
After enrollment, a total of 201 patients were included in this study (center A and B as the training set: n = 120, center C as the validation set: n = 81) (Supplementary Figure S1). The median OS and PFS of the entire set was 19.2 months (95% CI: 17.7–20.7) and 8.3 months (95% CI: 7.7–9.0) and no significant difference was found between the training and validation cohort (median OS: 18.6 (95% CI: 16.2–21.2) vs. 19.5 (95% CI: 17.8–21.9) months, P = 0.45; median PFS: 8.4 (95% CI: 7.5–9.0) vs. 8.1 (95% CI: 6.8–9.9) months, P = 0.23). The Kaplan–Meier curves of the training and validation sets for OS and PFS were plotted in Figures 2A,B. The detailed demographic characteristics of the enrolled patients in both sets were shown in Table 1.
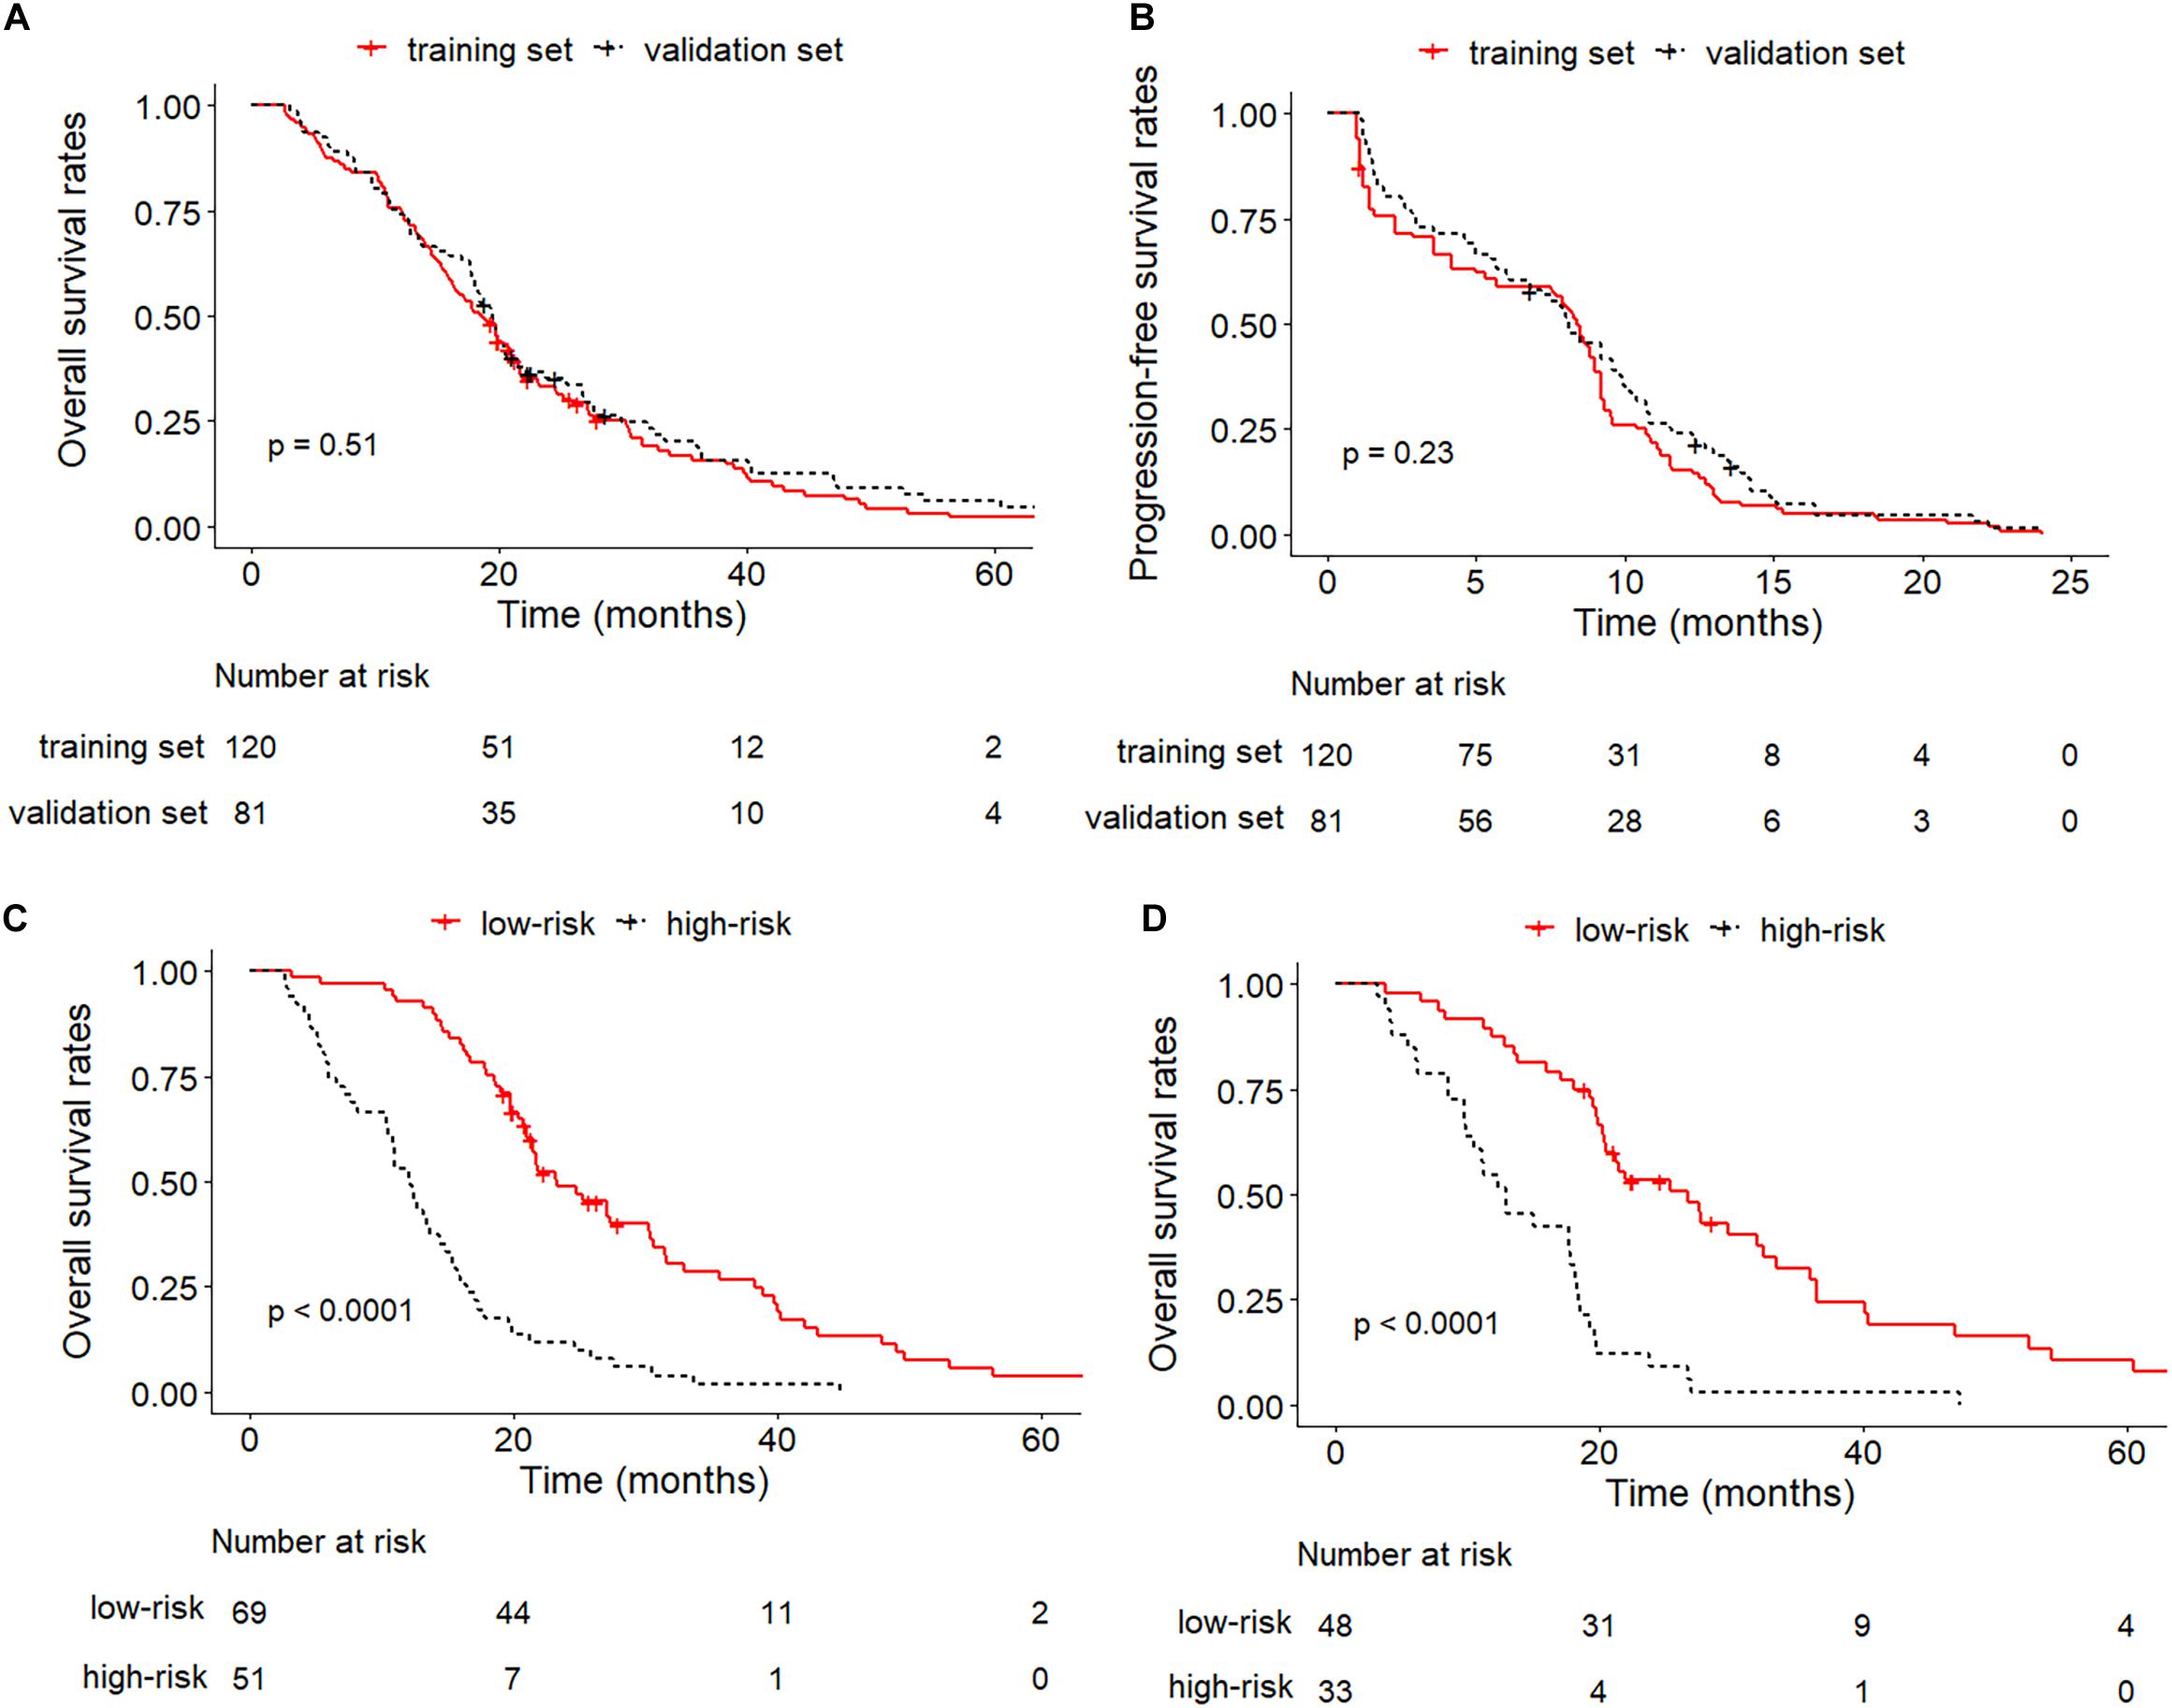
Figure 2. Kaplan–Meier curves between training and validation cohorts. (A) OS of training set and validation set; (B) PFS of training set and validation set; (C) OS of low-risk and high-risk groups in the training set; (D) OS of low-risk and high-risk groups in the validation set.

Table 1. Baseline characteristics in the training and validation set.
The duration of sorafenib administration was 12.8 months (range: 1.2–45.4 months). The dose reductions and interruptions in 152 (75.6%) patients were mainly due to disease progression and AEs. No combination therapy-related deaths occurred during the follow-up. The AEs of patients were listed in Supplementary Table S1 of the supplements.
There were 10 deep image features in the deep learning signature including 5 features extracted from arterial phase CECT and 5 features extracted from portal phase CECT, the names of the features and corresponding weights were detailed in Supplementary Table S2 of the supplements. All deep image features in the deep learning signature had ICC above 0.75. The deep learning signature achieved a C-index of 0.717 (95% CI: 0.709–0.726) in the training set, and it was validated to have good prediction performance with a C-index of 0.714 (95% CI: 0.702–0.727) in the validation set.
Heat maps were generated to provide a coarse location of the tumor region relevant to unfavorable prognosis. Figure 3 illustrates an example of CECT images with superimposed heat maps, where the areas in deeper red indicated a stronger correlation with unfavorable prognosis. The core area colored deepest red was located in the hypodense mass, and the general red area covered almost the entire tumor.
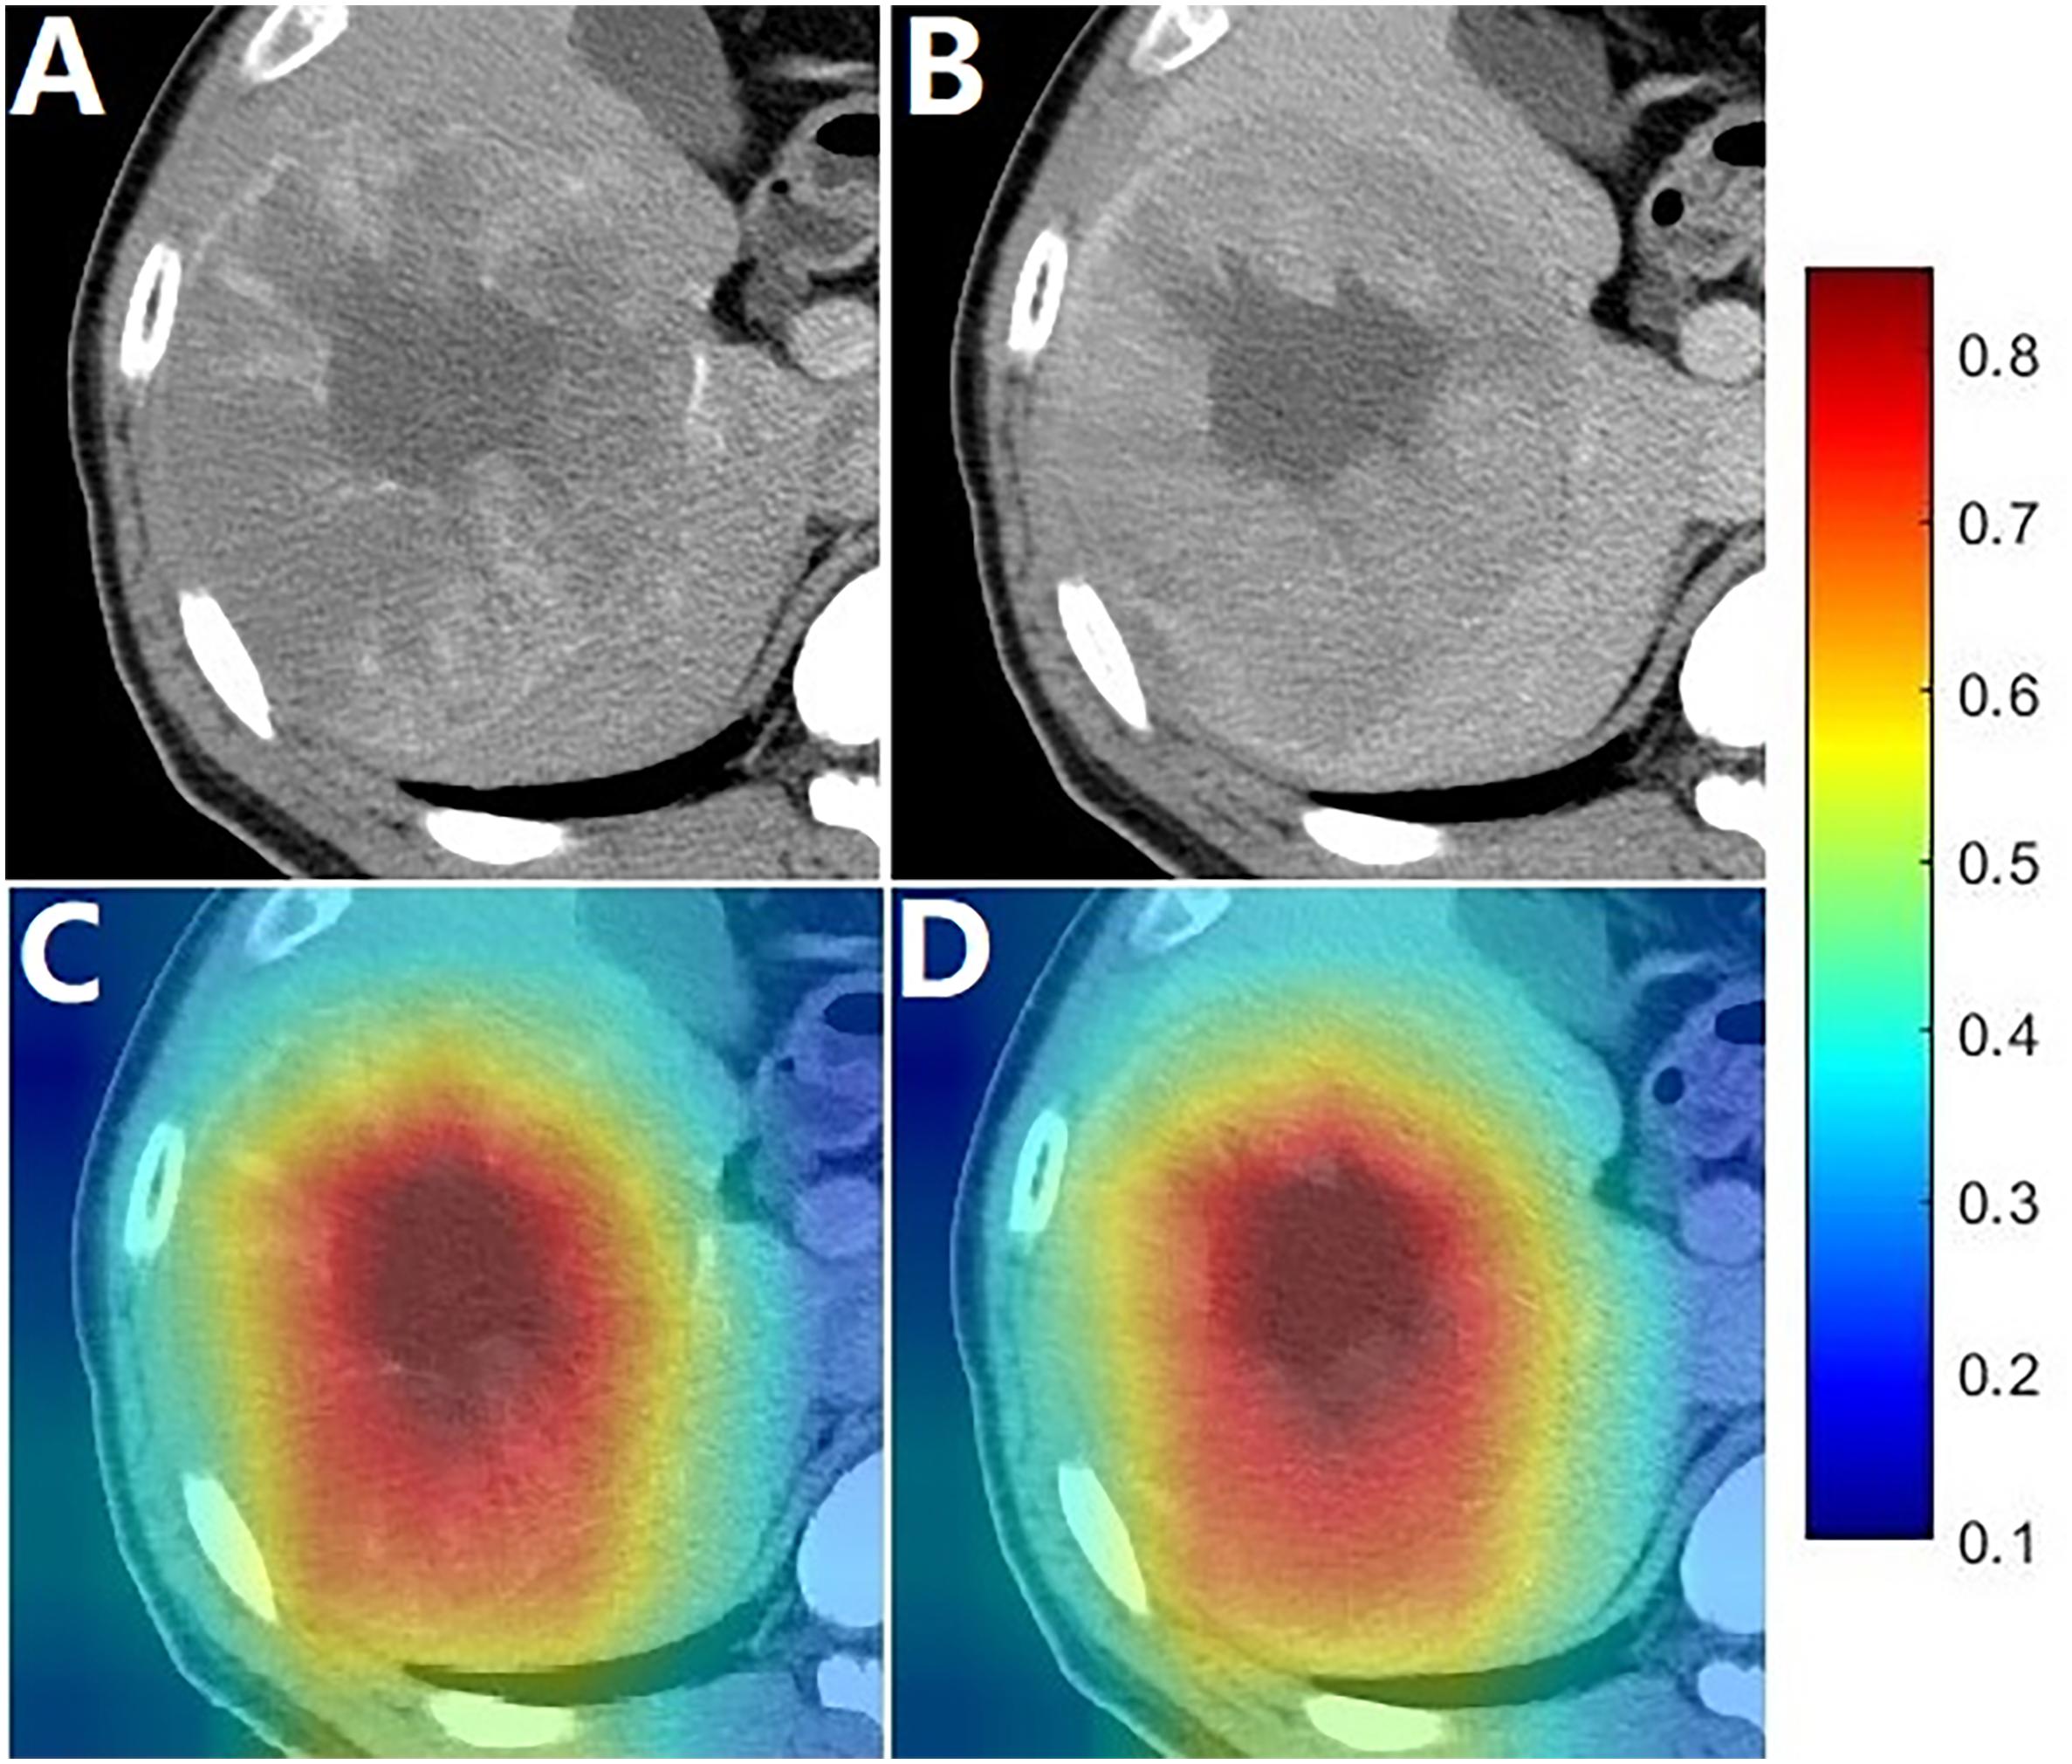
Figure 3. Images of a patient with an OS of 13.6 months. (A,B) were arterial phase and portal phase CECT images, respectively; (C,D) shows the heat map superimposed on the arterial phase and portal phase CECT images.
The BCLC stage, largest tumor size, AFP, ALT and deep learning signature were identified as prognostic factors correlated to OS in the univariate analysis (Supplementary Table S3). When only the prognostic clinical features were used in multivariate Cox regression analysis, BCLC stage, largest tumor size and ALT were identified as independent prognostic factors (Table 2) and a clinical nomogram was built (Figure 4A). By including all prognostic factors in the multivariate Cox regression analysis, the largest tumor size failed to remain as an independent prognostic ability, while BCLC stage, ALT and deep learning signature were identified as independent prognostic factors (Table 2), and an integrated nomogram was built using these factors (Figure 4B).

Table 2. Nomograms built using multivariate Cox regression analysis.
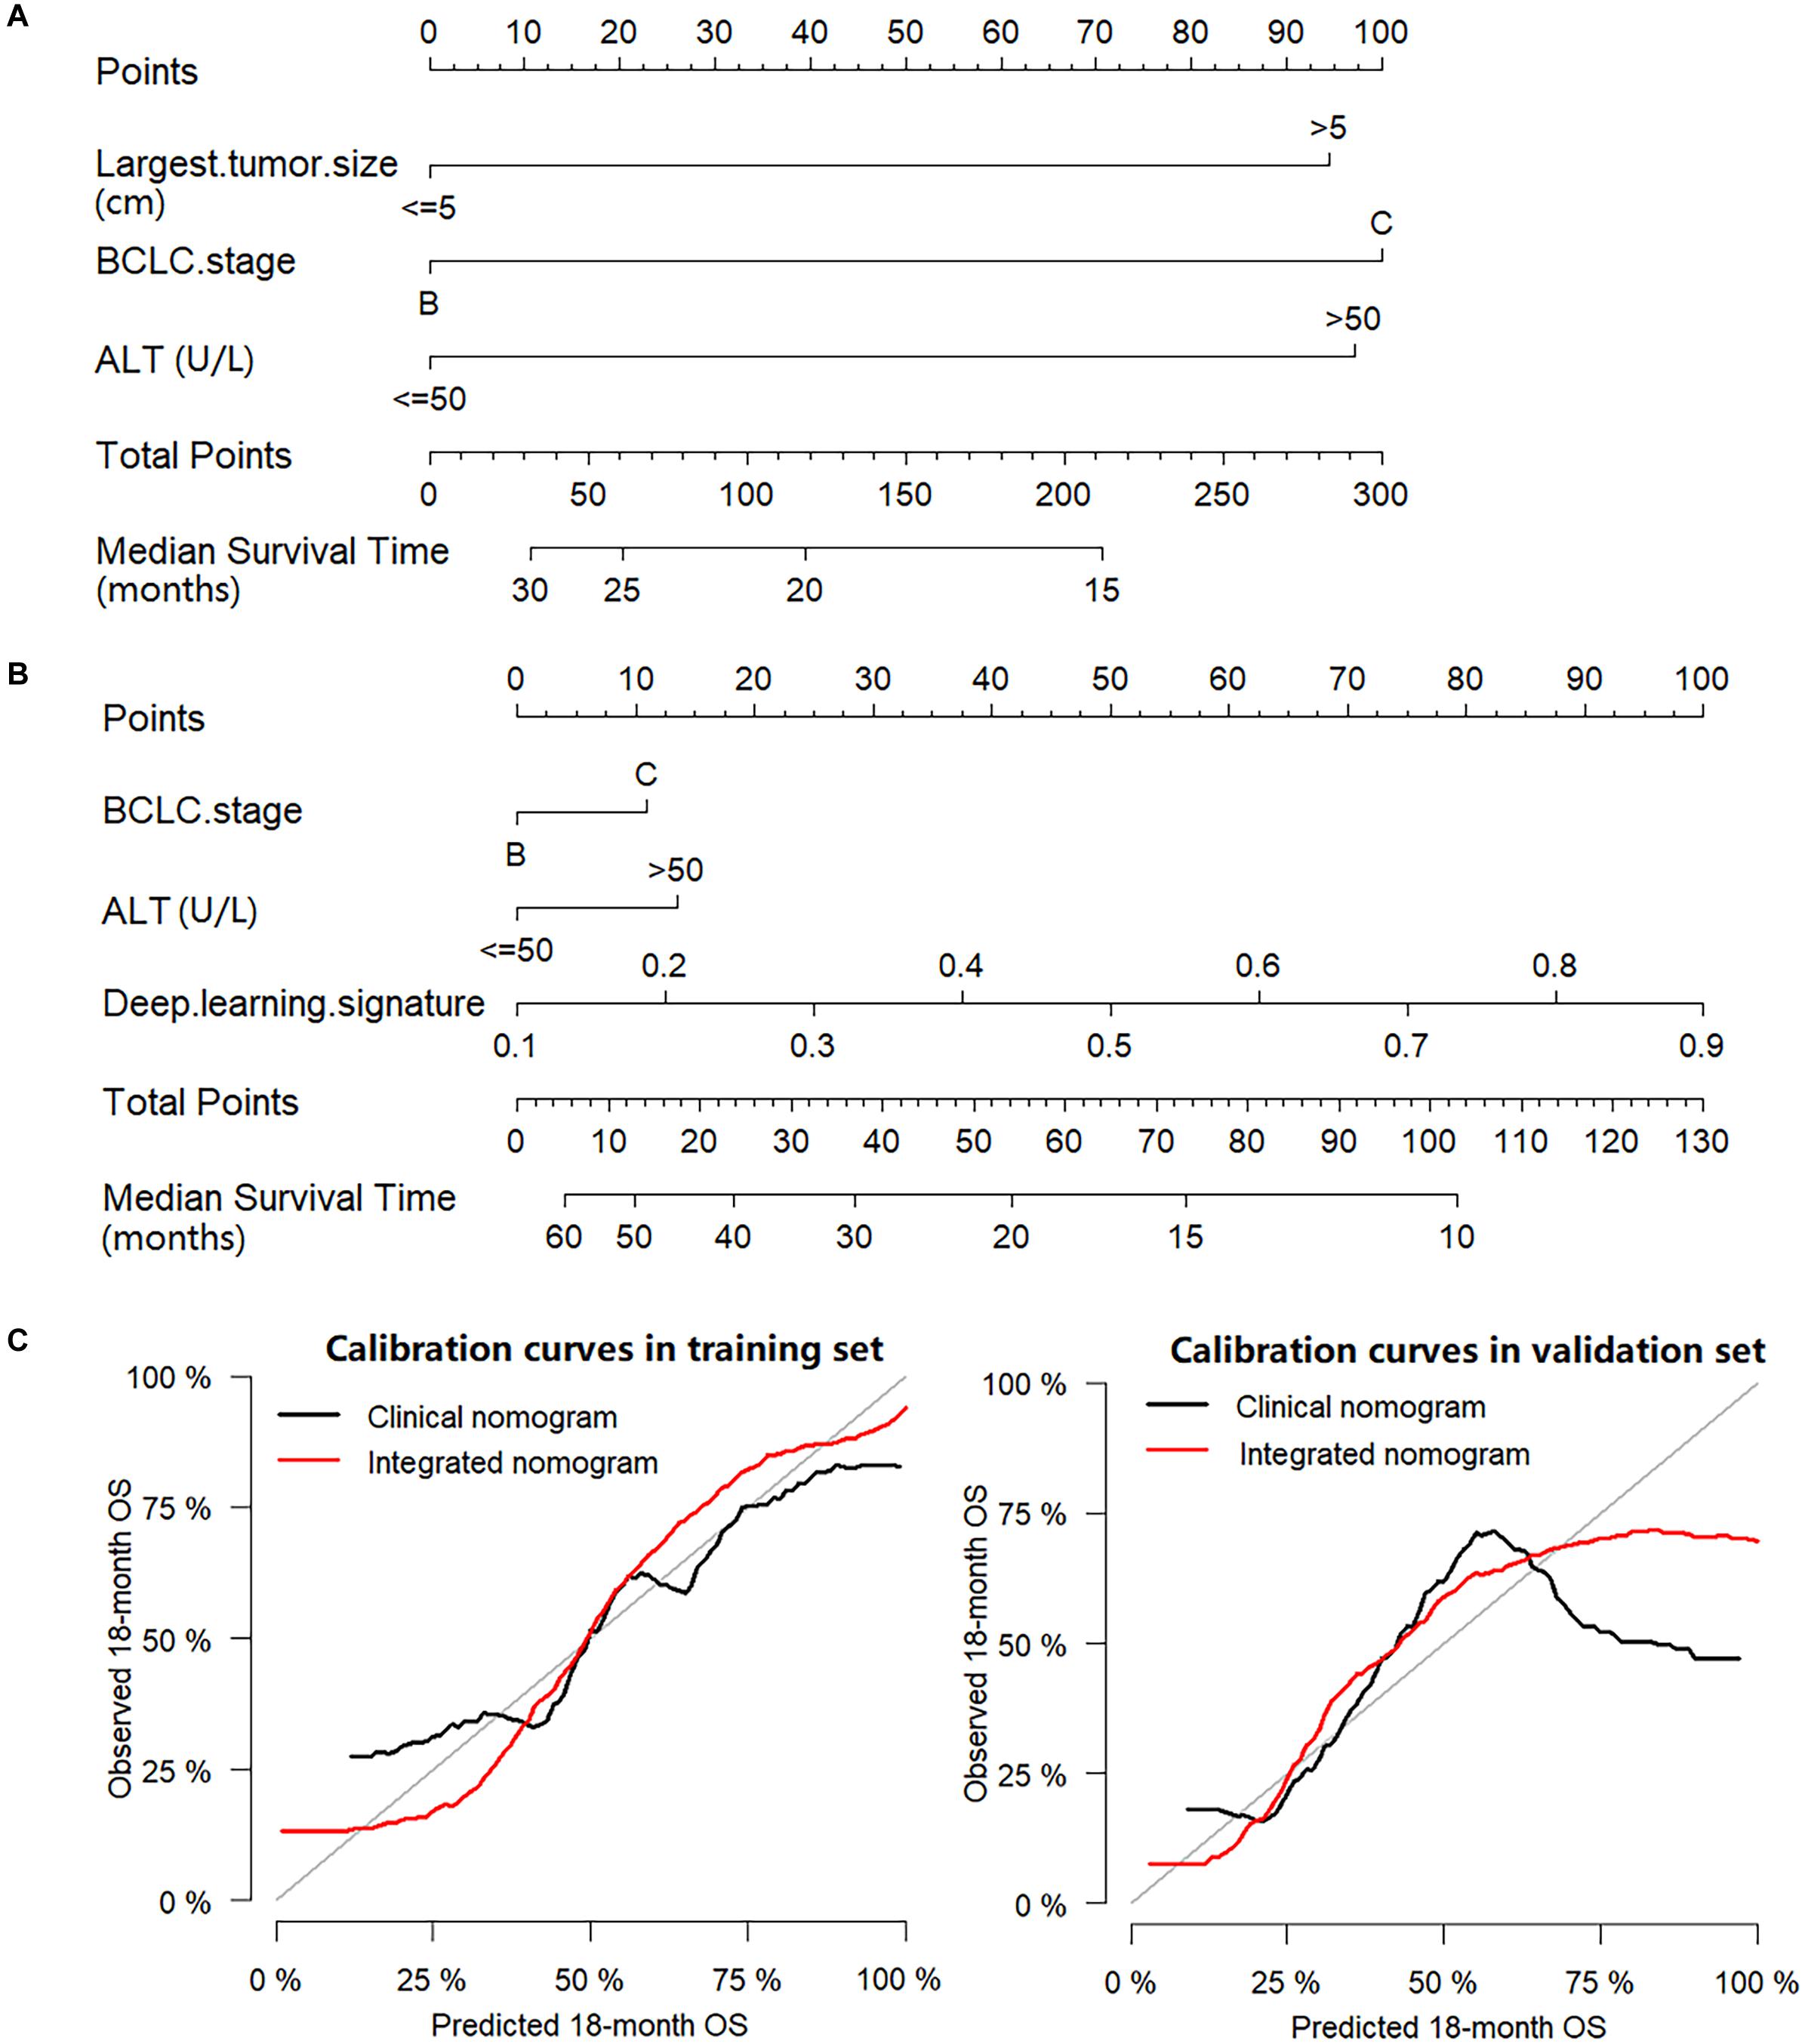
Figure 4. Nomograms and calibration curves. (A) Clinical nomogram; (B) Integrated nomogram; (C) Calibration curves of nomograms in the training set and validation set.
In the training set, the C-index for the integrated nomogram (0.739, 95% CI: 0.731–0.748) for the prediction of OS was significantly higher than that of the clinical nomogram (0.664, 95% CI: 0.654–0.673, P = 0.002). Consistent results were found in the validation set, where the C-index remained significantly greater for the integrated nomogram (0.730, 95% CI: 0.717–0.742) compared with the clinical nomogram (0.679, 95% CI: 0.667–0.691, P = 0.023). The calibration plots of nomograms were plotted in Figure 4C. In the training set, the RMSE was 0.068 for the clinical nomogram and 0.062 for the integrated nomogram. In the validation set, the RMSE of the clinical nomogram was 0.192 and the RMSE of the integrated nomogram was 0.105.
The median value of the scores predicted by the integrated nomogram was determined as the cutoff in stratifying the patients in the training cohort into two subgroups, where the subgroup with scores higher than median score were classified as the high-risk group, and the other subgroup was classified as the low-risk group, and the patients in the low-risk group achieved better OS than the high-risk group (P < 0.001). After applying the same cutoff value in stratifying patients in the validation set, stratification into high and low-risk subgroups also achieved significantly distinct OS (P < 0.001). The Kaplan–Meier curves of low-risk and high-risk groups in the training and validation sets were illustrated in Figures 2C,D.
A multicenter study was conducted to develop and validate an OS prediction model for HCC patients treated with a combination of TACE and sorafenib, where an integrated nomogram which was built by incorporating a deep learning signature and clinical features showed significant improvement compared to the clinical nomogram. When comparing OS of this study to that of other trials, OS of the SPACE trial did not reach the median value, the TACTIS trial did not analyze OS, and the target population of the STAH and post-TACE trial was advanced stage HCCs and unresectable HCCs with a response after TACE (14, 15, 33, 34). The median OS of this study was consistent with the TACE-2 trial (median OS, 18.8 months), which suggested that the cohort in the present study is representative of real-world patients receiving TACE plus sorafenib for unresectable HCC (16).
Several clinical trials which attempted to address the improvement in OS of the combination treatment of TACE plus sorafenib in HCC patients have ended in failure (16, 33, 34). The failure of the negative trials could mainly be due to the deficiency of effective biomarkers (18). For HCC patients, it is known that baseline α-fetoprotein concentration and other biomarkers such as miR-26 miRNA precursor, epithelial cell adhesion molecule are suggested to be correlated with the outcomes (35, 36). In addition, more than 40 gene signatures have been described in terms of molecular-guided prognosis prediction (37). Nevertheless, none of them have yet to become a tangible tool in clinical practice mainly due to the impact of intra- and inter-tumor heterogeneity (38, 39). Another reason may be that the molecular biomarkers were identified by the specimens resected from patients at earlier stages but have not proven to be predictors of a response to systematic therapies such as sorafenib (37). A few studies showed that early-onset sorafenib-related AEs may be potential biomarkers for patients undergoing treatment with sorafenib (20, 40). Recently, the onset of hypertension and sorafenib-related dermatological AEs were demonstrated to be early biomarkers in patients with HCC who were treated with TACE plus sorafenib (19). Nevertheless, on the basis of complexity of the histopathological and biological heterogeneity of HCC, the multi-target treatment mechanisms of sorafenib in addition to the factors mentioned above, these biomarkers are unable to strongly predict the outcomes of patients with HCC who were treated with TACE plus sorafenib (41).
The image-based deep learning technology enabled the development of powerful prognosis biomarkers to predict outcomes in malignant tumors such as lung cancer (42), nasopharyngeal carcinoma (43) and gliomas (44). With the transfer learning strategy, the deep learning model was employed to build the deep learning signature in this relatively small data set. The entire modeling procedure was efficient and easy to implement with open-source programs. As shown in the results, the deep learning signature was highly correlated to OS. In the heat map, it was indicated that the deep learning signature could capture local features, where the deepest red areas identified were associated with the hypodense mass which may refer to necrosis (Figure 3). The arterial flow may decrease due to larger tumor growth, further dedifferentiation and progression to poorly differentiated HCC (45). Moreover, in very advanced HCCs, compression closure of tumor capillaries and the diminishing of newly developed blood vessels occurred due to the increasing interstitial pressure caused by rapid cell proliferation in the tumor center (46). Given these factors, necrosis may emerge in HCCs, which might make it a predictor of prognosis. In the heat map, the general red area almost covered the entire tumor, which suggested that the deep learning signature could capture global features including the tumor size, which is a predictor of poor prognosis in HCC (47, 48).
As presented in the study, a clinical nomogram was built, which included the BCLC stage, largest tumor size and ALT to predict individual outcomes. The BCLC stage relies on a composite of tumor burden, degree of liver damage, and cancer-related symptoms, providing a useful framework for clinical practice (6). Numerous studies have shown that larger tumor sizes are predictors of poor prognosis in HCC (47, 48). Moreover, ALT which was often utilized in the evaluation of liver function in clinical practice, was demonstrated to be linked with survival in patients with HCC (49). These were also true in our cohort where larger tumor sizes, higher ALT levels and BCLC C stage were associated with poor OS. An integrated nomogram was built by incorporating clinical features and a deep learning signature, where the integrated nomogram achieved a higher C-index and lower RMSE than that of the clinical nomogram, which indicated that the deep learning signature provided significant added value to clinical features. The reason may be because the deep learning signature could make predictions by capturing both the global and local features of tumors, and it comprehensively reflected on the tumor size and heterogeneity which were established prognostic factors (39, 50). This may also explain the exclusion of largest tumor size as a prognostic factor, as the deep learning signature has already contained the information of tumor size which belongs to the tumor global feature, which was consistent with the demonstration in the heat map.
Some limitations of this study should be acknowledged. First, because of its retrospective nature, selection bias may have existed and the cohort may not represent the entire population of patients with unresectable HCC. Nevertheless, there were no significant differences in the baseline characteristics between the three centers. Second, in this study, sequential administration rather than concurrent administration of the combination treatment may limit the efficacy of treatment. However, physicians preferred the sequential approach to avoid possible AEs in clinical practice. Third, because of the limited data, the study population included BCLC C stage HCC, where TACE is not routinely recommended. Hence, further study of BCLC B stage population is warranted. Last but not least, the entire modeling procedure was not fully automatic, and tumor delineation was required to reduce the image size and to eliminate background noise which ensured that the deep learning model could focus on the signal of the tumor. In the future, it is hoped that an end-to-end deep learning model can be trained on a large scale of dataset without the need for pre-processing procedures.
In conclusion, the current study demonstrated that the CECT-based deep learning signature could be used as a novel biomarker for OS prediction in patients with HCC undergoing TACE plus sorafenib treatment. Additionally, we built an integrated nomogram combining the clinical features and the deep learning signature to further improve the prediction of OS which could thereby act as a potential tool for the development of individual treatment strategies and identifying potential patients with HCC who may benefit from such a combination therapy.
The raw data supporting the conclusions of this article will be made available by the authors, without undue reservation.
The studies involving human participants were reviewed and approved by The First Affiliated Hospital of Soochow University. The ethics committee waived the requirement of written informed consent for participation. Written informed consent was obtained from the individual(s) for the publication of any potentially identifiable images or data included in this article.
All authors contributed to review and critical revision of the manuscript and approved the final version of the manuscript. XG, C-FN, LZ, and WX contributed to the study concept and design. LZ, B-YZ, Z-HH, PH, SZ, M-JY, G-HZ, W-SW, ZL, and X-LZ contributed to acquisition of data. LZ, WX, X-YZ, and J-MJ contributed to analysis and interpretation of data. WX, RZ, and J-YZ contributed to statistical analysis. LZ and WX contributed to drafting of the manuscript. The corresponding author had full access to all of the data and took full responsibility for the veracity of the data and the statistical analyses.
This study was supported by the National Natural Science Foundation of China (81901847, 81771945, 81971713, 61801474, and 81871439), the Natural Science Foundation of Jiangsu Province (BK20190177), the Natural Science Foundation of Zhejiang Province (LZ18H180001), “Six One Projects” for High-level Health Personnel in Jiangsu Province (LGY2018077), and Guangdong Provincial Key Research and Development Program (2019B010152001). Funding source had no involvement in the financial support for the conduct of the research and preparation of the article.
The authors declare that the research was conducted in the absence of any commercial or financial relationships that could be construed as a potential conflict of interest.
The Supplementary Material for this article can be found online at: https://www.frontiersin.org/articles/10.3389/fonc.2020.593292/full#supplementary-material
95% CI, 95% confidence interval; AASLD, American Association for the Study of Liver Diseases; AEs, adverse events; AFP, α -fetoprotein; AIC, Akaike information criterion; ALT, alanine aminotransferase; AST, aspartate aminotransferase; BCLC, Barcelona Clinic Liver Cancer; CAM, class activation map; CECT, contrast-enhanced computed tomography; C-index, concordance index; CT, computed tomography; CTCAE, Common Terminology Criteria of Adverse Events; EASL, European Association for the Study of the Liver; ECOG, Eastern Cooperative Oncology Group; GAP, global average pooling; HBsAg, Hepatitis B virus surface antigen; HBV, Hepatitis B virus; HCC, hepatocellular carcinoma; IRBs, Institutional Review Boards; mRECIST, modified Response Evaluation Criteria in Solid Tumors; MRI, magnetic resonance imaging; OS, overall survival; PFS, progression-free survival; RMSE, root mean square error; ROI, region of interest; SAEs, Severe Adverse Events; SD, standard deviation; TACE, transarterial chemoembolization; TTP, time-to-tumor progression; VEGF, vascular endothelial growth factor.
1. Villanueva A. Hepatocellular carcinoma. N Engl J Med. (2019) 380:1450–62. doi: 10.1056/NEJMra1713263
2. Forner A, Reig M, Bruix J. Hepatocellular carcinoma. Lancet. (2018) 391:1301–14. doi: 10.1016/S0140-6736(18)30010-2
3. Llovet JM, Real MI, Montana X, Planas R, Coll S, Aponte J, et al. Arterial embolisation or chemoembolisation versus symptomatic treatment in patients with unresectable hepatocellular carcinoma: a randomised controlled trial. Lancet. (2002) 359:1734–9. doi: 10.1016/S0140-6736(02)08649-X
4. Lo CM, Ngan H, Tso WK, Liu CL, Lam CM, Poon RT, et al. Randomized controlled trial of transarterial lipiodol chemoembolization for unresectable hepatocellular carcinoma. Hepatology. (2002) 35:1164–71. doi: 10.1053/jhep.2002.33156
5. Park JW, Chen M, Colombo M, Roberts LR, Schwartz M, Chen PJ, et al. Global patterns of hepatocellular carcinoma management from diagnosis to death: the BRIDGE Study. Liver Int. (2015) 35:2155–66. doi: 10.1111/liv.12818
6. Marrero JA, Kulik LM, Sirlin CB, Zhu AX, Finn RS, Abecassis MM, et al. Diagnosis staging, and management of hepatocellular carcinoma: 2018 practice guidance by the american association for the study of liver diseases. Hepatology. (2018) 68:723–50. doi: 10.1002/hep.29913
7. European Association for the Study of the Liver. Electronic address eee, European Association for the Study of the Liver. EASL clinical practice guidelines: management of hepatocellular carcinoma. J Hepatol. (2018) 69:182–236. doi: 10.1016/j.jhep.2018.03.019
8. Sergio A, Cristofori C, Cardin R, Pivetta G, Ragazzi R, Baldan A, et al. Transcatheter arterial chemoembolization (TACE) in hepatocellular carcinoma (HCC): the role of angiogenesis and invasiveness. Am J Gastroenterol. (2008) 103:914–21. doi: 10.1111/j.1572-0241.2007.01712.x
9. Wang B, Xu H, Gao ZQ, Ning HF, Sun YQ, Cao GW. Increased expression of vascular endothelial growth factor in hepatocellular carcinoma after transcatheter arterial chemoembolization. Acta Radiol. (2008) 49:523–9. doi: 10.1080/02841850801958890
10. Llovet JM, Ricci S, Mazzaferro V, Hilgard P, Gane E, Blanc JF, et al. Sorafenib in advanced hepatocellular carcinoma. N Engl J Med. (2008) 359:378–90. doi: 10.1056/NEJMoa0708857
11. Cheng AL, Kang YK, Chen Z, Tsao CJ, Qin S, Kim JS, et al. Efficacy and safety of sorafenib in patients in the Asia-Pacific region with advanced hepatocellular carcinoma: a phase III randomised, double-blind, placebo-controlled trial. Lancet Oncol. (2009) 10:25–34. doi: 10.1016/S1470-2045(08)70285-7
12. Abou-Alfa, GK. TACE and sorafenib: a good marriage? J Clin Oncol. (2011) 29:3949–52. doi: 10.1200/JCO.2011.37.9651
13. Pawlik TM, Reyes DK, Cosgrove D, Kamel IR, Bhagat N, Geschwind JF. Phase II trial of sorafenib combined with concurrent transarterial chemoembolization with drug-eluting beads for hepatocellular carcinoma. J Clin Oncol. (2011) 29:3960–7. doi: 10.1200/JCO.2011.37.1021
14. Kudo M, Ueshima K, Ikeda M, Torimura T, Tanabe N, Aikata H, et al. Randomised, multicentre prospective trial of transarterial chemoembolisation (TACE) plus sorafenib as compared with TACE alone in patients with hepatocellular carcinoma: TACTICS trial. Gut. (2019) 69:1492–501. doi: 10.1136/gutjnl-2019-318934
15. Lencioni R, Llovet JM, Han G, Tak WY, Yang J, Guglielmi A, et al. Sorafenib or placebo plus TACE with doxorubicin-eluting beads for intermediate stage HCC: the SPACE trial. J Hepatol. (2016) 64:1090–8. doi: 10.1016/j.jhep.2016.01.012
16. Meyer T, Fox R, Ma YT, Ross PJ, James MW, Sturgess R, et al. Sorafenib in combination with transarterial chemoembolisation in patients with unresectable hepatocellular carcinoma (TACE 2): a randomised placebo-controlled, double-blind, phase 3 trial. Lancet Gastroenterol Hepatol. (2017) 2:565–75. doi: 10.1016/S2468-1253(17)30156-5
17. Bruix J, Reig M, Sherman M. Evidence-based diagnosis staging, and treatment of patients with hepatocellular carcinoma. Gastroenterology. (2016) 150:835–53. doi: 10.1053/j.gastro.2015.12.041
18. Kudo, M. Proposal of primary endpoints for TACE combination trials with systemic therapy: lessons learned from 5 negative trials and the positive TACTICS trial. Liver Cancer. (2018) 7:225–34. doi: 10.1159/000492535
19. Zhong BY, Ni CF, Chen L, Zhu HD, Teng GJ. Early sorafenib-related biomarkers for combination treatment with transarterial chemoembolization and sorafenib in patients with hepatocellular carcinoma. Radiology. (2017) 284:583–92. doi: 10.1148/radiol.2017161975
20. Reig M, Torres F, Rodriguez-Lope C, Forner A, LLarch N, Rimola J, et al. Early dermatologic adverse events predict better outcome in HCC patients treated with sorafenib. J Hepatol. (2014) 61:318–24. doi: 10.1016/j.jhep.2014.03.030
22. Litjens G, Kooi T, Bejnordi BE, Setio AAA, Ciompi F, Ghafoorian M, et al. A survey on deep learning in medical image analysis. Med Image Anal. (2017) 42:60–88. doi: 10.1016/j.media.2017.07.005
23. Kermany DS, Goldbaum M, Cai WJ, Valentim CCS, Liang HY, Baxter SL, et al. Identifying medical diagnoses and treatable diseases by image-based deep learning. Cell. (2018) 172:1122–31.e9. doi: 10.1016/j.cell.2018.02.010
24. Xu X, Zhang HL, Liu QP, Sun SW, Zhang J, Zhu FP, et al. Radiomic analysis of contrast-enhanced CT predicts microvascular invasion and outcome in hepatocellular carcinoma. J Hepatol. (2019) 70:1133–44. doi: 10.1016/j.jhep.2019.02.023
25. Xia W, Gao X. A fast deformable registration method for 4D lung CT in hybrid framework. Int J Comput Assist Radiol Surg. (2014) 9:523–33. doi: 10.1007/s11548-013-0960-1
26. Huang G, Liu Z, van der Maaten L, Weinberger KQ. Densely connected convolutional networks. Proceedings of the 30th IEEE Conference on Computer Vision and Pattern Recognition (Cvpr 2017). Honolulu, HI: IEEE (2017). p. 2261–9. doi: 10.1109/Cvpr.2017.243
27. Peng HC, Long FH, Ding C. Feature selection based on mutual information: criteria of max-dependency, max-relevance, and min-redundancy. IEEE Trans Pattern Anal. (2005) 27:1226–38. doi: 10.1109/Tpami.2005.159
28. Zou H, Hastie T. Regularization and variable selection via the elastic net (vol B 67, pg 301, 2005). J R Stat Soc B. (2005) 67:768. doi: 10.1111/j.1467-9868.2005.00527.x
29. Zhou B, Khosla A, Lapedriza A, Oliva A, Torralba A. Learning deep features for discriminative localization. Proceedings of the 2016 IEEE Conference on Computer Vision and Pattern Recognition (CVPR). Las Vegas, NV: IEEE (2016). p. 2921–9. doi: 10.1109/Cvpr.2016.319
30. Sauerbrei W, Boulesteix AL, Binder H. Stability investigations of multivariable regression models derived from low- and high-dimensional data. J Biopharm Stat. (2011) 21:1206–31. doi: 10.1080/10543406.2011.629890
31. Newson, R. Confidence intervals for rank statistics: Somers’ D and extensions. Stata J. (2006) 6:309–34. doi: 10.1177/1536867x0600600302
32. Bernal W, Wang Y, Maggs J, Willars C, Sizer E, Auzinger G, et al. Development and validation of a dynamic outcome prediction model for paracetamol-induced acute liver failure: a cohort study. Lancet Gastroenterol Hepatol. (2016) 1:217–25. doi: 10.1016/S2468-1253(16)30007-3
33. Park JW, Kim YJ, Kim DY, Bae SH, Paik SW, Lee YJ, et al. Sorafenib with or without concurrent transarterial chemoembolization in patients with advanced hepatocellular carcinoma: the phase III STAH trial. J Hepatol. (2019) 70:684–91. doi: 10.1016/j.jhep.2018.11.029
34. Kudo M, Imanaka K, Chida N, Nakachi K, Tak WY, Takayama T, et al. Phase III study of sorafenib after transarterial chemoembolisation in Japanese and Korean patients with unresectable hepatocellular carcinoma. Eur J Cancer. (2011) 47:2117–27. doi: 10.1016/j.ejca.2011.05.007
35. Ji J, Shi J, Budhu A, Yu Z, Forgues M, Roessler S, et al. MicroRNA expression survival, and response to interferon in liver cancer. N Engl J Med. (2009) 361:1437–47. doi: 10.1056/NEJMoa0901282
36. Riaz A, Ryu RK, Kulik LM, Mulcahy MF, Lewandowski RJ, Minocha J, et al. Alpha-fetoprotein response after locoregional therapy for hepatocellular carcinoma: oncologic marker of radiologic response progression, and survival. J Clin Oncol. (2009) 27:5734–42. doi: 10.1200/JCO.2009.23.1282
37. Zucman-Rossi J, Villanueva A, Nault JC, Llovet JM. Genetic landscape and biomarkers of hepatocellular carcinoma. Gastroenterology. (2015) 149:1226–39.e4. doi: 10.1053/j.gastro.2015.05.061
38. Hoshida Y, Moeini A, Alsinet C, Kojima K, Villanueva A. Gene signatures in the management of hepatocellular carcinoma. Semin Oncol. (2012) 39:473–85. doi: 10.1053/j.seminoncol.2012.05.003
39. Friemel J, Rechsteiner M, Frick L, Bohm F, Struckmann K, Egger M, et al. Intratumor heterogeneity in hepatocellular carcinoma. Clin Cancer Res. (2015) 21:1951–61. doi: 10.1158/1078-0432.CCR-14-0122
40. Zhao Y, Li H, Bai W, Liu J, Lv W, Sahu S, et al. Early sorafenib-related adverse events predict therapy response of TACE plus sorafenib: a multicenter clinical study of 606 HCC patients. Int J Cancer. (2016) 139:928–37. doi: 10.1002/ijc.30124
41. Trevisani F, Golfieri R. Lipiodol transarterial chemoembolization for hepatocellular carcinoma: where are we now? Hepatology. (2016) 64:23–5. doi: 10.1002/hep.28554
42. Hosny A, Parmar C, Coroller TP, Grossmann P, Zeleznik R, Kumar A, et al. Deep learning for lung cancer prognostication: a retrospective multi-cohort radiomics study. PLoS Med. (2018) 15:e1002711. doi: 10.1371/journal.pmed.1002711
43. Peng H, Dong D, Fang MJ, Li L, Tang LL, Chen L, et al. Prognostic value of deep learning PET/CT-based radiomics: potential role for future individual induction chemotherapy in advanced nasopharyngeal carcinoma. Clin Cancer Res. (2019) 25:4271–9. doi: 10.1158/1078-0432.CCR-18-3065
44. Kickingereder P, Isensee F, Tursunova I, Petersen J, Neuberger U, Bonekamp D, et al. Automated quantitative tumour response assessment of MRI in neuro-oncology with artificial neural networks: a multicentre, retrospective study. Lancet Oncol. (2019) 20:728–40. doi: 10.1016/S1470-2045(19)30098-1
45. Asayama Y, Yoshimitsu K, Irie H, Nishihara Y, Aishima S, Tajima T, et al. Poorly versus moderately differentiated hepatocellular carcinoma: vascularity assessment by computed tomographic hepatic angiography in correlation with histologically counted number of unpaired arteries. J Comput Assist Tomogr. (2007) 31:188–92. doi: 10.1097/01.rct.0000236417.82395.57
46. El-Assal ON, Yamanoi A, Soda Y, Yamaguchi M, Igarashi M, Yamamoto A, et al. Clinical significance of microvessel density and vascular endothelial growth factor expression in hepatocellular carcinoma and surrounding liver: possible involvement of vascular endothelial growth factor in the angiogenesis of cirrhotic liver. Hepatology. (1998) 27:1554–62. doi: 10.1002/hep.510270613
47. Wang Q, Xia D, Bai W, Wang E, Sun J, Huang M, et al. Development of a prognostic score for recommended TACE candidates with hepatocellular carcinoma: a multicentre observational study. J Hepatol. (2019) 70:893–903. doi: 10.1016/j.jhep.2019.01.013
48. Han G, Berhane S, Toyoda H, Bettinger D, Elshaarawy O, Chan AWH, et al. Prediction of survival among patients receiving transarterial chemoembolization for hepatocellular carcinoma: a response-based approach. Hepatology. (2019) 72:198–212. doi: 10.1002/hep.31022
49. Zhou L, Wang SB, Chen SG, Qu Q, Rui JA. Prognostic value of ALT AST, and AAR in hepatocellular carcinoma with B-type hepatitis-associated cirrhosis after radical hepatectomy. Clin Lab. (2018) 64:1739–47. doi: 10.7754/Clin.Lab.2018.180532
Keywords: hepatocellular carcinoma, transarterial chemoembolization, sorafenib, deep learning, biomarker
Citation: Zhang L, Xia W, Yan Z-P, Sun J-H, Zhong B-Y, Hou Z-H, Yang M-J, Zhou G-H, Wang W-S, Zhao X-Y, Jian J-M, Huang P, Zhang R, Zhang S, Zhang J-Y, Li Z, Zhu X-L, Gao X and Ni C-F (2020) Deep Learning Predicts Overall Survival of Patients With Unresectable Hepatocellular Carcinoma Treated by Transarterial Chemoembolization Plus Sorafenib. Front. Oncol. 10:593292. doi: 10.3389/fonc.2020.593292
Received: 10 August 2020; Accepted: 14 September 2020;
Published: 30 September 2020.
Edited by:
Zaiyi Liu, Guangdong Provincial People’s Hospital, ChinaCopyright © 2020 Zhang, Xia, Yan, Sun, Zhong, Hou, Yang, Zhou, Wang, Zhao, Jian, Huang, Zhang, Zhang, Zhang, Li, Zhu, Gao and Ni. This is an open-access article distributed under the terms of the Creative Commons Attribution License (CC BY). The use, distribution or reproduction in other forums is permitted, provided the original author(s) and the copyright owner(s) are credited and that the original publication in this journal is cited, in accordance with accepted academic practice. No use, distribution or reproduction is permitted which does not comply with these terms.
*Correspondence: Xin Gao, eGluZ2Fvc2FtQHlhaG9vLmNvbQ==; Cai-Fang Ni, Y2pyLm5pY2FpZmFuZ0B2aXAuMTYzLmNvbQ==; c3puY2ZAc3VkYS5lZHUuY24=
†These authors have contributed equally to this work and share first authorship
Disclaimer: All claims expressed in this article are solely those of the authors and do not necessarily represent those of their affiliated organizations, or those of the publisher, the editors and the reviewers. Any product that may be evaluated in this article or claim that may be made by its manufacturer is not guaranteed or endorsed by the publisher.
Research integrity at Frontiers
Learn more about the work of our research integrity team to safeguard the quality of each article we publish.