 Hao Gu
 Xu Zhang
 Paolo di Russo2
 Tao Xu
94% of researchers rate our articles as excellent or good
Learn more about the work of our research integrity team to safeguard the quality of each article we publish.
Find out more
REVIEW article
Front. Oncol. , 27 October 2020
Sec. Neuro-Oncology and Neurosurgical Oncology
Volume 10 - 2020 | https://doi.org/10.3389/fonc.2020.567736
This article is part of the Research Topic Meningioma: From Basic Research to Clinical Translational Study View all 40 articles
Meningiomas are the most common primary tumors of the central nervous system. Given the fact that the majority of meningiomas are benign, the preoperative risk stratification and treatment strategy decision-making highly rely on the conventional subjective radiologic evaluation. However, this traditional diagnostic and treatment modality may not be effective in patients with aggressive-growing tumors or symptomatic patients with potential risk of recurrence after surgical resection or radiotherapy, as this passive “wait and see” strategy could miss the optimal opportunity of intervention. Radiomics, a new rising discipline, translates high-dimensional image information into abundant mathematical data by multiple computational algorithms. It provides an objective and quantitative approach to interpret the imaging data, rather than the subjective and qualitative interpretation from relatively limited human visual observation. In fact, the enormous amount of information generated by radiomics analyses provides radiological to histopathological tumor information, which are visually imperceptible, and offers technological basis to its applications amid diagnosis, treatment, and prognosis. Here, we review the latest advancements of radiomics and its applications in the prediction of the pathological grade, pathological subtype, recurrence possibility, and differential diagnosis of meningiomas, and the potential and challenges in general clinical applications. In this review, we highlight the generalization of shared radiomic features among different studies and compare different performances of popular algorithms. At last, we discuss several possible aspects of challenges and future directions in the development of radiomic applications in meningiomas.
Meningiomas are the most common primary central nervous system (CNS) tumors, composing up to 36.4% of all CNS tumors, with an incidence of 7.86/100000 (1). The majority of meningiomas are benign (2), while only 1% are malignant (1) but with increased morbidity and mortality rates (3). According to the 2016 edition of the WHO classification of CNS tumors, meningiomas are considered as heterogeneous tumors that can be divided into three grades and 15 different pathological subtypes (4). Moreover, meningiomas may present also an intratumoral heterogeneity, such as different degrees of growing patterns, vascularization, necrosis, infiltration, etc., in the same tumor. The transformation from low-grade to high-grade meningiomas is a rare event that can happen as consequences of this intratumoral heterogeneity (5). These intertumoral and intratumoral heterogeneities can explain the different outcomes after resection of meningiomas. Thus, better understanding of the actual biological behavior of these tumors preoperatively could benefit the risk stratification and decision-making process. For example, the “wait and see” modality with a longer imaging follow-up period would be an ideal and cost-effective option in small, stable and benign meningiomas (6). On the other hand, early surgical resection should be recommended in patients with meningiomas which are small in size, but active in growing, or malignant in genotyping.
Nowadays, medical imaging plays a fundamental role in the process of preoperative and differential diagnosis in the CNS tumors such as meningiomas (7). Modern imaging technology, as 3T MRI, provides sufficient high-quality information of the lesions, such as post contrast T1-weighted images can highlight enhancing regions within the tumor because of the leakage of contrast agent from the intravascular lumen into the tumor through a disrupted blood-brain barrier (8), or the integrated use of fluid-attenuated inversion-recovery sequences and T2-weighted images to delineate a more precise boundary between edema and the solid tumor (9). Nevertheless, these data are commonly reported by the radiologist in a descriptive, qualitative, and subjective way. As a dural-based lesion, meningiomas can be misdiagnosed, especially when the radiologists are not familiar with the differential diagnosis of other dural-based lesions. For example, the “dural tail sign” on enhanced T1-weighted sequences, a characteristic imaging sign often regarded as the representative of meningiomas (10), can also be positive in other diseases including sarcoidosis (11), lymphoma (12), metastases (13–15) and other lesions (16, 17). Also, some imaging features, such as the peritumoral edema and morphological irregularity of the meningioma, which may suggest an aggressive pattern, have not been validated yet (18, 19).
Recently, some promising progresses in the preoperative diagnosis have emerged in the field of oncology, as well as in meningiomas. In this scenario, radiomics analysis refers to different methods that “decode” the quantitative features of medical images across different types of tumors. The primary intention of this technique is to identify, from radiological images, several quantitative characteristics of the tumor, so they can be used to improve the understanding of the pathology and biology of the lesion. This data are also sought to predict clinical outcomes, such as patients’ survival and responses to therapy (7). The features commonly included in this type of analysis are: volume, shape, intensity (MRI signal) and other texture features, referring to pixel intensities, their distribution pattern, and their interrelationships (20). Nowadays, the radiomics analysis has been used for various types of cancer including lung cancer (21–23) and prostate cancer (24–26). Yet, only few studies reported on radiomics analysis of meningiomas. This analysis can help in preoperative diagnosis by adding new information, such as the growth rate of an incidental meningioma, guiding the differential diagnosis of tumors with dural implantation, predicting tumors’ recurrence, and subsequently tailoring the treatment strategies. In this study, we discuss the latest application of radiomics analysis for meningiomas and the potential clinical implications of its integration in preoperative diagnosis.
Generally, the procedure of radiomics can be divided into four main steps (7, 27, 28): image acquisition, segmentation, feature extraction, and statistical analysis/model (Figure 1), but each step is somewhat different across various studies for different purposes (29).
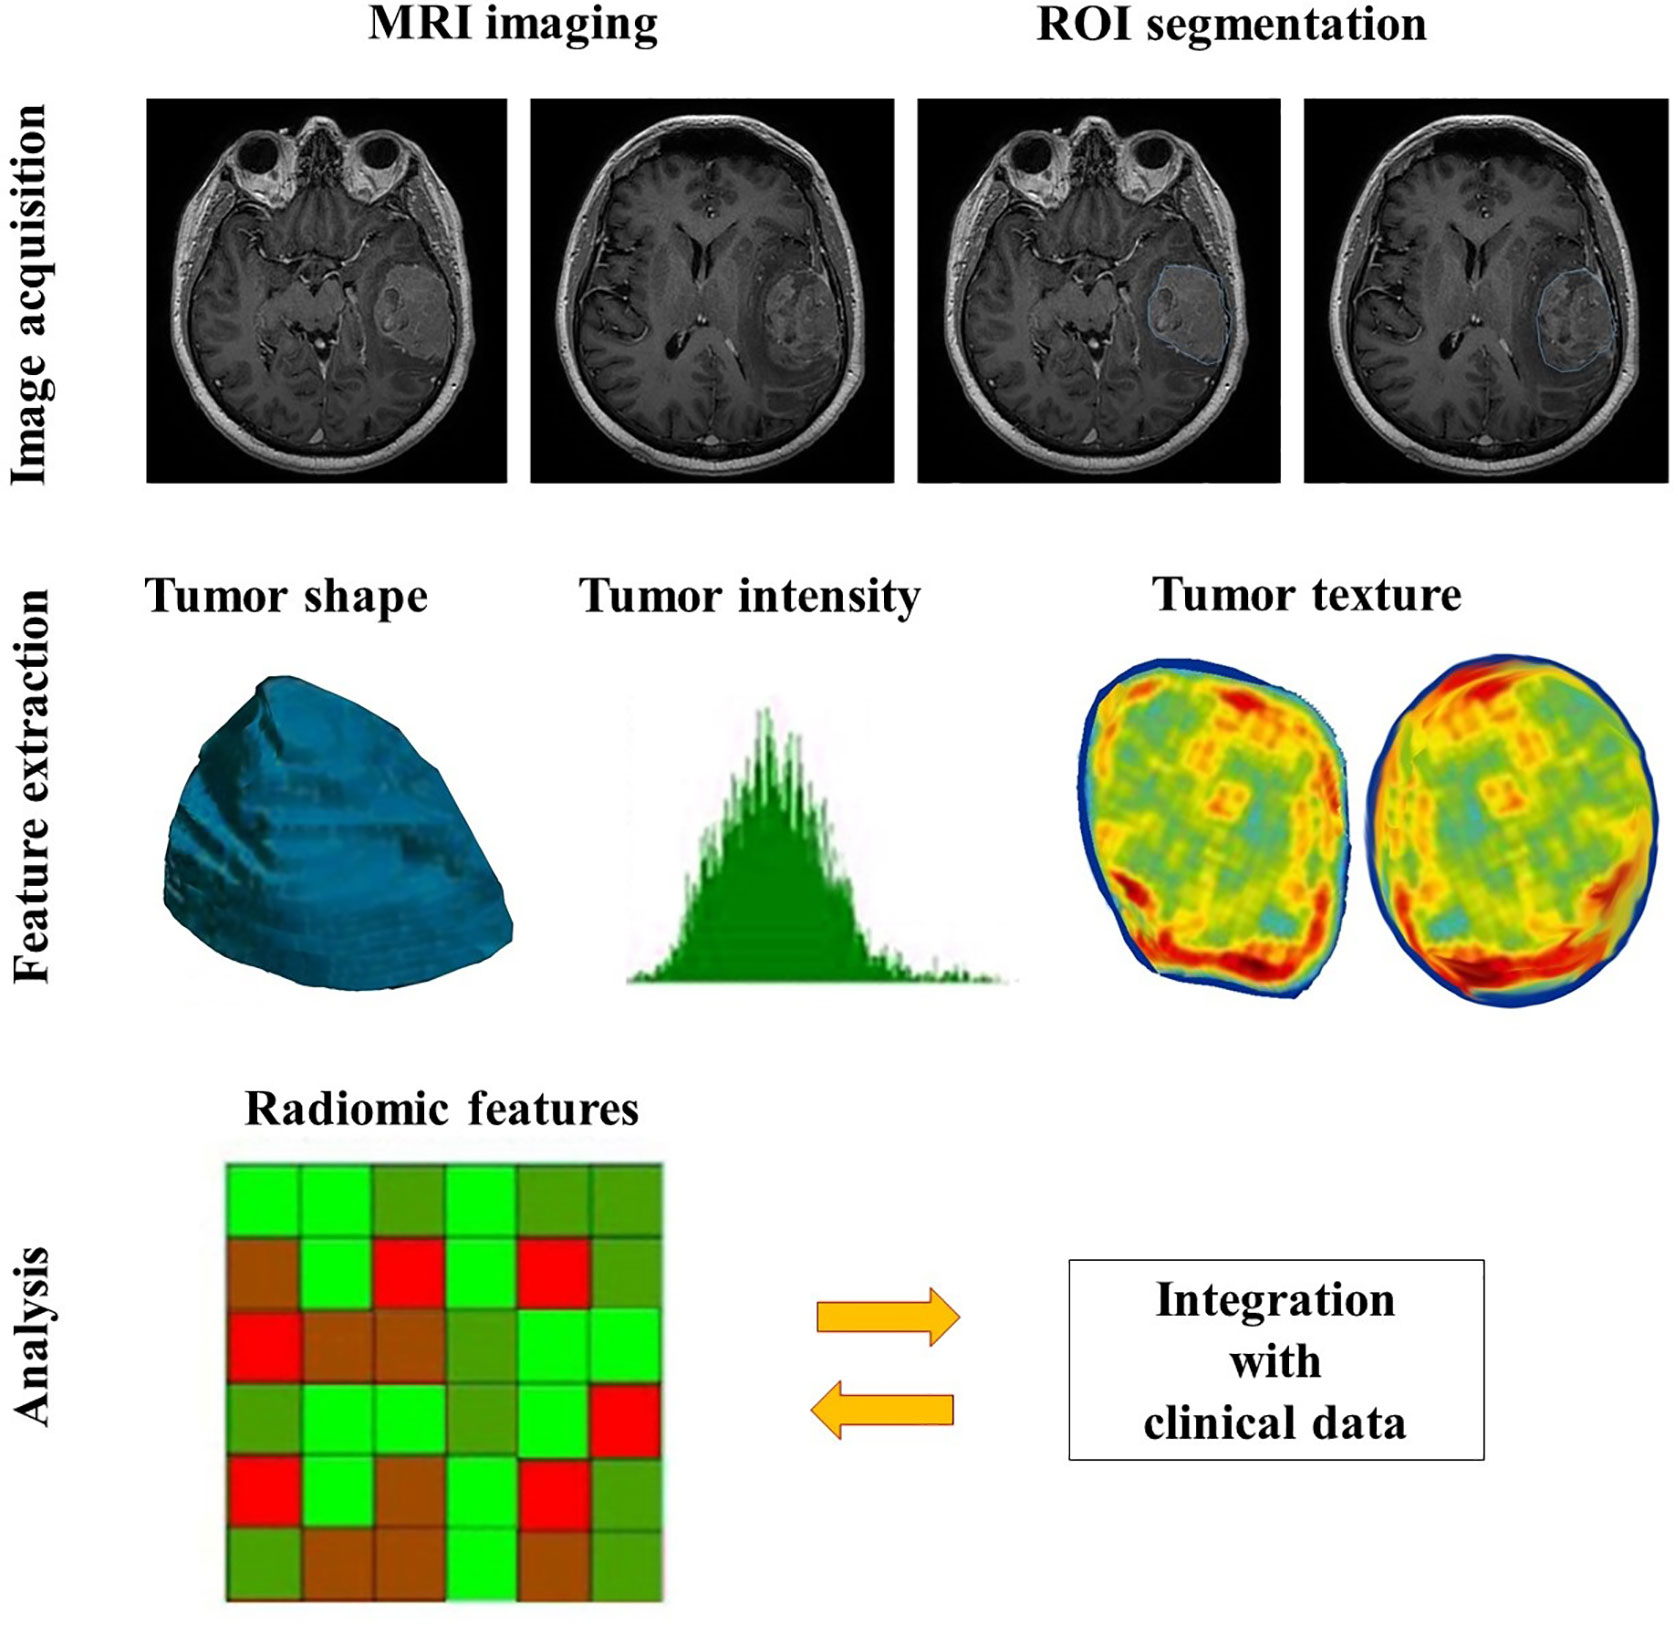
Figure 1 The general workflow of radiomics in meningiomas includes image acquisition, ROI segmentation, feature extraction and analysis.
Image acquisition is the first step of the radiomics workflow, including acquisition and reconstruction of the image data (29). Acquiring image data refers to collecting raw data with full annotations of multiple imaging parameters, such as repetition time, echo time and field of view in the MRI images, tube voltage and tube current in the CT images, etc., which can be extracted from the image software (28). Image reconstruction is the process of transforming the raw non-image-formative data into the image format by various algorithms. Because the variations in the imaging scanners, modalities, sequences, parameters, and reconstruction algorithms are likely to impact on the results of the final analysis, it is necessary to provide quantitative imaging with error bars or standardizing the original image data to improve the homogeneity (29).
The second step contains identification and segmentation of the region of interest (ROI), either manually, automatically or semi-automatically. In clinical settings, meningiomas are usually manually delineated by experienced radiologists. Given the fact that many other types of tumor do not have distinct borders and their inside heterogeneity, the accompanying inter-user variability is an inevitable issue. There are several strategies to minimize the variability, the common one is the segmentation tools (28). The rational choice of segmentation software and double-check with vision manually can not only optimize the result but also raise the efficiency of workflow, especially when a radiologist handles hundreds of cases at the same time. Other approaches such as application of an algorithm (30) or segmenting a fixed-size ROI (31) also work in certain scenarios.
Feature extraction is to decode the high-dimension image data and output them quantitatively (29). In the present, the patterns of feature extraction can be simply classified into with or without human orders (7). The conventional way needs specialized algorithms under human instructions. While the newer mode can nearly complete the rest of the whole task automatically and independently from human aids, which is based on the deep learning radiomics (DLR), such as convolutional neural networks (CNNs). Moreover, the number of extracted features within the CNNs is several orders of magnitude greater than the conventional methods (7), but it is necessary to reduce the feature dimensions to avoid overfitting (29). Besides, feature extraction, selection, and classification can occur across different layers in the same CNN (7).
Features in radiomics are divided into two groups, semantic and agnostic. Semantic features indicate the radiology lexicons which are commonly used to intuitively describe the lesion, such as size, location, and shape. Conversely, agnostic features are mathematically-extracted quantitative descriptors, which aim to highlight the lesion heterogeneity (29). Agnostic features can be subdivided into three categories, which are first-, second-, and higher-order. First-order statistics depict the distribution of values of individual voxels without any concerns of the spatial relationships, mostly based on the histogram, such as skewness and kurtosis. Second-order statistics describe statistical interrelationships between voxels with similar (or dissimilar) contrast values, termed as “texture” features. Higher-order statistical features are repetitive or nonrepetitive patterns filtered through specific grids on the image, for example, Laplacian transforms, Minkowski functionals, etc. (29).
In the final step, the selected features can be used for many different analyses, and they are mostly incorporated into predictive models to provide improved risk stratification (28). Model construction is the process of developing integration of a set of analysis methods, involving with clustering features and assigning these features with different values according to the predefined information content. Those analysis approaches include artificial intelligence, machine learning, and statistical methods. An ideal model can not only handle the extracted features adequately, but also is able to accommodate sparse data, for instance, genomic profiles (29). The more covariates it can handle, the more specific meaning of a model can be.
However, it would be rather difficult for an inexperienced user to make a choice among multiple algorithms for model building. This situation promotes the implementations of multiple-modelling methodology in a single study, although it may not be necessary (32). The fundamental principle of selecting an algorithm is the reproducibility of the whole process (32), which could be enhanced by a set of measures: (I) evaluate the feature reproducibility; (II) conduct the cross-correlation analysis; (III) contain clinically significant variables (volume included); (IV) warrant sufficient observation rates (at least 10–15 per feature); (V) provide an external validation cohort; (VI) interpret radiomic features of no physical (or biological) meaning with prudency (33).
Most studies using radiomic analysis in meningioma were based on the MRI, ranging from a single to multiple imaging sequences. Indeed, the MRI can provide a superior anatomical delineation (e.g. spatial location) of the intracranial structures and characterize the predominance of different physiopathological processes, due to the different sensitivity of tumor physiology in various MRI imaging sequences (8). In general, the application of radiomics in meningioma can be roughly divided into two aspects: grade prediction and other applications (Table 1). The workflow of treating meningiomas may alter based on these radiomic findings (Figure 2).
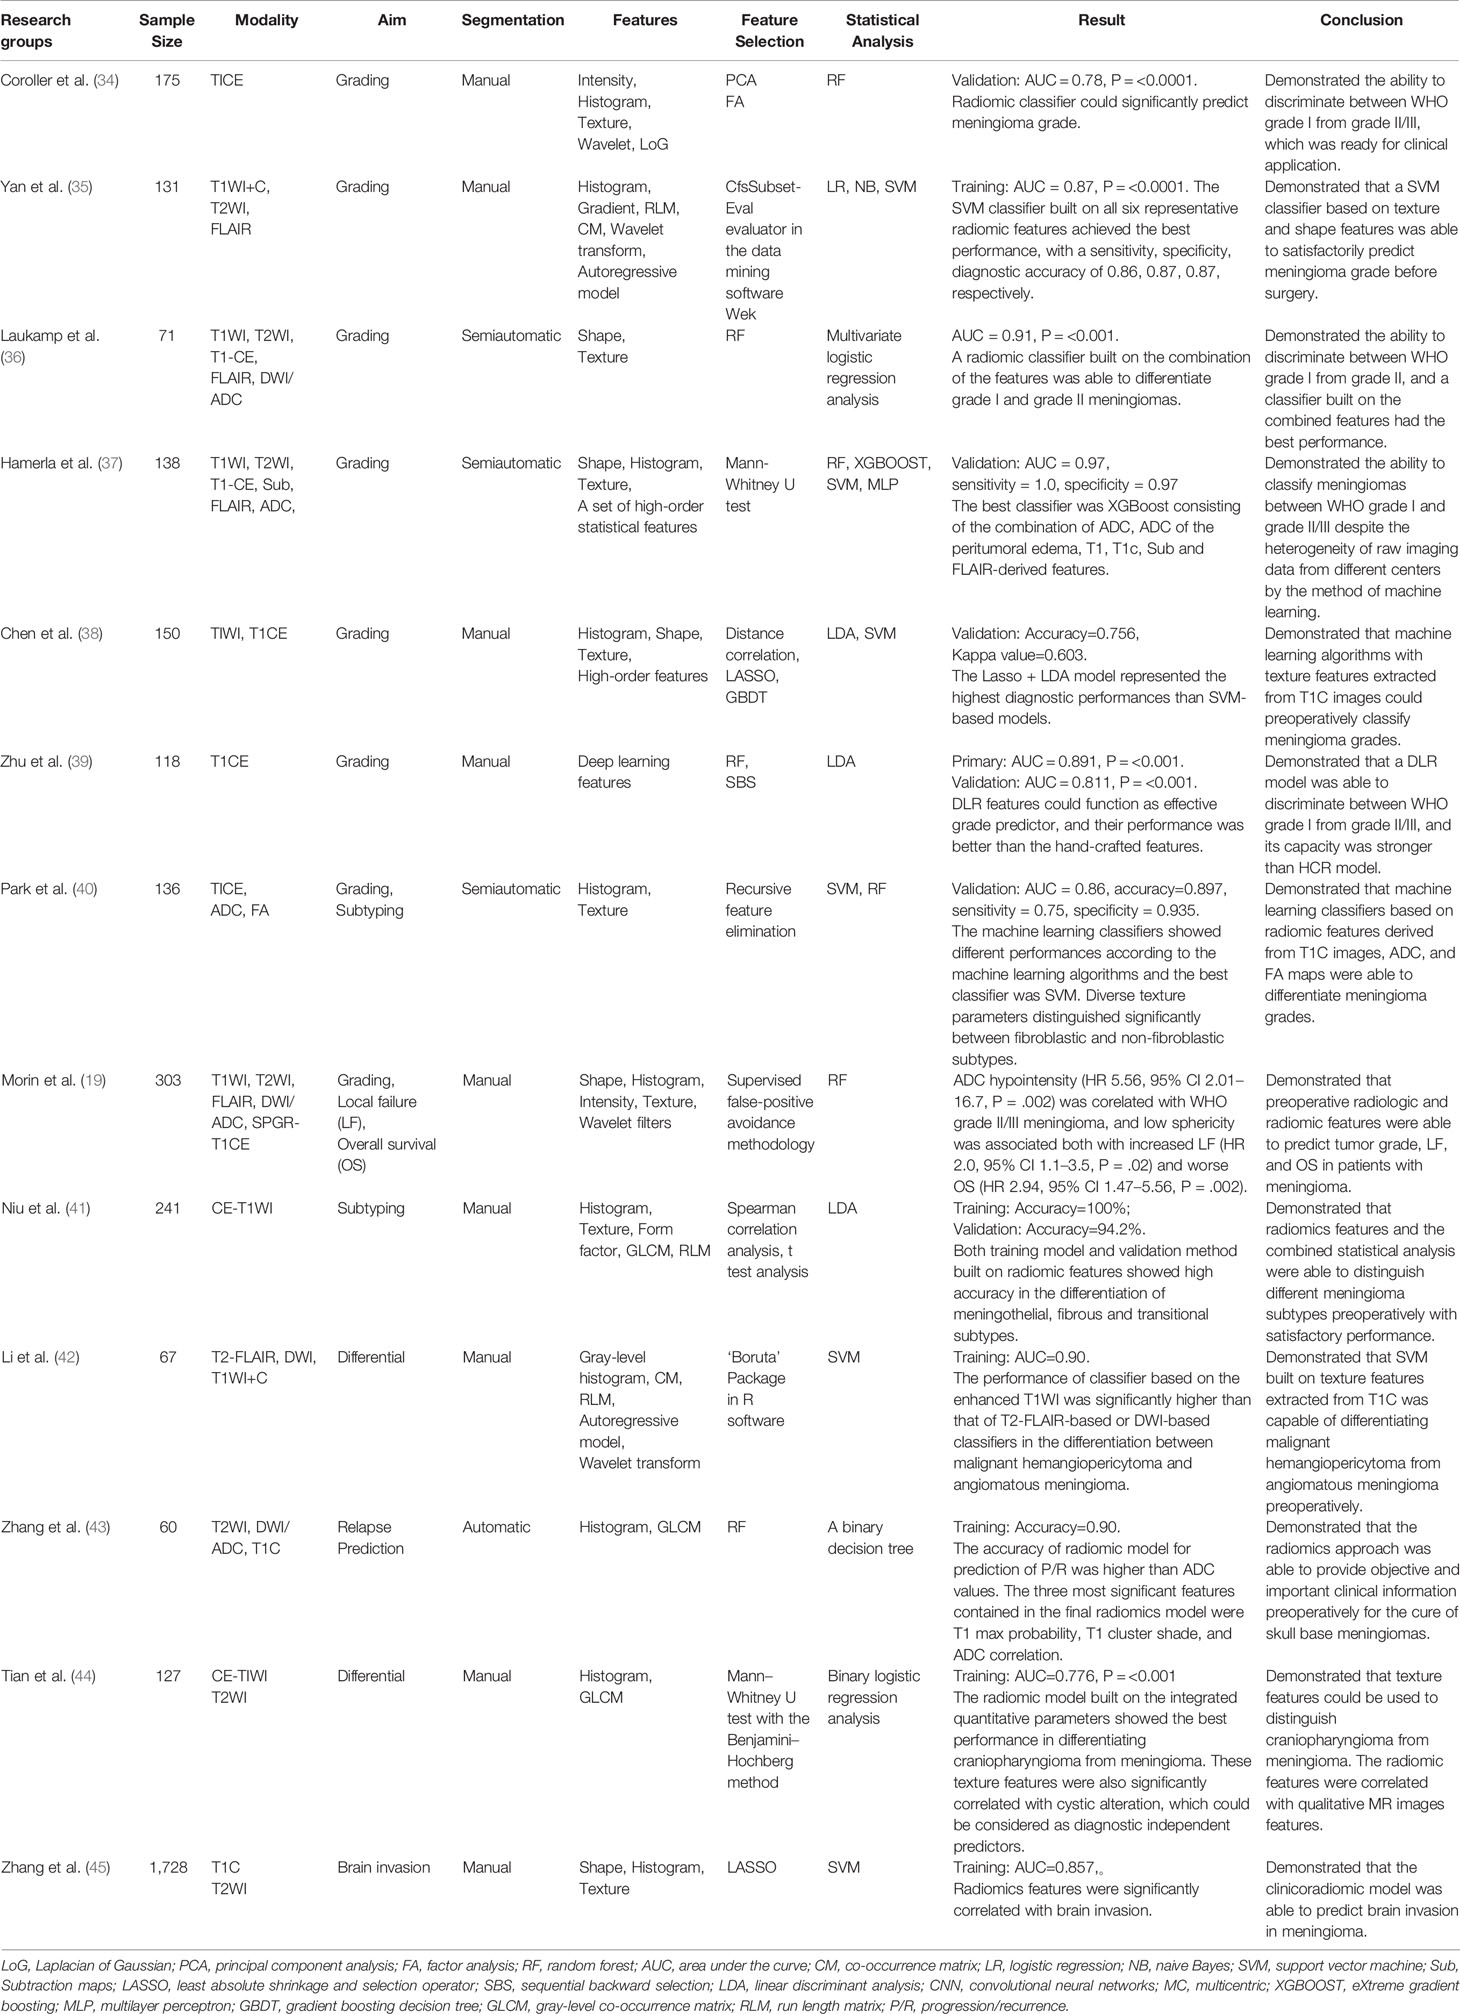
Table 1 Summary of previous reported application of radiomics in meningiomas.
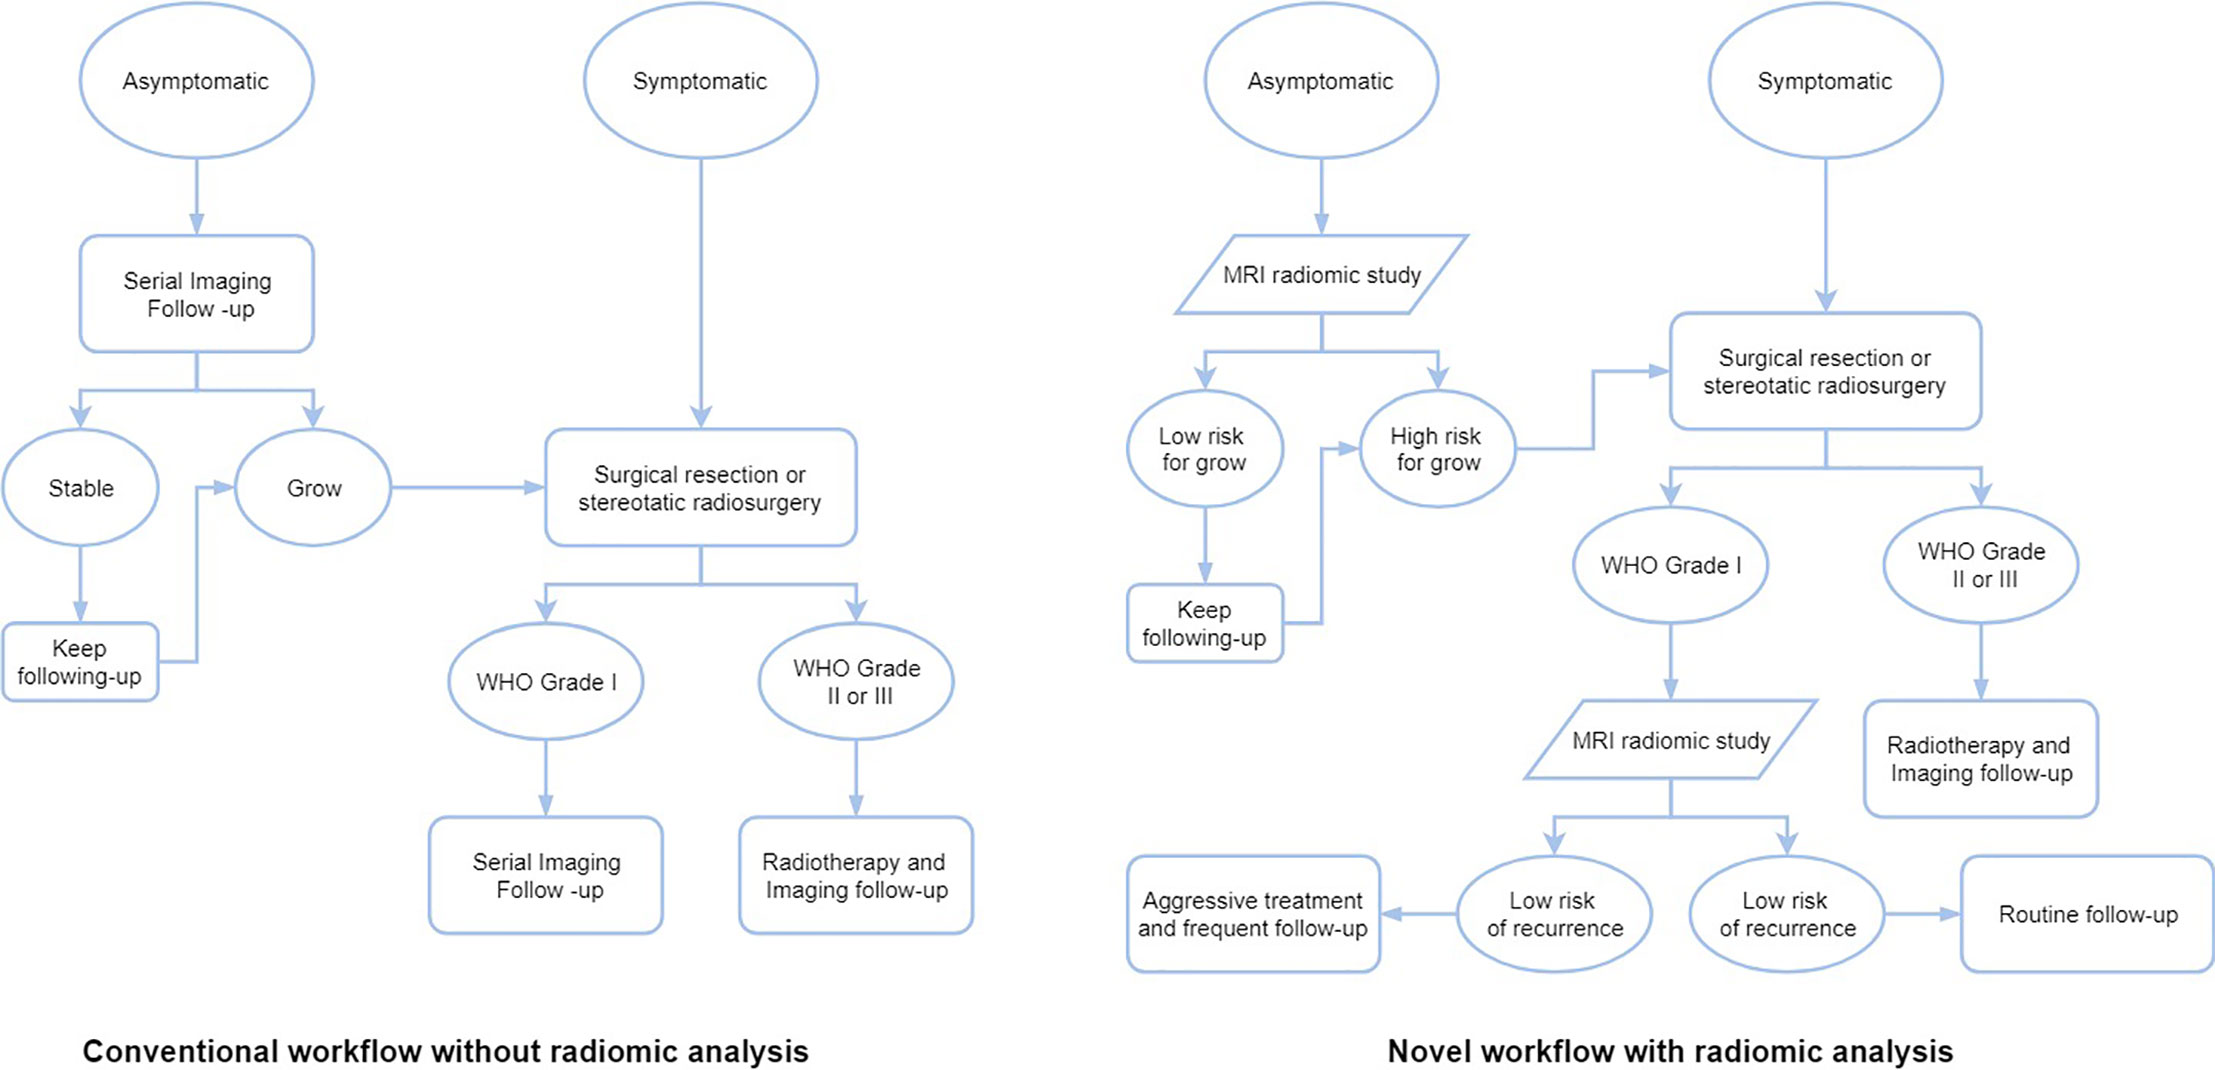
Figure 2 The workflows of different treatment strategies of meningiomas without or with radiomic analysis.
Tumor grade is a prerequisite to assess the necessity of a subsequent treatment of meningiomas. Currently, this kind of information, regarding the tumor grade, is available only after histopathologic inspection on tumor samples deriving from invasive biopsy or surgery (46). To achieve non-invasive pathological grading, the burgeoning development of radiomics has brought a new dawn in the preoperative grading prediction.
In the initial stages of radiomics analysis experimentation, multiple studies have explored the feasibility of various radiomic features in the prediction of pathological grade of meningiomas. The results showed that both conventional radiomic features, including the shape, histogram, texture, gray-level run length matrix, wavelet transform, and other higher-order statistics (19, 34–38, 40), and the DLR features (39) could predict the tumor grades. Yan et al. have identified two textural features based on the run length matrix and two shape-based features significantly related with the WHO grade II meningiomas; Similarly, in terms of the low grade meningiomas (WHO grade I), one textural feature based on run length matrix and one shape-based feature were selected (35). Zhu et al. have utilized up to 39 novel DLR features to distinguish high grade meningiomas (WHO grade II or III) from low grade ones (39). More detailed information of radiomic features applied in grade prediction and other aspects are summarized in Table 2.
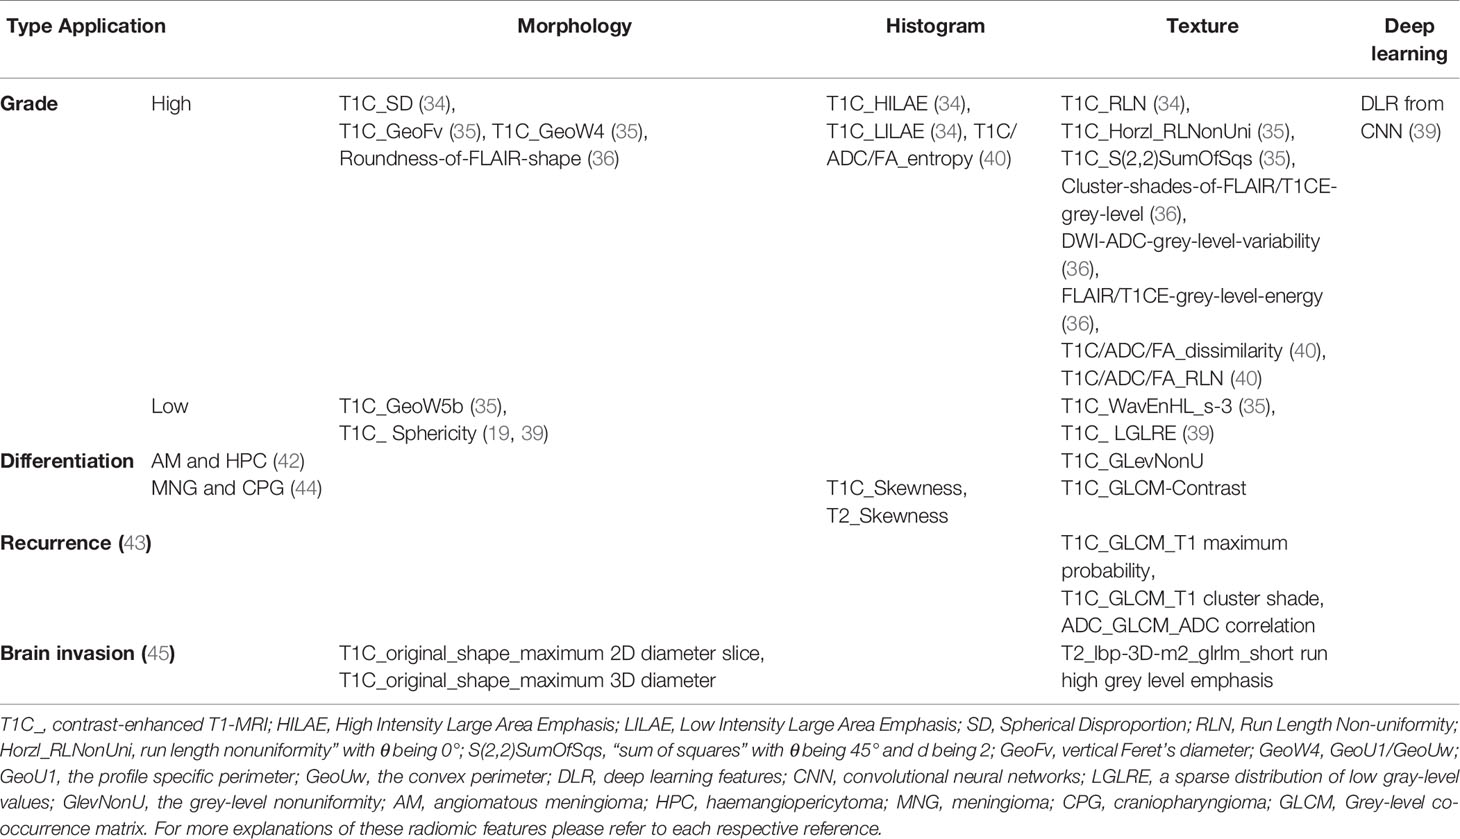
Table 2 Summary of most useful set of radiomic features applied in grade prediction and other aspects.
Notably, there are several common radiomic features across different studies regardless of their nonidentical nomenclatures (47). One radiomic feature is the sphericity, evaluating how a tumor is morphologically similar to a sphere (19, 36, 39), or spherical disproportion, rating the deviation of a lesion’s morphology from a sphere of the similar volume (34, 40). There were 5 studies explicitly demonstrating that high-grade meningiomas tend to have less sphericity than low grade meningiomas, in another word, high-grade meningiomas show more spherical disproportion than low grade ones (19, 34, 36, 39, 40). Moreover, one of these studies found that low sphericity was also associated with local recurrence and less favorable overall survival (19), which may imply that early intervention and shortening observation are warranted in meningiomas of low sphericity. The non-uniformity of the gray level or the run length matrix is another important radiomic feature, which is sensitive in reflecting the heterogeneity within the contoured area (34, 35, 38–40), such as the positive capsular enhancement, indistinguishable tumoral border, and heterogeneous tumor enhancement (46, 48). Because the fluctuance of parameters from second or higher order statistics revealed irregular changes in the gray pixels in aggressive meningiomas due to the intratumoral nonuniform structure tissue (49). Furthermore, it seems that diversified combinations of these features, such as a combination of radiomic features from different feature categories, multiple imaging sequences, heterogenous raw data or combined with qualitative imaging features or clinical data, could improve the performance of the classification models even if those improvements may not always be significant (19, 34, 37, 39).
In addition to radiomic features, the algorithm used in modeling is another critical factor affecting the performance of prediction (50). Since there has been no standardized guidance of algorithms selection yet, the selection usually depends on the preference and experience of analysts (32). At present, the classification methods presently applied for grade prediction include the random forest (RF) (19, 34, 37, 40), logistic regression (LR) (35, 36), naïve Bayes (NB) (35), support vector machine (SVM) (35, 37, 38, 40), eXtreme gradient boosting (XGBOOST) (37), multilayer perceptron (MLP) (37), and linear discriminant analysis (LDA) (38, 39) (Table 3). Among these various algorithms, numerically, the best performance of prediction was achieved in a tree-based classification algorithm, XGBOOST, which based on a combination of features derived from multiple MRI sequences and yielded a high AUC of 0.97, a sensitivity of 1.0 and a specificity of 0.97 (37). While the most widely used algorithms are the RF and SVM, the RF is an ensemble method that calculates multiple decision tree-based classifiers containing several identically distributed random independent vectors (37, 51), whereas the SVM is a non-linear classifier that iteratively constructs a hyperplane or high-dimensional feature space consisting of a series of hyperplanes that separates different classes (52, 53). There have been two studies comparing different performances of the RF and SVM, Hamerla et al. have built four different classification models, including the RF, XGBOOST, SVM, and MLP, based on same radiomic features; Their results demonstrated both RF and SVM had same AUC of 0.93 (37). However, in the study of Park et al., the SVM have shown to have a better predicting performance with an AUC of 0.86 comparing to 0.84 in the RF (40). Whereas it was contradictory in the prognosis prediction superiority between the RF and SVM in a study of lung cancer (54). Actually, the RF has a number of advantages, such as its totally non-parametric property, so that it can be used given the existence of collinearities among features (55). Furthermore, overfitting is less of a concern compared with other machine-learning methods (51). Therefore, all these characteristics make RF especially suitable for high-dimensional data analyses as radiomics, where it is impractical to strictly control all features (56).
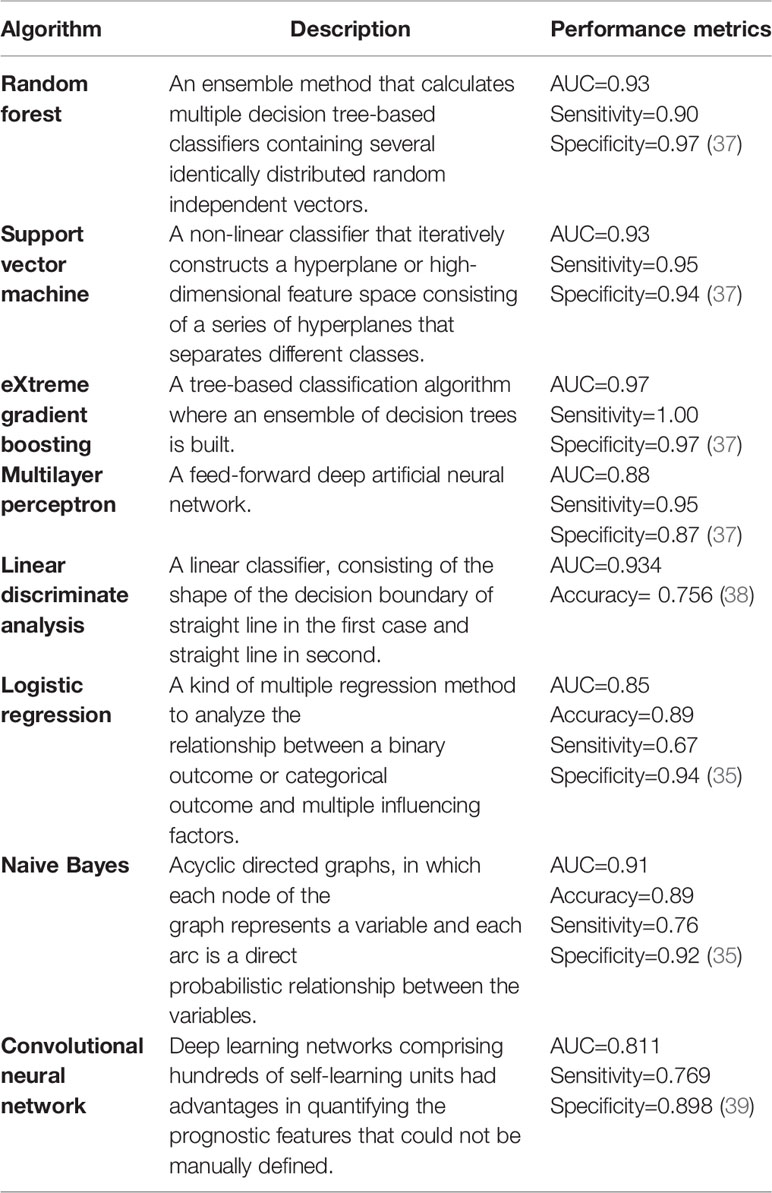
Table 3 Summary of commonly used algorithms along with their performance metrics.
Besides, there was also a comparison study between the SVM and LDA, in which Chen et al. had shown that a LDA-based model displayed an AUC of 0.934 in predicting the WHO grade I meningiomas higher than that of 0.845 in a SVM-based model (38). Both of them are regarded as the top pattern recognition technology, functioning obeying to two different working principles (57). Whereas in the non-linear attribute of the SVM, the LDA is a linear classifier which means the shape of the decision boundary of LDA is a straight line, or a plane different from that of curved lines, or a surface in SVM (57). Additionally, when comparing the classification algorithms, their comparison also contained the selection method, and their results indicated that the modeling algorithms may weigh more than that used in feature selection processes in the aspect of increasing the diagnostic performances (38). As for the LR and NB, it is imperative to pay attention to their inherent limitations, including the independence assumption to features of the LR and the request for feature discretization in the NB (32). The novel machine learning method, MLP, which had also been utilized in modeling, though not the best, exhibited a predicting performance of 0.88 (37). Moreover, another deep learning method, convolutional neural network has been implemented in the process of feature extraction; Instead of modeling, it provided a better predictive performance than the hand-crafted features (39).
Radiomics analysis has also shown to be predictive in other aspects of meningiomas, like subtypes identification, differential diagnosis, recurrence prediction and brain invasion. Niu et al. have extracted 385 radiomic features from the T1C images of 241 patients and built a Fisher discriminant analysis model which successfully distinguished subtypes of meningothelial, fibrous, and transitional meningiomas yielding a perfect accuracy of 100% with an as high accuracy of the validation model as 94.2% (41). Another study also reported that there were significant differences in various texture features derived from the T1C, ADC, and FA parameters between the fibroblastic and nonfibroblastic pathological subtypes, without establishing a radiomic model (40).
Regarding the differential diagnosis, a study has constructed three SVM classifiers based on texture features respectively derived from the T2-FLAIR, DWI and enhanced T1WI sequences to compare their capacities in differentiating malignant hemangiopericytomas from angiomatous meningiomas. Their results indicated that the enhanced T1WI-based classifier (AUC = 0.90) had significantly better performance than the T2-FLAIR-based and DWI-based classifiers (42). Specifically, a recent study has selected three independent imaging predictors, including skewness, contrast on the contrast-enhanced images, and skewness derived from the T2WI to distinguish craniopharyngiomas and meningiomas, and the binary logistic regression model built on the three integrated radiomic features achieved an AUC of 0.776. Moreover, it was also discovered that these texture features were significantly related with the cystic alteration which was found as the only independent diagnostic predictor in qualitative imaging features in their research (44).
Regarding the relapse prediction, a study has extracted 99 radiomic features from the T2WI, DWI, and T1C and has filtered the three most significant parameters as the T1 max probability, T1 cluster shade, and ADC correlation in predicting the recurrence of skull base meningiomas. The accuracy of predicting recurrence in their binary decision tree model, which was founded on these three features, was 0.90 higher than that of the other model based on ADC values (43). Besides, there was a study with a relatively large multi-institution sample size, composed of 303 patients revealed that the low sphericity was associated with not only the increased local recurrence but also worse overall survival; The integrated RF model combining radiomic, radiologic, and clinical features showed an AUC of 0.75 and 0.78 in predicting local recurrence and overall survival, respectively (19).
More recently, a multicenter study has shown that radiomic features have the potential of preoperatively predicting brain invasion in meningioma (45). They have built a SVM model derived from the T1C and T2 MRI sequences and yielded an AUC of 0.819. What’s more, the clinicoradiomic model integrating radiomic features and sex information exhibited the best predictive performance (AUC=0.857).
As radiomics is still in its initial phase of application in meningiomas, there are still many drawbacks to overcome in its whole process. Currently, most radiomics studies in meningiomas were designed as unicentric and retrospective studies which can lead to selection bias (19, 36–40, 42, 43, 58). Another prominent issue is the lack of high-quality raw data, which manifested mainly as the significant heterogeneity of patient cohorts or imaging data and small sample sizes (28, 29). A wide variety in the overall staging of patients may be a confounding factor since staging itself is usually of prognostic significance (28). The heterogeneity of the original data can introduce changes that may be not due to the underlying biological effects (29). Small sample sizes can increase both statistical error rates and the risk of overfitting (28). There is not only a lack of original data, also an insufficient utilization, as quite many studies only used a portion of the imaging data; For example, in some study, only the enhancing sequences were selected rather than all sequences of MRI (40), or features were extracted from a series of consecutive slices instead of all slices (39).
Beyond these limitations in designing and imaging acquisition, there are some considerable problems in the rest of the procedure, especially in the segmentation process (29). To date, most meningiomas radiomics studies have based on manual segmentation, which can lead to greater inter-observer variations. Although the assistance of segmentation software or DLR can reduce the difference, whether the timely update of these assistive tools can be achieved is another challenge. Besides, the time cost of manual delineation is also an important consideration especially when an operator is facing hundreds of patients simultaneously (7). The conventional manual feature extraction relies on predefined algorithms designated for specific imaging characteristics. As different extraction techniques and software were chosen, different results of features were generated which apparently could lead to bias in the results (7, 59). All these changes can impact on the reproducibility of the features, which unfortunately, directly determines the generalization of the research conclusion (7, 28). Consequently, with the advanced imaging modalities continuously emerging, the need of autonomic learning algorithms with the capacity of handling integrated multiparametric imaging data is increasingly urgent (60). Likewise, at the final stage of the radiomics workflow, the requirement for constantly improved models is also increasing. Lots of studies have to face the problems from over-simple correlation analyses, such as contradictory conclusions of similar situations from different researchers or the risk of overfitting or underfitting (7), the insufficient interpretation of the data, and the lack of machine learning or other advanced statistical analysis methods (38, 43).
Above all, all the variations in the aforementioned steps call for the standardization or the guideline of the detailed implementation procedure of the radiomics workflow in different situations. In the meantime, the boundary of data sharing among different institutions is still vague, and it is necessary to establish and improve relevant laws and regulations.
As the capability and potential of radiomics are increasingly revealed, many different aspects still merit future developments.
The curation of big data plays a prerequisite role in the efficacy and efficiency of radiomics. Generally, from a biopsychosocial view, big data related to radiomics should not only include imaging data but also involve demographics and social networks. This seemingly insignificant information reflects the compliance of meningioma patients under surveillance having a prognostic value, which should be taken into consideration during the model building, especially in meningiomas suspicious of malignancy. Furthermore, radiomics has shown its application in the prediction of genomics, proteomics or other biology–omics. The integration of those different datasets also places requirements of curation. Specifically, the annotations of imaging data currently often do not use a standard lexicon, this hinders efficient utilization of data (29). Also, given the fact that the majority of present radiomics studies are retrospective, prospectively collected imaging data is in urgent need. This situation requires radiologists and clinicians to actively participate in the beginning period of data gathering rather than merely in later analysis.
DLR analysis has shown its powerful advantages compared to the conventional radiomics demonstrating as automatic operation, full exploitation of data, free of manual variance, low labor-consuming, etc. However, there is still a range of gaps for the DLR to overcome. The DLR eagers to embrace big datasets equipped with millions of images for the requirement of training, because the high-quality training data is directly related with better performance of the DLR (61). The cost of the computational infrastructure of the DLR is another bottleneck that appeals to data scientists to contribute more efforts (62). Interestingly, on one hand, scientists put great expectations on the future of the DLR, on the other hand, they have not completely understood how deep learning works yet, namely as the fear of ‘black box’ (63). In a word, DLR is a double-edged sword which enlightens us with its intelligence except for careful trust.
The development of radiomics owes to the devotion of both clinical and technical investigators. This new discipline shows a continuous progression, together with a mutual competition between those two sides of the research. Indeed, conventionally separated, these two aspects of research are used to analyze problems from their own perspective, overcoming the benefits of the other. This condition may explain the existence of simple correlations between imaging features and clinical significance, regardless of methodological disadvantages, or the pursuit of novel methodology while neglecting the clinical significance (7). Indeed, the thrive of radiomics does not only rely on balancing the interdisciplinary contradiction, it also demands the expansion of the collaboration, including the introduction of data source, enhancement in data sharing, renewing, and accessibility.
Radiomics analysis for meningiomas is a promising new area of research based on the development of computational advances. The current correlation is mainly between the imaging phenotypes and meningioma grades. With overcoming limitations in the process of the radiomics analysis, there will be a vast expansion of its applications in meningiomas, varying from risk stratification, to precise diagnosis, prognosis, and therapy.
Conception or design of the work: HG and TX. Drafting the paper: HG, XuZ, and PR. Revising it critically for important intellectual content: XiZ and TX. Provide approval for publication of the content. All authors contributed to the article and approved the submitted version.
This work was financially supported by the National Natural Science Foundation of China (No.81472354, TX), Shanghai Outstanding Young Physician Program (TX).
The authors declare that the research was conducted in the absence of any commercial or financial relationships that could be construed as a potential conflict of interest.
1. Ostrom QT, Gittleman H, Fulop J, Liu M, Blanda R, Kromer C, et al. CBTRUS Statistical Report: Primary Brain and Central Nervous System Tumors Diagnosed in the United States in 2008-2012. Neuro Oncol (2015) 17(Suppl 4):v1–v62. doi: 10.1093/neuonc/nov189
2. Herscovici Z, Rappaport Z, Sulkes J, Danaila L, Rubin G. Natural history of conservatively treated meningiomas. Neurology (2004) 63(6):1133–4. doi: 10.1212/01.WNL.0000138569.45818.50
3. Bi WL, Mei Y, Agarwalla PK, Beroukhim R, Dunn IF. Genomic and Epigenomic Landscape in Meningioma. Neurosurg Clin N Am (2016) 27(2):167–79. doi: 10.1016/j.nec.2015.11.009
4. Louis DN, Perry A, Reifenberger G, von Deimling A, Figarella-Branger D, Cavenee W, et al. The 2016 World Health Organization Classification of Tumors of the Central Nervous System: a summary. Acta Neuropathol (2016) 131(6):803–20. doi: 10.1007/s00401-016-1545-1
5. Bi WL, Greenwald NF, Abedalthagafi M, Wala J, Gibson WJ, Agarwalla PK, et al. Genomic landscape of high-grade meningiomas. NPJ Genom Med (2017) 2(1):26. doi: 10.1038/s41525-017-0023-6
6. Huttner HB, Bergmann O, Salehpour M, Cheikh RE, Nakamura M, Tortora A, et al. Meningioma growth dynamics assessed by radiocarbon retrospective birth dating. EBioMedicine (2018) 27:176–81. doi: 10.1016/j.ebiom.2017.12.020
7. Bodalal Z, Trebeschi S, Nguyen-Kim TDL, Schats W, Beets-Tan R. Radiogenomics: bridging imaging and genomics. Abdom Radiol (NY) (2019) 44(6):1960–84. doi: 10.1007/s00261-019-02028-w
8. Zhou M, Scott J, Chaudhury B, Hall L, Goldgof D, Yeom KW, et al. Radiomics in Brain Tumor: Image Assessment, Quantitative Feature Descriptors, and Machine-Learning Approaches. AJNR Am J Neuroradiol (2018) 39(2):208–16. doi: 10.3174/ajnr.A5391
9. Tsuchiya K, Inaoka S, Mizutani Y, Hachiya J. Fast fluid-attenuated inversion-recovery MR of intracranial infections. AJNR Am J Neuroradiol (1997) 18(5):909–13.
10. Guermazi A, Lafitte F, Miaux Y, Adem C, Bonneville JF, Chiras J. The dural tail sign–beyond meningioma. Clin Radiol (2005) 60(2):171–88. doi: 10.1016/j.crad.2004.01.019
11. Sandhu FA, Schellinger D, Martuza RL. A vascular sarcoid mass mimicking a convexity meningioma. Neuroradiology (2000) 42(3):195–8. doi: 10.1007/s002340050044
12. Tien RD, Yang PJ, Chu PK. “Dural tail sign”: a specific MR sign for meningioma? J Comput Assist Tomogr (1991) 15(1):64–6. doi: 10.1097/00004728-199101000-00008
13. Senegor M. Prominent meningeal “tail sign” in a patient with a metastatic tumor. Neurosurgery (1991) 29(2):294–6. doi: 10.1227/00006123-199108000-00025
14. Wilms G, Lammens M, Marchal G, Demaerel P, Verplancke J, Calenbergh FV, et al. Prominent dural enhancement adjacent to nonmeningiomatous malignant lesions on contrast-enhanced MR images. AJNR Am J Neuroradiol (1991) 12(4):761–4.
15. Quint DJ, McGillicuddy JE. Meningeal metastasis of the cerebellopontine angle demonstrating “dural tail” sign. Can Assoc Radiol J (1994) 45(1):40–3.
16. Johnson MD, Powell SZ, Boyer PJ, Weil RJ, Moots PL. Dural lesions mimicking meningiomas. Hum Pathol (2002) 33(12):1211–26. doi: 10.1053/hupa.2002.129200
17. Tang H, Ding G, Xiong J, Zhu H, Hua L, Xie Q. Clivus Inflammatory Pseudotumor Associated with Immunoglobulin G4-Related Disease. World Neurosurg (2018) 118:71–4. doi: 10.1016/j.wneu.2018.06.174
18. Ressel A, Fichte S, Brodhun M, Rosahl SK, Gerlach R. WHO grade of intracranial meningiomas differs with respect to patient’s age, location, tumor size and peritumoral edema. J Neurooncol (2019) 145(2):277–86. doi: 10.1007/s11060-019-03293-x
19. Morin O, Chen WC, Nassiri F, Susko M, Magill ST, Vasudevan HN, et al. Integrated models incorporating radiologic and radiomic features predict meningioma grade, local failure, and overall survival. Neurooncol Adv (2019) 1(1):z11. doi: 10.1093/noajnl/vdz011
20. Soni N, Priya S, Bathla G. Texture Analysis in Cerebral Gliomas: A Review of the Literature. AJNR Am J Neuroradiol (2019) 40(6):928–34. doi: 10.3174/ajnr.A6075
21. Desseroit MC, Visvikis D, Tixier F, Majdoub M, Perdrisot R, Guillevin R, et al. Development of a nomogram combining clinical staging with (18)F-FDG PET/CT image features in non-small-cell lung cancer stage I-III. Eur J Nucl Med Mol Imaging (2016) 43(8):1477–85. doi: 10.1007/s00259-016-3325-5
22. Coroller TP, Grossmann P, Hou Y, Velazquez ER, Leijenaar RTH, Hermann G, et al. CT-based radiomic signature predicts distant metastasis in lung adenocarcinoma. Radiother Oncol (2015) 114(3):345–50. doi: 10.1016/j.radonc.2015.02.015
23. Coroller TP, Agrawal V, Narayan V, Hou Y, Grossmann P, Lee SW, et al. Radiomic phenotype features predict pathological response in non-small cell lung cancer. Radiother Oncol (2016) 119(3):480–6. doi: 10.1016/j.radonc.2016.04.004
24. Hectors SJ, Cherny M, Yadav KK, Beksaç AT, Thulasidass H, Lewis S, et al. Radiomics Features Measured with Multiparametric Magnetic Resonance Imaging Predict Prostate Cancer Aggressiveness. J Urol (2019) 202(3):498–505. doi: 10.1097/JU.0000000000000272
25. Osman SOS, Leijenaar RTH, Cole AJ, Lyons CA, Hounsell AR, Prise KM, et al. Computed Tomography-based Radiomics for Risk Stratification in Prostate Cancer. Int J Radiat Oncol Biol Phys (2019) 105(2):448–56. doi: 10.1016/j.ijrobp.2019.06.2504
26. Bonekamp D, Kohl S, Wiesenfarth M, Schelb P, Radtke JP, Götz M, et al. Radiomic Machine Learning for Characterization of Prostate Lesions with MRI: Comparison to ADC Values. Radiology (2018) 289(1):128–37. doi: 10.1148/radiol.2018173064
27. Lambin P, Rios-Velazquez E, Leijenaar R, Carvalho S, van Stiphout RGPM, Granton P, et al. Radiomics: extracting more information from medical images using advanced feature analysis. Eur J Cancer (2012) 48(4):441–6. doi: 10.1016/j.ejca.2011.11.036
28. Court LE, Fave X, Mackin D, Lee J, Yang J, Zhang L. Computational resources for radiomics. Trans Cancer Res (2016) 5(4):340–8. doi: 10.21037/tcr.2016.06.17
29. Gillies RJ, Kinahan PE, Hricak H. Radiomics: Images Are More than Pictures, They Are Data. Radiology (2016) 278(2):563–77. doi: 10.1148/radiol.2015151169
30. Warfield SK, Zou KH, Wells WM. Simultaneous truth and performance level estimation (STAPLE): an algorithm for the validation of image segmentation. IEEE Trans Med Imaging (2004) 23(7):903–21. doi: 10.1109/TMI.2004.828354
31. Bang J II, Ha S, Kang SB, Lee KW, Lee HS, Kim JS, et al. Prediction of neoadjuvant radiation chemotherapy response and survival using pretreatment [(18)F]FDG PET/CT scans in locally advanced rectal cancer. Eur J Nucl Med Mol Imaging (2016) 43(3):422–31. doi: 10.1007/s00259-015-3180-9
32. Lambin P, Leijenaar RTH, Deist TM, Peerlings J, de Jong EEC, van Timmeren J, et al. Radiomics: the bridge between medical imaging and personalized medicine. Nat Rev Clin Oncol (2017) 14(12):749–62. doi: 10.1038/nrclinonc.2017.141
33. Chalkidou A, O’Doherty MJ, Marsden PK. False Discovery Rates in PET and CT Studies with Texture Features: A Systematic Review. PLoS One (2015) 10(5):e124165. doi: 10.1371/journal.pone.0124165
34. Coroller TP, Bi WL, Huynh E, Abedalthagafi M, Aizer AA, Greenwald NF, et al. Radiographic prediction of meningioma grade by semantic and radiomic features. PLoS One (2017) 12(11):e187908. doi: 10.1371/journal.pone.0187908
35. Yan PF, Yan L, Hu TT, Xiao DD, Zhang Z, Zhao HY, et al. The Potential Value of Preoperative MRI Texture and Shape Analysis in Grading Meningiomas: A Preliminary Investigation. Transl Oncol (2017) 10(4):570–7. doi: 10.1016/j.tranon.2017.04.006
36. Laukamp KR, Shakirin G, Baessler B, Thiele F, Zopfs D, Hokamp NG, et al. Accuracy of Radiomics-Based Feature Analysis on Multiparametric Magnetic Resonance Images for Noninvasive Meningioma Grading. World Neurosurg (2019) 132:e366–90. doi: 10.1016/j.wneu.2019.08.148
37. Hamerla G, Meyer HJ, Schob S, Ginatc DT, Altman A, Lim T, et al. Comparison of machine learning classifiers for differentiation of grade 1 from higher gradings in meningioma: A multicenter radiomics study. Magn Reson Imaging (2019) 63:244–9. doi: 10.1016/j.mri.2019.08.011
38. Chen C, Guo X, Wang J, Guo W, Ma X, Xu J. The Diagnostic Value of Radiomics-Based Machine Learning in Predicting the Grade of Meningiomas Using Conventional Magnetic Resonance Imaging: A Preliminary Study. Front Oncol (2019) 9:1338. doi: 10.3389/fonc.2019.01338
39. Zhu Y, Man C, Gong L, Dong D, Yu X, Wang S, et al. A deep learning radiomics model for preoperative grading in meningioma. Eur J Radiol (2019) 116:128–34. doi: 10.1016/j.ejrad.2019.04.022
40. Park YW, Oh J, You SC, Han K, Ahn SS, Choi YS, et al. Radiomics and machine learning may accurately predict the grade and histological subtype in meningiomas using conventional and diffusion tensor imaging. Eur Radiol (2019) 29(8):4068–76. doi: 10.1007/s00330-018-5830-3
41. Niu L, Zhou X, Duan C, Zhao J, Sui Q, Liu X, et al. Differentiation Researches on the Meningioma Subtypes by Radiomics from Contrast-Enhanced Magnetic Resonance Imaging: A Preliminary Study. World Neurosurg (2019) 126:e646–52. doi: 10.1016/j.wneu.2019.02.109
42. Li X, Lu Y, Xiong J, Wang D, She D, Kuai X, et al. Presurgical differentiation between malignant haemangiopericytoma and angiomatous meningioma by a radiomics approach based on texture analysis. J Neuroradiol (2019) 46(5):281–7. doi: 10.1016/j.neurad.2019.05.013
43. Zhang Y, Chen JH, Chen TY, Lim SW, Wu TC, Kuo YT, et al. Radiomics approach for prediction of recurrence in skull base meningiomas. Neuroradiology (2019) 61(12):1355–64. doi: 10.1007/s00234-019-02259-0
44. Tian Z, Chen C, Zhang Y, Fan Y, Feng R, Xu J, et al. Radiomic Analysis of Craniopharyngioma and Meningioma in the Sellar/Parasellar Area with MR Images Features and Texture Features: A Feasible Study. Contrast Media Mol Imaging (2020) 2020:4837156. doi: 10.1155/2020/4837156
45. Zhang J, Yao K, Liu P, Liu Z, Han T, Zhao Z, et al. A radiomics model for preoperative prediction of brain invasion in meningioma non-invasively based on MRI: A multicentre study. EBioMedicine (2020) 58:102933. doi: 10.1016/j.ebiom.2020.102933
46. Nowosielski M, Galldiks N, Iglseder S, Kickingereder P, von Deimling A, Bendszus M, et al. Diagnostic challenges in meningioma. Neuro Oncol (2017) 19(12):1588–98. doi: 10.1093/neuonc/nox101
47. Huang RY, Bi WL, Griffith B, Kaufmann TJ, Fougère Cl, Schmidt NO, et al. Imaging and diagnostic advances for intracranial meningiomas. Neuro Oncol (2019) 21(Suppl 1):i44–61. doi: 10.1093/neuonc/noy143
48. Lin BJ, Chou KN, Kao HW, Lin C, Tsai WC, Feng SW, et al. Correlation between magnetic resonance imaging grading and pathological grading in meningioma. J Neurosurg (2014) 121(5):1201–8. doi: 10.3171/2014.7.JNS132359
49. Lu Y, Xiong J, Yin B, Wen J, Liu L, Geng D. The role of three-dimensional pseudo-continuous arterial spin labelling in grading and differentiating histological subgroups of meningiomas. Clin Radiol (2018) 73(2):176–84. doi: 10.1016/j.crad.2017.08.005
50. Parmar C, Grossmann P, Bussink J, Lambin P, Aerts HJWL. Machine Learning methods for Quantitative Radiomic Biomarkers. Sci Rep (2015) 5:13087. doi: 10.1038/srep13087
52. Swami A, Jain R. Scikit-learn: Machine Learning in Python. J Mach Learn Res (2012) 12(10):2825–30. doi: 10.1524/auto.2011.0951
53. Chang C-C, Lin C-J. LIBSVM: A library for support vector machines. ACM Trans Intell Syst Technol (2011) 2(3):27. doi: 10.1145/1961189.1961199
54. Ahn HK, Lee H, Kim SG, Hyun SH. Pre-treatment (18)F-FDG PET-based radiomics predict survival in resected non-small cell lung cancer. Clin Radiol (2019) 74(6):467–73. doi: 10.1016/j.crad.2019.02.008
55. Hotta M, Minamimoto R, Miwa K. 11C-methionine-PET for differentiating recurrent brain tumor from radiation necrosis: radiomics approach with random forest classifier. Sci Rep (2019) 9(1):15666. doi: 10.1038/s41598-019-52279-2
56. Jain R, Lui YW. How Far Are We from Using Radiomics Assessment of Gliomas in Clinical Practice? Radiology (2018) 289(3):807–8. doi: 10.1148/radiol.2018182033
57. Bellingegni AD, Gruppioni E, Colazzo G, Davalli A, Sacchetti R, Guglielmelli E, et al. NLR, MLP, SVM, and LDA: a comparative analysis on EMG data from people with trans-radial amputation. J Neuroeng Rehabil (2017) 14(1):82. doi: 10.1186/s12984-017-0290-6
58. Zhang S, Chiang GC, Knapp JM, Zecca CM, He D, Ramakrishna R, et al. Grading meningiomas utilizing multiparametric MRI with inclusion of susceptibility weighted imaging and quantitative susceptibility mapping. J Neuroradiol (2019) 47(4):272–7. doi: 10.1016/j.neurad.2019.05.002
59. Traverso A, Wee L, Dekker A, Gillies R. Repeatability and Reproducibility of Radiomic Features: A Systematic Review. Int J Radiat Oncol Biol Phys (2018) 102(4):1143–58. doi: 10.1016/j.ijrobp.2018.05.053
60. Florez E, Nichols T, Parker E, Lirette ST, Howard CM, Fatemi A. Multiparametric Magnetic Resonance Imaging in the Assessment of Primary Brain Tumors Through Radiomic Features: A Metric for Guided Radiation Treatment Planning. Cureus (2018) 10(10):e3426. doi: 10.7759/cureus.3426
61. Lotan E, Jain R, Razavian N, Fatterpekar GM, Lui YW. State of the Art: Machine Learning Applications in Glioma Imaging. AJR Am J Roentgenol (2019) 212(1):26–37. doi: 10.2214/AJR.18.20218
62. Levine AB, Schlosser C, Grewal J, Coope R, Jones SJM, Yip S. Rise of the Machines: Advances in Deep Learning for Cancer Diagnosis. Trends Cancer (2019) 5(3):157–69. doi: 10.1016/j.trecan.2019.02.002
Keywords: meningioma, radiomics, medical imaging, diagnosis, deep learning
Citation: Gu H, Zhang X, di Russo P, Zhao X and Xu T (2020) The Current State of Radiomics for Meningiomas: Promises and Challenges. Front. Oncol. 10:567736. doi: 10.3389/fonc.2020.567736
Received: 30 May 2020; Accepted: 28 September 2020;
Published: 27 October 2020.
Edited by:
Hailiang Tang, Huashan Hospital Affiliated to Fudan University, ChinaReviewed by:
Pallavi Tiwari, Case Western Reserve University, United StatesCopyright © 2020 Gu, Zhang, di Russo, Zhao and Xu. This is an open-access article distributed under the terms of the Creative Commons Attribution License (CC BY). The use, distribution or reproduction in other forums is permitted, provided the original author(s) and the copyright owner(s) are credited and that the original publication in this journal is cited, in accordance with accepted academic practice. No use, distribution or reproduction is permitted which does not comply with these terms.
*Correspondence: Tao Xu, eHV0YW9Ac21tdS5lZHUuY24=
†These authors have contributed equally to this work
Disclaimer: All claims expressed in this article are solely those of the authors and do not necessarily represent those of their affiliated organizations, or those of the publisher, the editors and the reviewers. Any product that may be evaluated in this article or claim that may be made by its manufacturer is not guaranteed or endorsed by the publisher.
Research integrity at Frontiers
Learn more about the work of our research integrity team to safeguard the quality of each article we publish.