 Jun-Peng Pei1†
 Chun-Dong Zhang1,2†
 Yu Liang1
 Cheng Zhang1
 Kun-Zhe Wu1Yong-Zhi Li1Zhe-Ming Zhao1
 Dong-Qiu Dai1,3*
- 1Department of Gastrointestinal Surgery, The Fourth Affiliated Hospital of China Medical University, Shenyang, China
- 2Department of Gastrointestinal Surgery, Graduate School of Medicine, The University of Tokyo, Tokyo, Japan
- 3Cancer Center, The Fourth Affiliated Hospital of China Medical University, Shenyang, China
Background: The American Joint Committee on Cancer 8th classification states that colorectal cancer (CRC) is classified as N1c stage when regional lymph nodes (LNs) are negative and tumor deposits (TDs) are positive. However, how to classify TDs when regional LNs are positive remains unclear. The current study aimed to investigate the possibility of combining positive LNs and positive TDs to develop a modified pathological N (mpN) stage for CRC.
Methods: We retrospectively analyzed 9,198 patients with stage III CRC from the Surveillance, Epidemiology, and End Results program who underwent surgery (6,440 in the training cohort and 2,758 the validation cohort). The combination of positive LNs and TD status was defined as mpN stage. Overall survival (OS) according to mpN and pathological N (pN) stages was analyzed by the Kaplan–Meier method. The area under the curves (AUCs) and Akaike’s information criterion (AIC) were applied to assess the predictive discrimination abilities and goodness-of-fit of the model. The clinical benefits were measured using decision curve analyses. The validation cohort was used to validate the results.
Results: AUC analysis showed that the prognostic discrimination of mpN stage (AUC = 0.628, 95% confidence interval (CI), 0.616–0.640) was better than that of pN stage (AUC = 0.618, 95% CI, 0.606–0.630, p = 0.006) for OS. The AIC demonstrated that mpN stage (AIC = 30,217) also showed superior model-fitting compared with pN stage (AIC = 30,257) and decision curve analyses revealed that mpN stage had better clinical benefits than pN stage. Similar results were found in the validation cohort.
Conclusions: Among patients with CRC and LN metastasis, mpN stage might be superior to pN stage for assessing prognosis and survival, suggesting that TD status should be included in the pN stage.
Introduction
Colorectal cancer (CRC) is the third most common malignancy and third-leading cause of cancer-related deaths in the United States (1). The American Joint Committee on Cancer (AJCC) tumor-node-metastasis (TNM) classification has been the most important determinant of prognosis and thus plays a vital role in the management and treatment of patients with CRC. The TNM classifications for CRC have been gradually modified from the 5th to 8th edition, particularly in terms of pathological N (pN) stage, to improve prognosis prediction and guide treatment decision-making (2–5).
Tumor deposits (TDs) are defined as discrete tumor foci in central (or perirectal) fat within the lymphatic drainage cavity of the primary tumor, with no histological evidence of residual lymph node (LN) tissues or vascular structures in the nodules (4). Several recent studies have suggested that TDs are an independent prognostic factor for survival in patients with CRC. Compared with patients without TDs, CRC patients with TDs had a poorer prognosis (6–8). In the absence of regional LN metastasis, the AJCC 7th TNM classification of CRC classified any pathological T stage with positive TDs as N1c stage. This remained unchanged until the current classification (4, 5). However, the latest AJCC 8th TNM classification stipulates that the number of TDs should be recorded, although it remains unclear how TDs should be classified, which could affect the accuracy of CRC staging. This study therefore aimed to investigate how to classify TDs in nodal-positive cases, and to determine the prognostic value of TDs in patients with CRC.
Materials and Methods
Patients
This study included patients with CRC who were screened in the Surveillance, Epidemiology, and End Results (SEER) program between 2010 and 2016 (the year of implementation of N1c). The inclusion criteria were: (1) CRC in SEER; (2) essential information available; (3) age 18–75 years; (4) primary and single tumors; (5) nodal-positive cases; (6) underwent surgical treatment; (7) no preoperative therapy; (8) survival > 1 month; and (9) follow-up > 60 months or until death. The exclusion criteria were: (1) no available information; (2) age < 18 or > 75 years; (3) multiple tumors; (4) nodal-negative or stage IV cases; (5) no surgical treatment; (6) received preoperative therapy; (7) postoperative survival < 1 month; and (8) follow-up < 60 months or lost to follow-up.
Modified pN Stage
pN stage was divided into nine categories based on TD status: pN1aTD–, pN1aTD+, pN1bTD–, pN1bTD+, pN1c, pN2aTD–, pN2aTD+, pN2bTD–, and pN2bTD+. These categories were ranked from lowest to highest hazard ratios (HRs) of overall survival (OS). Log-rank tests were performed to compare consecutive stages, and the four largest of the eight χ2 values were identified as the optimal cut-off values. Tumors were then clustered into five substages: mpN1a, mpN1b, mpN2a, mpN2b, and mpN2c.
Statistical Analyses
Continuous variables were presented as mean ± standard deviation (SD). Kaplan–Meier analysis with log-rank tests was performed. Cox proportional hazards regression model was used to identify independent prognostic factors. The predictive discriminations of the pN and mpN models were assessed by area under the curves (AUCs), and compared using Hanley and McNeil test. Akaike’s information criterion (AIC) was applied to assess the prediction model-fitting (9). Higher AUCs demonstrated superior discrimination and lower AICs indicated better model-fitting. Clinical benefit was further estimated by decision curve analyses (10, 11).
All data were analyzed using SPSS 22.0 statistical package (SPSS Inc., Chicago, IL, USA), MedCalc version 15.2, and R version 3.5.6. All tests were two-sided and a p value < 0.05 was considered statistically significant. A data-use agreement was approved for use of the SEER database. Institutional review board approval was not required because the SEER database holds publicly available de-identified data.
Results
Clinicopathologic Features
The patient inclusion process is shown in Figure 1. A total of 9,198 patients were included and were randomly dividing into a training (70%, n = 6,440) and a validation cohort (30%, n = 2,758). In the training cohort, 5,161 (80.1%) patients had colon cancer and 1,279 (19.9%) had rectal cancer. The mean age (± SD) was 60.0 ± 10.7 years (range, 18–75 years), tumor size was 45.0 ± 2.4 mm (range, 1–200 mm), number of examined LNs was 18.0 ± 10.7 (range, 1–89), and number of positive LNs was 2.0 ± 4.0 (range, 0–89). Positive TDs were observed in 860 cases (13.4%) with a mean of 2.0 ± 5.9 (range, 1–70) TDs per patient (Table 1). The clinicopathological characteristics of the validation cohort were similar to the training cohort (Table 1).
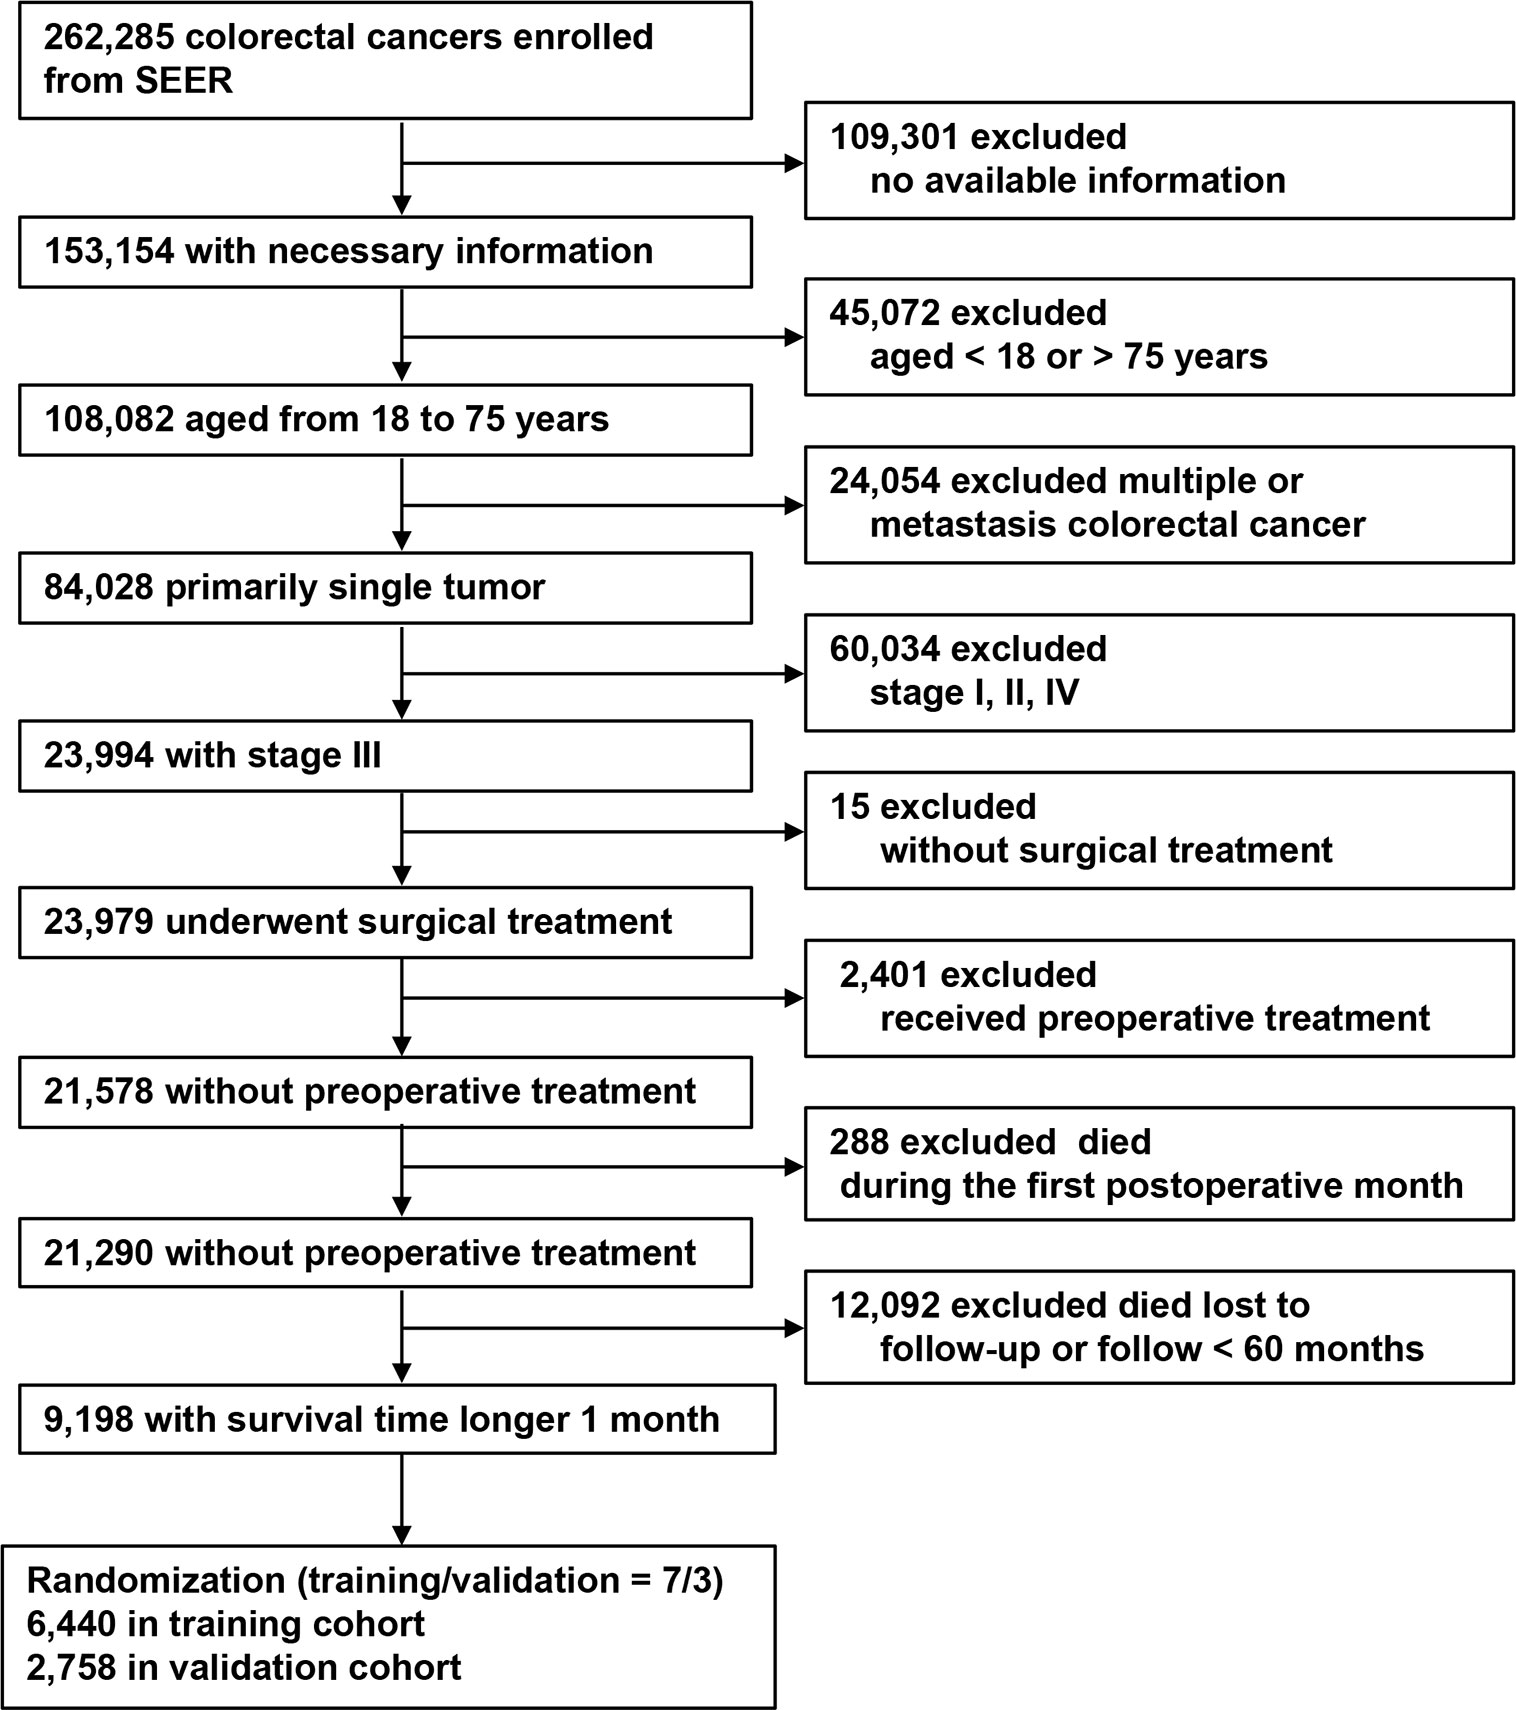
Figure 1 Flow chart for patient selection.
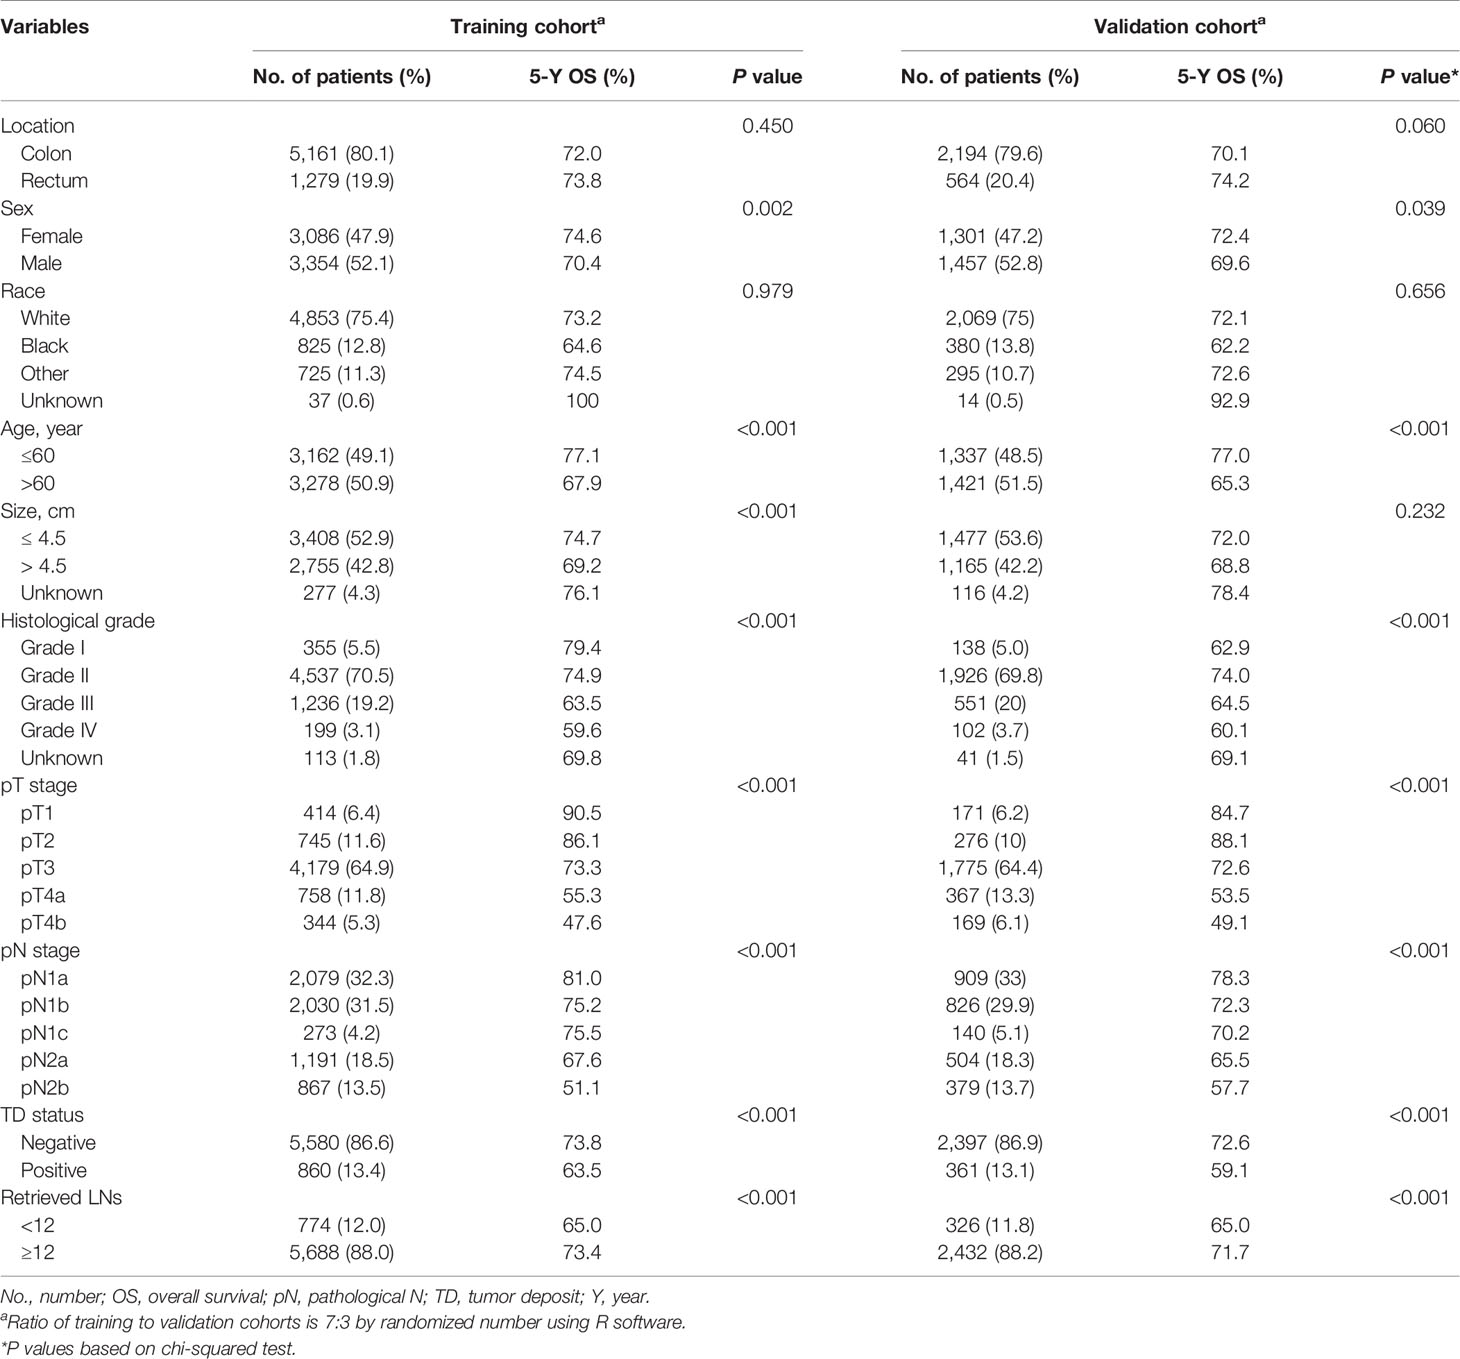
Table 1 Baseline clinicopathologic characteristics and univariate analysis of training and validation cohorts.
Univariate and Multivariate Survival Analyses
The results of univariate and multivariate survival analyses in the training and validation cohorts are shown in Tables 1 and 2. Sex, age, tumor size, histological grade, pT stage, pN stage, TD status, and retrieved LNs had significant prognostic impacts on survival in the training cohort according to univariate analysis. Multivariate analysis identified sex, age, histological grade, pT stage, pN stage, TD status, and retrieved LNs as independent prognostic factors for OS.
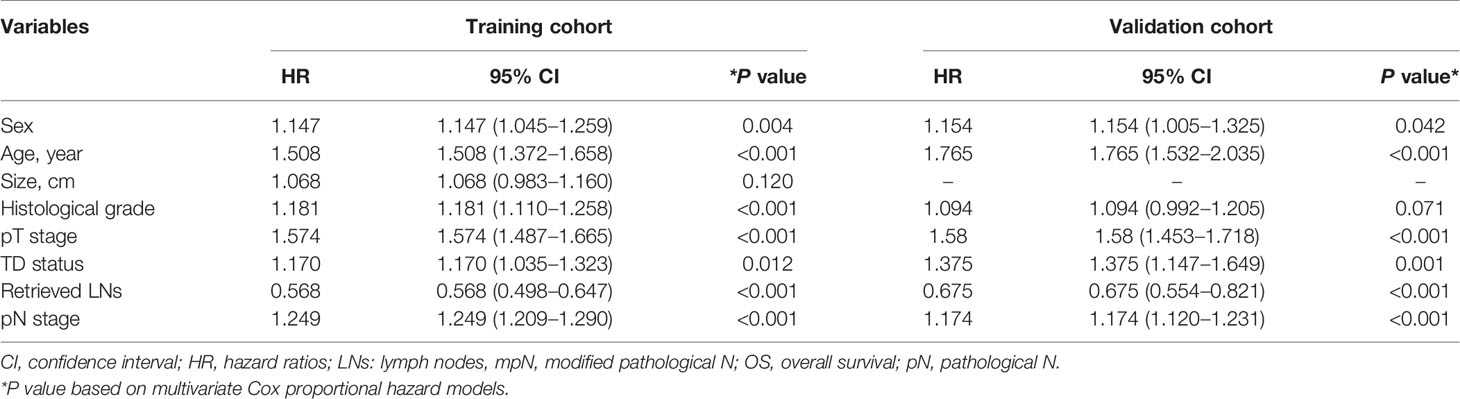
Table 2 Multivariate survival analyses of patients with colorectal cancer in the training and validation cohorts.
Sex, age, histological grade, pT stage, pN stage, TD status, and retrieved LNs had significant impacts on survival in the validation cohort according to univariate analysis, and sex, age, pT stage, pN stage, TD status, and retrieved LNs were also found to be independent prognostic factors for OS by multivariate analysis.
Prognosis of TDs
In the training cohort, TD-positive patients had significantly poorer 5-year OS than TD-negative patients (overall patients, 63.5% vs. 73.8%, log-rank test, p < 0.001; Table 1, Figure 2A). Similar results were found for stages pN1a, pN1b, pN2a, and pN2b (log-rank test, all p < 0.05; Table 3, Figures 2B–E). These results were confirmed in the validation cohort (log-rank test, all p < 0.05; Table 3, Figures 2F–J).
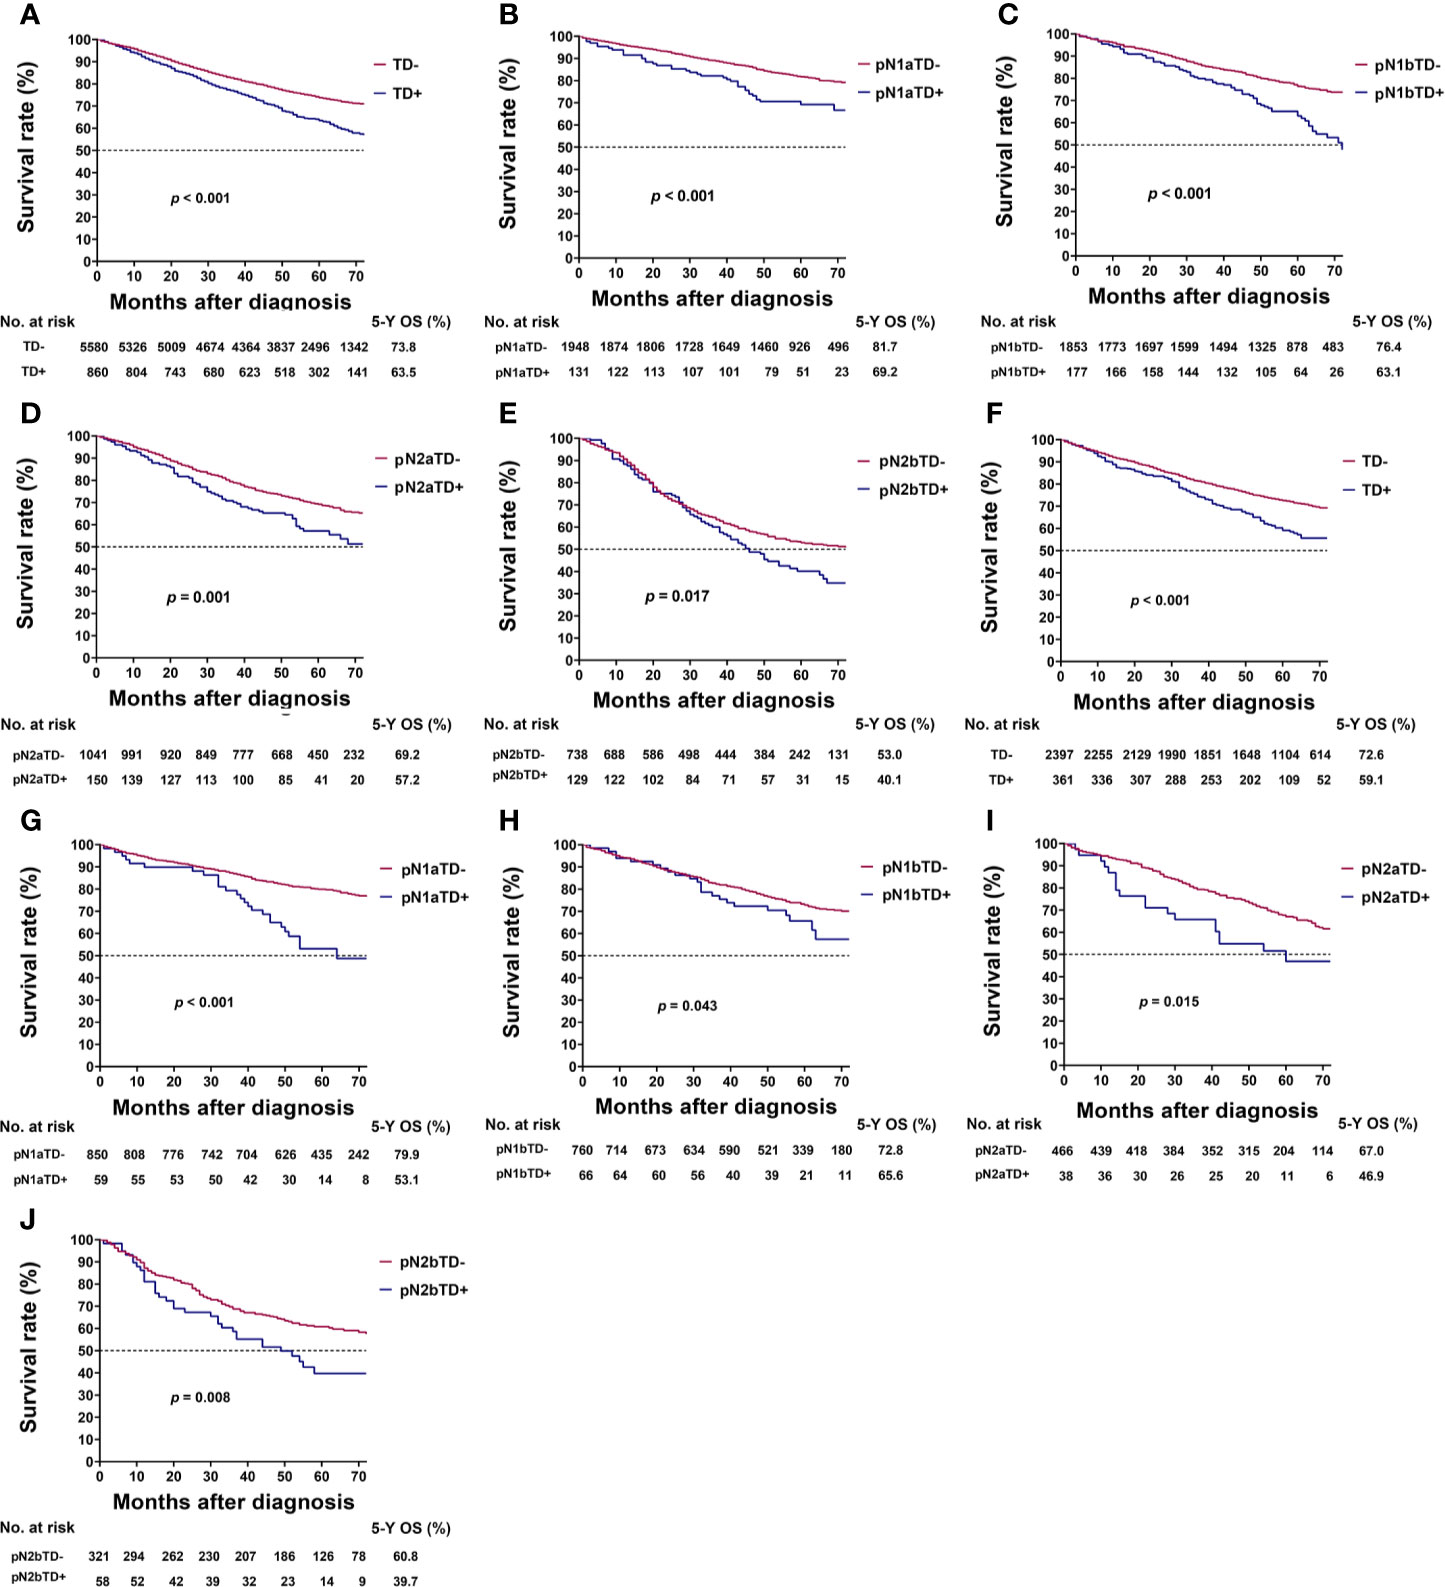
Figure 2 Kaplan–Meier survival curves for patients with and without tumor deposits (TDs) among all patients and pathological N (pN) stage patients. (A) All patients in the training cohort; (B) pN1a substage in the training cohort; (C) pN1b substage in the training cohort; (D) pN2a substage in the training cohort; (E) pN2b substage in the training cohort; (F) all patients in the validation cohort; (G) pN1a substage in the validation cohort; (H) pN1b substage in the validation cohort; (I) pN2a substage in the validation cohort; (J) pN2b substage in the validation cohort.
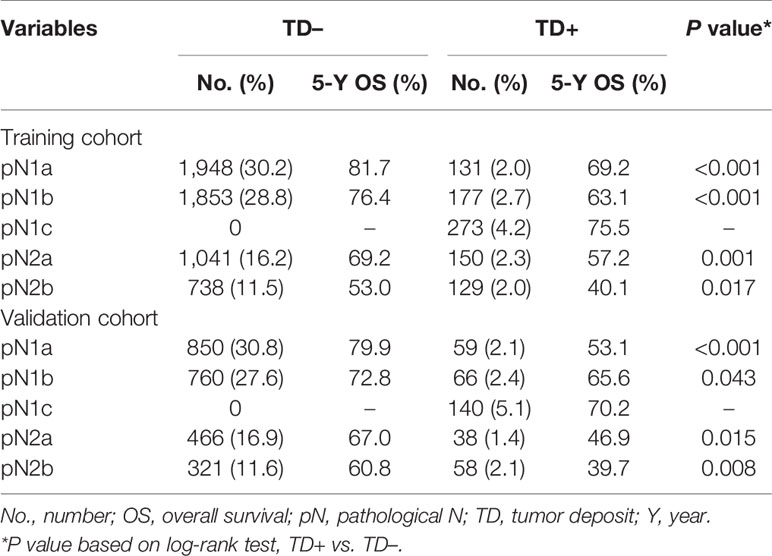
Table 3 Comparison of 5-year overall survival rates in patients with and without TDs in pN stage.
Modified Pathological N Stage
In the training cohort, there was no significant difference in HRs of overall survival between pN1bTD– and pN1c (HR, 1.317 vs. 1.425, log-rank test, p = 0.522) and between pN1aTD+ and pN2aTD+ (HR, 1.767 vs. 1.822, log-rank test, p = 0.848), and no significant difference between pN2aTD+ and pN1bTD+ (HR, 2.804 vs. 2.421, log-rank test, p = 0.382) or pN2bTD– (HR, 2.804 vs. 3.109, log-rank test, p = 0.402) (Table 4, Figure 3).
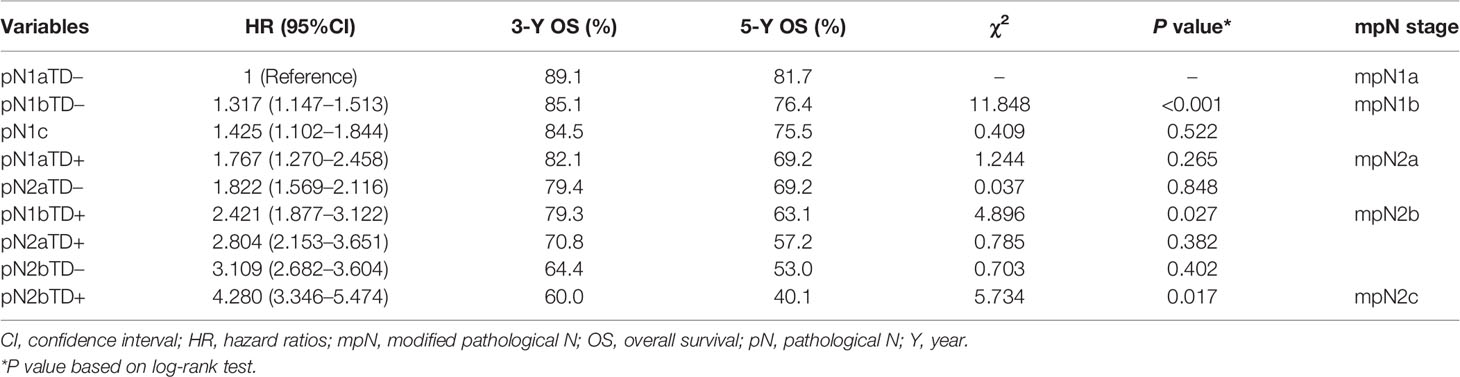
Table 4 Modified pN stage in the training cohort.
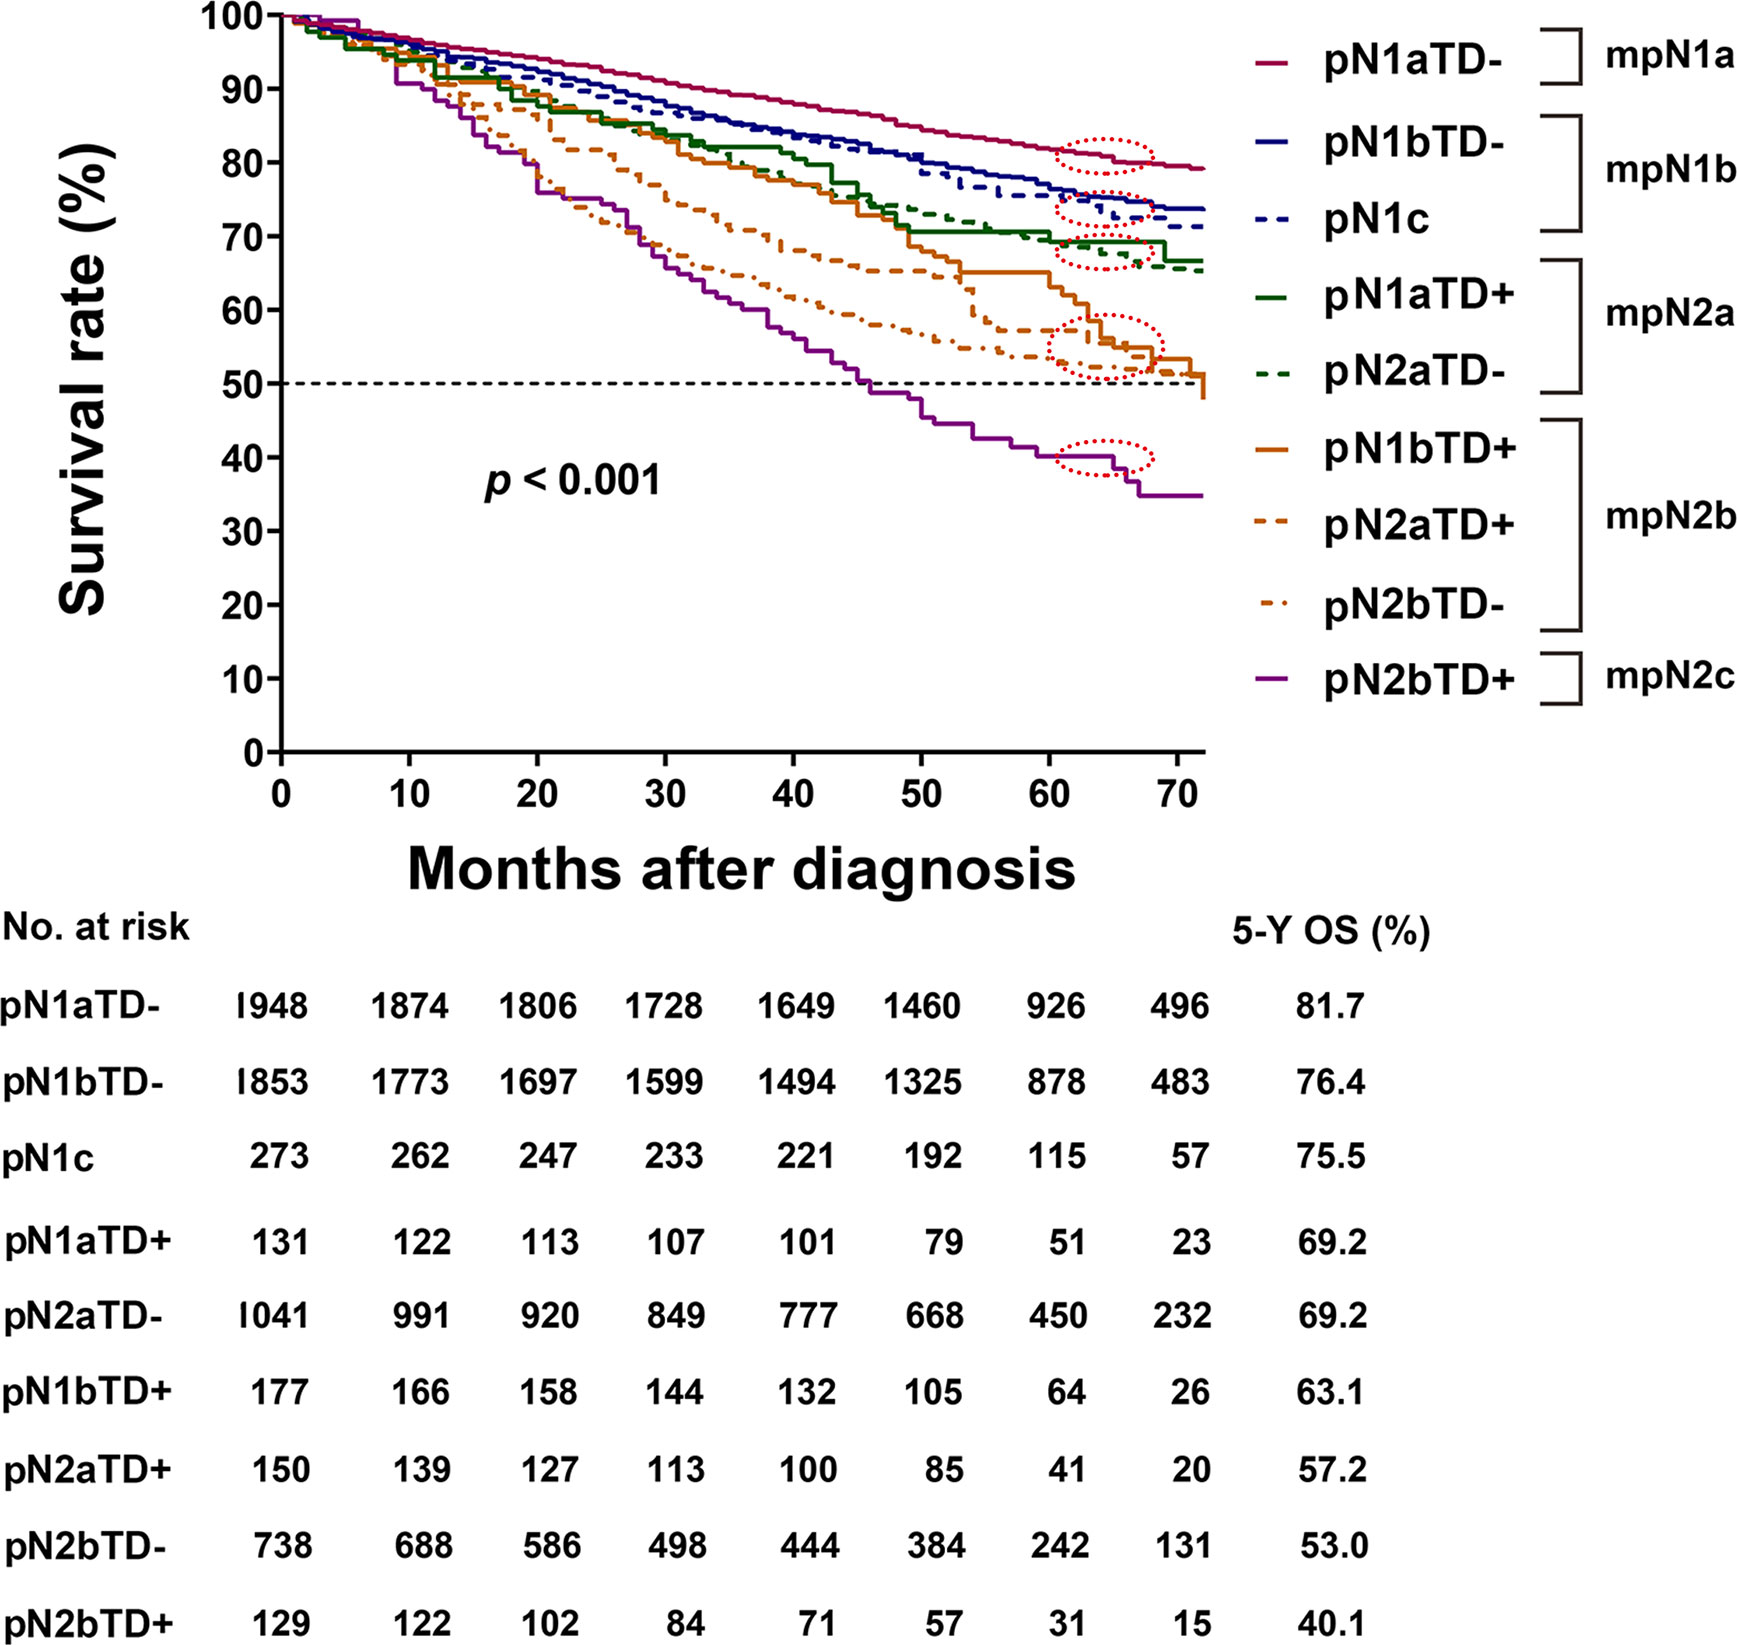
Figure 3 Kaplan–Meier survival curves for pathological N (pN) stage based on the presence or absence of tumor deposits (TDs) in patients in the training cohort.
The categories were ranked from lowest to highest HR of OS as follows: pN1aTD−, pN1bTD−, pN1c, pN1aTD+, pN2aTD–, pN1bTD+, pN2aTD+, pN2bTD−, and pN2bTD+. Based on the four largest χ2 values, we modified the pN stage (mpN) as follows: mpN1a (pN1aTD−); mpN1b (pN1bTD− and pN1c); mpN2a (pN1aTD+ and pN2aTD–); mpN2a (pN1bTD+, pN2aTD+, and pN2bTD−); and mpN2c (pN2bTD+) (Table 4, Figure 3).
Five-Year OS in Relation to pN and mpN Stages
In the training cohort, the 5-year OS rates of patients with stages pN1a, pN1b, pN1c, pN2a, and pN2b were 81.0%, 75.2%, 75.5%, 67.6%, and 51.1%, respectively. The 5-year OS of patients with pN1b and pN1c were not significantly different (log-rank test, p = 0.890; Table 5, Figure 4A).

Table 5 Three- and 5-year OS and 95% CI for pN stage and mpN stage in the training and validation cohorts.
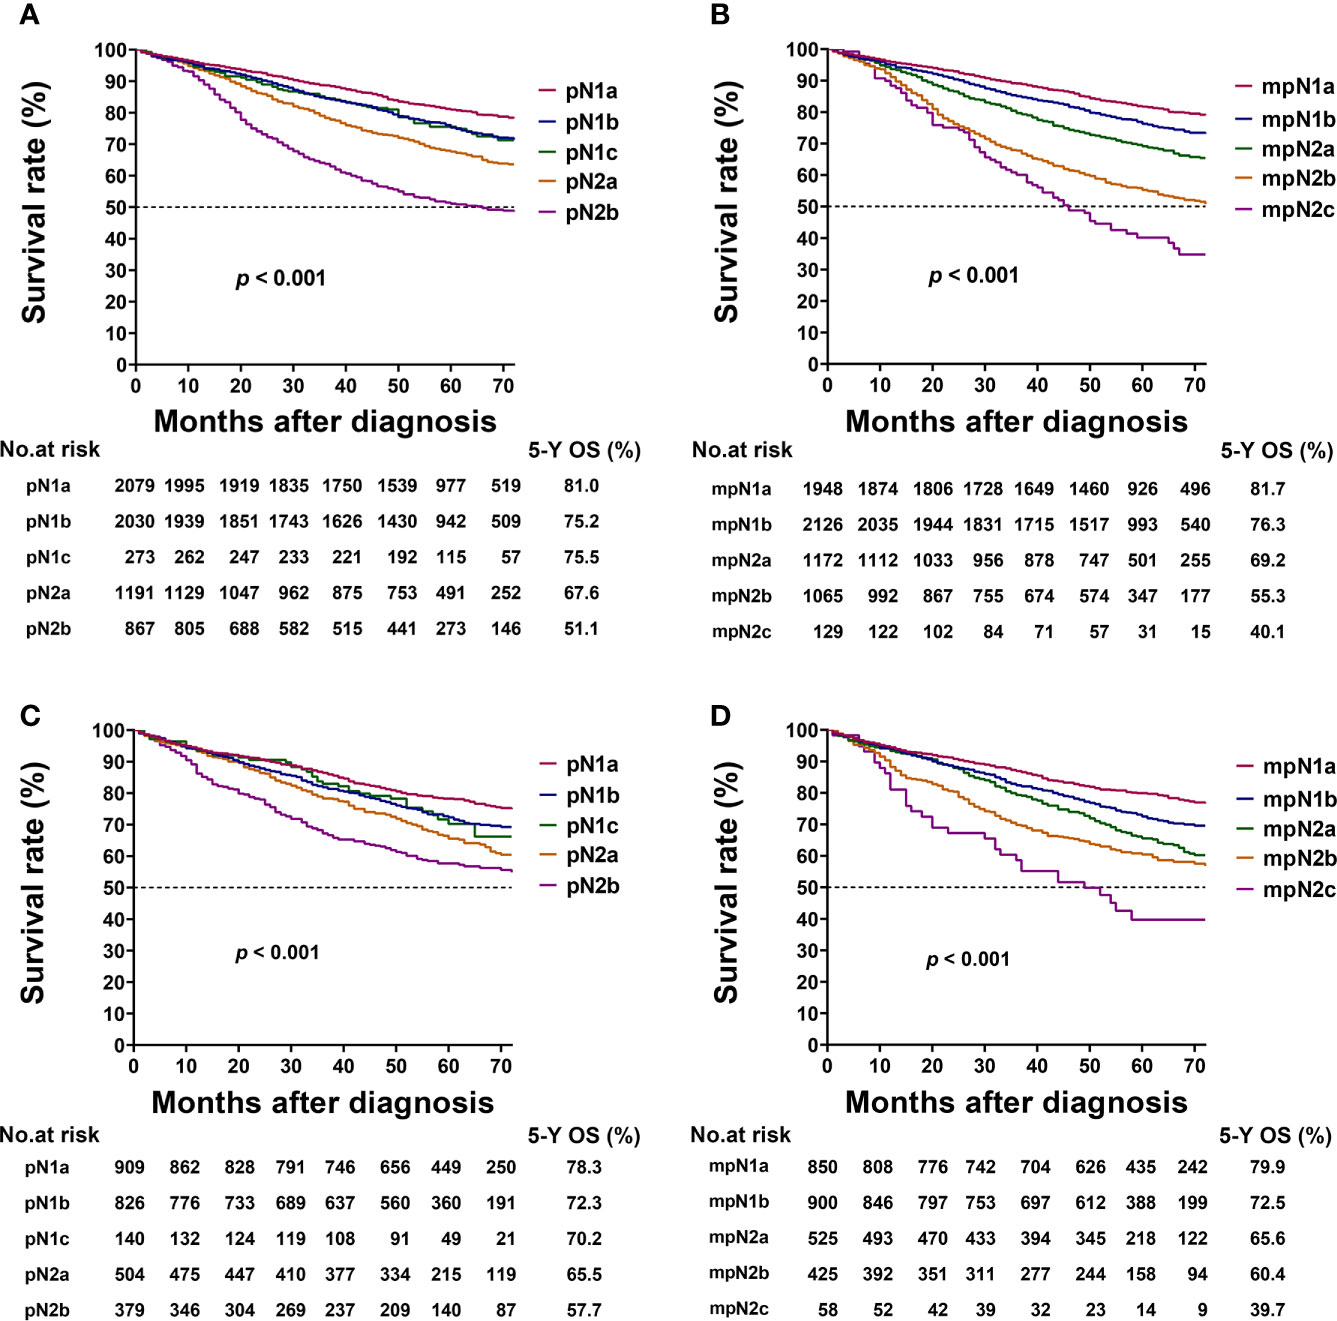
Figure 4 Kaplan–Meier survival curves for 5-year overall survival (OS) based on the pathological N (pN) and modified pN (mpN) stages. Kaplan–Meier survival curves based on (A) pN stage in training cohort; (B) mpN stage in training cohort; (C) pN stage in validation cohort; and (D) mpN stage in validation cohort.
The 5-year OS rates of patients with stages mpN1a, mpN1b, mpN2a, mpN2b, and mpN2c were 81.7%, 76.3%, 69.2%, 55.3%, and 40.1%, respectively. The mpN stage showed enhanced stratification to differentiate between all substages (log-rank test, all p < 0.001; Table 5, Figure 4B). Similar results were found in the validation cohort (Table 5, Figures 4C, D).
Prognostic Value of mpN Stage in Multivariate Analysis
mpN stage and factors significantly associated with OS in univariate analysis were included in multivariate analysis. Sex, age, histological grade, pT stage, retrieved LNs, and mpN stage were identified as independent prognostic factors for OS in the training cohort, and age, pT stage, retrieved LNs, and mpN stage were identified as independent prognostic factors for OS in the validation cohort. TD status and pN stage were not significant prognostic factors in multivariate analysis in either the training cohort (p = 0.064 and 0.872, respectively; Table 6) or validation cohort (p = 0.176 and 0.474, respectively; Table 6).
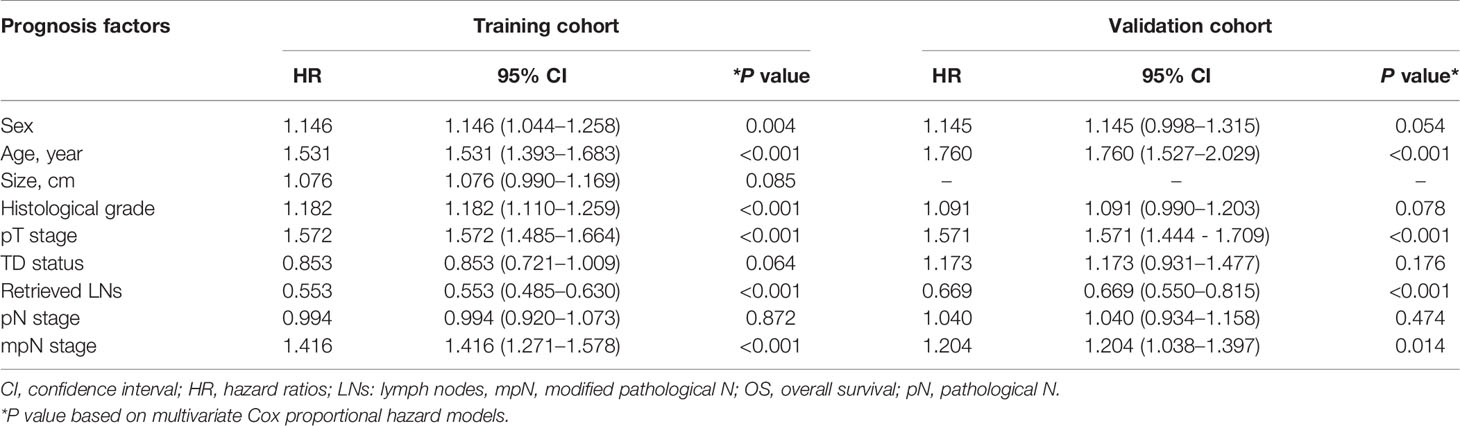
Table 6 Multivariate survival analysis of patients with colorectal cancer after including mpN stage in the training and validation cohorts.
Comparison of Predictive Performances of pN and mpN Stages
In the training cohort, mpN had better prognostic discrimination than pN stage (AUC, 0.628 vs. 0.618, Hanley and McNeil test, p = 0.006) and better model-fitting (AIC, 30,217 vs. 30,257) (Table 7, Figure 5A). These findings were confirmed in the validation cohort (Table 7, Figure 5B).
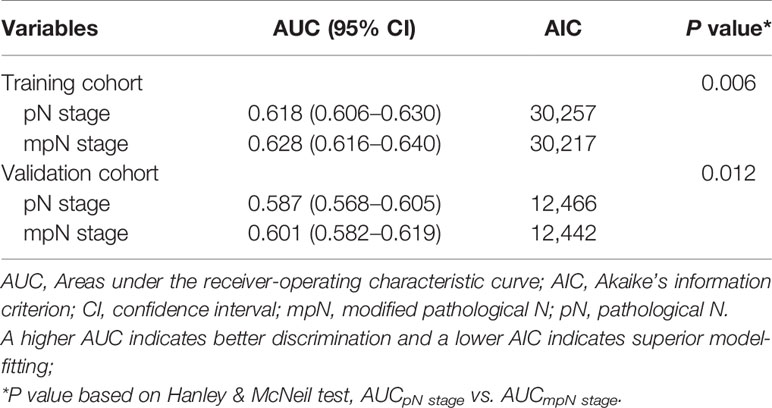
Table 7 Prognostic abilities of pN and mpN stages in the training and validation cohorts.
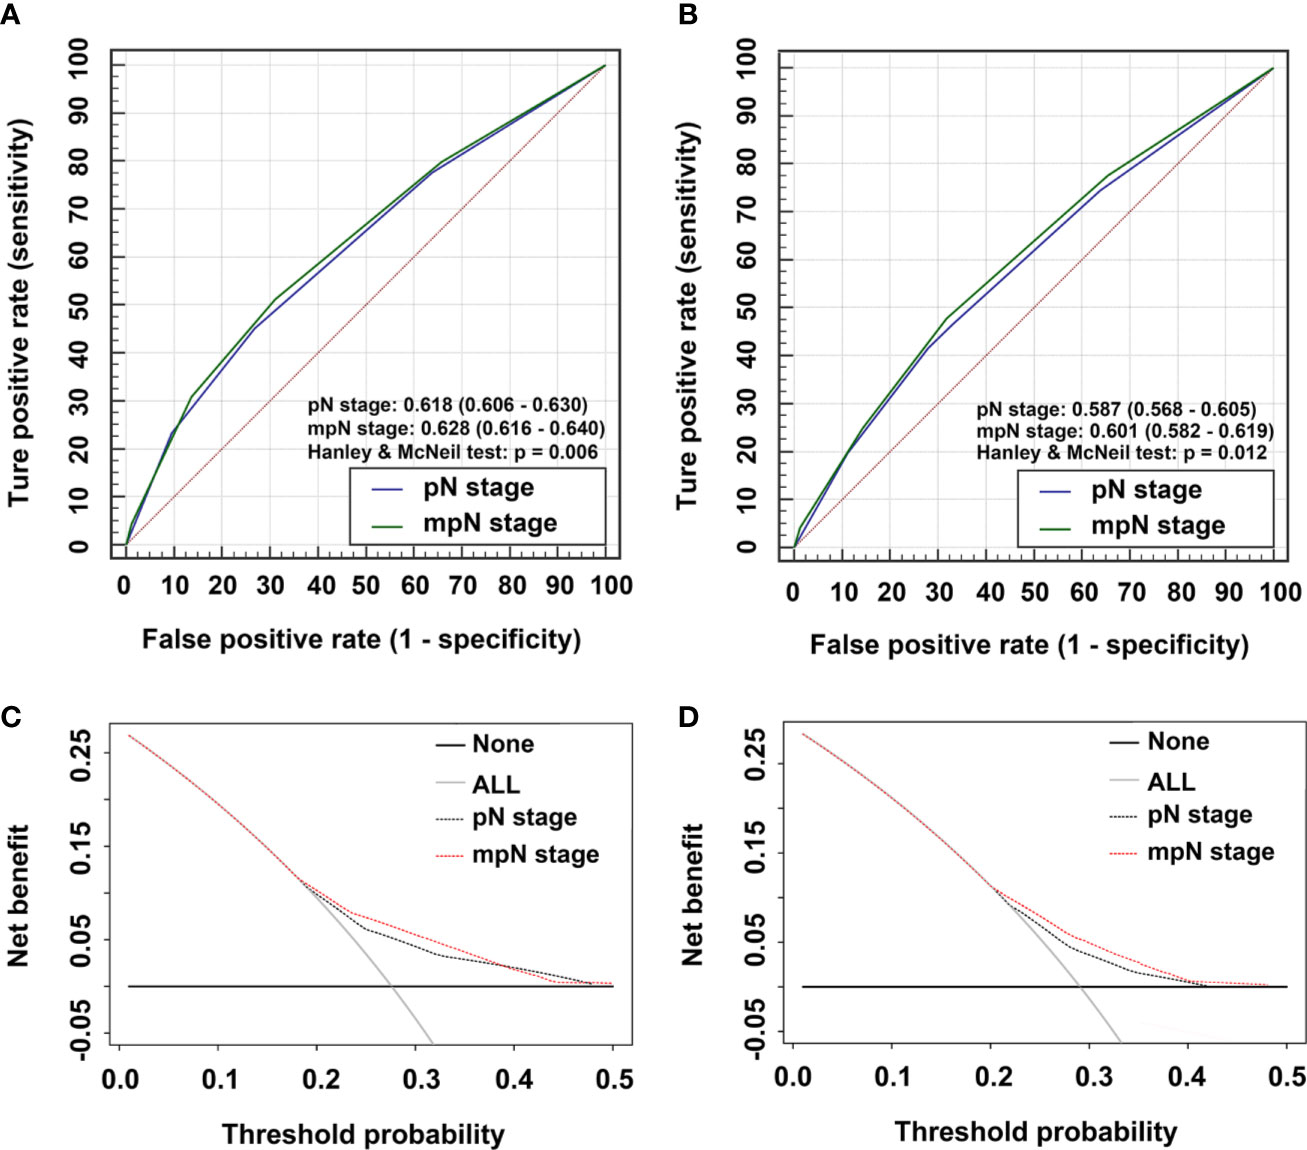
Figure 5 Time-dependent areas under receiver-operating characteristic (ROC) curves (AUC) and Decision curve analysis (DCA) for overall survival (OS). AUCs for (A) pathological N (pN) stage and modified pN (mpN) stage in the training cohort and (B) pN stage and mpN stage in the validation cohort. DCAs for 5-year OS in (C) the training cohort and (D) the validation cohort.
Clinical Use
We evaluated the clinical usefulness of the pN and mpN stages in the training and validation cohorts by decision curve analyses. mpN stage showed higher net benefit than pN stage between threshold probabilities of around 20%–40% in predicting 5-year OS in both the training and validation cohorts (Figures 5C, D).
Discussion
The AJCC TNM classification of CRC is the current standard for tumor staging and thus plays an important role in the management and treatment of patients with CRC. TDs usually occur in subserosal, mesenteric, and nonperitoneal tissues covering the rectum/colon. The concept was first introduced by Gabriel et al. in 1935, and TDs were believed to be the result of the spread of vascular tumors (12). The classification criteria and guidance of how to discriminate TDs from positive LNs have since been revised several times. The AJCC 5th classification defined TDs based on the maximum diameter: nodules < 3 mm were classified as TDs and nodules ≥ 3 mm as positive LNs (2). The AJCC 6th TNM classification defined TDs based on their contours: irregularly contoured nodules were regarded as TDs, while regular smooth nodules were regarded as positive LNs (13). The AJCC 7th TNM classification incorporated TDs into the TNM staging and defined any pT TD-positive but LN-negative lesion as pN1c (4). The pN1c category remained unchanged in the AJCC 8th TNM classification (5); however, TDs are not included in the pN staging for nodal-positive patients, and the validity of the staging in patients with both positive lymph nodes and TDs is controversial. This uncertainty may be because of a lack of sufficient evidence to determine the specific impacts of TDs on the prognosis in patients with CRC.
Previous studies showed that TDs were closely related to a poor prognosis in CRC patients (6, 7, 14–20). The presence of TDs was associated with increased local recurrence and distant metastasis rates (15, 20), and CRC patients with TDs had lower survival rates than those without TDs (6, 7, 14, 16–19), while CRC patients with larger numbers of TDs had poorer prognoses (21). These results suggest that TDs play a significant role in determining the prognosis in patients with CRC.
However, it remains unclear how to classify TDs in the TNM classification. Some researchers have suggested that TDs should be counted as positive LNs, and that this may be superior to the AJCC 7th TNM classification for assessing prognosis in CRC patients (8, 22). However, Frankel et al. indicated that the number of TDs should not be added to the total number of positive LNs (23), while Nagtegaal et al. believed that TDs should not be considered as positive LNs because of their diverse origins (perivascular/intravascular/peritoneal) (24). Furthermore, Basnet et al. demonstrated that TDs were not equivalent to positive LNs, but did not provide detailed information about the exact role of TDs (25). These findings suggest that TDs may differ from positive LNs and may have specific prognostic characteristics. In the current study, we classified patients with stage III CRC according to the presence or absence of TDs and showed that the survival rate of TDs patients was significantly lower than that of patients without TDs, in all pN substages. These results suggested that TDs should be considered as a potential poor prognostic element in CRC patients.
A good classification system should show prognostic discrimination, i.e., the survival rates of each group should be significantly different (26). In the current study, the 5-year OS rates of patients with pN1b and pN1c CRC were not significantly different (75.2% vs 75.5%, log-rank test, p = 0.890); however, mpN stage revealed significant differences in 5-year OS among all five substages (log-rank test, all p < 0.01). mpN stage therefore had a higher discrimination ability than pN stage. To verify the superiority of mpN stage, we included significant prognostic factors in univariate analysis, plus mpN stage, in multivariate survival analysis and showed that mpN stage remained a significant independent prognostic factor; however, TD status and pN stage were not statistically significant. mpN stage was thus a better predictor of prognosis than pN stage. The results of AUC and AIC analyses also showed that mpN stage had higher discriminating and model-fitting abilities than pN stage, and DCA also showed that mpN stage had better clinical benefit than pN stage between threshold probabilities of about 20%–40% in predicting 5-year OS. These results were further confirmed in the validation cohort, suggesting that mpN performed better in terms of predicting prognosis and had higher clinical utility than pN stage in patients with CRC.
However, incorporating TD status into the TNM staging system may have challenges. First, a previous report indicated that approximately 25% of patients with stage III colon cancer had positive TDs (27), while only about 13% of patients with stage III CRC in this study had positive TDs, which was similar to some previous studies based on the SEER database (6, 28). The incidence of TDs is thus variable and depends on the definition and selection criteria used by different researchers (15). This variation is mirrored by the different names used for TDs, including tumor nodules, non-nodal metastatic foci, tumor deposits, extra-nodal foci, extra-bowel skipped cancer infiltration, neoplastic foci, extra-nodal cancer deposits, and mesorectal microfoci. Although the definition of TDs has been revised many times, there is currently no consensus on their exact definition, making it difficult for pathologists to assess the TD status of CRC patients. It is therefore, clinically important to establish a consensus definition of TDs before introducing them into the TNM staging system. In addition, the role of TDs in the spread of CRC has not been fully clarified. Various processes ultimately lead to TDs, and because they are difficult to distinguish, the process responsible for causing them is usually unknown (15). However, lymphatic invasion, lymph node metastases, vascular invasion, and perineural invasion may all lead to TDs, all of which are collectively or individually related to a poor prognosis.
This study had some limitations. First, it showed that the AUC value of mpN stage was significantly higher than that of pN stage, but with a relatively large overlap in 95% CI. Second, this was a large-scale retrospective study, and a lack of rigorous experimental design may have caused selection bias; however, the sample size was large, which might reduce this risk. Third, the findings were based on the population in the United States, and further external validation in other countries is required. Furthermore, although the effect of TDs on disease-free survival of CRC patients is of great importance, we failed to obtain relevant information from the SEER database to allow this to be assessed, and further investigations are therefore required.
Conclusions
The current study suggests that the presence of TDs is a valuable indicator of a poor prognosis in patients with advanced CRC, particularly in the presence of nodal metastasis. The mpN stage including TD status may provide more accurate prognostic predictions than pN stage, and may thus help clinicians to make better therapeutic decisions. However, the current findings should still be cautious and require further validations by prospective randomized studies.
Data Availability Statement
The datasets analyzed during this current study are available in SEER database (https://seer.cancer.gov/) to extract the eligible cases. The data are also available from the corresponding author on reasonable request.
Ethics Statement
Ethics approval and consent was obtained from the Surveillance, Epidemiology, and End Results database.
Author Contributions
J-PP and C-DZ have contributed equally to this work as co-first authors. J-PP and C-DZ wrote the main text and performed data analysis. J-PP, C-DZ, and D-QD designed the study. J-PP, C-DZ, YL, CZ, K-ZW, Y-ZL, and Z-MZ collected the data. All authors contributed to the article and approved the submitted version.
Funding
This research was supported in part by the China Scholarship Council, grant number 201908050148.
Conflict of Interest
The authors declare that the research was conducted in the absence of any commercial or financial relationships that could be construed as a potential conflict of interest.
Acknowledgments
We acknowledge the efforts of the Surveillance, Epidemiology, and End Results (SEER) Program tumor registries for creating the SEER database (https://seer.cancer.gov/).
References
1. Siegel RL, Miller KD, Jemal A. Cancer statistics, 2019. CA: Cancer J Clin (2019) 69:7–34. doi: 10.3322/caac.21551
2. Sobin L, Wittekind C. TNM Classification of Malignant Tumors. 5th edn. New York, NY: John Wiley & Sons: Springer (1997).
3. Greene FL, Page DL, Fleming ID, Fritz A, Balch CM, Haller DG, et al. American Joint Committee on Cancer (AJCC) Cancer Staging Manual. 6th edn. New York, NY: Springer (2002).
4. Edge SB, Byrd DR, Compton CC, Fritz AG, Greene FL, Trotti A. AJCC Cancer Staging Manual. 7th edn. New York, NY: Springer (2010).
6. Liu F, Zhao J, Li C, Wu Y, Song W, Guo T, et al. The unique prognostic characteristics of tumor deposits in colorectal cancer patients. Ann Trans Med (2019) 7:769. doi: 10.21037/atm.2019.11.69
7. Pricolo VE, Steingrimsson J, McDuffie TJ, McHale JM, McMillen B, Shparber M. Tumor Deposits in Stage III Colon Cancer: Correlation With Other Histopathologic Variables, Prognostic Value, and Risk Stratification—Time to Consider “N2c”. Am J Clin Oncol (2020) 43:133. doi: 10.1097/COC.0000000000000645
8. Li J, Yang S, Hu J, Liu H, Du F, Yin J, et al. Tumor deposits counted as positive lymph nodes in TNM staging for advanced colorectal cancer: a retrospective multicenter study. Oncotarget (2016) 7:18269. doi: 10.18632/oncotarget.7756
9. Akaike H. A new look at the statistical model identification. Autom Control Trans (1974) 19:716–23. doi: 10.1109/TAC.1974.1100705
10. Fitzgerald M, Saville BR, Lewis RJ. Decision curve analysis. Jama (2015) 313:409–10. doi: 10.1001/jama.2015.37
11. Vickers AJ, Elkin EB. Decision curve analysis: a novel method for evaluating prediction models. Med Decision Making (2006) 26:565–74. doi: 10.1177/0272989X06295361
12. Gabriel W, Dukes C, Bussey H. Lymphatic spread in cancer of the rectum. Br J Surg (1935) 23:395–413. doi: 10.1002/bjs.1800239017
13. Sobin L, Wittekind C. TNM: classification of malignant tumours. 6th edition. New York. USA: Wiley (2002).
14. Chen VW, Hsieh MC, Charlton ME, Ruiz BA, Karlitz J, Altekruse SF, et al. Analysis of stage and clinical/prognostic factors for colon and rectal cancer from SEER registries: AJCC and collaborative stage data collection system. Cancer (2014) 120:3793–806. doi: 10.1002/cncr.29056
15. Nagtegaal I, Quirke P. Colorectal tumour deposits in the mesorectum and pericolon; a critical review. Histopathology (2007) 51:141–9. doi: 10.1111/j.1365-2559.2007.02720.x
16. Ueno H, Hashiguchi Y, Shimazaki H, Shinto E, Kajiwara Y, Nakanishi K, et al. Peritumoral deposits as an adverse prognostic indicator of colorectal cancer. Am J Surg (2014) 207:70–7. doi: 10.1016/j.amjsurg.2013.04.009
17. Jin M, Roth R, Rock JB, Washington MK, Lehman A, Frankel WL. The impact of tumor deposits on colonic adenocarcinoma AJCC TNM staging and outcome. Am J Surg Pathol (2015) 39:109–15. doi: 10.1097/PAS.0000000000000320
18. Mayo E, Llanos AA, Yi X, Duan SZ, Zhang L. Prognostic value of tumour deposit and perineural invasion status in colorectal cancer patients: a SEER-based population study. Histopathology (2016) 69:230–8. doi: 10.1111/his.12936
19. Bouquot M, Creavin B, Goasguen N, Chafai N, Tiret E, André T, et al. Prognostic value and characteristics of N1c colorectal cancer. Colorectal Dis (2018) 20:O248–O55. doi: 10.1111/codi.14289
20. Landau MA, Zhu B, Akwuole FN, Pai RK. Histopathological predictors of recurrence in stage III colon cancer: reappraisal of tumor deposits and tumor budding using AJCC 8th criteria. Int J Surg Pathol (2019) 27:147–58. doi: 10.1177/1066896918787275
21. Ueno H, Mochizuki H, Hashiguchi Y, Ishiguro M, Miyoshi M, Kajiwara Y, et al. Extramural cancer deposits without nodal structure in colorectal cancer: optimal categorization for prognostic staging. Am J Clin Pathol (2007) 127:287–94. doi: 10.1309/903UT10VQ3LC7B8L
22. Song YX, Gao P, Wang ZN, Liang JW, Sun Z, Wang MX, et al. Can the tumor deposits be counted as metastatic lymph nodes in the UICC TNM staging system for colorectal cancer? PloS One (2012) 7:e34087. doi: 10.1371/journal.pone.0034087
23. Frankel WL, Jin M. Serosal surfaces, mucin pools, and deposits, oh my: challenges in staging colorectal carcinoma. Modern Pathol (2015) 28:S95–S108. doi: 10.1038/modpathol.2014.128
24. Nagtegaal ID, Knijn N, Hugen N, Marshall HC, Sugihara K, Tot T, et al. Tumor deposits in colorectal cancer: improving the value of modern staging-a systematic review and meta-analysis. J Clin Oncol (2017) 35:1119–27. doi: 10.1200/JCO.2016.68.9091
25. Basnet S, Lou QF, Liu N, Rana R, Shah A, Khadka M, et al. Tumor deposit is an independent prognostic indicator in patients who underwent radical resection for colorectal cancer. J Cancer (2018) 9:3979–85. doi: 10.7150/jca.27475
26. Rice TW, Rusch VW, Ishwaran H, Blackstone EH, Collaboration WEC. Cancer of the esophagus and esophagogastric junction: Data-driven staging for the seventh edition of the American Joint Committee on Cancer/International Union Against Cancer Cancer Staging Manuals. Cancer (2010) 116:3763–73. doi: 10.1002/cncr.25146
27. Wong-Chong N, Motl J, Hwang G, Nassif GJ Jr, Albert MR, Monson JRT, et al. Impact of tumor deposits on oncologic outcomes in stage III colon cancer. Dis Colon Rectum (2018) 61:1043–52. doi: 10.1097/DCR.0000000000001152
Keywords: colorectal cancer, lymph node, overall survival, prognosis, tumor deposit
Citation: Pei J-P, Zhang C-D, Liang Y, Zhang C, Wu K-Z, Li Y-Z, Zhao Z-M and Dai D-Q (2020) A Modified Pathological N Stage Including Status of Tumor Deposits in Colorectal Cancer With Nodal Metastasis. Front. Oncol. 10:548692. doi: 10.3389/fonc.2020.548692
Received: 03 April 2020; Accepted: 16 October 2020;
Published: 11 November 2020.
Edited by:
Quirino Lai, Sapienza University of Rome, ItalyReviewed by:
Iris Nagtegaal, Radboud University Nijmegen Medical Centre, NetherlandsCesare Ruffolo, University Hospital of Padua, Italy
Copyright © 2020 Pei, Zhang, Liang, Zhang, Wu, Li, Zhao and Dai. This is an open-access article distributed under the terms of the Creative Commons Attribution License (CC BY). The use, distribution or reproduction in other forums is permitted, provided the original author(s) and the copyright owner(s) are credited and that the original publication in this journal is cited, in accordance with accepted academic practice. No use, distribution or reproduction is permitted which does not comply with these terms.
*Correspondence: Dong-Qiu Dai, daidq63@163.com; cmudaidq@126.com
†These authors have contributed equally to this work and share first authorship