
94% of researchers rate our articles as excellent or good
Learn more about the work of our research integrity team to safeguard the quality of each article we publish.
Find out more
ORIGINAL RESEARCH article
Front. Oncol. , 02 September 2020
Sec. Cancer Genetics
Volume 10 - 2020 | https://doi.org/10.3389/fonc.2020.01707
 Guangwen Yuan1†
 Jinge Song2,3†
 Ning Li1Qianqian Song2
 Yifei Li2Yingxi Du2
 Xiaobing Wang2*Yuchen Jiao2*Lingying Wu1*
Purpose: Gynecological melanomas (GMs) are rare tumors with a poor prognosis. Here, we performed exome sequencing to generate the mutational landscape of GMs.
Methods: Next-generation sequencing was carried out on mucosal melanoma samples (n = 35) obtained from gynecological sites. The alternative telomere lengthening (ALT) phenotype was verified by fluorescence in situ hybridization and the C-circle assay. Immunohistochemistry was performed to detect ATRX protein. Copy number variations in TERT were detected by droplet digital polymerase chain reaction.
Results: In the 58 formalin-fixed paraffin-embedded samples, we identified 33 (56.9%) ALT-positive cases, with 23 showing loss of ATRX protein. TERT promoter mutation was not detected in GMs (n = 40), but copy number variations in the TERT region were observed in 20% (7/35) of the samples. TERT amplification was mutually exclusive with ALT (P < 0.05). Kaplan–Meier revealed that ALT relative to TERT amplification was associated with longer overall survival in GM patients without metastasis.
Conclusion: These findings indicate that telomere maintenance mechanisms play a critical role in the tumorigenesis of GMs and may aid in the prediction of clinical prognosis and the development of targeted therapy for the treatment of GM.
Melanoma causes about 10,000 deaths in the United States every year and thousands more worldwide (1). In China, approximately 8,000 new cases and 3,200 deaths are estimated to have occurred in 2015 (2). However, the epidemiology is strikingly different between Caucasians and Asians. Cutaneous melanoma (CM) caused by ultraviolet radiation is the major subtype in Caucasians, whereas acral lentiginous melanomas (ALMs) and mucosal melanomas occur at a higher frequency in Asians (3, 4). Mucosal melanoma is characterized by occurrence on sun-shielded skin sites such as head and neck, the anorectum, and the female genital tract. The incidence of mucosal melanoma is higher among females than males, which is due to the relatively high incidence of genital tract melanomas occurring predominantly in the vulva and vagina (4).
Although the molecular characterization of ALMs and mucosal melanoma remains limited, some notable differences from CMs have been identified. For example, BRAF mutation is one of the most commonly mutated genes in CMs (40–60%) (5, 6), but appears in only approximately 25% of ALMs and mucosal melanomas (7). The molecular mechanisms driving mucosal melanoma development may be distinct and thus lead to specific cancer treatments.
Cancer development involves the progressive corruption of many antitumor molecular mechanisms, some of which bypass the critical checkpoint control of telomere shortening, which enable indefinite proliferation. Telomere maintenance mechanisms (TMMs) include telomerase activation or a telomerase-independent pathway called alternative lengthening of telomeres (ALT) (8). ALT cells show a set of unusual characteristics, including the generation of extrachromosomal telomere repeats, the presence of ALT-associated PML bodies, and frequent intrachromosomal and interchromosomal telomere exchange (9), which is associated with homologous recombination. ALT occurs in 10 to 15% of human cancers, including osteosarcoma, and glioblastoma (10). However, most cancer cells maintain telomere length through telomerase activation. Telomerase is a complex of a reverse transcriptase, TERT, and an RNA moiety, TERC (telomerase RNA component), which synthesizes telomeric DNA repeat sequences at the 3′ end of a linear chromosome (11, 12). Somatic mutations in various genes have been associated with these two different TMMs. For instance, in CM, the dominant variation about TMM is TERT promoter mutation, whereas ALT-associated mutations have never been reported (13). ALT is also associated with genetic inactivation or loss of expression of the histone H3.3, and the chaperone proteins ATRX and DAXX (10), which incorporate H3.3 (encoded by H3F3A or H3F3B) into telomeric and pericentric chromatin (14). Finally, a recent study demonstrated that mutation of SMARCAL1 could activate the ALT phenotype independent of ATRX mutation (15).
In this study, we performed exome sequencing on 35 mucosal melanoma samples obtained from gynecologic sites (GMs), which yielded a genetic landscape that was significantly different from that of CMs. The characteristic mutational pattern in the TMM-associated genes indicated distinct TMM in GMs, which were further validated with fluorescence in situ hybridization (FISH) or droplet digital polymerase chain reaction (ddPCR). This study highlights the significance of telomere maintenance alterations in the tumorigenesis of GMs and provides potential diagnostic markers and therapeutic targets for these melanomas.
The study was approved by the Institutional Review Board of Cancer Hospital, Chinese Academy of Medical Sciences (trial registration ID: 19/221-2005). Tumor samples were obtained from Chinese female patients with GMs at Cancer Hospital, Chinese Academy of Medical Sciences, with written informed consent. Matched normal samples were not available for four cases. Clinical information, including age, tumor site, pathological stage (according to TNM classification), overall survival (OS), and status, was collected (Supplementary Table S1). Sequencing data for CM (TCGA-SKCM) samples (n = 468) were obtained from The Cancer Genome Atlas (TCGA) and for ALMs and uveal melanomas (UVMs) from previous studies (6, 16–19).
At first, whole-exome sequencing (WES) was performed on samples with frozen tissues (n = 20). Then formalin-fixed paraffin-embedded (FFPE) samples (n = 58; including 20 cases with frozen tissues) were screened with FISH. After that, we sequenced the exome in ALT-positive FFPE samples with sufficient DNA. Sanger sequencing and ddPCR were applied to detect TERT variations in ALT-negative FFPE samples and ALT-positive FFPE samples without enough DNA to finish WES. Cases with both FFPE and frozen tissue samples (n = 20) participated in all experiments because sufficient DNA could be extracted. Finally, immunohistochemistry (IHC) was conducted on FFPE samples for ATRX protein detection. The schematic diagram and the detailed information for each sample are indicated in Supplementary Figure S1 and Supplementary Table S1.
DNA was extracted from frozen tumor tissues or white blood cells (WBCs) using the QIAamp DNA Mini Kit (51306; Qiagen; Germantown, MD, United States). FFPE DNA was extracted using the Gene Read FFPE DNA Kit (1080391; Qiagen). All samples were quantified using the Qubit dsDNA HS Assay (Q32866; Life Technologies/Thermo Fisher Scientific, Waltham, MA, United States).
Whole-exome sequencing was performed on DNAs isolated from fresh-frozen GM tissues (n = 20) and ALT-positive FFPE samples (n = 15) selected through FISH analysis of 58 FFPE samples. The normal control for three samples was not available, and FFPE DNAs for another six ALT-positive samples could not be isolated because of insufficient tissue (Supplementary Figure S1).
DNA library preparation for tumor-normal pairs (n = 32) and tumor-only samples (n = 3; FFPE samples with insufficient normal tissue) was performed using the KAPA HyperPrep Kit (KK8504; KAPA Biosystems; Wilmington, MA, United States) and captured using next-generation sequencing exome probes (V5-5990-9857EN; Agilent, Santa Clara, CA, United States) with the SureSelect QXT Target Enrichment Kit-ILM-Hyb Module Box2 (5190-7334, Agilent). All captured libraries were sequenced on an Illumina HiSeq2000 platform (Illumina, San Diego, CA, United States). The sequencing data were shared on Genome Sequence Archive (ID: CRA002180; CRA002926).
We identified somatic variants using the GATK Best Practices Pipeline (software.broadinstitute.org; Broad Institute, Boston, MA, United States). After Illumina sequencing, all produced FASTQ reads were quality-checked and trimmed with FastQC (version 0.11.2; http://www.bioinformatics.babraham.ac.uk/projects/fastqc/) and Trimmomatic (version 0.33) (20). Sequencing reads were aligned to human genome hg19 with the BWA MEM software for both tumor and normal samples (21). Picard software (version 1.103; https://broadinstitute.github.io/picard/) was used to mark PCR duplications of each BAM file, which was locally realigned, and the base quality scores were recalibrated with GATK (version 3.1) (22). MuTect (version 1.1.6) was used to call single-nucleotide variants (SNVs) with default parameters (23). Only SNVs that were classified as “KEEP” by MuTect were used for downstream analysis. Indels were called using Strelka (version 1.0.14) with default parameters (24). All the somatic variants were validated with IGV and annotated with Variant Effect Predictor (version 83; Supplementary Tables S2–S4) (25). We analyzed mutation signature of 32 samples using the Wellcome Trust Sanger Institute mutational signatures framework with the algorithm known as non-negative matrix factorization (26).
Telomere length was assessed using FISH in the 58 samples with available FFPE tissues. Briefly, deparaffinized slides were hydrated, steamed for 20 min in citrate buffer (H-3300; Vector Laboratories, Burlingame, CA, United States), dehydrated, and hybridized with a Cy3-labeled peptide nucleic acid (PNA) probe complementary to the mammalian telomere repeat sequence [(N-terminus to C-terminus; CCCTAA)3]. Posthybridization washes were performed, followed by nuclear counterstaining with DAPI. Fluorescence images were captured under fluorescence microscopy (Leica DM2500, Buffalo Grove, IL, United States) using CytoVision (Leica).
Fluorescence in situ hybridization slides were assessed and scored independently. Large, ultrabright telomere repeat DNA aggregates are unique to ALT-positive cell populations and are larger and brighter than FISH signals emanating from individual telomeres in the same samples (detailed discussion of these foci as surrogate markers for the ALT phenotype can be seen below).
Alternative telomere lengthening-positive and -negative GMs were classified using the following criteria: ALT-positive samples (i) neoplastic cells demonstrated individual telomeric foci with the presence of intranuclear foci, ultrabright telomere FISH signals; and (ii) >1% of tumor cells displayed these alternative lengthening of telomeres-associated telomeric foci; ALT-negative samples: tumor samples in which no ALT-associated telomeric foci were found in at least 5,000 cells were considered ALT-negative. Areas showing necrosis were not included in the evaluation. The specific criteria used for interpreting the FISH result were the same as those defined previously (27).
We performed rolling circle amplification of C-circles as described (28). For each sample, the assay was performed with and without phi29 polymerase (M0269S; New England Biolabs, Ipswich, MA, United States). Seven microliters of each sample (10 ng) was mixed with 3 μL of 10 μg/μL bovine serum albumin, 10% Tween, 10% DTT, dNTP mix, Phi29 buffer, and Phi29 DNA polymerase and incubated at 30°C for 8 h followed by 65°C for 20 min.
C-circle assay products were diluted 1:4 in Tris–EDTA (10 mM Tris, 0.1 mM EDTA, pH 7.6), and 5 μL of the diluted product was used for each PCR (triplicate telomere PCR of CC assay/phi29+, triplicate telomere PCR of C-circle assay/phi29-). The qPCR master mix contained the following: 1 × QuantiTECT SYBR Green Master Mix (4309155; Life Technologies/Thermo Fisher Scientific), 0.1 M DTT, 0.5 μL dimethyl sulfoxide, and 10 μM of both forward and reverse primers. PCR conditions were the following: 95°C for 15 min, 35 cycles of 95°C for 15 s, and 54°C for 2 min. The C-circle signal for a telomerase positive cancer cell line, HeLa (negative control), as well as for a prototype of ALT-positive cells, U2OS (positive control), were measured under identical conditions. The cell lines were acquired from ATCC.
A subset of tumors (n = 47) was analyzed for ATRX nuclear staining. Antigen retrieval was performed in a steamer using citrate buffer (H-3300; Vector Laboratories) for 30 min. Endogenous peroxidase was blocked (PV9001; ZSGB-BIO, Beijing, China), and serial sections were then incubated with primary antibody against ATRX (1:100 dilution; sc-55584; Santa Cruz, Dallas, TX, United States) overnight at 4°C. To detect primary antibody, slides were incubated with secondary antibody (PV9001, ZSGB-BIO) for 30 min, counterstained with Harris hematoxylin, rehydrated, and mounted. Staining of the GM slides was assessed and scored; epithelial cells and stromal cells were used as internal controls to display nuclear staining for ATRX (Supplementary Figure S2). ATRX expression in all samples is listed in Supplementary Table S5.
Targeted amplification and sequencing were performed on the TERT promoter region containing the two most common mutations identified in human cancers, C228T, and C250T. The following primers were used for PCR amplification (489bp) and Sanger sequencing of DNAs isolated from fresh-frozen tissue samples: hTERT-F 5′-gtaaaacgacggccagt-GGCCGATTCG ACCTCTCT-3′ and hTERT-R: 5′-AGCACCTCGCGGTAGTGG-3′. The sequences of the primers used for amplification of DNA from FFPE samples were the following: hTERT-FFPE-F: 5′-ccaggccgggctcccagt-3′ and hTERT-FFPE-R: 5′-gaaggggagg ggctgggagg-3′. PCR was performed in a total reaction volume of 50 μL, containing 25 μL 2 × GoldStar MasterMix (CW0939S; CWBIO, Beijing, China), 2 μL primer F (10 mM), 2 μL primer R (10 mM), 30 ng DNA template, and ddH2O to 50 μL. The following cycling conditions were used: 95°C for 10 min, followed by 35 cycles of 95°C for 30 s, annealing at 65°C for 30 s, and polymerization at 72°C for 1 min.
TERT gene copy number variants were quantified with the QuantStudioTM 3D Analysis SuiteTM according to the manufacturer’s instructions (Thermo Fisher Scientific). Chips were read in the Quantstudio 3D chip reader to obtain raw fluorescence values and analyzed on QuantStudioTM 3D AnalysisSuiteTM. ddPCR reagents are partitioned into 20,000 droplets before reactions proceed to the reaction plateau end point in individual droplets. Droplets are evaluated as positive or negative based on fluorescence signal intensity. A representative quantitative map is in Supplementary Figure S3. For each sample, a specified amount of DNA template was used as the expected quantity (ng). After the template was combined with the Taqman probe (Applied BiosystemsTM TaqManTM Liquid Biopsy dPCR Assay, A44177; Applied Biosystems, Waltham, MA, United States) and amplified with the primers, the actual copy numbers were read and converted into the measured quantity (ng). The ratio of the measured quantity A (ng) to the expected quantity B (ng) times the number of reference species copies NB in the human genome (copy number = A/B × NB) was used to calculate copy number. The copy number of the TERT promoter in normal cells was 2 copies/cell as detected in WBCs (Supplementary Table S6). The threshold for TERT amplifications was 4 copies/cell and for loss, 1 copy/cell.
Statistical significance was determined with one-way analysis of variance (ANOVA; Sidak multiple-comparisons test) and the Fisher exact test. The log-rank (Mantel–Cox) test was used in Kaplan–Meier analysis. For determining presence of C-circles with qPCR, a Δmean Ct value (Δmean Ct = mean Ct of non-Φ29–treated samples −Φ29-treated sample) was calculated for each sample. A Δmean Ct value > 0.5 was considered positive (Supplementary Table S7), and results were also confirmed using the dot blot. Four levels of statistical significance were considered: *P ≤ 0.05; **P ≤ 0.01; ***P ≤ 0.001, and ****P ≤ 0.0001.
To investigate the genetic landscape of GM, we performed exome sequencing on 32 pairs of matched tumor/normal samples and three tumor samples without matched normal tissue. In the 32 pairs of samples, 1,646 somatic SNVs and 91 somatic indels were identified. The median number of somatic mutations in coding regions (missense, splice site, inframe indels, frameshift, start lost, and stop lost/gain) was 49 (range of ∼2 to 137 SNVs; Figure 1A and Supplementary Table S3). We compared the tumor mutational load of GMs with that of CMs, UVMs, and ALMs from the TCGA or previous studies (Methods; Figure 1B). The tumor mutational load was significantly higher in CMs (n = 468) than in the other three subtypes (P < 0.0001; one-way ANOVA; Sidak multiple-comparisons test; and 95% confidence interval). GMs (n = 32) and ALMs (n = 70) sustained more mutations than UVMs (n = 77; GMs vs. UVMs, P = 0.0001; ALMs vs. UVMs, P = 0.0006). There was no significant difference in the tumor mutational load between GMs and ALMs. Oncogenic mutations in BRAF were absent in GMs, although it was the most frequently mutated gene in CMs. Other commonly mutated genes in CM and UVM, such as NRAS, GNA11, and GNAQ, were also rarely altered in GMs (Figure 1C). Thus, the mutational landscape of GMs was distinct from the other subtypes of melanoma (Figure 1C).
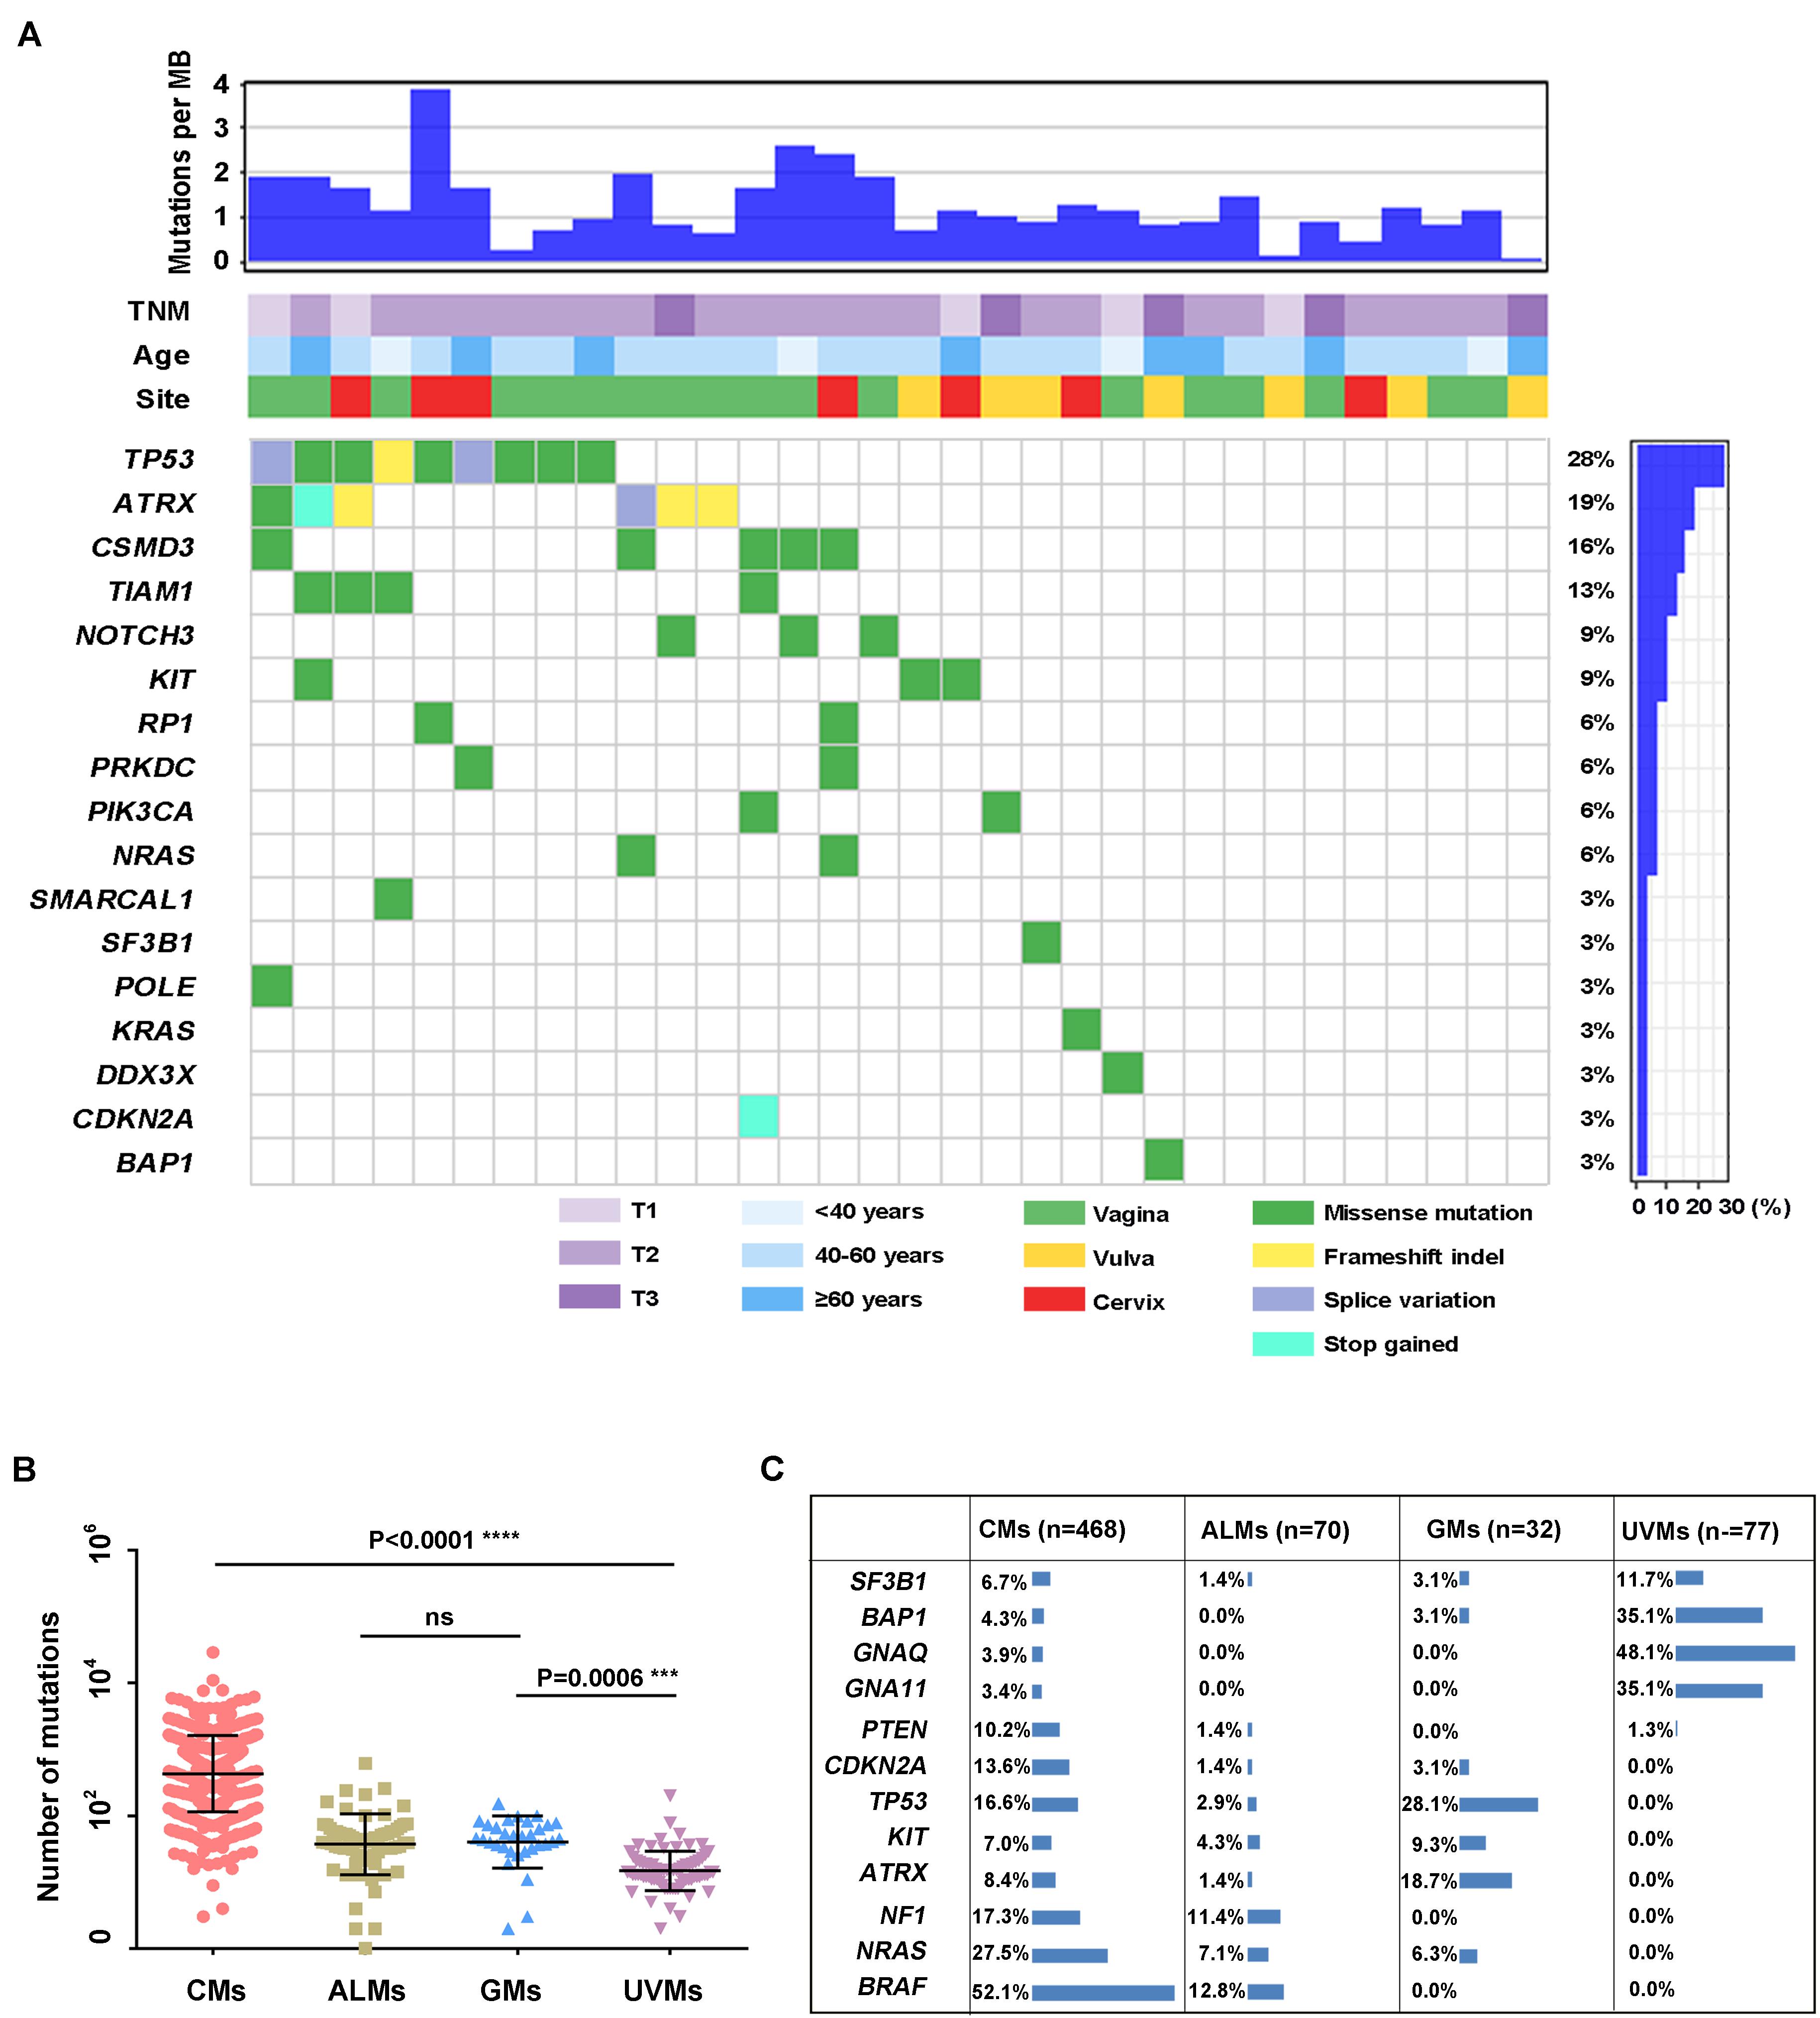
Figure 1. Summary of mutations detected in DNAs isolated from primary GM samples (n = 32). (A) Mutations and clinical data compiled for tumors from individual patients. Shown are the total number of somatic mutations in coding regions, mutations in frequently mutated genes in each sample, age at diagnosis, primary site, and TNM stage; (B) mutational load in different melanoma subtypes: CMs (n = 468), ALMs (n = 70), GMs (n = 32), and UVMs (n = 77; one-way ANOVA; Sidak multiple-comparisons test; 95% confidence interval); and (C) the frequency of selected published melanoma driver genes in CMs (the mutation frequency in TCGA database includes synonymous mutations), ALMs, GMs, and UVMs.
In the 32 GM cases, the percentage of C > T (equal to G > A) transitions reached 42.5% (Figure 2A). Other transition types with significant frequency in GMs included the following: C > A (equal to G > T) at 18.4%, T > C at 14.7%, and C > G at 11.5% (Figure 2A). These features were significantly different from the mutational signature of CMs associated with ultraviolet light exposure, in which C > T conversions appeared at a frequency of 85.7% (Figure 2A). In addition, there was a preference for a G in the position following the mutated C residue in GMs. However, CMs exhibited a strong preference for C in the position before and after the mutated C for C > T mutations because the ultraviolet-related signature is associated with frequent CC > TT dinucleotide mutations at dipyrimidines (Figure 2B). Two signatures (signature A and signature B) in GMs were identified with non-negative matrix factorization (26) based on the mutations identified from the exome sequencing (Figures 2C,D). We compared these two signatures to the Signatures of Mutational Processes in Human Cancer in the COSMIC database (29) and intended to figure out whether the known signatures have implication for the pathogenesis and mutational process of GMs. Signature A (Figure 2D), which predominated in 23 GM patients (proportion of signature A > 50% in each patient), showed a strong correlation [0.9306; cosine similarity value (CSV)] to the signature 1 from the COSMIC database. Signature 1, which is generated through endogenous spontaneous deamination of 5-methylcytosine and correlated with age cancer diagnosis, has been found in all cancer types. Signature B (Figure 2D) showed some similarity to both signature 5 (CSV = 0.716), which is ubiquitous in many types of cancers of unknown etiology, and signature 3 (CSV = 0.6756), which represents failure of DNA double-strand break-repair by homologous recombination. Signature 3 is also associated with germline and somatic BRCA1 and BRCA2 mutations in breast, pancreatic, and ovarian cancers. However, signature B did not correlate with any other known signatures in the COSMIC database with a dominant similarity. Signature 7, an important signature in CMs potentially caused by ultraviolet exposure, was not found in GMs.
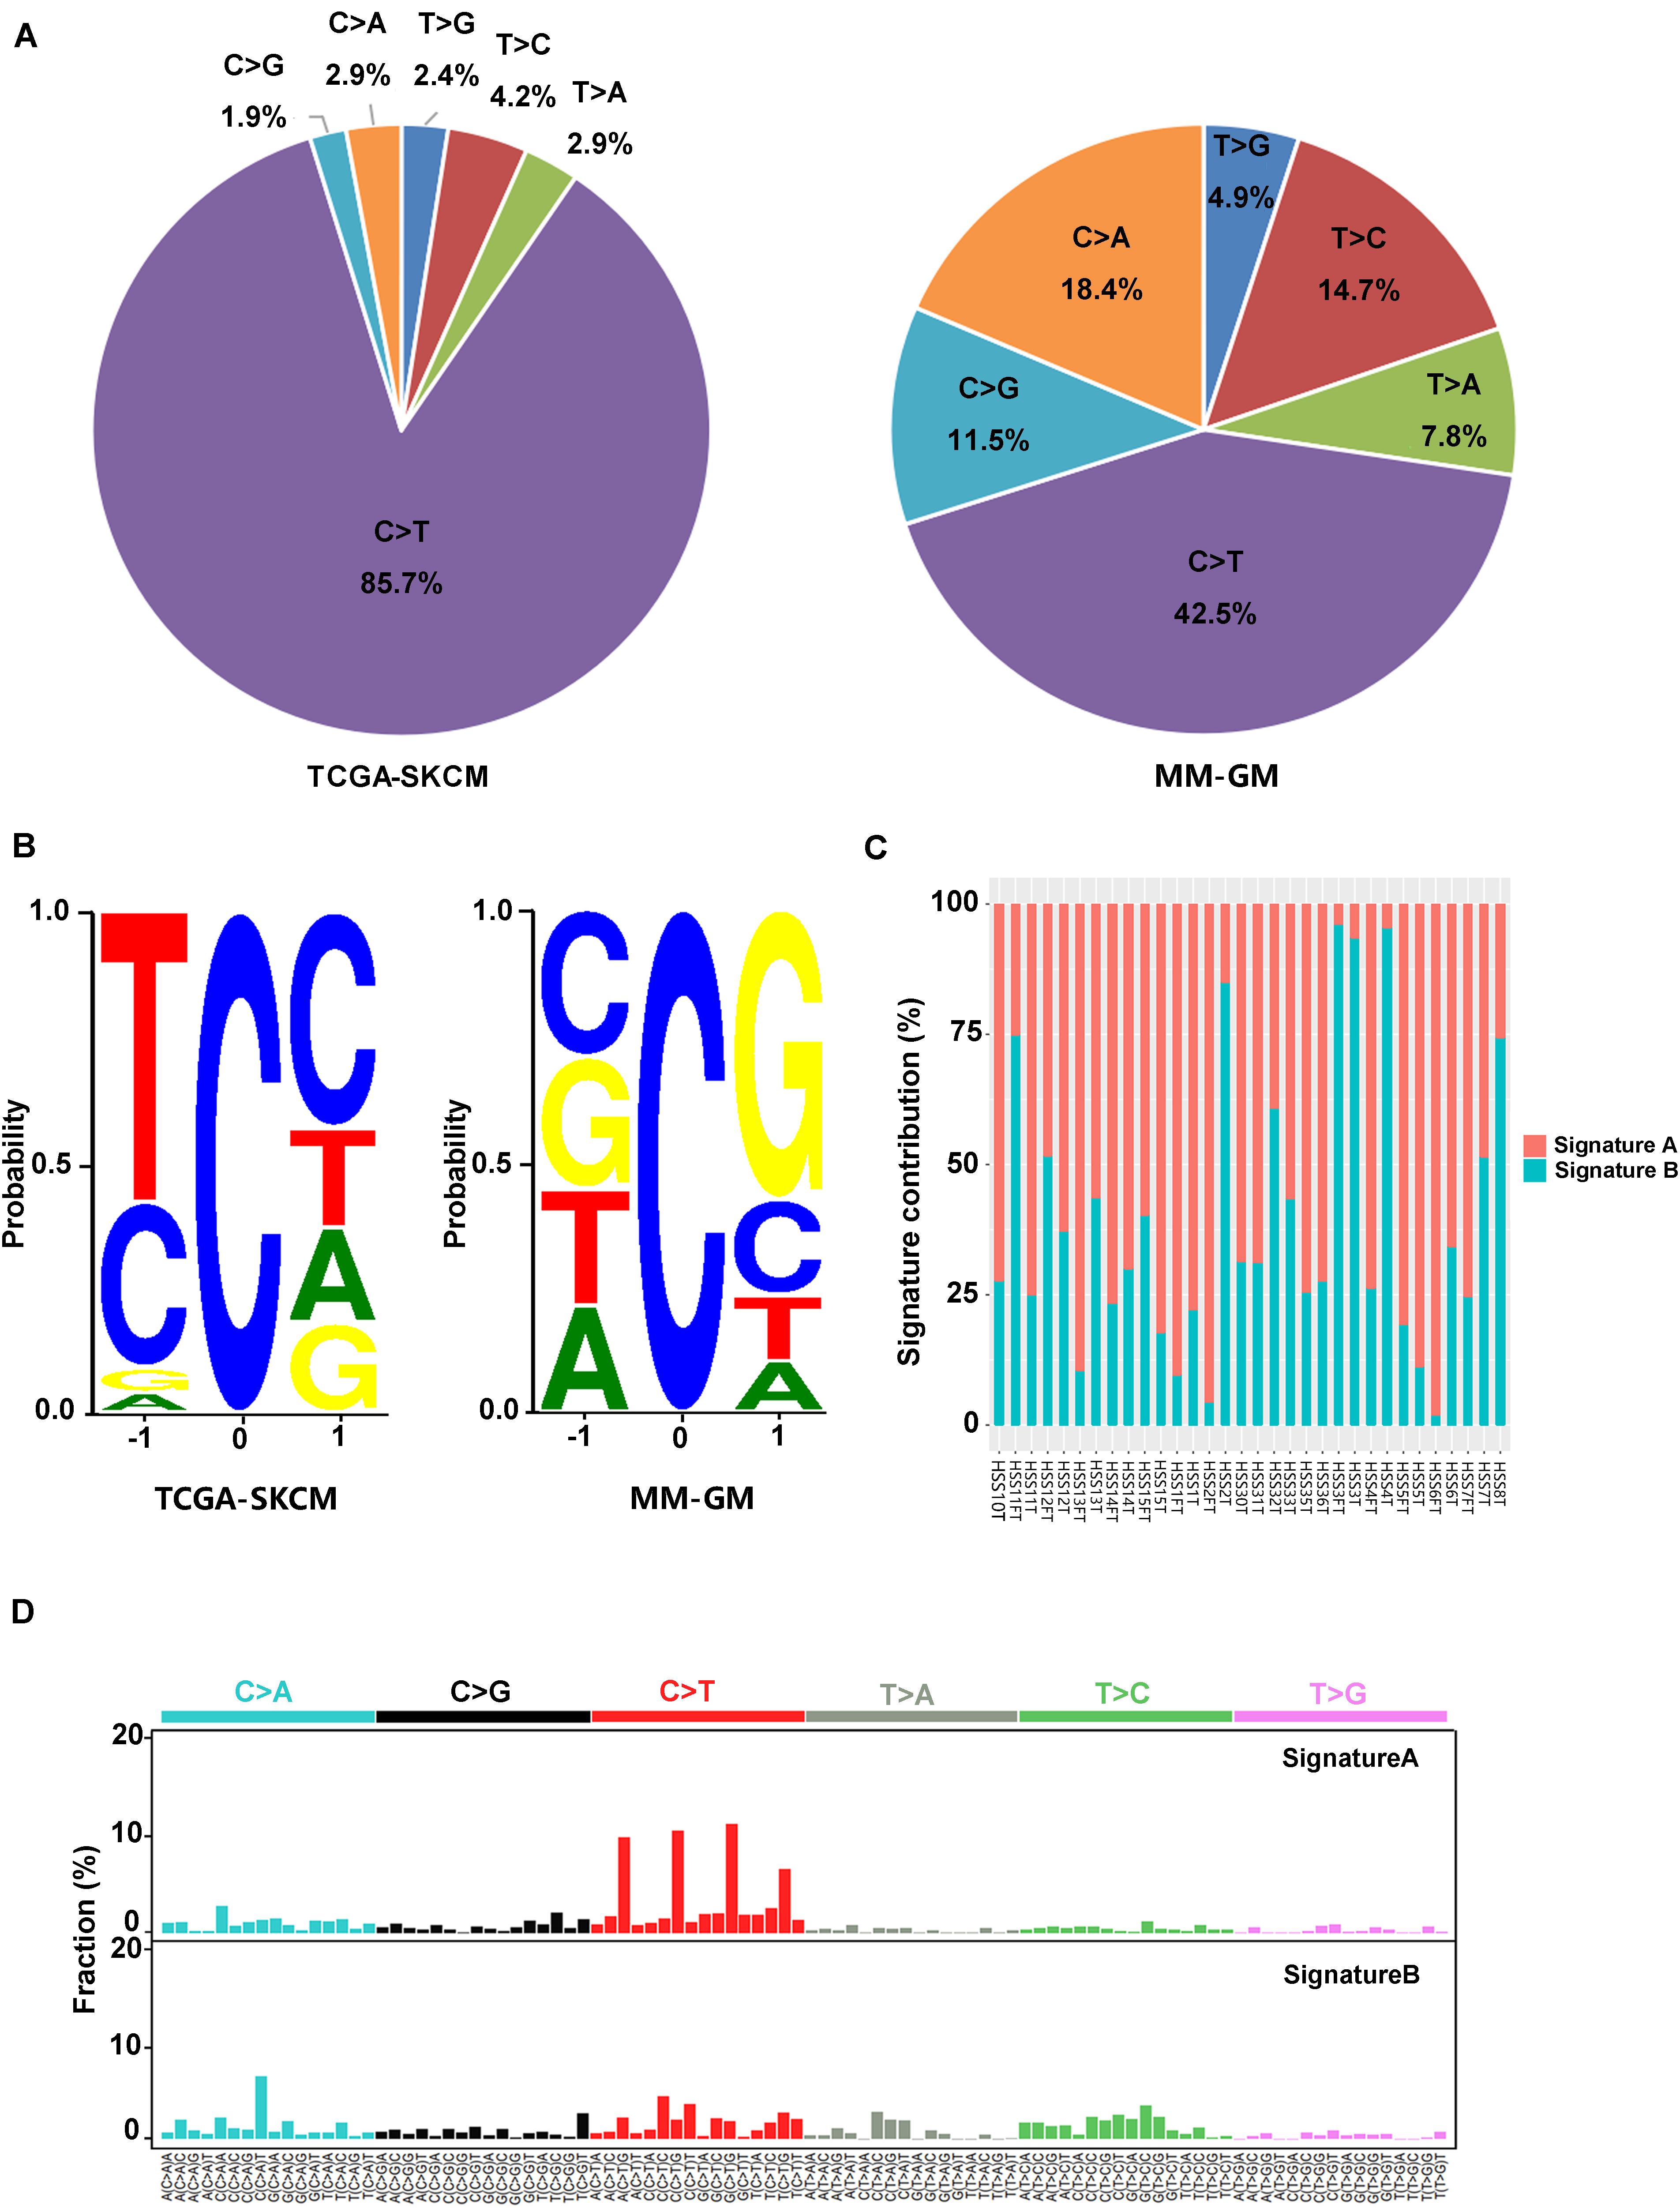
Figure 2. Mutation signatures in 32 GMs are distinct from CMs. (A) Percentage of the six possible mutation classes in the exomes of TCGA-SKCM (n = 468) and MM-GM; (B) sequence contexts of C > T mutations in TCGA-SKCM (n = 468) and MM-GM. The height of each base indicates the probability that the base appears at the position flanking the mutated cytosine; (C) distribution of the two signatures in each patient; and (D) pattern of two signatures (signatures A,B) observed in 32 GMs. The mutation types are displayed on the horizontal axes, and the percentage of mutations attributed to a specific mutation type on the vertical axes. MM-GM, gynecological mucosal melanoma.
Several recurrently mutated genes were identified in GMs. TP53 was the most frequently mutated gene in GMs (28.1%), which had no significant difference compared with CM (16.6%; Fisher exact test, P = 0.143). ATRX was the second frequently mutated gene (6/32, 18.7%), followed by CSMD3 (5/32, 15.62%), TIAM1 (4/32, 12.5%), NOTCH3 (3/32, 9.4%), and KIT (3/32, 9.4%; Figure 1A). Among these genes, the frequency of ATRX mutations exhibited the most significant difference between GMs and CMs. The frequency of ATRX mutations in GMs (6/32, 18.7%) was more than three times that of ATRX mutations in CM cases (29/468, 6.19%; Fisher exact test, P = 0.018; the mutation frequency in TCGA database excluded synonymous mutations). Furthermore, five of the six ATRX mutations in GMs were truncating mutations (three frameshift, one stop gained, and one splice site; Figure 3A). In CMs, most ATRX mutations were missense mutations (27/29). The frequency of ATRX truncating mutations was only 0.42% (2/468) in CMs, which was significantly different from the frequency in GMs [15.6% (5/32); P < 0.0001; Fisher exact test; Figure 3B]. To test whether the missense mutations were random in CMs, we selected six genes on chromosome X similar size to the coding region with ATRX. The mutation frequency of these six genes was similar to ATRX in CMs, but significantly lower than the mutation frequency of ATRX in GMs (Figure 3C). These results indicated that most of the ATRX mutations in CMs tended to be passenger mutations as a consequence of the large size of the coding region and the high mutational burden.
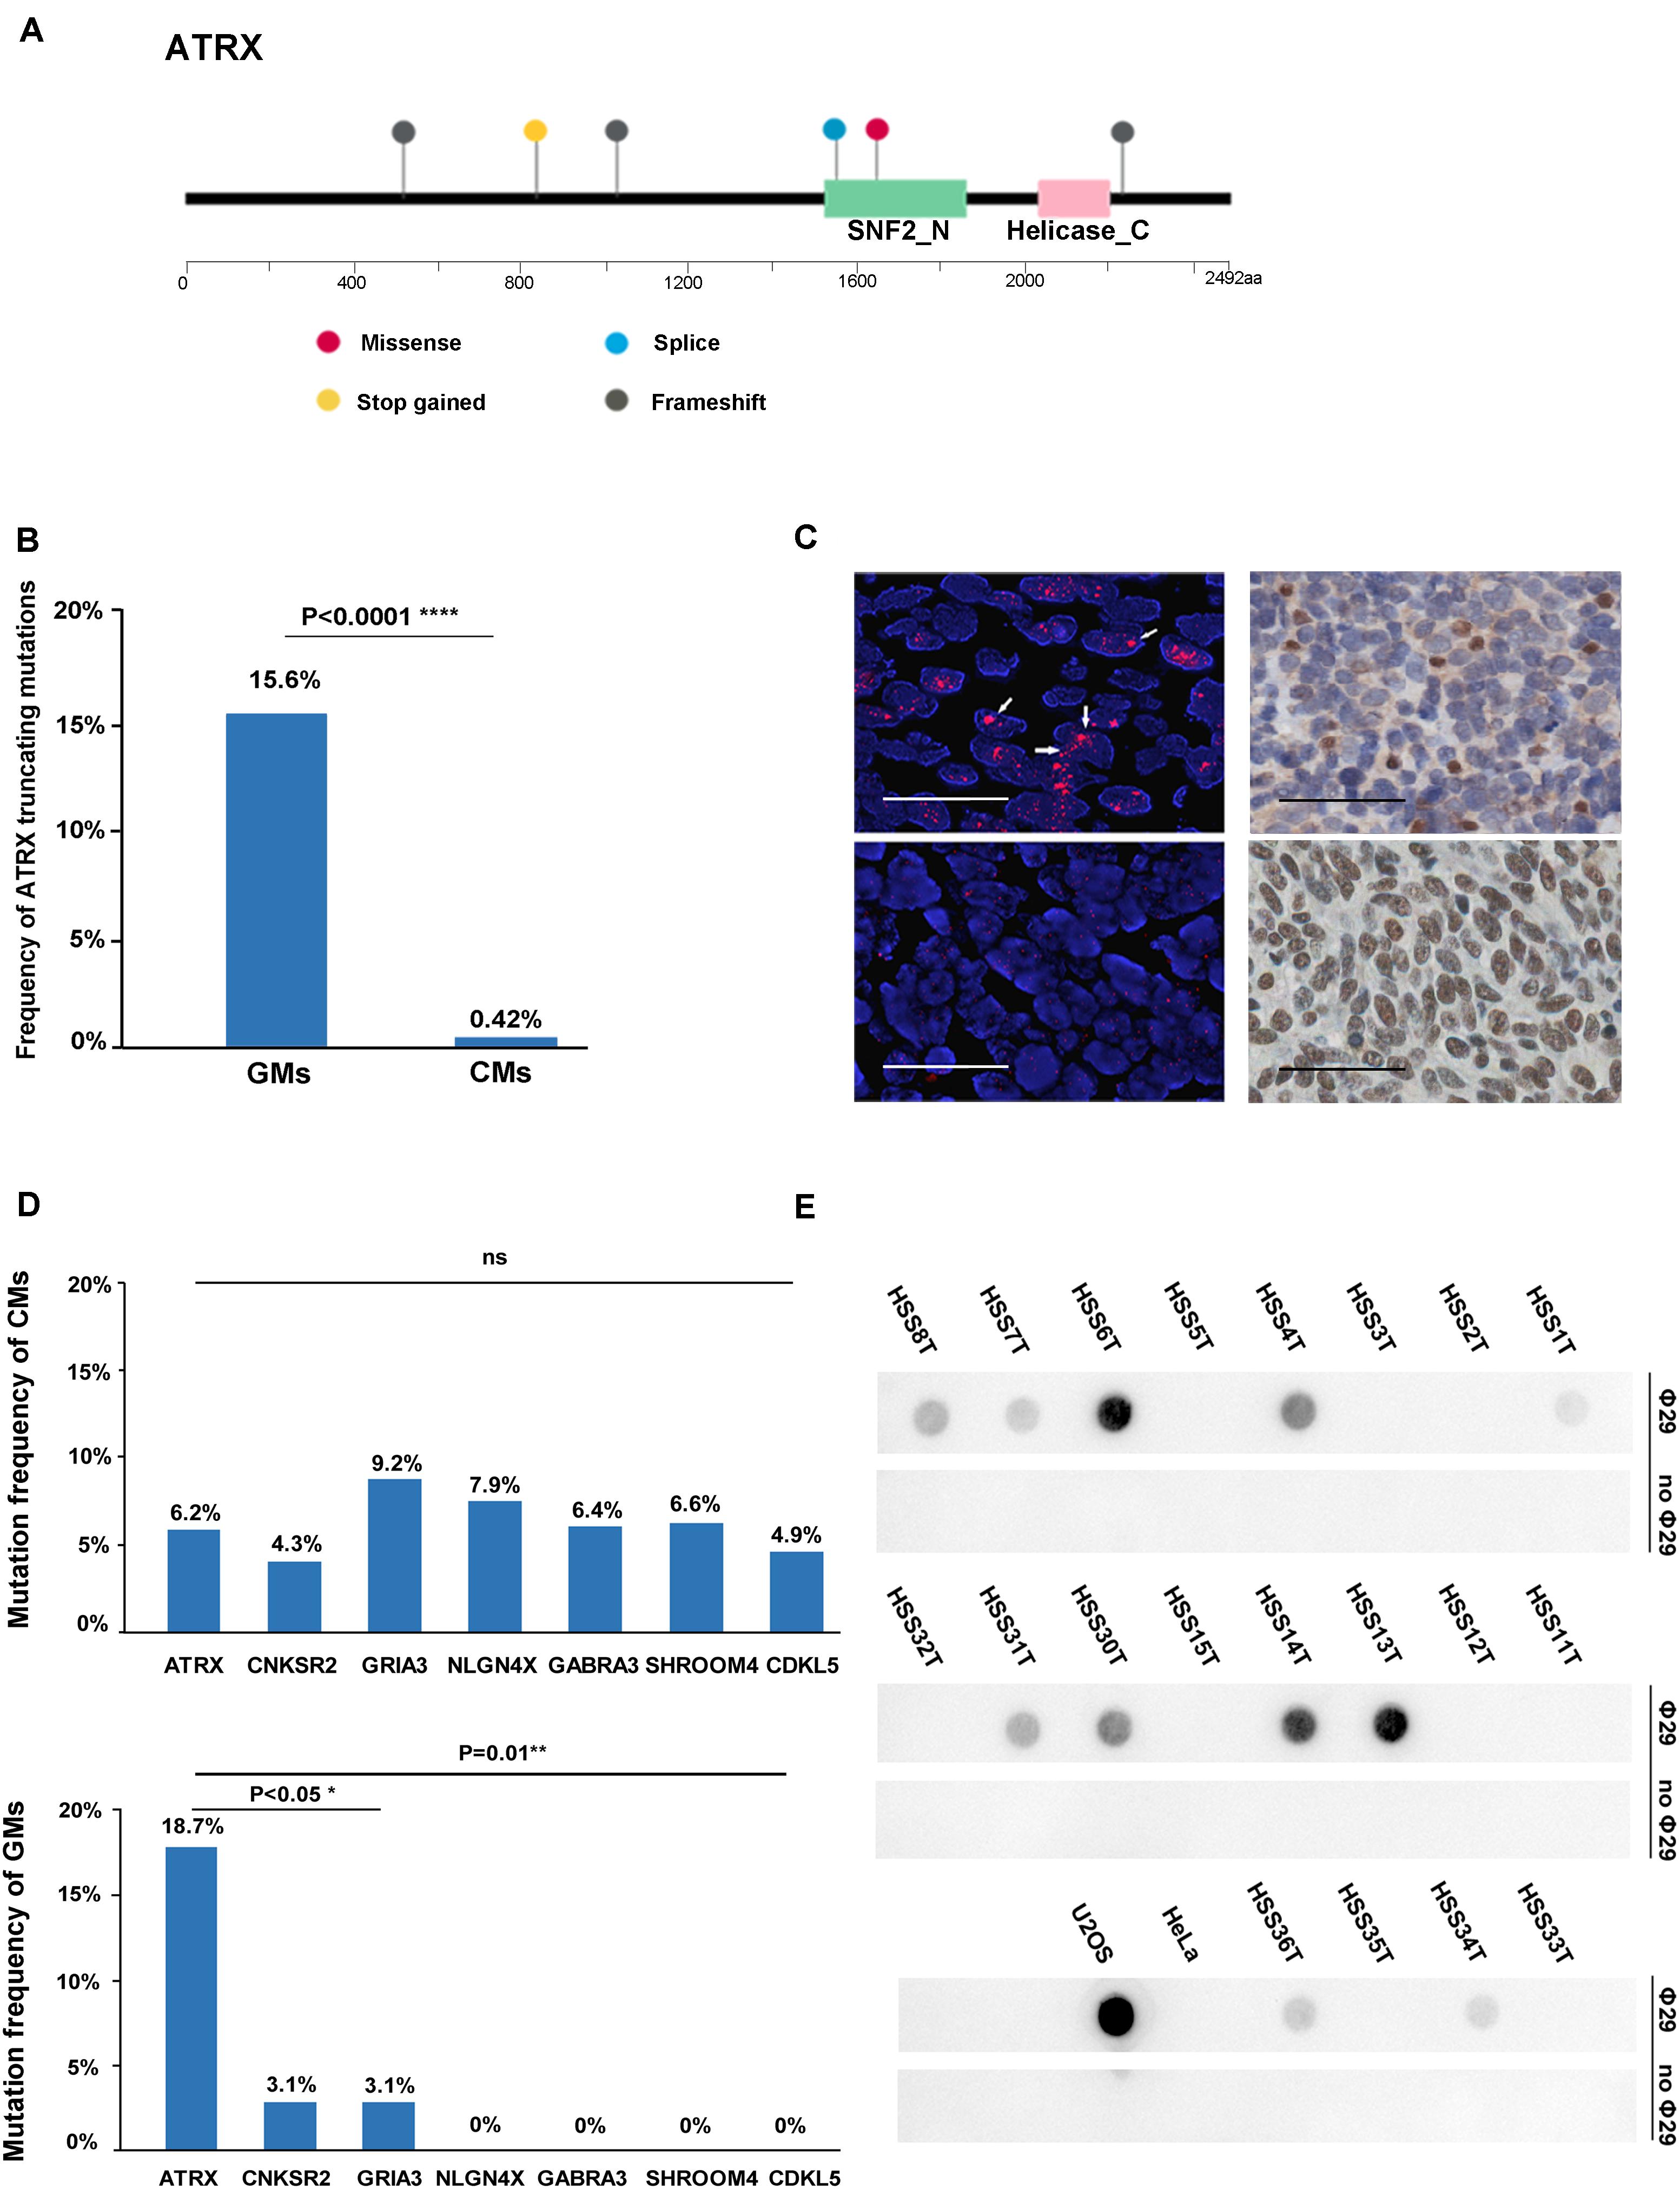
Figure 3. ATRX variations in the gene, protein, and function. (A) Diagram of the location of mutations across the coding region of ATRX in six GMs; (B) graphic representation of the frequency of truncating mutations in GMs (n = 32) and CMs (n = 468); (C) mutation frequency of similar-sized large genes on chromosome X: CNKSR2 (20/468,4.3%; chrX:21,393,016-21,659,655; and size: 266,640 bp), GRIA3 (43/468,9.2% chrX:122,318,388-122,616,895; and size: 298,508), NLGN4X (37/468,7.9%; chrX:5,808,083-6,146,706; and size: 338,624 bp), GABRA3 (30/468, 6.4%; chrX:151,335,634-151,619,831; and size: 284,198 bp), SHROOM4 (31/468, 6.6%; chrX:50,334,643-50,557,044; and 222,402 bp), and CDKL5 (20/468, 4.3%; chrX:18,443,725-18,671,749; and size: 228,025 bp) compared to ATRX in CMs and GMs, respectively; (D) Left: representative images of FISH performed with a PNA probe to detect telomeres. (Top) Example of an ALT-positive tumor with an ATRX mutation (HSS8T). Large, ultrabright telomere FISH signals (red) indicative of ALT are highlighted by the arrows. (Bottom) Example of an ALT-negative GM without an ATRX mutation (HSS2T; scale bars, 0.1 mm); right: representative images of immunohistochemistry performed to detect ATRX in the same tumors. (Top right) HSS8T harboring ATRX mutation, and in the (bottom right), HSS2T harboring wild-type ATRX (scale bars, 0.25 mm); (E) C-circle dot blot. Rows marked “Φ29” were treated with Φ29 polymerase to amplify C-circles. Prominent dots in these rows represent the presence of C-circles. Rows marked “without Φ29” as internal controls represent the group without amplification.
In addition, three of six ATRX-mutated GMs harbored TP53 mutations. We also detected an ATRX truncating mutation accompanied by TP53 mutation in a GM case without matched normal tissue (Supplementary Table S4).
To demonstrate the potential oncogenic function of the mutations in the telomere maintenance pathways in GMs, we performed FISH with a PNA probe to assess telomere status in 58 cases. Thirty-three of the 58 GMs (56.9%) were classified as ALT-positive, and the remaining 25 (43.1%) as ALT-negative (Figure 3D and Supplementary Table S5). In order to establish the accuracy of the FISH to detect ALT, we compared these results with the C-circle assay. Twenty samples were analyzed for the presence of ALT-specific C-circles. Based on the results of the dot blots (Figure 3E) and qPCR (Supplementary Table S7; the outcomes of the dot blots and qPCR showed no difference), the samples that were positive in the C-circle assay were also positive in FISH. For only one sample, HSS3T, there was a discrepancy between the two assays. HSS3T was positive for ALT based on FISH but negative in the C-circle assay. The proportion of ALT-positive tumor cells was lower in HSS3T, and hybridization signals were indeed not as strong relative to the other samples positive by FISH (Supplementary Figure S4). When DNA is extracted from tumor cells, as for the C-circle assay, positive signals will be weakened, resulting in the absence of hybridization on dot blots. However, FISH, which is the gold standard for the detection of ALT, detects changes in telomeres in single cells. Therefore, we considered HSS3T to be ALT-positive. Among the 23 ALT-positive cases with exome sequencing data in paired tumor/normal samples, ATRX mutations were found in six samples, and a SMARCAL1 mutation was identified in one case. H3F3A and DAXX mutations were not found in these samples.
We performed IHC to assess the relationship between ATRX protein levels and the mutation status of ATRX in the 47 GMs. All six samples with ATRX mutations showed loss of nuclear ATRX expression. Altogether, 23 of 28 (82.1%) ALT-positive samples showed loss of nuclear ATRX staining in tumor cells (Figure 3D). Immunostaining was positive for ATRX in 5 (17.9%) ALT-positive samples, but ATRX mutations were not present based on the exome sequencing data. One of these cases did harbor a SMARCAL1 mutation. All 19 ALT-negative samples showed positive nuclear staining for ATRX protein (Table 1 and Supplementary Table S5). In summary, these results demonstrated that the loss of ATRX expression was closely related to the ALT phenotype in GMs (P < 0.001, Fisher exact test).
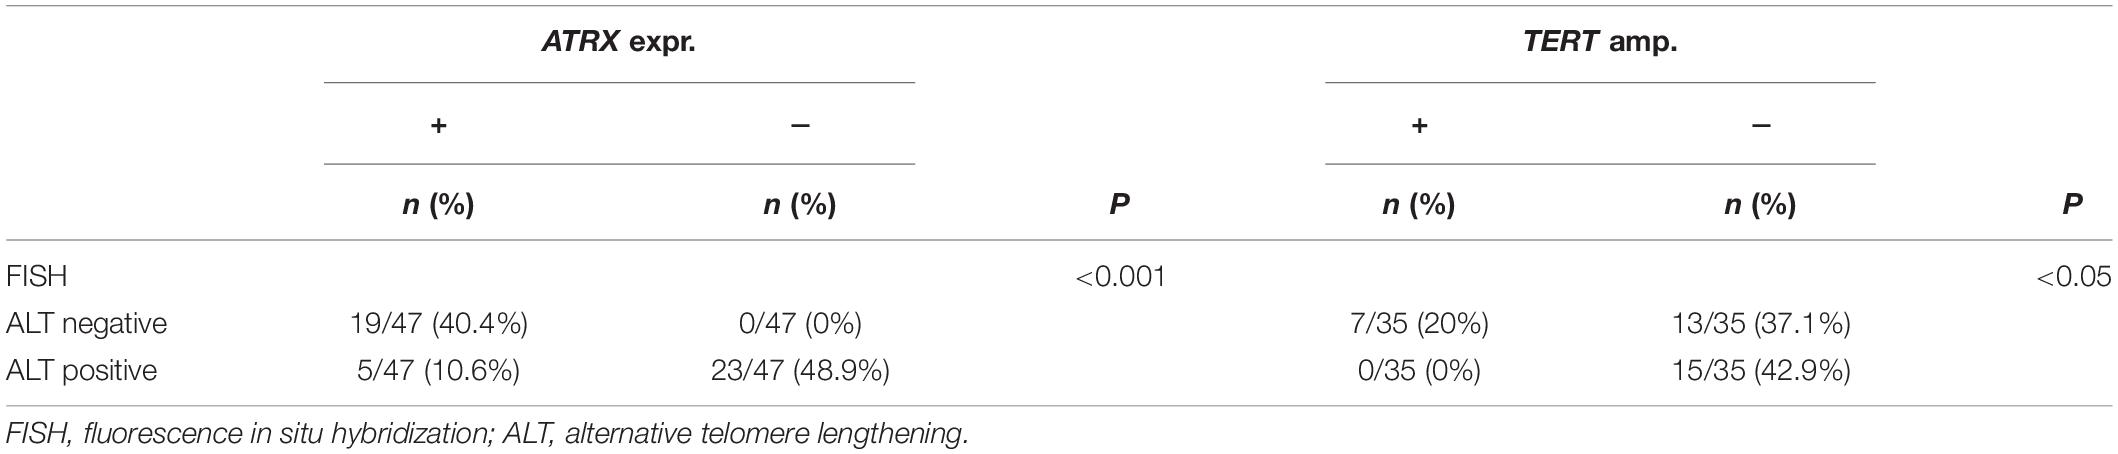
Table 1. Relationship of ALT pathway with ATRX expression and TERT amplification in GMs.
To determine the mechanisms underlying TERT activating in the tumorigenesis of GMs, we performed Sanger sequencing of the TERT promoter region on 40 samples. No mutations, including C228T and C250T, were identified in the TERT promoter region of these 40 samples (Figure 4A). This result for GMs was significantly different from CMs where TERT promoter mutations were found in greater than 50% of samples (13).
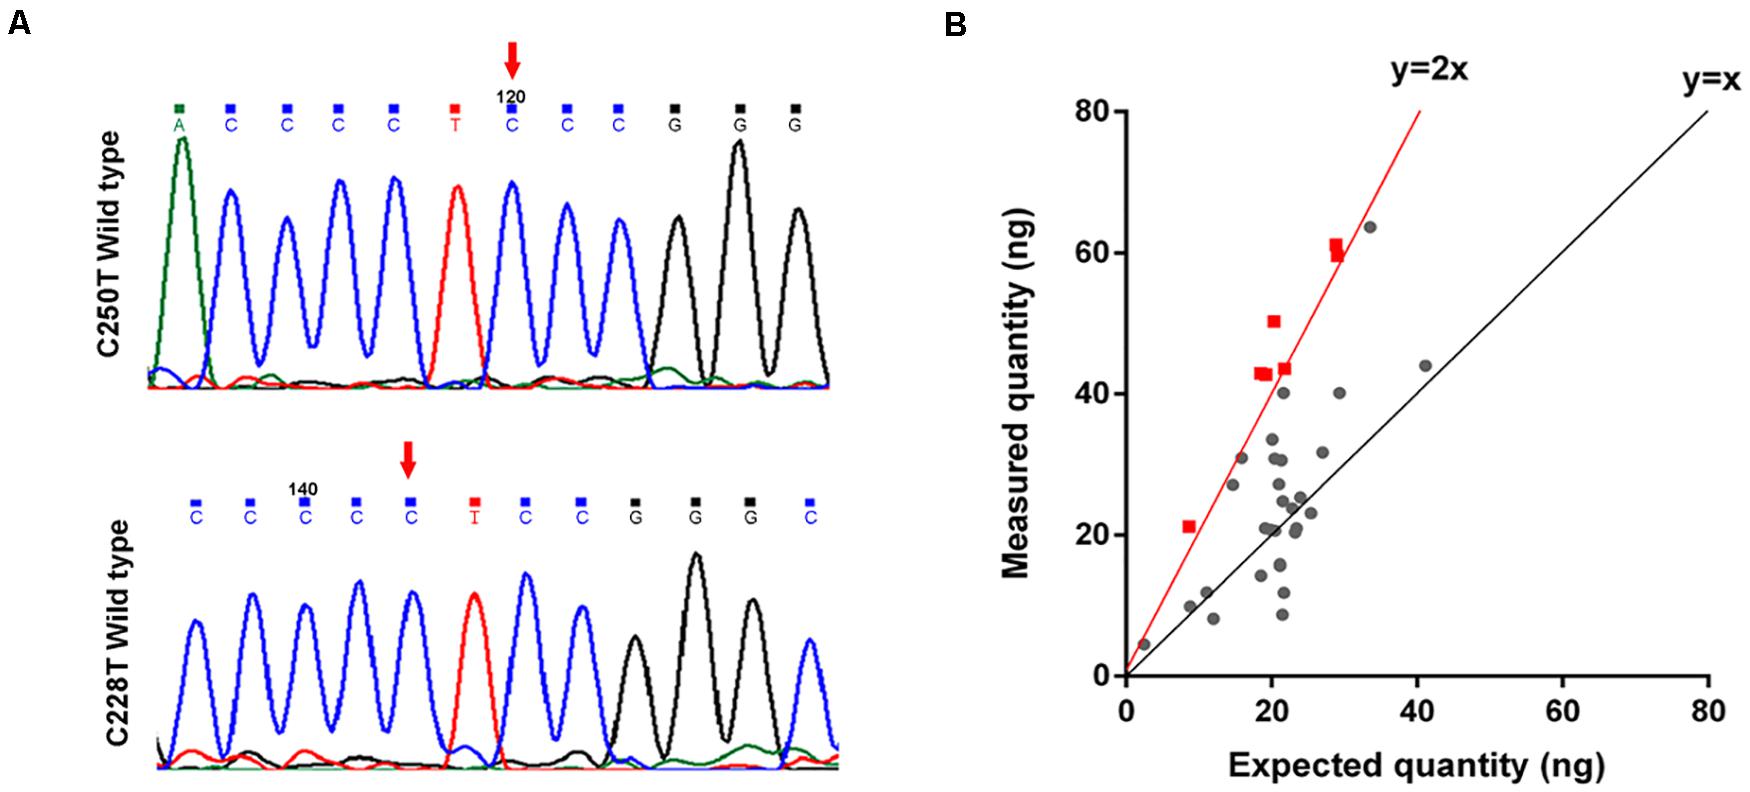
Figure 4. TERT is amplified in some GMs. (A) Chromatogram from Sanger targeted sequencing performed on the TERT promoter at the commonly mutated nucleotides C228T and C250T. No mutation was found in 40 tumors; (B) ddPCR to detect TERT copy number variations (n = 35). The measured quantity of DNA (ng) is plotted against the expected quantity of DNA (ng) where the control is normal DNA. Samples with at least 4 copies/cell (the red dot on the red line or on the left side) were considered to have TERT amplification (n = 7).
We next investigated whether other genetic alterations were present that could lead to the activation of telomerase. We examined TERT gene copy number variations in 35 GMs using ddPCR. Amplification of the TERT region was detected in 20% (7/35) of the samples (copy number > 4 copies/cell; Figure 4B and Supplementary Table S6), and all were ALT-negative cases (Table 1). In these cases, TERT amplifications, rather than TERT promoter mutations, might contribute to the tumorigenesis of GMs by maintaining telomeres. Alterations in the two telomere maintenance pathways were mutually exclusive (P < 0.05, Fisher exact test; Table 1).
To determine the clinical value of the two telomere maintenance pathways in GM patients, we performed Kaplan–Meier analysis on survival data of patients based on TERT status (ALT-positive, TERT amplification, or uncertain; Figure 5A). In early-stage GM (stages I and II, no metastasis), the OS of patients with ALT-positive tumors showed significantly longer OS than tumors in which TERT was amplified [P = 0.01; log-rank (Mantel–Cox) test; 95% confidence interval, Figure 5B]. However, in cases of metastasis, the OS of patients with ALT-mutated tumors was shorter than in patients with non-ALT tumors [P = 0.0223; log-rank (Mantel–Cox) test; 95% confidence interval, Figure 5C].
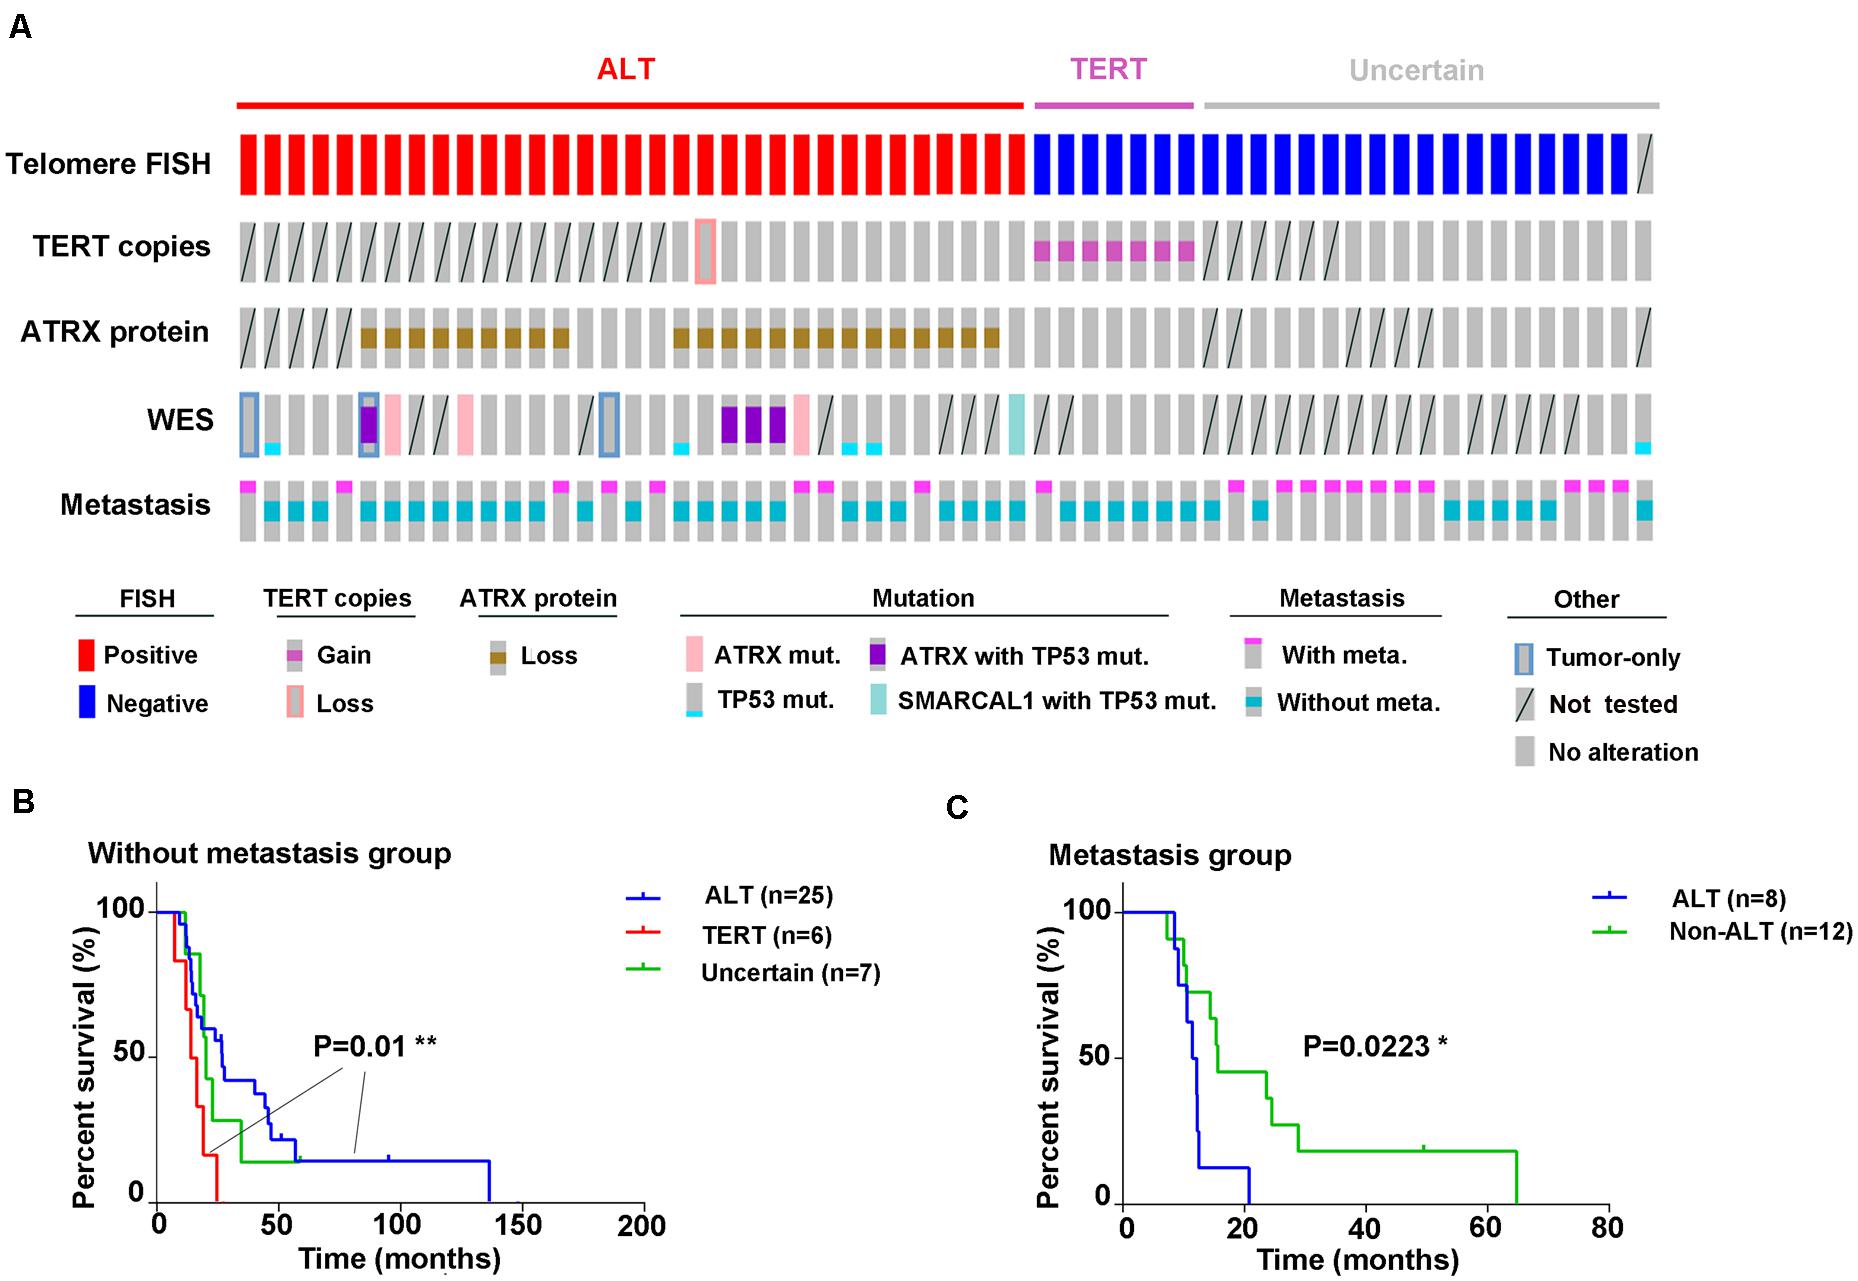
Figure 5. Graphical representation of all experiments performed. (A) Outcomes of different experiments and clinical information (disease progression) in all 59 samples are displayed graphically; (B) Kaplan–Meier analysis for overall survival based on ALT activity or TERT amplification in GM patients without metastasis [P = 0.01, log-rank (Mantel–Cox) test; 95% confidence interval] and in (C) with metastases [P = 0.0223, log-rank (Mantel–Cox) test; 95% confidence interval].
This study represents the largest genome-wide analysis of GMs to date and the first to explore TMMs in this subtype of melanoma. The genetic landscape of GMs is highly distinct compared with CMs and possibly other mucosal melanomas. First, while two mutational signatures in GMs correlated with signature 1 and signature 5 in the COSMIC database are also the most common in acral lentiginous (n = 32) and mucosal melanomas (n = 8) (6), they are distinct from signature 7, which predominates in CMs. Second, although SF3B1 has been reported as a frequently mutated gene in mucosal melanoma (30), only one (1/32, 3.12%) SF3B1 mutation with a recurrent somatic mutation at codon R625 was found in 32 samples in this cohort. As GMs with SF3B1 mutations previously reported were primarily located in vulvovaginal sites (6, 16), the absence of SF3B1 mutations may be due to the origin of tumors in our cohort from the cervix. Finally, TERT promoter mutations, which are frequent in CMs (13), were absent in GM samples. Instead, we found that telomere maintenance in GMs might be mediated through other types of genetic alterations: ATRX loss-of-function mutations and TERT amplifications.
Most ATRX changes in GMs (83.3%; 5/6) were truncating mutations as opposed to CMs, where most were missense and occurred at a lower frequency. All the GM samples harboring ATRX mutations showed loss of ATRX staining. However, in a significant number of samples with loss of ATRX staining, somatic ATRX mutations were not detected. Because of the limitations of WES, complicated mutations in ATRX, such as translocations and inversions (31), were potentially missed. Epigenetic changes in ATRX may also lead to the loss of ATRX expression, while it has not been verified in our research and previous studies. In GMs, all the samples with ATRX mutations or loss of ATRX staining were ALT positive. There were five ALT-positive samples where ATRX remained intact. In one of these samples, we identified a somatic mutation in SMARCAL1. In a recent study, SMARCAL1 mutations were shown to activate ALT in glioma cell lines (32). Taken together, ALT is the preferred mechanism of telomere maintenance in GMs relative to CMs, and therefore it can be considered as a potential therapeutic target specific for tumor cells. ATR kinase inhibitors promote cell death by preventing the ability of ALT-positive cells to extend telomeres through homologous recombination and promote the death of these cells (33). However, there are still no clinical trials on the therapeutic effect. Recently, Liang et al. found treatment with the AZD1775, a WEE1 inhibitor, robustly inhibited the growth of several ATRX-deficient cancer cell lines in vitro, as well as xenografts in vivo. AZD1775 also selectively inhibited the proliferation of patient-derived primary cell lines from gliomas with naturally occurring ATRX mutations (34). In our research, we found ATRX protein loss in 82.1% (23/28) of ALT-positive patients. As WEE1 inhibitors have been investigated in several phase II clinical trials, they could show efficacy in ATRX-deficient GMs.
In addition, we found a group of GMs without TMM activity (samples without ALT pathway and TERT amplification). Previous studies have identified a subset of CMs with no TMMs (35). An alternative to typical TMMs in these CMs was the presence of innate long telomeres, which might bypass the need to reactivate telomerase. However, we have not yet explored whether this phenomenon might be the basis for telomere maintenance in GMs, which needs to be further explored.
Finally, we examined whether ALT was associated with prognosis. The analysis revealed a complicated relationship possibly in all cancers. For example, ALT was associated with better prognosis in patients with advanced-stage pancreatic neuroendocrine tumors (PanNETs) (36). In contrast, in early-stage PanNETs, OS was shorter in patients with ALT-positive tumors (37). However, in GMs, ALT status was associated with better OS in patients without metastasis (P = 0.01). As the sample size was limited in this study, further analyses of more cases are needed to validate the prognostic value of ALT in GMs.
In this study, we profiled the genetic landscape of GMs. We found significant differences between GMs and CMs, the main one being activation of ALT in GMs as the TMM. The ATRX/ALT status could be used as a diagnostic marker and potentially a highly specific target for cancer therapy. Thus, our study provides a potential therapeutic choice for this rare type of melanoma.
The datasets presented in this study can be found in online repositories. The names of the repository/repositories and accession number(s) can be found below: Genome Sequence Archive (GSA; http://gsa.big.ac.cn/ID:CRA002180; CRA002926).
The studies involving human participants were reviewed and approved by Institutional Review Board of Cancer Hospital, Chinese Academy of Medical Sciences (Trial registration ID: 19/221-2005). The patients/participants provided their written informed consent to participate in this study.
LW and YJ were the overall principal investigators who conceived the study and obtained financial support. NL, QS, YL, and YD performed sample preparation and statistical analysis and validation. JS and GY performed experimental work. JS and XW edited tables and figures. GY and JS drafted the manuscript under the supervision of LW and YJ. All authors critically reviewed the manuscript and approved the final version.
This work was supported by the National Natural Science Foundation Fund (81472559 and 81772490), the National Key R&D Program of China (2020YFC2002705 and 2018YFC0115204), and the Chinese Academy of Medical Sciences (CAMS) Innovation Fund for Medical Sciences (CIFMS; Grants 2016-I2M-1-001, 2017-I2M-3-004, and 2019-I2M-1-003).
The authors declare that the research was conducted in the absence of any commercial or financial relationships that could be construed as a potential conflict of interest.
The Supplementary Material for this article can be found online at: https://www.frontiersin.org/articles/10.3389/fonc.2020.01707/full#supplementary-material
1. Siegel RL, Miller KD, Jemal A. Cancer statistics, 2016. CA Cancer J Clin. (2016) 66:7–30. doi: 10.3322/caac.21332
2. Chen W, Zheng R, Baade PD, Zhang S, Zeng H, Bray F, et al. Cancer statistics in China, 2015. CA Cancer J Clin. (2016) 66:115–32. doi: 10.3322/caac.21338
3. Chi Z, Li S, Sheng X, Si L, Cui C, Han M, et al. Clinical presentation, histology, and prognoses of malignant melanoma in ethnic Chinese: a study of 522 consecutive cases. BMC Cancer. (2011) 11:85. doi: 10.1186/1471-2407-11-85
4. McLaughlin CC, Wu XC, Jemal A, Martin HJ, Roche LM, Chen VW. Incidence of noncutaneous melanomas in the U.S. Cancer. (2005) 103:1000–7. doi: 10.1002/cncr.20866
5. Menzies AM, Haydu LE, Visintin L, Carlino MS, Howle JR, Thompson JF, et al. Distinguishing clinicopathologic features of patients with V600E and V600K BRAF-mutant metastatic melanoma. Clin Cancer Res. (2012) 18:3242–9. doi: 10.1158/1078-0432.CCR-12-0052
6. Hayward NK, Wilmott JS, Waddell N, Johansson PA, Field MA, Nones K, et al. Whole-genome landscapes of major melanoma subtypes. Nature. (2017) 545:175–80. doi: 10.1038/nature22071
7. Si L, Kong Y, Xu X, Flaherty KT, Sheng X, Cui C, et al. Prevalence of BRAF V600E mutation in Chinese melanoma patients: large scale analysis of BRAF and NRAS mutations in a 432-case cohort. Eur J Cancer. (2012) 48:94–100. doi: 10.1016/j.ejca.2011.06.056
8. Bryan TM, Englezou A, Dalla-Pozza L, Dunham MA, Reddel RR. Evidence for an alternative mechanism for maintaining telomere length in human tumors and tumor-derived cell lines. Nat Med. (1997) 3:1271–4. doi: 10.1038/nm1197-1271
9. De Vitis M, Berardinelli F, Sgura A. Telomere length maintenance in cancer: at the crossroad between telomerase and alternative lengthening of telomeres (ALT). Int J Mol Sci. (2018) 19:606. doi: 10.3390/ijms19020606
10. Lovejoy CA, Li W, Reisenweber S, Thongthip S, Bruno J, de Lange T, et al. Loss of ATRX, genome instability, and an altered DNA damage response are hallmarks of the alternative lengthening of telomeres pathway. PLoS Genet. (2012) 8:e1002772. doi: 10.1371/journal.pgen.1002772
11. Low KC, Tergaonkar V. Telomerase: central regulator of all of the hallmarks of cancer. Trends Biochem Sci. (2013) 38:426–34. doi: 10.1016/j.tibs.2013.07.001
12. Heidenreich B, Kumar R. TERT promoter mutations in telomere biology. Mutat Res. (2017) 771:15–31. doi: 10.1016/j.mrrev.2016.11.002
13. Heidenreich B, Nagore E, Rachakonda PS, Garcia-Casado Z, Requena C, Traves V, et al. Telomerase reverse transcriptase promoter mutations in primary cutaneous melanoma. Nat Commun. (2014) 5:3401. doi: 10.1038/ncomms4401
14. Lewis PW, Elsaesser SJ, Noh KM, Stadler SC, Allis CD. Daxx is an H3.3-specific histone chaperone and cooperates with ATRX in replication-independent chromatin assembly at telomeres. Proc Natl Acad Sci USA. (2010) 107:14075–80. doi: 10.1073/pnas.1008850107
15. Diplas BH, He X, Brosnan-Cashman JA, Liu H, Chen LH, Wang Z, et al. The genomic landscape of TERT promoter wildtype-IDH wildtype glioblastoma. Nat Commun. (2018) 9:2087. doi: 10.1038/s41467-018-04448-6
16. Furney SJ, Turajlic S, Stamp G, Nohadani M, Carlisle A, Thomas JM, et al. Genome sequencing of mucosal melanomas reveals that they are driven by distinct mechanisms from cutaneous melanoma. J Pathol. (2013) 230:261–9. doi: 10.1002/path.4204
17. Liang WS, Hendricks W, Kiefer J, Schmidt J, Sekar S, Carpten J, et al. Integrated genomic analyses reveal frequent TERT aberrations in acral melanoma. Genome Res. (2017) 27:524–32. doi: 10.1101/gr.213348.116
18. Johansson P, Aoude LG, Wadt K, Glasson WJ, Warrier SK, Hewitt AW, et al. Deep sequencing of uveal melanoma identifies a recurrent mutation in PLCB4. Oncotarget. (2016) 7:4624–31. doi: 10.18632/oncotarget.6614
19. Johnson CP, Kim IK, Esmaeli B, Amin-Mansour A, Treacy DJ, Carter SL, et al. Systematic genomic and translational efficiency studies of uveal melanoma. PLoS One. (2017) 12:e0178189. doi: 10.1371/journal.pone.0178189
20. Bolger AM, Lohse M, Usadel B. Trimmomatic: a flexible trimmer for Illumina sequence data. Bioinformatics. (2014) 30:2114–20. doi: 10.1093/bioinformatics/btu170
21. Li H. Aligning sequence reads, clone sequences and assembly contigs with BWA-MEM. arXiv [Preprint]. (2013). arXiv:1303.3997,
22. DePristo MA, Banks E, Poplin R, Garimella KV, Maguire JR, Hartl C, et al. A framework for variation discovery and genotyping using next-generation DNA sequencing data. Nat Genet. (2011) 43:491–8. doi: 10.1038/ng.806
23. Cibulskis K, Lawrence MS, Carter SL, Sivachenko A, Jaffe D, Sougnez C, et al. Sensitive detection of somatic point mutations in impure and heterogeneous cancer samples. Nat Biotechnol. (2013) 31:213–9. doi: 10.1038/nbt.2514
24. Saunders CT, Wong WS, Swamy S, Becq J, Murray LJ, Cheetham RK. Strelka: accurate somatic small-variant calling from sequenced tumor-normal sample pairs. Bioinformatics. (2012) 28:1811–7. doi: 10.1093/bioinformatics/bts271
25. McLaren W, Gil L, Hunt SE, Riat HS, Ritchie GR, Thormann A, et al. The ensembl variant effect predictor. Genome Biol. (2016) 17:122. doi: 10.1186/s13059-016-0974-4
26. Alexandrov LB, Nik-Zainal S, Wedge DC, Campbell PJ, Stratton MR. Deciphering signatures of mutational processes operative in human cancer. Cell Rep. (2013) 3:246–59. doi: 10.1016/j.celrep.2012.12.008
27. Meeker AK, Gage WR, Hicks JL, Simon I, Coffman JR, Platz EA, et al. Telomere length assessment in human archival tissues: combined telomere fluorescence in situ hybridization and immunostaining. Am J Pathol. (2002) 160:1259–68.
28. Henson JD, Cao Y, Huschtscha LI, Chang AC, Au AY, Pickett HA, et al. DNA C-circles are specific and quantifiable markers of alternative-lengthening-of-telomeres activity. Nat Biotechnol. (2009) 27:1181–5. doi: 10.1038/nbt.1587
29. Alexandrov LB, Nik-Zainal S, Wedge DC, Aparicio SA, Behjati S, Biankin AV, et al. Signatures of mutational processes in human cancer. Nature. (2013) 500:415–21. doi: 10.1038/nature12477
30. Hintzsche JD, Gorden NT, Amato CM, Kim J, Wuensch KE, Robinson SE, et al. Whole-exome sequencing identifies recurrent SF3B1 R625 mutation and comutation of NF1 and KIT in mucosal melanoma. Melanoma Res. (2017) 27:189–99. doi: 10.1097/CMR.0000000000000345
31. Haffner MC, Mosbruger T, Esopi DM, Fedor H, Heaphy CM, Walker DA, et al. Tracking the clonal origin of lethal prostate cancer. J Clin Invest. (2013) 123:4918–22. doi: 10.1172/JCI70354
32. Killela PJ, Reitman ZJ, Jiao Y, Bettegowda C, Agrawal N, Diaz LA, et al. TERT promoter mutations occur frequently in gliomas and a subset of tumors derived from cells with low rates of self-renewal. Proc Natl Acad Sci USA. (2013) 110:6021. doi: 10.1073/pnas.1303607110
33. Flynn RL, Cox KE, Jeitany M, Wakimoto H, Bryll AR, Ganem NJ, et al. Alternative lengthening of telomeres renders cancer cells hypersensitive to ATR inhibitors. Science. (2015) 347:273–7. doi: 10.1126/science.1257216
34. Liang J, Zhao H, Diplas BH, Liu S, Liu J, Wang D, et al. Genome-wide CRISPR-Cas9 screen reveals selective vulnerability of ATRX-mutant cancers to WEE1 inhibition. Cancer Res. (2019) 80:510–23. doi: 10.1158/0008-5472.CAN-18-3374
35. Viceconte N, Dheur MS, Majerova E, Pierreux CE, Baurain JF, van Baren N, et al. Highly aggressive metastatic melanoma cells unable to maintain telomere length. Cell Rep. (2017) 19:2529–43. doi: 10.1016/j.celrep.2017.05.046
36. Heaphy CM, de Wilde RF, Jiao Y, Klein AP, Edil BH, Shi C, et al. Altered telomeres in tumors with ATRX and DAXX mutations. Science. (2011) 333:425. doi: 10.1126/science.1207313
Keywords: ATRX, alternative lengthening of telomeres, gynecological melanoma, TERT, telomere maintenance mechanisms
Citation: Yuan G, Song J, Li N, Song Q, Li Y, Du Y, Wang X, Jiao Y and Wu L (2020) Telomere Maintenance Associated Mutations in the Genetic Landscape of Gynecological Mucosal Melanoma. Front. Oncol. 10:1707. doi: 10.3389/fonc.2020.01707
Received: 28 May 2020; Accepted: 30 July 2020;
Published: 02 September 2020.
Edited by:
Rengyun Liu, The First Affiliated Hospital of Sun Yat-sen University, ChinaReviewed by:
Fengbiao Mao, University of Michigan, United StatesCopyright © 2020 Yuan, Song, Li, Song, Li, Du, Wang, Jiao and Wu. This is an open-access article distributed under the terms of the Creative Commons Attribution License (CC BY). The use, distribution or reproduction in other forums is permitted, provided the original author(s) and the copyright owner(s) are credited and that the original publication in this journal is cited, in accordance with accepted academic practice. No use, distribution or reproduction is permitted which does not comply with these terms.
*Correspondence: Xiaobing Wang, d2FuZ3hiQGNpY2Ftcy5hYy5jbg==; Yuchen Jiao, amlhb3l1Y2hlbkBjaWNhbXMuYWMuY24=; Lingying Wu, d3VsaW5neWluZ0Bjc2NvLm9yZy5jbg==
†These authors have contributed equally to this work
Disclaimer: All claims expressed in this article are solely those of the authors and do not necessarily represent those of their affiliated organizations, or those of the publisher, the editors and the reviewers. Any product that may be evaluated in this article or claim that may be made by its manufacturer is not guaranteed or endorsed by the publisher.
Research integrity at Frontiers
Learn more about the work of our research integrity team to safeguard the quality of each article we publish.