 Zheng He
 Chengcheng Wang4†
94% of researchers rate our articles as excellent or good
Learn more about the work of our research integrity team to safeguard the quality of each article we publish.
Find out more
ORIGINAL RESEARCH article
Front. Oncol., 03 September 2020
Sec. Cancer Metabolism
Volume 10 - 2020 | https://doi.org/10.3389/fonc.2020.01631
Altered metabolism of glucose, lipid and glutamine is a prominent hallmark of cancer cells. Currently, cell heterogeneity is believed to be the main cause of poor prognosis of glioblastoma (GBM) and is closely related to relapse caused by therapy resistance. However, the comprehensive model of genes related to glucose-, lipid- and glutamine-metabolism associated with the prognosis of GBM remains unclear, and the metabolic heterogeneity of GBM still needs to be further explored. Based on the expression profiles of 1,395 metabolism-related genes in three datasets of TCGA/CGGA/GSE, consistent cluster analysis revealed that GBM had three different metabolic status and prognostic clusters. Combining univariate Cox regression analysis and LASSO-penalized Cox regression machine learning methods, we identified a 17-metabolism-related genes risk signature associated with GBM prognosis. Kaplan-Meier analysis found that obtained signature could differentiate the prognosis of high- and low-risk patients in three datasets. Moreover, the multivariate Cox regression analysis and receiver operating characteristic curves indicated that the signature was an independent prognostic factor for GBM and had a strong predictive power. The above results were further validated in the CGGA and GSE13041 datasets, and consistent results were obtained. Gene set enrichment analysis (GSEA) suggested glycolysis gluconeogenesis and oxidative phosphorylation were significantly enriched in high- and low-risk GBM. Lastly Connectivity Map screened 54 potential compounds specific to different subgroups of GBM patients. Our study identified a novel metabolism-related gene signature, in addition the existence of three different metabolic status and two opposite biological processes in GBM were recognized, which revealed the metabolic heterogeneity of GBM. Robust metabolic subtypes and powerful risk prognostic models contributed a new perspective to the metabolic exploration of GBM.
Glioblastoma (GBM) is the most common, most aggressive and worst prognosis glioma in adults (1), accounting for about 55% of gliomas, with median survival of only 14–16 months (1, 2). The diffusivity and invasiveness of GBM itself and the inter-/intra-tumor heterogeneity lead to GBM therapy resistance and high recurrence (3–6). Therefore, despite the standard treatment protocol for GBM such as surgical resection, radiotherapy and chemotherapy, the prognosis of GBM still remains dismal, and the 5-year survival rate is only about 5% (2, 7, 8). Novel molecular markers or therapeutic targets are urgently needed to improve the prognosis of GBM.
Metabolic reprogramming is one of the hallmarks of cancer cells, and there is growing evidence that metabolic dysregulation plays an important role in the growth, proliferation, angiogenesis, and invasion of cancer cells (9–11). Civita et al. (12) revealed the landscape of GBM heterogeneity using laser capture microdissection and RNA-seq analysis, which showed dysregulation of metabolic pathways, providing direct evidence for metabolic alterations in GBM. The metabolism of glucose, lipid, and glutamine in cancer cells is altered (13). According to Warburg's basic research, cancer cells obtain energy mainly through the glycolytic pathway rather than the oxidative phosphorylation (OxPhos) pathway, so abnormal glycolytic metabolism is one of the basic characteristics of malignant cells (14). Recent studies have found that lipid metabolism reprogramming plays a crucial role in membrane synthesis, energetic production and signal transduction in the progression of cancer cells (15). Nuclear magnetic resonance (NMR) spectroscopy revealed that unsaturated fatty acids, cholesterol esters and phosphatidylcholine are only present in the GBM (16, 17). At present, the biological phenotype and molecular mechanism of lipid composition change leading to glioma need further study. In addition, studies on cancer cell metabolism have provided evidence that tumor-specific activation of signaling pathways, such as the upregulation of the oncogene Myc, can regulate glutamine uptake and its metabolism through glutaminolysis to provide the cancer cell with a replacement of energy source (18). Therefore, the in-depth exploration of three major metabolites of GBM may provide an important theoretical basis for the development of new treatment (10, 19). However, there has been no comprehensive analysis of the three-major metabolism-related genes and their prognostic value in GBM.
In the present study, we comprehensively analyzed GBM mRNA sequencing data from three public datasets, the Cancer Genome Atlas (TCGA), The Chinese Glioma Genome Atlas (CGGA), and GSE13041, to explore the metabolic status of GBM patients. Through cluster analysis, the patients can be divided into 3 stable clusters according to the gene expression profile, and the prognosis and molecular characteristics of the 3 clusters are significantly different. In addition, we further screened potential specific therapeutic compounds for each cluster. More importantly, we identified a metabolism-related risk signature to assess the prognosis of patients with GBM in the TCGA datasets which can be served as an independent predictor closely related to the prognosis of GBM patients. And the high- and low-risk groups had distinctly different biological processes. The above results were further validated in CGGA and GSE13041 datasets. In summary, robust prognostic risk models and subtypes contribute to a better understanding of the molecular pathogenesis of GBM.
Whole genome mRNA expression sequencing data and corresponding clinical information [histology, subtype, gender, age, isocitrate dehydrogenase1 (IDH1) mutational status, methylguanine methyltransferase (MGMT) promoter status, glioma cytosine-phosphate-guanine island methylator phenotype (G-CIMP) status and survival information] of 165 GBM patients were downloaded from TCGA (PanCancer Atlas) (20) datasets as training set. Similarly, GSE13041 (21) and CGGA RNA expression data and clinical information were obtained as validation sets. Of which, mRNA sequencing data from CGGA contains two datasets, mRNAseq_693 and mRNAseq_325, whose platforms are Illumina HiSeq and Illumina HiSeq 2000 or 2500, respectively. Therefore, we removed the batch effect from these two datasets and normalized them to obtain an integrated data of 216 GBM patients. The characteristics of GBM patients from these three datasets were summarized in Supplementary Table 1. Five hundred and thirty two Glucose-, 1034 lipid-, and 13 glutamine-metabolism related genes were downloaded from Molecular Signature Database v7.0 (MSigDB) (http://www.broad.mit.edu/gsea/msigdb/) (22). The detailed metabolism-related genes were listed in the Supplementary Table 2.
We took the expression profile of metabolism-related genes for consistent clustering by using “Cancersubtype” R package (http://cran.r-project.org). The euclidean distance was applied to calculate the similarity distance between samples, and K-means methods was utilized for clustering. By performing resampling analysis, 80% of the samples were sampled for 100 times. The optimal number of clusters was determined by the cumulative distribution function (CDF) and was validated in the CGGA and GSE13041 datasets. And principal component analysis (PCA) was carried out using the R package “princomp” to validate the molecular subtype.
Univariate Cox regression were performed on the 169 GBM patients in TCGA datasets to select the optimal prognostic gene set with R package “glmnet.” After getting the corresponding hazard ratio (HR) and p-value of each gene, the genes with p < 0.05 were selected as seed genes for Cox LASSO regression with 10-fold cross-validation (CV). Risk score for each patient of the TCGA training set was calculated with the linear combinational of the signature gene expression (expr) weighted by their regression coefficients (23).
In the above equation, “N” was the total number of key genes, “expr” represented the expression value of geneN, and β represented the selected gene coefficient from LASSO analysis. Patients in the training datasets was then categorized into high and low risk score groups according to the median risk score. The risk score for each patient in the validation datasets were also calculated based on the same risk formula. The multivariate Cox regression analysis was conducted to determine whether the risk score was an independent predictor for GMB patients with R package “survival.” The differences in overall survival (OS) between high-risk and low-risk score in the training and validation datasets were estimated using the Kaplan-Meier (KM) method. Receiver operating characteristic (ROC) analysis was performed to evaluate the accuracy of the risk model with R package “pROC.”
GSEA was performed using Gene Set Enrichment Analysis v3 software downloaded from the Broad Institute (http://www.broadinstitute.org/gsea/index.jsp) (24). The mRNA expression profile of GBM samples from the TCGA/CGGA/GSE13041 datasets were analyzed by GSEA. For GSEA, risk score was selected as a binary variable divided into high- and low-risk by a criterion of whether the score was greater than the median value. The collection of annotated gene sets of c2.cp.kegg.v7.0.symbols.gmt in MSigDB was chosen as the reference gene sets in GSEA software, the NOM p < 0.05 and false discovery rate (FDR) <0.25 was set as the cutoff.
CMap is a systematic, data-driven program for detecting correlations among genes, compounds, and biological conditions. We queried the recently updated CMap to screen potential compounds that might target metabolism-related pathways. A list of differential expression genes (DEGs) among the 3 clusters in TCGA was obtained using the “lmFit” function of the R package “limma” with default parameters (25), and the top 373 genes (148 upregulated and 225 downregulated) were selected to uploaded into the CMap database. Compounds with an absolute value of enrichment ≥ 0.7 and p < 0.05 were selected as potential therapeutic drugs for GBM.
One-way ANOVA was performed to compare the differences of risk score between/among subtypes/clusters. The one-way ANOVA method and Tukey's test was applied to identify the DEGs between the high- and low-risk groups (q < 0.05, |log2FC| > 2). KM curve with log-rank test was used to assess the OS differences among/between different groups. Univariate and multivariate Cox regression analyses were conducted to assess the independent prognostic factors. The statistical analyses were conducted using R software version 3.5.1 (R Core Team, R Foundation for Statistical Computing, Vienna, Austria), p < 0.05 was regarded as statistically significant.
The intersection of the three datasets and metabolism genes was extracted, and the overlapping genes were removed. The gene expression profiles of 1,395 metabolism-related genes (Supplementary Table 2) were exploited to identify the GBM clusters in TCGA cohort. All GBM samples were grouped into k (k = 2, 3, 4, 5, 6, 7, 8, 9) different subtypes using “Cancersubtype” R package. According to the CDF curves of the consensus score, we selected the k = 3 as the optimal division (Figures 1A–C and Supplementary Figure 1). KM analysis showed that the OS of the 3 clusters were significantly different (Figure 1D, p < 0.05), and PCA revealed that the 3 clusters could be separated from each other (Figure 1E). Figure 1F showed the heatmap of these 3 clusters defined by the top 100 variable expression genes. The above results indicated that there were significant metabolic phenotypes among the 3 clusters. In order to validate the stability of molecular subtypes, we further selected CGGA and GSE13041 datasets for clustering. The clustering results of molecular subtypes in CGGA and GSE13041 datasets were consistent with those in TCGA, and the relevant results were shown in Supplementary Figures 2–5, respectively. Therefore, we identified three stable clusters of GBM based on the expression of metabolism-related genes.
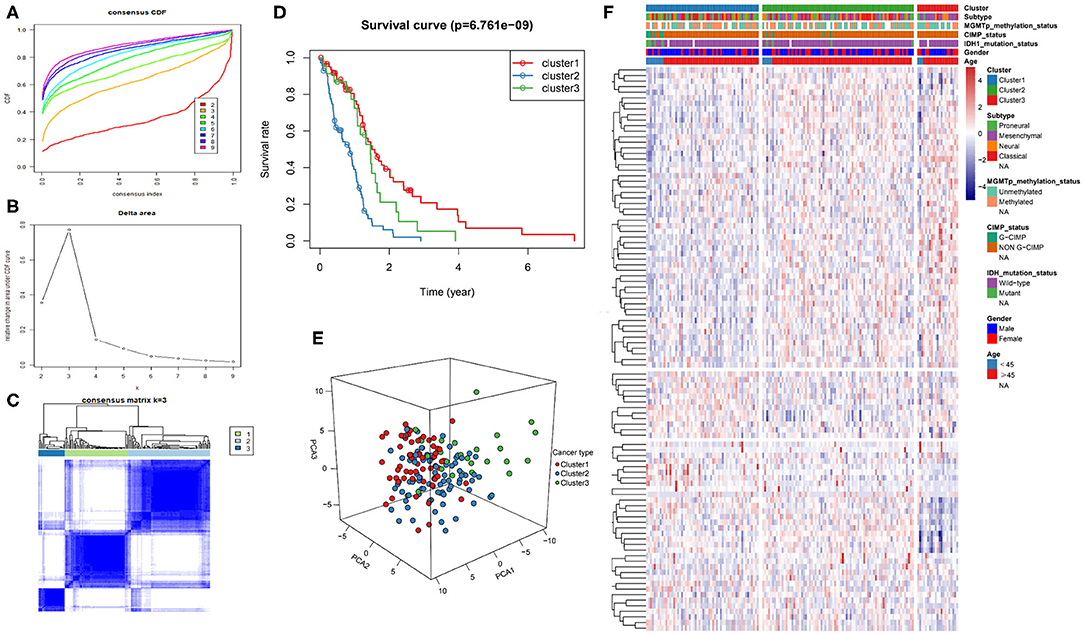
Figure 1. Metabolism-related genes could distinguish GBM patients in TCGA with different clinical and molecular features. (A) Consensus clustering CDF for k = 2 to k = 9. (B) Relative change in area under CDF curve for k = 2 to k = 9. (C) Consensus clustering matrix heatmap plots of 165 samples from TCGA datasets for k = 3. (D) Kaplan-Meier analysis of patients among 3 clusters. (E) PCA analysis of the metabolism-related genes expression when k = 3. (F) Heatmap of three clusters defined by the top 100 variable expression genes. CDF, cumulative distribution function; PCA, principal components analysis.
The 1,395 putative metabolism-related genes were exploited to conducting univariate cox regression analysis. Firstly, we identified 29 significantly metabolism-related genes associated with the survival of GBM with p < 0.05 (Supplementary Table 2). We further performed LASSO Cox regression algorithm with cross-validation (Figures 2A,B), after 1,000-time iterations, a 17-gene risk signature was constructed (Table 1) and the risk score for each patient was calculated with their expression level and regression coefficient. To comprehensively investigate the relationship between risk score and patients' survival, we further stratified patients into high- and low-risk groups based on the median risk score (Figure 2C). And as shown in Figure 2C, patients of GBM in TCGA cohort with high risk score have more death cases when compare to low risk score. KM curves analysis result revealed that patients in high risk group had a shorter survival time than in the low risk group (Figure 2D). To validate this gene set, we also calculated patients' risk scores of CGGA and GSE13041 cohorts with same regression coefficient. And as expected, consensus result was also obtained in the validation datasets (Supplementary Figure 6).
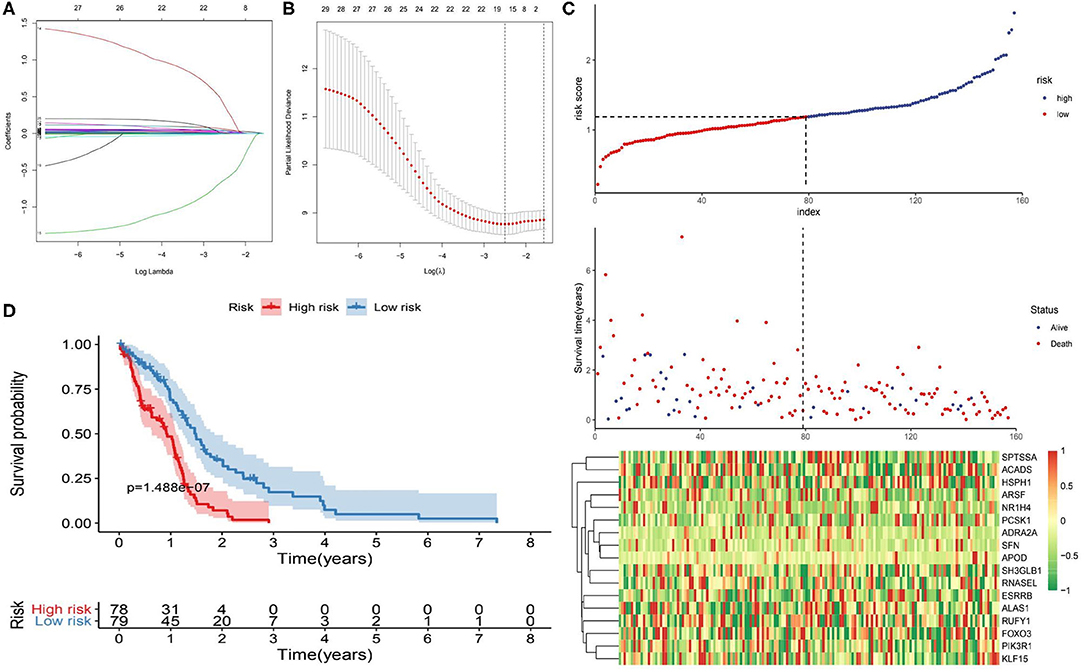
Figure 2. Identification of metabolism-related signature by Cox proportional hazards model in TCGA cohort. (A) LASSO coefficient profiles of the 29 survival-associated metabolism-related genes. (B) Cross-validation for tuning parameter selection in the proportional hazards model. (C) Risk plot for the GBM patients in TCGA datasets. Each panel consists of three rows: top row showed the risk score distribution for the high- and low-risk score group; middle row represents the GBM patients' distribution and survival status; the bottom row shows that the heatmap of 17 prognostic metabolism-related genes expression. (D) Kaplan-Meier curves analysis for the risk model in the TCGA datasets.
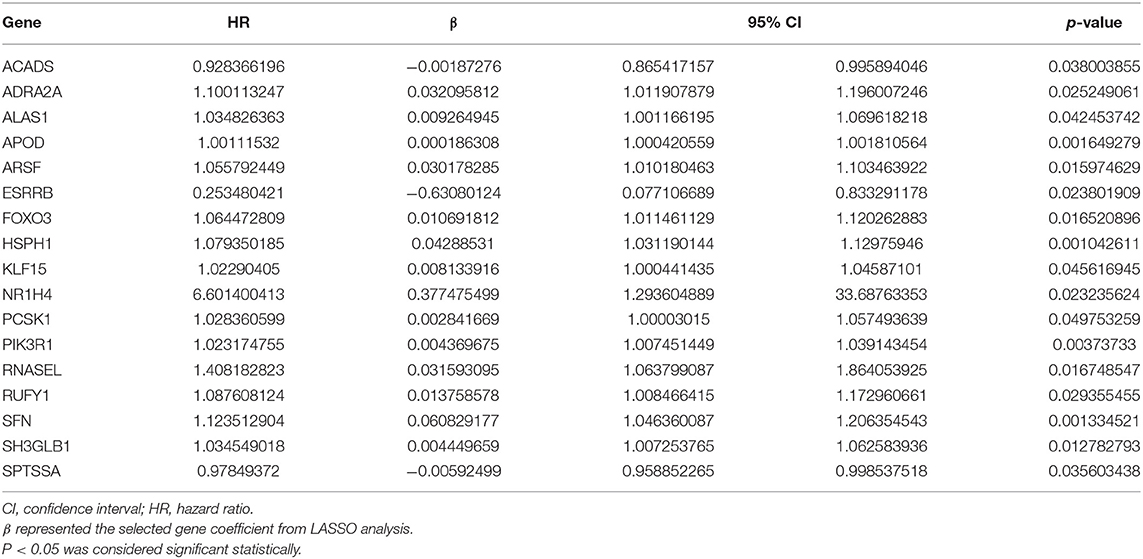
Table 1. The 17 metabolism-related genes associated significantly with overall survival.
Univariate and multivariate Cox regression analyses were performed to determine prognostic factors for survival in TCGA/CGGA/GSE13041 patients with GBM. As shown in Table 2, the 17-gene risk signature was independently correlated with OS (p < 0.05), and the genes signature could also be served as an independent prognostic factor in the CGGA and GSE13041 cohorts (p < 0.05).
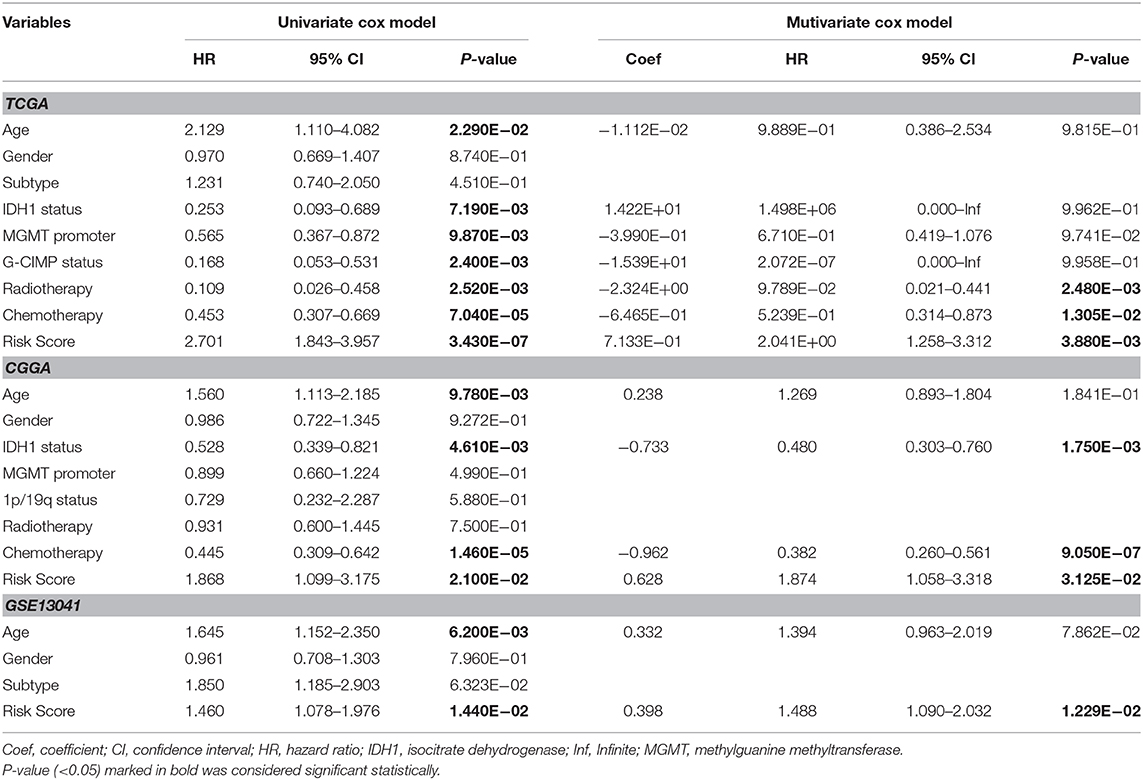
Table 2. Univariate and multivariate Cox regression analysis of clinical pathologic features for survival of GBM in three datasets (TCGA/CGGA/GEO).
In order to further clarify the significance of risk signature in GBM, we detected the correlation between risk score and major clinical features. The risk score distribution of patients with different IDH1 status, MGMT promotor methylation status and G-CIMP status was significantly different in TCGA cohort. The risk scores were lower in GBM patients with IDH1-mutant type, MGMT promoter methylated and G-CIMP subgroups than the IDH1-wild type (wt), MGMT promoter unmethylated and non G-CIMP ones of TCGA cohort, respectively (Figures 3A–C). Consistent results could also be observed in the CGGA cohort, the risk scores of IDH1-mutant type and MGMT promoter methylated subgroups were lower than the IDH1-wt and MGMT promoter unmethylated ones, respectively (Figures 3D,E). However, there was no significant difference in risk score between the 1p/19q codel and the non-codel groups, which may be due to the small sample size of the 1p/19q codel group (Figure 3F). In addition, no statistically significant differences were observed between risk scores for different age stratifications and for different molecular subtypes (Supplementary Figure 7). We further compared the differences in risk scores among three different clusters we identified above in TCGA/CGGA/GSE13041. Interestingly, as shown in the Figures 3G–I, the cluster with the worst prognosis had the highest risk score (cluster2 in TCGA and GSE13041, and cluster1 in CGGA), while the cluster with the best prognosis had the lowest risk score (cluster1 in TCGA and GSE13041, cluster3 in CGGA).
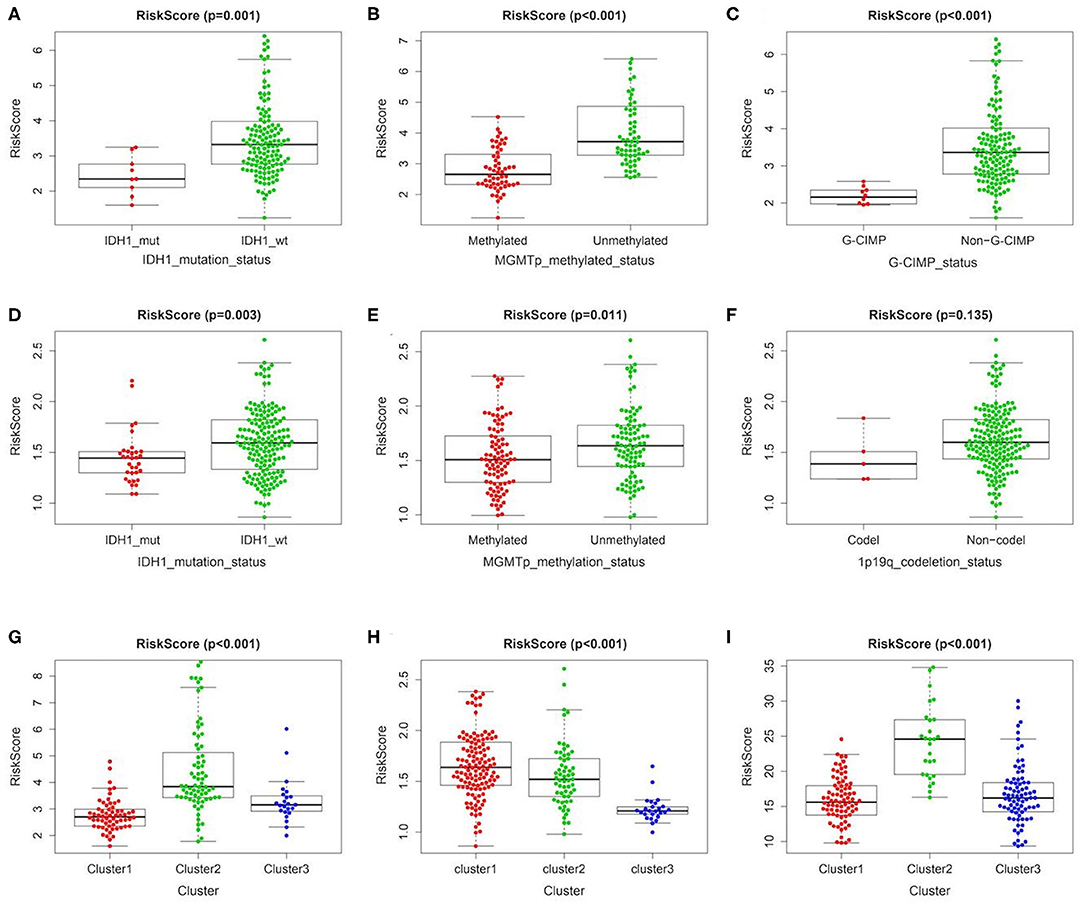
Figure 3. Association between the metabolism-related gene panel and pathologic features. (A–C) Distribution of the risk score in stratified patients by IDH1_status, MGMT promoter methylated status and G-CIMP status in TCGA cohort. (D–F) Distribution of the risk score in stratified patients by IDH1_status, MGMT promoter methylated status and 1p/19q codeletion status in CGGA cohort. (G–I), Distribution of the risk score among 3 clusters identified of the present study in TCGA, CGGA and GSE13041 cohort, respectively. IDH1, isocitrate dehydrogenase1; MGMT, methylguanine methyltransferase; G-CIMP, glioma cytosine-phosphate-guanine island methylator phenotype.
We further validated the prognostic predictive power of the risk signature we identified in different clinical feature stratified groups, such as IDH1-wt/-mutant, MGMT promoter methylated/unmethylated, G-CIMP/non G-CIMP, and 1p/19q codel/non-codel cohorts. In the TCGA and CGGA cohorts, KM analysis showed that cases with high-risk score had shorter OS than the low-risk ones in most stratified patients (Figure 4). However, this result was not observed in the TCGA_IDH1-mutant group, TCGA_G-CIMP group and CGGA_ 1p/19q-codel group due to the small sample size of cases.
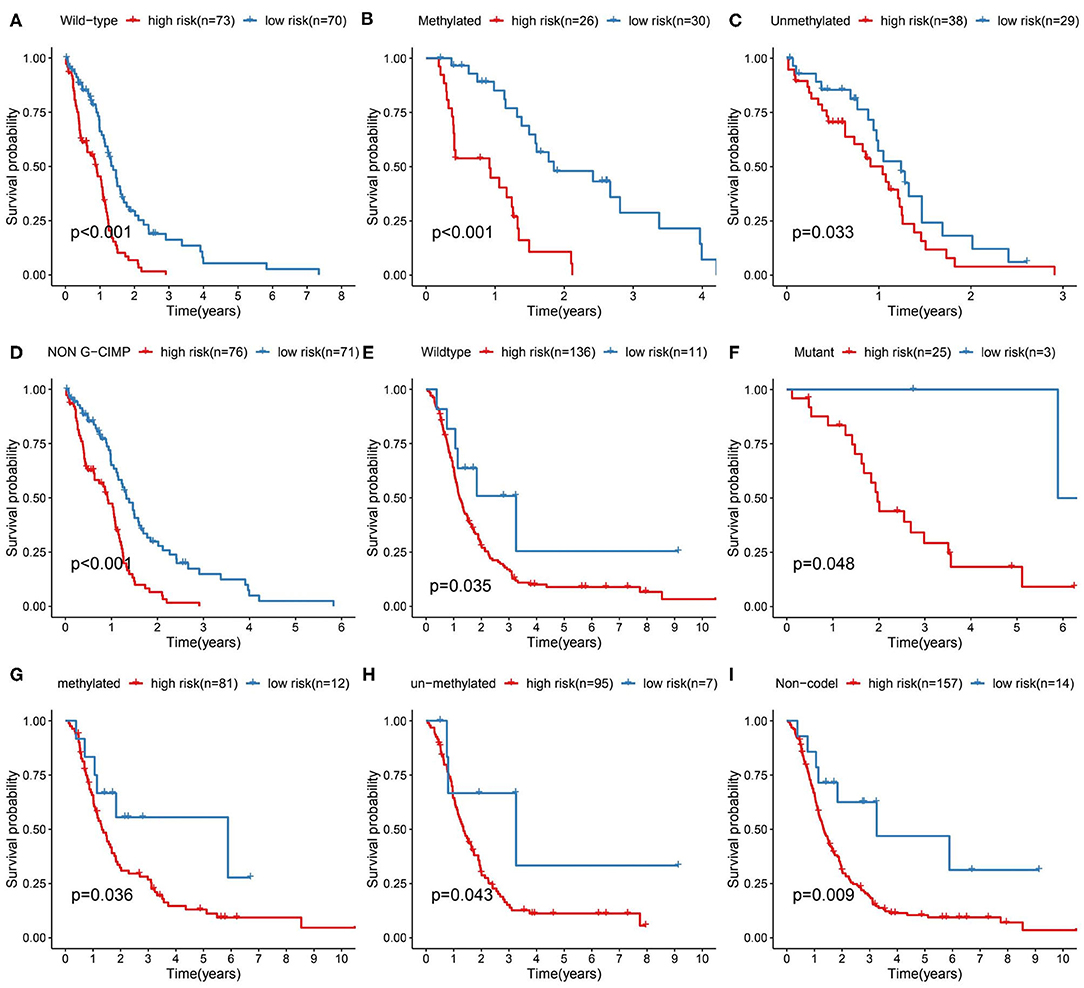
Figure 4. Prediction outcome of the 17-metabolism related gene signature in stratified patients. (A–D) Survival analysis of the signature in patients stratified by IDH1wild type, MGMT promoter methylated/unmethylated status and non-G-CIMP status in TCGA cohort. (E–I) Survival analysis of the signature in patients stratified by IDH1 wild/mutant status, MGMT promoter methylated/unmethylated status and 1p/19q codeletion status in CGGA cohort. IDH1, isocitrate dehydrogenase1; MGMT, methylguanine methyltransferase; G-CIMP, glioma cytosine-phosphate-guanine island methylator phenotype.
By performing the ROC analysis in the training datasets and validation datasets, we next evaluate the accuracy of the risk signature. The result showed that the AUC value of 1-, 2-, and 3-year for the TCGA datasets were 0.710, 0.783, and 0.873, respectively (Figure 5A). And in the CGGA/GSE validation sets, a similar strong prognostic power was obtained (Figures 5B,C). In addition, we also compared the accuracy of the clinical features and risk score for the survival prediction of GBM and discovered that our risk signature is the optimal (Figures 5D–F). These results all confirmed that the metabolism risk signature we constructed had a strong prognostic prediction power.
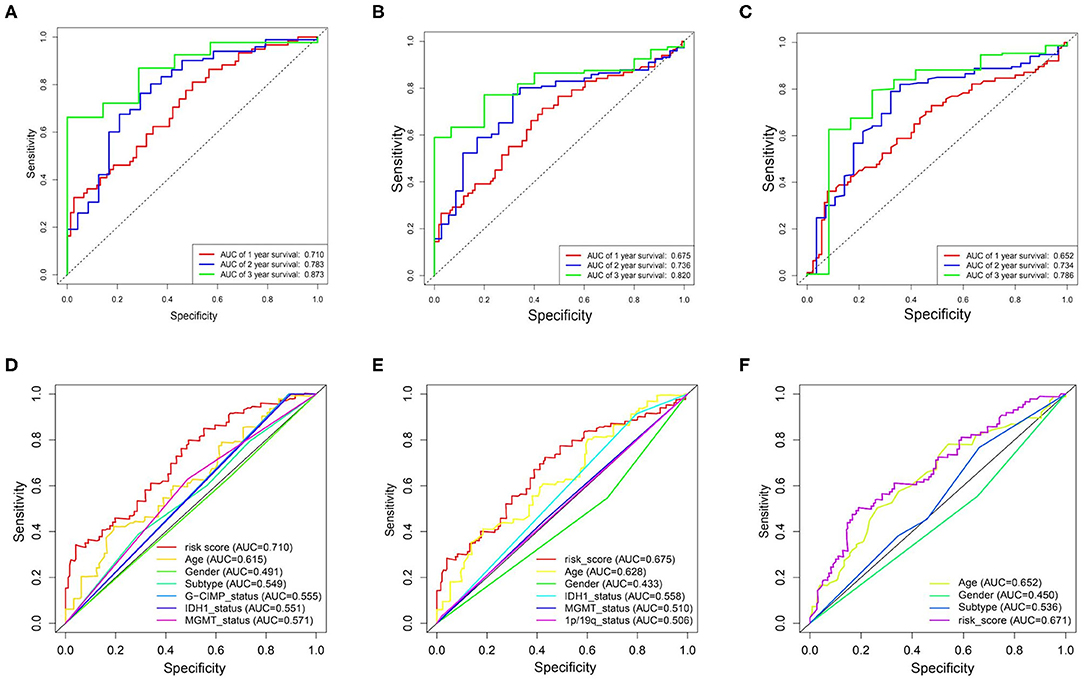
Figure 5. Prognostic power of the identified 17-gene signature in TCGA/CGGA/GSE13041 cohorts. (A–C), ROC analyses in TCGA, CGGA, and GSE13041 cohorts for 1-, 2-, and 3-year. (D) ROC curve analysis of age, gender, subtype, IDH1_status, MGMT_status, G-CIMP_status, and risk score in TCGA cohort. (E) ROC curve analysis of age, gender, IDH1_status, MGMT_status, 1p/19q_status, and risk score in CGGA cohort. (F) ROC curve analysis of age, gender and risk score in GSE13041 cohort. AUC, area under the curve; ROC, receiver operating characteristic; IDH1, isocitrate dehydrogenase1; MGMT, methylguanine methyltransferase; G-CIMP, glioma cytosine-phosphate-guanine island methylator phenotype.
In order to explore the difference in biological process between the high- and the low-risk group in the TCGA cohort, GSEA was performed to compare the gene expression of patients in the two groups. PCA showed that in the three public cohorts of TCGA/CGGA/GSE13041 cases in the high-risk and low-risk groups were significantly distributed in two regions (Supplementary Figure 8). As shown in the Figure 6, GSEA indicated that glycolysis gluconeogenesis, WNT signaling pathway, pathways in cancer, MAPK signaling pathway, ERBB signaling pathway, adherens junction, focal adhesion, ECM receptor interaction and tight junction were significantly enriched in high-risk patients, while low-risk cases showed enrichment of OxPhos. The significantly pathways were selected based on the screening criteria of nominal p < 0.05 and false discovery rate (FDR) <0.25. The results indicated that there were significant differences in biological processes between the two groups of GBM with different metabolic risk levels.
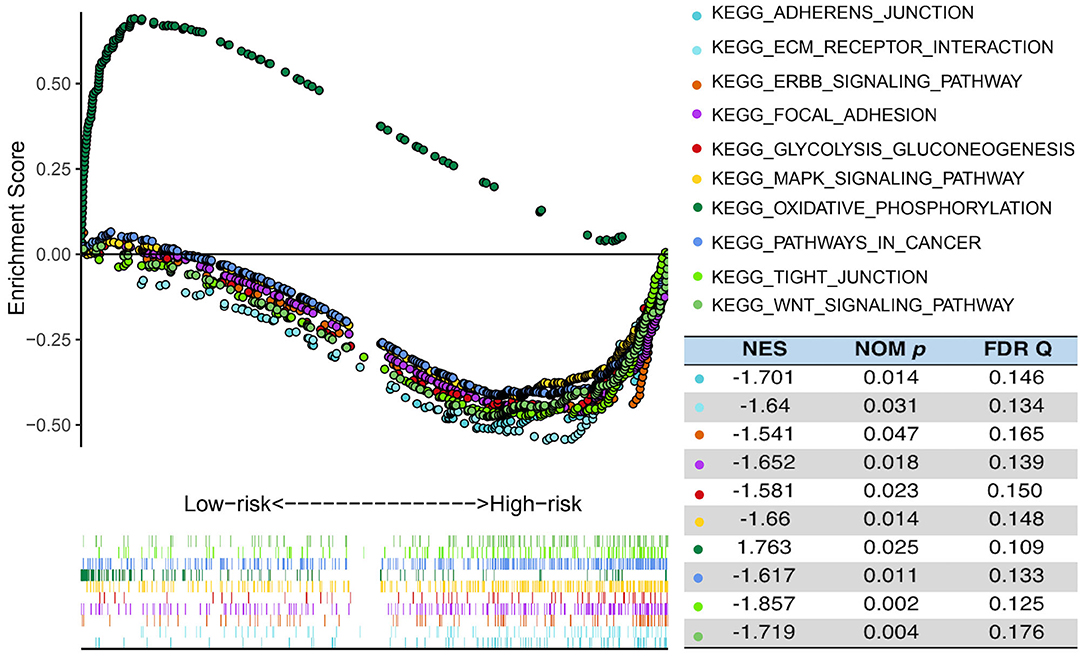
Figure 6. Functional enrichments between high- and low-risk cases of TCGA. GSEA analysis based on the median value of the risk score in TCGA. FDR, false discovery rate; NES, normalized enrichment score; Nom, nominal.
To identify potential compounds capable of targeting the pathways associated with metabolism-related genes, we queried the CMap database using the mRNA expression signatures by applying differential expression analysis to GBM subgroups samples. The 54 compounds that were able to repress the above gene expression profile of GBM are shown in Figure 7. CMap mode of action (MoA) analysis of the 54 compounds revealed 44 mechanisms of action shared by the above compounds. Three compounds (fludroxycortide, fluorometholone, and hydrocortisone) shared the MoA of glucocorticoid receptor agonist, and two compounds (physostigmine and skimmianine) shared the MoA of acetylcholinesterase inhibitor. Moreover, a total of 14 compounds shared the following 7 mechanisms: adrenergic receptor agonists, inhibitors of bacterial cell wall synthesis, carbonic anhydrase inhibitors, DNA synthesis inhibitor, dopamine receptor antagonist, and phosphodiesterase inhibitors.
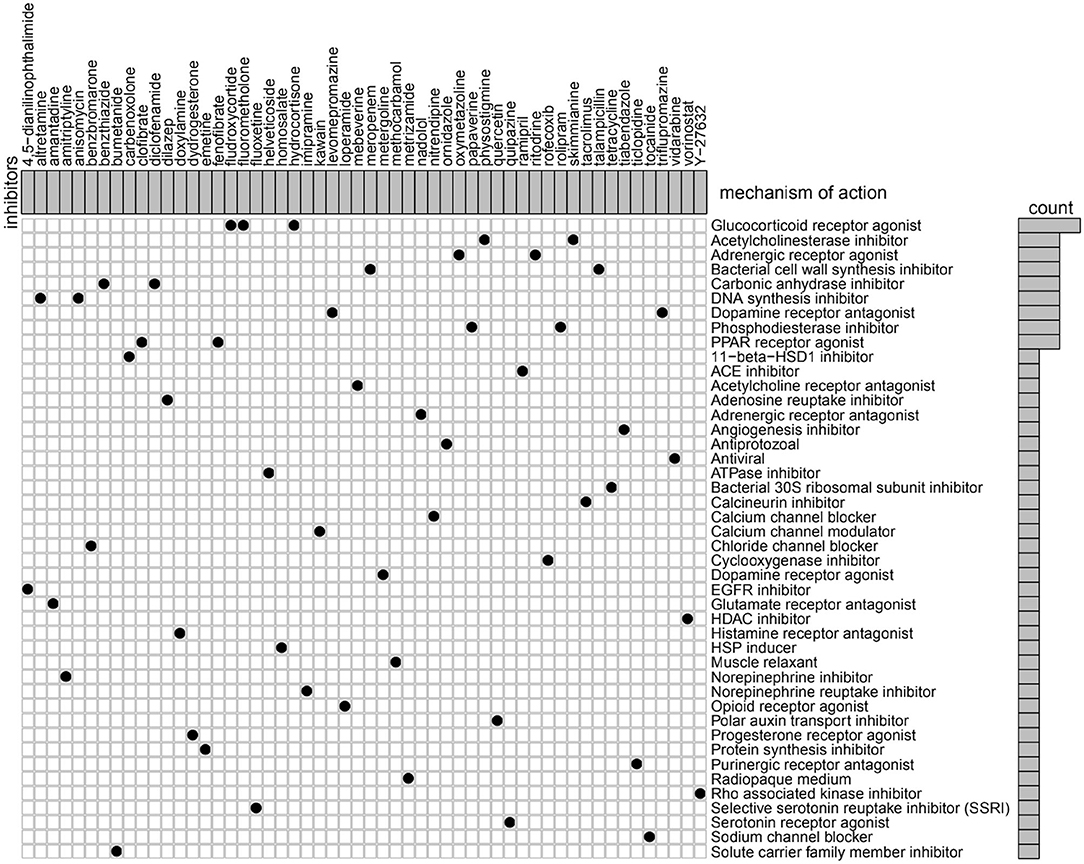
Figure 7. Heatmap showing each compound (perturbagen) from the CMap that shares a MoA (rows), sorted by descending number of compounds with a shared MoA. The above compounds have an absolute value of enrichment score ≥ 0.5 and might be capable of targeting the metabolism-related signature. CMap, Connectivity Map; MoA, mode of action.
In the present study, through the comprehensive analysis of genes involved in glucose, lipid, and glutamine metabolism of GBM patients in three datasets, the risk signature closely related to the prognosis of GBM was constructed, and the heterogeneity of GBM metabolism was further revealed. Firstly, leveraging a large cohort of GBM profile, 3 clusters of GBM with different clinical features were successfully obtained through the cluster analysis. Subsequent analysis revealed that the 3 clusters had significantly different risk scores. In addition, we identified a 17 metabolism-related gene risk signature as a significant independent predictor for the prognosis of GBM by univariate cox regression analysis and LASSO analysis. GSEA suggested glycolysis gluconeogenesis and OxPhos were significantly enriched in high- and low-risk GBM. Moreover, we further demonstrated the robustness of molecular subtype and the predictive power of 17 metabolism-related gene risk signature in two validation datasets, CGGA and GSE13041, and achieved consistent results. Finally, we used CMap database to screen compounds that may target metabolism-related genes, and it is hoped that targeted therapy can be performed on GBM clusters with different metabolic status.
Considering that univariate Cox model has insufficient dimensional data on variable selection, we first performed univariate Cox model to obtain the genes related to overall survival and applied Cox LASSO regression to improve the performance index for predicting prognosis (26). None of the 17 genes showed high coefficients in the Cox model, but the cumulative effect of the 17 genes signature on OS obtained the optimal survival prediction. Interestingly, in the 17-metabolism gene risk signature we constructed, it has been reported that FOXO3 acetylation plays a central role in the regulation of glycolytic metabolism in glioblastoma, and the survival of GBM patients with FOXO3 acetylation is shorter (27). In addition, FOXO3 is related to GBM temozolomide (TMZ) resistance, and the phosphorylated AKT/FOXO3 axis regulates the expression of long non-coding RNA related to TMZ resistance GBM cells (28). Another gene, PIK3R1, is part of the RTK/ RAS/(3)K signaling pathway, which is mutated in many cancers and plays a key role in the proliferation, differentiation, and survival of cancer cells. Nearly 90% of normal GBMs showed different degrees of PIK3R1 changes, leading to abnormal activation of RTK/RAS/PI(3)K signal cascade (29). PIK3R1 has been found to promote the transformation of malignant astrocytes into glioma-like state (30). Stratifin (SFN, 14-3-3 sigma), as an oncogene related to cell proliferation, facilitates the development and progression of a variety of cancers (31, 32) including gliomas (33) and has the potential to be a new therapeutic target. In addition, APOD has been identified to be associated with astrocytoma progression (34). And SH3GLB1, as the autophagy-related gene, is associated with glioma prognosis. Knockdown of SH3GLB1 inhibits glioma cell proliferation, migration and invasion, and improves sensitivity to temozolomide (35). In addition, some of the genes in the 17-metabolism risk signature are involved in the development of a variety of cancers. NR1H4, also known as farnesoid X receptor (Fxr), is the gene with the highest positive coefficient and hazard ratio in the metabolism-related risk signature. Previous studies have shown that NR1H4 plays an important role in the development of colon cancer by regulating the stability of c-Myc (36). KLF15 has been reported to inhibit cell growth in lung adenocarcinoma (37), gastric cancer (38), and colorectal cancer (39), and can be used to predict prognosis. High ADRA2A expression was associated with poor overall survival for breast (40) and bladder cancer (41). As a genetic marker, RNASEL has been linked to lethal prostate cancer (42). And ESRRB (or ERRβ) is a negative regulator of cell cycle and may be a therapeutic target for breast cancer (43). Inhibition of HSPH1 downregulates the expression of Bcl-6 and c-Myc and hampers the growth of human aggressive B cell non-Hodgkin lymphoma (44). ACADS, as one of the key metabolic genes related to the metabolic response involved in carcinogenesis, is regulated by DNA methylation and can be used as a potential methylation biomarker related to the proliferation and metastasis of hepatocellular carcinoma (45). RUFY1, named RUN, and FYVE domain containing 1, is a member of RUFY family (46). RUFY1 regulates the transport of integrins and participates in the migration of NIH-3T3 fibroblasts (47). Evidence shows that RUFY1, as a tumor promoter gene, plays an important role in the development of gastric cancer. Targeting PODXL/RUFY1 complex may improve the prognosis of gastric cancer (GC) and provide new treatment opportunities for GC patients (48). Studies have shown that PCSK1 is the gene most significantly associated with poor response to concurrent chemoradiotherapy (CCRT) in rectal cancer. Therefore, overexpression of PCSK1 is one of the risks of poor CCRT response and prognosis in rectal cancer patients (49). And PCSK1 is also over expressed in pure fibrolamellar hepatocellular carcinoma as one of neuroendocrine genes (50). As for ALAS gene, in non-small-cell lung cancer, non-erythrocyte ALAS1 gene transcription levels and ALAS1 protein levels were significantly elevated in cancer cells, while ALAS2 transcription levels were increased nearly 5-fold in HCC4017 cells (51). However, 2 of the 17-metabolism risk genes, including SPTSSA and ARSF have not been studied in cancers. SPTSSA, also known as serine palmityl transferase small subunit A (SPTSSA), encodes A subunit of SPT that is a rate-limiting enzyme in the sphingolipid biosynthesis pathway (52). As a component of eukaryotic membranes, SLs has a variety of critical functions in the growth and development of embryos and the maintenance of normal physiology (53). In a clear cell renal cell carcinoma (ccRCC) study, bioinformatics analysis revealed that 10 genes, including SPTSSA, significantly coregulated ccRCC with SPTLC1, and the low expression of SPTLC1 was significantly correlated with the disease progression and poor prognosis of ccRCC (54). In addition, another gene ARSF, which is located in Xp22.3 with ARSD and ARSE, has significant homology and highly similar intron/exon structure. Meanwhile, the splicing sites of ARSF, ARSD, ARSE, and ARSC are all at the same position. The biological role of ARSF may therefore be masked by the other three genes (55). The biological role of 17 metabolism-related genes in glioblastoma remains to be further explored.
The Warburg effect has been widely described in GBM and other tumor types. According to the Warburg hypothesis (14), cancers are partly caused by impaired mitochondrial function and OxPhos, which is characterized by cancer cells producing most of their energy through glucose fermentation (such as aerobic glycolysis), with limited OxPhos capacity (56). This metabolic reprogramming is thought to be an adaptive mechanism for the rapid growth of tumor cells to meet their increasing energy needs. However, the intrinsic cellular heterogeneity of GBM raises the question of whether the survival and proliferation of different cell subsets is limited to glucose fermentation or other metabolic pathways. Recent studies suggest that the residual activity of mitochondrial function in GBM cells can still provide OxPhos for cancer cells (57–59). According to Deleyrolle LP's study (6), subgroups of cells with different metabolic requirements exist in GBM, in which fast-cycling cells utilize aerobic glycolysis, while slow-cycling cells preferentially utilize mitochondrial OxPhos to obtain metabolism energy. But some studies hold the opposite view that GBM tissue are unable to obtain significant energy from OxPhos. Because ultrastructural and biochemical evidence suggests that GBM cells exhibit defects in the number, structure and function of mitochondria, thus incompatible with OxPhos energy production (60–63). In addition, large numbers of mitochondrial DNA (mtDNA) mutations have been found in 13 cancers including GBM that compromise OxPhos function (64). Therefore, emerging evidence indicates that cancer cells including GBM obtain energy through the glutaminolysis pathway using mitochondrial substrate-level phosphorylation (mSLP) as an alternative to OxPhos (61). Moreover, some studies based on the above theory, ketogenic metabolic therapy, as an alternative standard of care, has the potential to improve outcomes for GBM patients and other malignant brain cancers, and has yielded impressive results in clinical practice for GBM treatment (65–69). Here, functional analysis in our study indicated that GBMs are metabolic heterogeneity and the biological process differences between the high- and the low-risk group mainly focused on the metabolic patterns and signaling pathways. Glycolysis gluconeogenesis and OxPhos were significantly enriched in high- and low-risk GBMs. Whether OxPhos is caused by mSLP remains to be confirmed by future studies. In addition, our functional enrichment analysis identified metabolic signaling pathways associated with high-risk GBM, including WNT signaling pathway, MAPK signaling pathway, ERBB signaling pathway and pathways in cancer. Of which, abnormal Wnt signaling is recognized to drive metabolic alterations such as glycolysis, lipogenesis and glutaminolysis, which are critical to the survival of cancer stem cells (70). The pathogenesis of GBM involves multiple levels of WNT signal pathway, including tumorigenesis, stem cell maintenance, invasion, and drug resistance. Inhibition of WNT signal transduction is expected to be a new direction of GBM therapy (70, 71).
CMap is a systematic tool that uses gene-expression signatures to probe the relationship between small molecules, genes and disease (72). It screens new treatments for various diseases by comparing changes in gene expression or signature caused by disease, genetic perturbation (knockdown or overexpression of genes) or small molecule therapy with the similarity of all perturbation signatures in the database. In this study, we used CMap analysis to accurately identify compounds that have been shown to have specific effects on GBM or other tumor types by comparing the different expression genes of GMB samples from 3 clusters. These compounds include the DNA synthesis inhibitor anisomycin (73), glutamate receptor antagonist amantadine (74), norepinephrine inhibitor amitriptyline (75, 76), solute carrier family member inhibitor bumetanide (77), PPAR receptor agonist clofibrate (78), and fenofibrate (79), selective serotonin reuptake inhibitor (SSRI) fluoxetine (75, 80), ATPase inhibitor helveticoside (81, 82), norepinephrine reuptake inhibitor imipramine (75, 76, 83, 84), opioid receptor agonist loperamide (85), phosphodiesterase inhibitor papaverine (86, 87) and rolipram (88–92), polar auxin transport inhibitor quercetin (93, 94), cyclooxygenase inhibitor rofecoxib (95, 96), calcineurin inhibitor tacrolimus (97), purinergic receptor antagonist ticlopidine (98, 99), HDAC inhibitor vorinostat (100), Rho associated kinase inhibitor Y-27632 (101–103).
Interestingly, our results suggest that some conventional antipsychotics among drugs mentioned above, including amitriptyline, fluoxetine, and imipramine, may also play a surprising role in the treatment of GBM, which is consistent with previous studies and offers new hope for patients with GBM (12, 75, 76, 80, 83, 84, 104). In addition, Leite et al. (105) demonstrated that clomipramine (tricyclic antidepressant drugs such as imipramine) has an impact on GBM growth and has no toxicity in normal cells (astrocytes and microglia). Reaserches have further elucidated the potential mechanism of conventional antidepressants therapy for GBM. By targeting the respiratory chain complex III and changing membrane potential, the tricyclics antidepressants mentioned above induce mitochondria-mediated apoptosis of malignant glioma cells, activate the intrinsic pathway of cytochrome-C release and caspase-3 dependent apoptosis process, and finally results in glioma cell death (106–112). It is worth mentioning that previous studies have also indicated that the anticoagulant ticlopidine synergized with imipramine to induce the death of human glioma cell lines and primary mouse glioma cells (98, 99). In addition, some of the other drugs in our findings mentioned above have been reported as a combination of glioblastoma chemotherapy, such as rollipram, a promising immunotherapeutic adjuvant that can potentiate the effect of bevacizumab on GBM (89, 90). The antiangiogenic effect of rofecoxib makes GBM chemotherapy more effective (96). Tacrolimus endows the GBM stem-like cells chemosensitive to the MRP1 drug substrate (97). Of course, it is still controversial whether some of the drugs identified by our study are effective against GBM. Such as vorinostat combined with bevacizumab significantly inhibited angiogenesis of GBM stem cells in vitro (100), but no significant benefit was observed in patients with GBM in clinical trials (113). However, our study provides evidence to explore the underlying mechanism of these drugs in the treatment of GBM, and it may be a new direction to investigate whether these drugs have the potential to treat GBM from a metabolic perspective.
However, some limitations of our present study should be acknowledged. First, GSE13041, one of the external validation datasets which was selected in this study lacked some clinical information, so the prognostic value of signatures needed to be validated by more external datasets, and multicenter prospective studies are needed to assess the feasibility of risk gene signatures in the future. Second, the deep molecular mechanisms behind our findings need to be further elucidated in experimental studies to facilitate our understanding of the functional roles and clinical applications of metabolism-related genes and potential molecular compounds. In particular, the issue of whether GBM tumor cells can utilize Oxphos (or mSLP) to generate the required energy remains to be further explored due to the lack of support from relevant datasets.
Our study identified a novel metabolism-related gene signature, in addition the existence of three different metabolic status and two opposite biological processes in GBM were recognized, which revealed the metabolic heterogeneity of GBM. Robust metabolic subtypes and powerful risk prognostic models contributed a new perspective to the metabolic exploration of GBM.
The datasets analyzed for this study are available from the Cancer Genome Atlas (TCGA) (http://cancergenome.nih.gov/), the Chinese Glioma Genome Atlas (CGGA) (http://www.cgga.org.cn/index.jsp), and Gene Expression Omnibus (GEO) (https://www.ncbi.nlm.nih.gov/geo/query/acc.cgi?acc=GSE13041).
GL and HX conceived and designed the study. RZ put forward constructive suggestions to the study. ZH and CW analyzed the results, completed the visualization of the image, and contributed equally to this work. ZH completed the manuscript. All authors participated in the preparation approved the final manuscript.
This work was supported by grants from the National Natural Science Foundation of China (Nos. 81874083, 81571284, 81702468, 81802966, and 81902540), Natural Science Foundation of Shandong Province of China (Nos. 2017CXGC1203, 2017G006012, and ZR2019BH057), and Taishan Scholars Foundation of Shandong Province of China (No. ts201511093).
The authors declare that the research was conducted in the absence of any commercial or financial relationships that could be construed as a potential conflict of interest.
ZH sincerely thanks his family for their help and support, especially his parents, wife and son for providing him with a quiet and undisturbed working environment. At the same time, due to the excellent performance of Apple MacBook Pro laptop, the whole data analysis process was very pleasant and enjoyable.
The Supplementary Material for this article can be found online at: https://www.frontiersin.org/articles/10.3389/fonc.2020.01631/full#supplementary-material
1. Wen PY, Kesari S. Malignant gliomas in adults. N Engl J Med. (2008) 359:492–507. doi: 10.1056/NEJMra0708126
2. Ostrom QT, Cote DJ, Ascha M, Kruchko C, Barnholtz-Sloan JS. Adult glioma incidence and survival by race or ethnicity in the United States From 2000 to 2014. JAMA Oncol. (2018) 4:1254–62. doi: 10.1001/jamaoncol.2018.1789
3. Phillips HS, Kharbanda S, Chen R, Forrest WF, Soriano RH, Wu TD, et al. Molecular subclasses of high-grade glioma predict prognosis, delineate a pattern of disease progression, and resemble stages in neurogenesis. Cancer Cell. (2006) 9:157–73. doi: 10.1016/j.ccr.2006.02.019
4. Brennan CW, Verhaak RG, McKenna A, Campos B, Noushmehr H, Salama SR, et al. The somatic genomic landscape of glioblastoma. Cell. (2013) 155:462–77. doi: 10.1016/j.cell.2013.09.034
5. Hu J, Locasale JW, Bielas JH, O'Sullivan J, Sheahan K, Cantley LC, et al. Heterogeneity of tumor-induced gene expression changes in the human metabolic network. Nat Biotechnol. (2013) 31:522–9. doi: 10.1038/nbt.2530
6. Hoang-Minh LB, Siebzehnrubl FA, Yang C, Suzuki-Hatano S, Dajac K, Loche T, et al. Infiltrative and drug-resistant slow-cycling cells support metabolic heterogeneity in glioblastoma. EMBO J. (2018) 37:e98772. doi: 10.15252/embj.201798772
7. Delgado-Lopez PD, Corrales-Garcia EM. Survival in glioblastoma: a review on the impact of treatment modalities. Clin Transl Oncol. (2016) 18:1062–71. doi: 10.1007/s12094-016-1497-x
8. Westphal M, Lamszus K. The neurobiology of gliomas: from cell biology to the development of therapeutic approaches. Nat Rev Neurosci. (2011) 12:495–508. doi: 10.1038/nrn3060
9. Hanahan D, Weinberg RA. Hallmarks of cancer: the next generation. Cell. (2011) 144:646–74. doi: 10.1016/j.cell.2011.02.013
10. Crunkhorn S. Targeting cancer cell metabolism in glioblastoma. Nat Rev Cancer. (2019) 19:250. doi: 10.1038/s41568-019-0139-3
11. Rosario SR, Long MD, Affronti HC, Rowsam AM, Eng KH, Smiraglia DJ. Pan-cancer analysis of transcriptional metabolic dysregulation using the cancer genome Atlas. Nat Commun. (2018) 9:5330. doi: 10.1038/s41467-018-07232-8
12. Civita P, Franceschi S, Aretini P, Ortenzi V, Menicagli M, Lessi F, et al. Laser capture microdissection and RNA-Seq analysis: high sensitivity approaches to explain histopathological heterogeneity in human glioblastoma FFPE archived tissues. Front Oncol. (2019) 9:482. doi: 10.3389/fonc.2019.00482
13. Libby CJ, Tran AN, Scott SE, Griguer C, Hjelmeland AB. The pro-tumorigenic effects of metabolic alterations in glioblastoma including brain tumor initiating cells. Biochim Biophys Acta Rev Cancer. (2018) 1869:175–88. doi: 10.1016/j.bbcan.2018.01.004
14. Warburg O, Wind F, Negelein E. The metabolism of tumors in the body. J Gen Physiol. (1927) 8:519–30. doi: 10.1085/jgp.8.6.519
15. Liu Q, Luo Q, Halim A, Song G. Targeting lipid metabolism of cancer cells: a promising therapeutic strategy for cancer. Cancer Lett. (2017) 401:39–45. doi: 10.1016/j.canlet.2017.05.002
16. Srivastava NK, Pradhan S, Gowda GA, Kumar R. In vitro, high-resolution 1H and 31P NMR based analysis of the lipid components in the tissue, serum, and CSF of the patients with primary brain tumors: one possible diagnostic view. NMR Biomed. (2010) 23:113–22. doi: 10.1002/nbm.1427
17. Tosi MR, Tugnoli V. Cholesteryl esters in malignancy. Clin Chim Acta. (2005) 359:27–45. doi: 10.1016/j.cccn.2005.04.003
18. Bott AJ, Peng IC, Fan Y, Faubert B, Zhao L, Li J, et al. Oncogenic Myc induces expression of glutamine synthetase through promoter demethylation. Cell Metab. (2015) 22:1068–77. doi: 10.1016/j.cmet.2015.09.025
19. Zhao Y, Butler EB, Tan M. Targeting cellular metabolism to improve cancer therapeutics. Cell Death Dis. (2013) 4:e532. doi: 10.1038/cddis.2013.60
20. Hoadley KA, Yau C, Hinoue T, Wolf DM, Lazar AJ, Drill E, et al. Cell-of-origin patterns dominate the molecular classification of 10,000 tumors from 33 types of cancer. Cell. (2018) 173:291–304 e6. doi: 10.1016/j.cell.2018.03.022
21. Lee Y, Scheck AC, Cloughesy TF, Lai A, Dong J, Farooqi HK, et al. Gene expression analysis of glioblastomas identifies the major molecular basis for the prognostic benefit of younger age. BMC Med Genomics. (2008) 1:52. doi: 10.1186/1755-8794-1-52
22. Subramanian A, Tamayo P, Mootha VK, Mukherjee S, Ebert BL, Gillette MA, et al. Gene set enrichment analysis: a knowledge-based approach for interpreting genome-wide expression profiles. Proc Natl Acad Sci USA. (2005) 102:15545–50. doi: 10.1073/pnas.0506580102
23. O'Quigley J, Moreau T. Cox's regression model: computing a goodness of fit statistic. Comput Methods Programs Biomed. (1986) 22:253–6. doi: 10.1016/0169-2607(86)90001-5
24. Subramanian A, Kuehn H, Gould J, Tamayo P, Mesirov JP. GSEA-P: a desktop application for gene set enrichment analysis. Bioinformatics. (2007) 23:3251–3. doi: 10.1093/bioinformatics/btm369
25. Ritchie ME, Phipson B, Wu D, Hu Y, Law CW, Shi W, et al. limma powers differential expression analyses for RNA-sequencing and microarray studies. Nucleic Acids Res. (2015) 43:e47. doi: 10.1093/nar/gkv007
26. Hughey JJ, Butte AJ. Robust meta-analysis of gene expression using the elastic net. Nucleic Acids Res. (2015) 43:e79. doi: 10.1093/nar/gkv229
27. Masui K, Tanaka K, Akhavan D, Babic I, Gini B, Matsutani T, et al. mTOR complex 2 controls glycolytic metabolism in glioblastoma through FoxO acetylation and upregulation of c-Myc. Cell Metab. (2013) 18:726–39. doi: 10.1016/j.cmet.2013.09.013
28. Wu P, Cai J, Chen Q, Han B, Meng X, Li Y, et al. Lnc-TALC promotes O(6)-methylguanine-DNA methyltransferase expression via regulating the c-Met pathway by competitively binding with miR-20b-3p. Nat Commun. (2019) 10:2045. doi: 10.1038/s41467-019-10025-2
29. Cancer Genome Atlas Research N. Comprehensive genomic characterization defines human glioblastoma genes and core pathways. Nature. (2008) 455:1061–8. doi: 10.1038/nature07385
30. Quayle SN, Lee JY, Cheung LW, Ding L, Wiedemeyer R, Dewan RW, et al. Somatic mutations of PIK3R1 promote gliomagenesis. PLoS ONE. (2012) 7:e49466. doi: 10.1371/journal.pone.0049466
31. Shiba-Ishii A, Kim Y, Shiozawa T, Iyama S, Satomi K, Kano J, et al. Stratifin accelerates progression of lung adenocarcinoma at an early stage. Mol Cancer. (2015) 14:142. doi: 10.1186/s12943-015-0414-1
32. Umbricht CB, Evron E, Gabrielson E, Ferguson A, Marks J, Sukumar S. Hypermethylation of 14–3-3 sigma. (stratifin) is an early event in breast cancer. Oncogene. (2001) 20:3348–53. doi: 10.1038/sj.onc.1204438
33. Deng J, Gao G, Wang L, Wang T, Yu J, Zhao Z. Stratifin expression is a novel prognostic factor in human gliomas. Pathol Res Pract. (2011) 207:674–9. doi: 10.1016/j.prp.2011.08.005
34. van den Boom J, Wolter M, Blaschke B, Knobbe CB, Reifenberger G. Identification of novel genes associated with astrocytoma progression using suppression subtractive hybridization and real-time reverse transcription-polymerase chain reaction. Int J Cancer. (2006) 119:2330–8. doi: 10.1002/ijc.22108
35. Zhang H, Lu X, Wang N, Wang J, Cao Y, Wang T, et al. Autophagy-related gene expression is an independent prognostic indicator of glioma. Oncotarget. (2017) 8:60987–1000. doi: 10.18632/oncotarget.17719
36. Lee YJ, Lee EY, Choi BH, Jang H, Myung JK, You HJ. The role of nuclear receptor subfamily 1 group H member 4. (NR1H4) in colon cancer cell survival through the regulation of c-Myc stability. Mol Cells. (2020) 43:459–68. doi: 10.14348/molcells.2020.0041
37. Wang X, He M, Li J, Wang H, Huang J. KLF15 suppresses cell growth and predicts prognosis in lung adenocarcinoma. Biomed Pharmacother. (2018) 106:672–7. doi: 10.1016/j.biopha.2018.07.006
38. Sun C, Ma P, Wang Y, Liu W, Chen Q, Pan Y, et al. KLF15 Inhibits cell proliferation in gastric cancer cells via up-regulating CDKN1A/p21 and CDKN1C/p57 expression. Dig Dis Sci. (2017) 62:1518–26. doi: 10.1007/s10620-017-4558-2
39. Wang Y, Jiang F, Xiong Y, Cheng X, Qiu Z, Song R. LncRNA TTN-AS1 sponges miR-376a-3p to promote colorectal cancer progression via upregulating KLF15. Life Sci. (2020) 244:116936. doi: 10.1016/j.lfs.2019.116936
40. Rivero EM, Martinez LM, Bruque CD, Gargiulo L, Bruzzone A, Luthy IA. Prognostic significance of α- and β2-adrenoceptor gene expression in breast cancer patients. Br J Clin Pharmacol. (2019) 85:2143–54. doi: 10.1111/bcp.14030
41. Lv J, Zhu Y, Ji A, Zhang Q, Liao G. Mining TCGA database for tumor mutation burden and their clinical significance in bladder cancer. Biosci Rep. (2020) 40. doi: 10.1042/BSR20194337
42. Lin DW, FitzGerald LM, Fu R, Kwon EM, Zheng SL, Kolb S, et al. Genetic variants in the LEPR, CRY1, RNASEL, IL4, and ARVCF genes are prognostic markers of prostate cancer-specific mortality. Cancer Epidemiol Biomarkers Prev. (2011) 20:1928–36. doi: 10.1158/1055-9965.EPI-11-0236
43. Madhu Krishna B, Chaudhary S, Mishra DR, Naik SK, Suklabaidya S, Adhya AK, et al. Estrogen receptor alpha dependent regulation of estrogen related receptor beta and its role in cell cycle in breast cancer. BMC Cancer. (2018) 18:607. doi: 10.1186/s12885-018-4528-x
44. Zappasodi R, Ruggiero G, Guarnotta C, Tortoreto M, Tringali C, Cavane A, et al. HSPH1 inhibition downregulates Bcl-6 and c-Myc and hampers the growth of human aggressive B-cell non-Hodgkin lymphoma. Blood. (2015) 125:1768–71. doi: 10.1182/blood-2014-07-590034
45. Chen D, Feng X, Lv Z, Xu X, Lu Y, Wu W, et al. ACADS acts as a potential methylation biomarker associated with the proliferation and metastasis of hepatocellular carcinomas. Aging. (2019) 11:8825–44. doi: 10.18632/aging.102292
46. Cormont M, Mari M, Galmiche A, Hofman P, Le Marchand-Brustel Y. A FYVE-finger-containing protein, Rabip4, is a Rab4 effector involved in early endosomal traffic. Proc Natl Acad Sci USA. (2001) 98:1637–42. doi: 10.1073/pnas.98.4.1637
47. Vukmirica J, Monzo P, Le Marchand-Brustel Y, Cormont M. The Rab4A effector protein Rabip4 is involved in migration of NIH 3T3 fibroblasts. J Biol Chem. (2006) 281:36360–8. doi: 10.1074/jbc.M602920200
48. Zhi Q, Chen H, Liu F, Han Y, Wan D, Xu Z, et al. Podocalyxin-like protein promotes gastric cancer progression through interacting with RUN and FYVE domain containing 1 protein. Cancer Sci. (2019) 110:118–34. doi: 10.1111/cas.13864
49. Chou CL, Chen TJ, Lin CY, Lee SW, Wang SC, Chu SS, et al. PCSK1 Overexpression in rectal cancer correlates with poor response to preoperative chemoradiotherapy and prognosis. Onco Targets Ther. (2020) 13:3141–50. doi: 10.2147/OTT.S243750
50. Malouf GG, Job S, Paradis V, Fabre M, Brugieres L, Saintigny P, et al. Transcriptional profiling of pure fibrolamellar hepatocellular carcinoma reveals an endocrine signature. Hepatology. (2014) 59:2228–37. doi: 10.1002/hep.27018
51. Hooda J, Cadinu D, Alam MM, Shah A, Cao TM, Sullivan LA, et al. Enhanced heme function and mitochondrial respiration promote the progression of lung cancer cells. PLoS ONE. (2013) 8:e63402. doi: 10.1371/journal.pone.0063402
52. Han G, Gupta SD, Gable K, Niranjanakumari S, Moitra P, Eichler F, et al. Identification of small subunits of mammalian serine palmitoyltransferase that confer distinct acyl-CoA substrate specificities. Proc Natl Acad Sci USA. (2009) 106:8186–91. doi: 10.1073/pnas.0811269106
53. Yamashita T, Wada R, Sasaki T, Deng C, Bierfreund U, Sandhoff K, et al. A vital role for glycosphingolipid synthesis during development and differentiation. Proc Natl Acad Sci USA. (1999) 96:9142–7. doi: 10.1073/pnas.96.16.9142
54. Zhu WK, Xu WH, Wang J, Huang YQ, Abudurexiti M, Qu YY, et al. Decreased SPTLC1 expression predicts worse outcomes in ccRCC patients. J Cell Biochem. (2020) 121:1552–62. doi: 10.1002/jcb.29390
55. Puca AA, Zollo M, Repetto M, Andolfi G, Guffanti A, Simon G, et al. Identification by shotgun sequencing, genomic organization, and functional analysis of a fourth arylsulfatase gene. (ARSF) from the Xp22.3 region. Genomics. (1997) 42:192–9. doi: 10.1006/geno.1997.4716
56. Koppenol WH, Bounds PL, Dang CV. Otto Warburg's contributions to current concepts of cancer metabolism. Nat Rev Cancer. (2011) 11:325–37. doi: 10.1038/nrc3038
57. Marin-Valencia I, Yang C, Mashimo T, Cho S, Baek H, Yang XL, et al. Analysis of tumor metabolism reveals mitochondrial glucose oxidation in genetically diverse human glioblastomas in the mouse brain in vivo. Cell Metab. (2012) 15:827–37. doi: 10.1016/j.cmet.2012.10.010
58. Mashimo T, Pichumani K, Vemireddy V, Hatanpaa KJ, Singh DK, Sirasanagandla S, et al. Acetate is a bioenergetic substrate for human glioblastoma and brain metastases. Cell. (2014) 159:1603–14. doi: 10.1016/j.cell.2014.11.025
59. Lin H, Patel S, Affleck VS, Wilson I, Turnbull DM, Joshi AR, et al. Fatty acid oxidation is required for the respiration and proliferation of malignant glioma cells. Neuro Oncol. (2017) 19:43–54. doi: 10.1093/neuonc/now128
60. Arismendi-Morillo G, Castellano-Ramirez A, Seyfried TN. Ultrastructural characterization of the Mitochondria-associated membranes abnormalities in human astrocytomas: functional and therapeutics implications. Ultrastruct Pathol. (2017) 41:234–44. doi: 10.1080/01913123.2017.1300618
61. Chinopoulos C, Seyfried TN. Mitochondrial substrate-level phosphorylation as energy source for glioblastoma: review and hypothesis. ASN Neuro. (2018) 10:1759091418818261. doi: 10.1177/1759091418818261
62. Arismendi-Morillo GJ, Castellano-Ramirez AV. Ultrastructural mitochondrial pathology in human astrocytic tumors: potentials implications pro-therapeutics strategies. J Electron Microsc. (2008) 57:33–9. doi: 10.1093/jmicro/dfm038
63. Feichtinger RG, Weis S, Mayr JA, Zimmermann F, Geilberger R, Sperl W, et al. Alterations of oxidative phosphorylation complexes in astrocytomas. Glia. (2014) 62:514–25. doi: 10.1002/glia.22621
64. Yuan Y, Ju YS, Kim Y, Li J, Wang Y, Yoon CJ, et al. Comprehensive molecular characterization of mitochondrial genomes in human cancers. Nat Genet. (2020) 52:342–52. doi: 10.1038/s41588-019-0557-x
65. Seyfried TN, Flores R, Poff AM, D'Agostino DP, Mukherjee P. Metabolic therapy: a new paradigm for managing malignant brain cancer. Cancer Lett. (2015) 356(2 Pt A):289–300. doi: 10.1016/j.canlet.2014.07.015
66. Mukherjee P, Augur ZM, Li M, Hill C, Greenwood B, Domin MA, et al. Therapeutic benefit of combining calorie-restricted ketogenic diet and glutamine targeting in late-stage experimental glioblastoma. Commun Biol. (2019) 2:200. doi: 10.1038/s42003-019-0455-x
67. Seyfried TN, Shelton L, Arismendi-Morillo G, Kalamian M, Elsakka A, Maroon J, et al. Provocative question: should ketogenic metabolic therapy become the standard of care for glioblastoma? Neurochem Res. (2019) 44:2392–404. doi: 10.1007/s11064-019-02795-4
68. Augur ZM, Doyle CM, Li M, Mukherjee P, Seyfried TN. Nontoxic targeting of energy metabolism in preclinical VM-M3 experimental glioblastoma. Front Nutr. (2018) 5:91. doi: 10.3389/fnut.2018.00091
69. Elsakka AMA, Bary MA, Abdelzaher E, Elnaggar M, Kalamian M, Mukherjee P, et al. Management of glioblastoma multiforme in a patient treated with ketogenic metabolic therapy and modified standard of care: a 24-month follow-up. Front Nutr. (2018) 5:20. doi: 10.3389/fnut.2018.00020
70. El-Sahli S, Xie Y, Wang L, Liu S. Wnt signaling in cancer metabolism and immunity. Cancers. (2019) 11:904. doi: 10.3390/cancers11070904
71. Lee Y, Lee JK, Ahn SH, Lee J, Nam DH. WNT signaling in glioblastoma and therapeutic opportunities. Lab Invest. (2016) 96:137–50. doi: 10.1038/labinvest.2015.140
72. Lamb J, Crawford ED, Peck D, Modell JW, Blat IC, Wrobel MJ, et al. The Connectivity Map: using gene-expression signatures to connect small molecules, genes, and disease. Science. (2006) 313:1929–35. doi: 10.1126/science.1132939
73. Li JY, Huang JY, Li M, Zhang H, Xing B, Chen G, et al. Anisomycin induces glioma cell death via down-regulation of PP2A catalytic subunit in vitro. Acta Pharmacol Sin. (2012) 33:935–40. doi: 10.1038/aps.2012.46
74. Corsi L, Mescola A, Alessandrini A. Glutamate receptors and glioblastoma multiforme: an old “route” for new perspectives. Int J Mol Sci. (2019) 20:1796. doi: 10.3390/ijms20071796
75. Bielecka-Wajdman AM, Lesiak M, Ludyga T, Sieron A, Obuchowicz E. Reversing glioma malignancy: a new look at the role of antidepressant drugs as adjuvant therapy for glioblastoma multiforme. Cancer Chemother Pharmacol. (2017) 79:1249–56. doi: 10.1007/s00280-017-3329-2
76. Bielecka-Wajdman AM, Ludyga T, Machnik G, Golyszny M, Obuchowicz E. Tricyclic antidepressants modulate stressed mitochondria in glioblastoma multiforme cells. Cancer Control. (2018) 25:1073274818798594. doi: 10.1177/1073274818798594
77. Ilkhanizadeh S, Sabelstrom H, Miroshnikova YA, Frantz A, Zhu W, Idilli A, et al. Antisecretory factor-mediated inhibition of cell volume dynamics produces antitumor activity in glioblastoma. Mol Cancer Res. (2018) 16:777–90. doi: 10.1158/1541-7786.MCR-17-0413
78. Murad H, Collet P, Brunner E, Schohn H, Becuwe P, Devignes MD, et al. Immunoselection and characterization of a human genomic PPAR binding fragment located within POTE genes. Biochimie. (2007) 89:329–36. doi: 10.1016/j.biochi.2006.09.017
79. Wilk A, Wyczechowska D, Zapata A, Dean M, Mullinax J, Marrero L, et al. Molecular mechanisms of fenofibrate-induced metabolic catastrophe and glioblastoma cell death. Mol Cell Biol. (2015) 35:182–98. doi: 10.1128/MCB.00562-14
80. Zhuo C, Xun Z, Hou W, Ji F, Lin X, Tian H, et al. Surprising anticancer activities of psychiatric medications: old drugs offer new hope for patients with brain cancer. Front Pharmacol. (2019) 10:1262. doi: 10.3389/fphar.2019.01262
81. An N, Sun Y, Ma L, Shi S, Zheng X, Feng W, et al. Helveticoside Exhibited p53-dependent anticancer activity against colorectal cancer. Arch Med Res. (2020) 51:224–32. doi: 10.1016/j.arcmed.2020.02.007
82. Kim BY, Lee J, Kim NS. Helveticoside is a biologically active component of the seed extract of Descurainia sophia and induces reciprocal gene regulation in A549 human lung cancer cells. BMC Genomics. (2015) 16:713. doi: 10.1186/s12864-015-1918-1
83. Munson JM, Fried L, Rowson SA, Bonner MY, Karumbaiah L, Diaz B, et al. Anti-invasive adjuvant therapy with imipramine blue enhances chemotherapeutic efficacy against glioma. Sci Transl Med. (2012) 4:127ra36. doi: 10.1126/scitranslmed.3003016
84. Hsu FT, Chiang IT, Wang WS. Induction of apoptosis through extrinsic/intrinsic pathways and suppression of ERK/NF-κB signalling participate in anti-glioblastoma of imipramine. J Cell Mol Med. (2020) 24:3982–4000. doi: 10.1111/jcmm.15022
85. Zielke S, Meyer N, Mari M, Abou-El-Ardat K, Reggiori F, van Wijk SJL, et al. Loperamide, pimozide, and STF-62247 trigger autophagy-dependent cell death in glioblastoma cells. Cell Death Dis. (2018) 9:994. doi: 10.1038/s41419-018-1003-1
86. Inada M, Shindo M, Kobayashi K, Sato A, Yamamoto Y, Akasaki Y, et al. Anticancer effects of a non-narcotic opium alkaloid medicine, papaverine, in human glioblastoma cells. PLoS ONE. (2019) 14:e0216358. doi: 10.1371/journal.pone.0216358
87. Inada M, Sato A, Shindo M, Yamamoto Y, Akasaki Y, Ichimura K, et al. Anticancer Non-narcotic opium alkaloid papaverine suppresses human glioblastoma cell growth. Anticancer Res. (2019) 39:6743–50. doi: 10.21873/anticanres.13889
88. Cho HY, Thein TZ, Wang W, Swenson SD, Fayngor RA, Ou M, et al. The Rolipram-Perillyl alcohol conjugate. (NEO214) is a mediator of cell death through the death receptor pathway. Mol Cancer Ther. (2019) 18:517–30. doi: 10.1158/1535-7163.MCT-18-0465
89. Ramezani S, Vousooghi N, Kapourchali FR, Hadjighasem M, Hayat P, Amini N, et al. Rolipram potentiates bevacizumab-induced cell death in human glioblastoma stem-like cells. Life Sci. (2017) 173:11–9. doi: 10.1016/j.lfs.2017.02.005
90. Ramezani S, Vousooghi N, Ramezani Kapourchali F, Yousefzadeh-Chabok S, Reihanian Z, Alizadeh AM, et al. Rolipram optimizes therapeutic effect of bevacizumab by enhancing proapoptotic, antiproliferative signals in a glioblastoma heterotopic model. Life Sci. (2019) 239:116880. doi: 10.1016/j.lfs.2019.116880
91. Kang TW, Choi SW, Yang SR, Shin TH, Kim HS, Yu KR, et al. Growth arrest and forced differentiation of human primary glioblastoma multiforme by a novel small molecule. Sci Rep. (2014) 4:5546. doi: 10.1038/srep05546
92. Yang L, Jackson E, Woerner BM, Perry A, Piwnica-Worms D, Rubin JB. Blocking CXCR4-mediated cyclic AMP suppression inhibits brain tumor growth in vivo. Cancer Res. (2007) 67:651–8. doi: 10.1158/0008-5472.CAN-06-2762
93. Tavana E, Mollazadeh H, Mohtashami E, Modaresi SMS, Hosseini A, Sabri H, et al. Quercetin: a promising phytochemical for the treatment of glioblastoma multiforme. Biofactors. (2019) 46:356–66. doi: 10.1002/biof.1605
94. da Silva AB, Cerqueira Coelho PL, das Neves Oliveira M, Oliveira JL, Oliveira Amparo JA, da Silva KC, et al. The flavonoid rutin and its aglycone quercetin modulate the microglia inflammatory profile improving antiglioma activity. Brain Behav Immun. (2020) 85:170–85. doi: 10.1016/j.bbi.2019.05.003
95. McKenzie BA, Zemp FJ, Pisklakova A, Narendran A, McFadden G, Lun X, et al. In vitro screen of a small molecule inhibitor drug library identifies multiple compounds that synergize with oncolytic myxoma virus against human brain tumor-initiating cells. Neuro Oncol. (2015) 17:1086–94. doi: 10.1093/neuonc/nou359
96. Tuettenberg J, Grobholz R, Korn T, Wenz F, Erber R, Vajkoczy P. Continuous low-dose chemotherapy plus inhibition of cyclooxygenase-2 as an antiangiogenic therapy of glioblastoma multiforme. J Cancer Res Clin Oncol. (2005) 131:31–40. doi: 10.1007/s00432-004-0620-5
97. Torres A, Arriagada V, Erices JI, Toro MLA, Rocha JD, Niechi I, et al. FK506 Attenuates the MRP1-mediated chemoresistant phenotype in glioblastoma stem-like cells. Int J Mol Sci. (2018) 19:2697. doi: 10.3390/ijms19092697
98. Shipman L. Glioma: Repurposed drugs combined to amplify autophagy. Nat Rev Cancer. (2015) 15:636. doi: 10.1038/nrc4033
99. Shchors K, Massaras A, Hanahan D. Dual targeting of the autophagic regulatory circuitry in gliomas with repurposed drugs elicits cell-lethal autophagy and therapeutic benefit. Cancer Cell. (2015) 28:456–71. doi: 10.1016/j.ccell.2015.08.012
100. Pastorino O, Gentile MT, Mancini A, Del Gaudio N, Di Costanzo A, Bajetto A, et al. Histone deacetylase inhibitors impair vasculogenic mimicry from glioblastoma cells. Cancers. (2019) 11:747. doi: 10.3390/cancers11060747
101. Tilson SG, Haley EM, Triantafillu UL, Dozier DA, Langford CP, Gillespie GY, et al. ROCK inhibition facilitates in vitro expansion of glioblastoma stem-like cells. PLoS ONE. (2015) 10:e0132823. doi: 10.1371/journal.pone.0132823
102. Zohrabian VM, Forzani B, Chau Z, Murali R, Jhanwar-Uniyal M. Rho/ROCK and MAPK signaling pathways are involved in glioblastoma cell migration and proliferation. Anticancer Res. (2009) 29:119–23.
103. Salhia B, Rutten F, Nakada M, Beaudry C, Berens M, Kwan A, et al. Inhibition of Rho-kinase affects astrocytoma morphology, motility, and invasion through activation of Rac1. Cancer Res. (2005) 65:8792–800. doi: 10.1158/0008-5472.CAN-05-0160
104. Higgins SC, Pilkington GJ. The in vitro effects of tricyclic drugs and dexamethasone on cellular respiration of malignant glioma. Anticancer Res. (2010) 30:391–7.
105. Leite DM, Zvar Baskovic B, Civita P, Neto C, Gumbleton M, Pilkington GJ. A human co-culture cell model incorporating microglia supports glioblastoma growth and migration, and confers resistance to cytotoxics. FASEB J. (2020) 34:1710–27. doi: 10.1096/fj.201901858RR
106. Civita P, Leite DM, Pilkington GJ. Pre-clinical drug testing in 2D and 3D human in vitro models of glioblastoma incorporating non-neoplastic astrocytes: tunneling nano tubules and mitochondrial transfer modulates cell behavior and therapeutic respons. Int J Mol Sci. (2019) 20:6017. doi: 10.3390/ijms20236017
107. Beaney RP, Gullan RW, Pilkington GJ. Therapeutic potential of antidepressants in malignant glioma: clinical experience with clomipramine. J Clin Oncol. (2005) 23(Suppl. 16):1535. doi: 10.1200/jco.2005.23.16_suppl.1535
108. Pilkington GJ, Parker K, Murray SA. Approaches to mitochondrially mediated cancer therapy. Semin Cancer Biol. (2008) 18:226–35. doi: 10.1016/j.semcancer.2007.12.006
109. Parker KA, Pilkington GJ. Apoptosis of human malignant glioma-derived cell cultures treated with clomipramine hydrochloride, as detected by Annexin-V assay. Radiology Oncology. (2006) 40.
110. Pilkington GJ, Akinwunmi J, Amar S. The role of tricyclic drugs in selective triggering of mitochondrially-mediated apoptosis in neoplastic glia: a therapeutic option in malignant glioma? Radiol Oncol. (2006) 40:73–85.
111. Howarth A, Madureira PA, Lockwood G, Storer LCD, Grundy R, Rahman R, et al. Modulating autophagy as a therapeutic strategy for the treatment of paediatric high-grade glioma. Brain Pathol. (2019) 29:707–25. doi: 10.1111/bpa.12729
112. Daley E, Wilkie D, Loesch A, Hargreaves IP, Kendall DA, Pilkington GJ, et al. Chlorimipramine: a novel anticancer agent with a mitochondrial target. Biochem Biophys Res Commun. (2005) 328:623–32. doi: 10.1016/j.bbrc.2005.01.028
Keywords: glioblastoma, metabolism, prognosis, signature, heterogeneity
Citation: He Z, Wang C, Xue H, Zhao R and Li G (2020) Identification of a Metabolism-Related Risk Signature Associated With Clinical Prognosis in Glioblastoma Using Integrated Bioinformatic Analysis. Front. Oncol. 10:1631. doi: 10.3389/fonc.2020.01631
Received: 26 May 2020; Accepted: 27 July 2020;
Published: 03 September 2020.
Edited by:
Chris Albanese, Georgetown University, United StatesReviewed by:
Prospero Civita, Brain Tumor Research Center, United KingdomCopyright © 2020 He, Wang, Xue, Zhao and Li. This is an open-access article distributed under the terms of the Creative Commons Attribution License (CC BY). The use, distribution or reproduction in other forums is permitted, provided the original author(s) and the copyright owner(s) are credited and that the original publication in this journal is cited, in accordance with accepted academic practice. No use, distribution or reproduction is permitted which does not comply with these terms.
*Correspondence: Gang Li, ZHIubGlnYW5nQHNkdS5lZHUuY24=
†These authors have contributed equally to this work
Disclaimer: All claims expressed in this article are solely those of the authors and do not necessarily represent those of their affiliated organizations, or those of the publisher, the editors and the reviewers. Any product that may be evaluated in this article or claim that may be made by its manufacturer is not guaranteed or endorsed by the publisher.
Research integrity at Frontiers
Learn more about the work of our research integrity team to safeguard the quality of each article we publish.