 Meng Xu1†
 Shiqi Gong2†
 Yue Li1†Jun Zhou3,4Junhua Du3,4Cheng Yang3,4Mingwei Yang1Fan Zhang1
 Chaozhao Liang3,4*
 Zhuting Tong1*
- 1Department of Radiation Oncology, The First Affiliated Hospital, Anhui Medical University, Hefei, China
- 2Department of Otolaryngology, Ruijin Hospital, School of Medicine, Shanghai Jiaotong University, Shanghai, China
- 3Department of Urology, The First Affiliated Hospital, Anhui Medical University, Hefei, China
- 4Institute of Urology, Anhui Medical University, Heifei, China
Although radiotherapy is greatly successful in the treatment of prostate cancer (PCa), radioresistance is still a major challenge in the treatment. To our knowledge, this study is the first to screen long non-coding RNAs (lncRNAs) associated with radioresponse in PCa by The Cancer Genome Atlas (TCGA). Bioinformatics methods were used to identify the differentially expressed lncRNAs and protein-coding genes (PCGs) between complete response (CR) and non-complete response (non-CR) groups in radiotherapy. Statistical methods were applied to identify the correlation between lncRNAs and radioresponse as well as lncRNAs and PCGs. The correlation between PCGs and radioresponse was analyzed using weighted gene co-expression network analysis (WGCNA). The three online databases were used to predict the potential target miRNAs of lncRNAs and the miRNAs that might regulate PCGs. RT-qPCR was utilized to detect the expression of lncRNAs and PCGs in our PCa patients. A total of 65 differentially expressed lncRNAs and 468 differentially expressed PCGs were found between the two groups of PCa. After the chi-square test, LINC01600 was selected to be highly correlated with radioresponse from the 65 differentially expressed lncRNAs. Pearson correlation analysis found 558 PCGs co-expressed with LINC01600. WGCNA identified the darkred module associated with radioresponse in PCa. After taking the intersection of the darkred module of WGCNA, differentially expressed PCGs between the two groups of PCa, and the PCGs co-expressed with LINC01600, three PCGs, that is, JUND, ZFP36, and ATF3 were identified as the potential target PCGs of LINC01600. More importantly, we detected the expression of LINC01600 and three PCGs using our PCa patients, and finally verified that LINC01600 and JUND were differentially expressed between CR and non-CR groups, excluding ZFP36 and ATF3. Meantime, the potential regulation ability of LINC01600 for JUND in PCa cell lines was initially explored. In addition, we constructed the competing endogenous RNA (ceRNA) network of LINC01600—miRNA—JUND. In conclusion, we initially reveal the association of LINC01600 with radioresponse in PCa and identify its potential target PCGs for further basic and clinical research.
Introduction
Prostate cancer (PCa) is one of the common malignant tumors and the second leading cause of cancer-related death in men (1, 2). Radiotherapy is considered as a standard treatment for primary and advanced PCa. However, 20–40% of high-risk PCa patients experience tumor recurrence or distant metastases with one of the causes is radioresistance (3–5). It has been reported that radioresistance cell reduces the production of reactive oxygen species [ROS; (6)], increases the activation of DNA repair (7), and demonstrates high migratory and invasive abilities (8). However, there are no effective biomarkers to predict radioresponse in PCa patients and the molecular mechanisms underlying radioresistance in PCa have not been clearly elucidated. Thus, it is necessary to find novel biomarkers for predicting radioresponse of PCa patients and elucidate the biological mechanisms of radioresistance of PCa in order to provide new strategies for the personalized treatment of PCa patients.
Long non-coding RNAs (lncRNAs) are a group of RNAs longer than 200 nucleotides, which have many structural features of the mRNAs (9, 10). Current studies indicate that lncRNAs are involved in proliferation, apoptosis, migration, and metastasis (11, 12). Increasing evidence has revealed that lncRNAs are implicated in PCa radioresistance (13), metastatic progression (14), and prognosis (15). However, most previous studies focus on a single lncRNA based on small sample sizes (16–18). Therefore, it is greatly important to explore the correlation between lncRNAs and PCa radioresponse based on large sample high-throughput transcriptome sequencing data.
This study screened the lncRNAs associated with radioresponse in PCa by The Cancer Genome Atlas (TCGA), which is a large comprehensive database including clinical data and transcriptome sequencing data. Differential expression analysis and chi-square test were used to identify lncRNAs associated with radioresponse. Pearson correlation analysis, differential expression analysis, and weighted gene co-expression network analysis (WGCNA) were used to identify the potential target protein-coding genes (PCGs) of lncRNAs. WGCNA is a system biology method that is increasingly used in molecular oncology to cluster highly related genes into modules (19, 20). It is successfully used to explore the association between gene expression and clinical characteristics and to identify candidate biomarkers (21). More importantly, we verified the differential expression of LINC01600 and JUND between complete response (CR) group and non-complete response (non-CR) group using our collected PCa patients, and initially explored the potential regulation ability of LINC01600 for JUND in PCa cell lines. In addition, we constructed a competing endogenous RNA (ceRNA) network of lncRNA—microRNA (miRNA)—PCG using three online databases.
To our knowledge, this study is the first to screen lncRNAs associated with radioresponse in PCa by large sample high-throughput transcriptome sequencing data. We initially reveal the association of LINC01600 with radioresponse in PCa and identify its potential target PCGs for further basic and clinical research.
Materials and Methods
Patients Selection, lncRNAs and PCGs Screening
The transcriptome sequencing data and clinical data were collected from TCGA database (https://cancergenome.nih.gov/). LncRNAs and PCGs were isolated from transcriptome sequencing data. A total of 500 PCa patients were found in TCGA database. We selected 31 PCa patients with complete data for this study. Based on the radioresponse, 31 patients were categorized into CR group (n = 15) and non-CR group (n = 16) which contained partial response, stable disease, and progressive disease. Their clinical characteristics were shown in Supplementary Table 1.
With normalized data, the differential expression of lncRNAs and PCGs between CR group and non-CR group was analyzed using the edgeR package in R software. The fold change (FC) and false discovery rate (FDR) for each lncRNA and PCG were calculated. The cut-off criteria was logFC > 1 and FDR < 0.05.
To validate the bioinformatics analysis results, we further collected the tumor tissues and clinical characteristics of 40 PCa patients who received radiotherapy from the First Affiliated Hospital, Anhui Medical University, which were categorized into CR group (n = 20) and non-CR group (n = 20) according to their radioresponse. Their clinical characteristics were shown in Supplementary Table 1. All of human studies in our study were in accordance with Declaration of Helsinki and the guidelines of the Committee for Ethical Review of Research at the First Affiliated Hospital, Anhui Medical University.
Transcriptome Sequencing Data Processing
PCG-seq data was isolated from transcriptome sequencing data. A total of 17,964 PCGs were identified for each sample. The variance analysis was performed, and it was ranked from large to small. The top 25% of the PCGs (4,491 PCGs) with larger variance were selected for WGCNA analysis.
Weighted Gene Co-expression Network Construction
The expression profile of these 4,491 PCGs was constructed to a gene co-expression network using the WGCNA package in R software (21). The weighted co-expression relationship among all dataset subjects in an adjacency matrix was assessed by the Pearson correlation. In this study, the soft threshold was set as β = 9 (scale-free R2 = 0.93) to ensure a scale-free network. The adjacency matrix was used to calculate the topological overlap measurement (TOM) representing the overlap in the shared neighbors to further identify functional modules in the co-expression network with these 4491 PCGs (22).
Identification of Clinical Significant Modules
We performed principal component analysis (PCA) of all PCGs in each module, and defined the value of principal component one as module eigengenes (MEs). MEs were deemed to be representative of gene expression profiles in the module. Next, we performed a correlation analysis between the MEs of each PCG module and the clinical characteristics of PCa patients to identify the clinical significant module.
Function and Pathway Enrichment Analysis
Gene Ontology (GO) and Kyoto Encyclopedia of Genes and Genomes (KEGG) pathway enrichment analysis of PCGs co-expressed with LINC01600 were performed using Database for Annotation, Visualization, and Integrated Discovery (DAVID) [(23); version 6.8; https://david.ncifcrf.gov/] online functional annotation tool. GO analysis includes three categories: biological processes (BP), cellular components (CC), and molecular functions (MF). Enriched GO terms and KEGG pathways were determined based on the cut-off criteria of adjusted P < 0.05.
Cells, Reagents, and Transfection
The human PCa cell lines including PC-3 and DU145 were purchased from Shanghai Institutes for Biological Sciences, Chinese Academy of Sciences (Shanghai, China), and all cells were cultured in Dulbecco's Modified Eagle's Medium (DMEM) supplemented with 10% fetal bovine serum (FBS) at 37 °C with 5% CO2 in a humidified incubator. Small interfering RNA (siRNA) for LINC01600 was designed and synthesized by GenePharma (Shanghai, China). The si-LINC01600 sequence was shown in Supplementary Table 2. Cells were cultured in six-well-plates until 70% confluent, and then transfected with siRNA using Lipofectamine 2000 (Invitrogen) according to the manufacturer's protocol. After incubating the cells for 48 h at 37°C in a humidified chamber supplemented with 5% CO2, the cells were harvested for RT-qPCR.
Reverse Transcription-Quantitative Polymerase Chain Reaction (RT-qPCR)
Total RNA was isolated from PCa tissues using TRIzol reagent (Invitrogen, California, USA). The cDNA was synthesized using HiScript III RT SuperMix for qPCR Kit (Vazyme Biotech, Nanjing, China), according to the manufacturer's protocol at 37°C for 15 min and 85°C for 5 s. The cDNA was subsequently analyzed using ChamQ Universal SYBR qPCR Master Mix (Vazyme Biotech, Nanjing, China) and the ABI7500 system (Applied Biosystems, Foster City, USA). The amplification program was as follows: Initial denaturation step at 95°C for 30 s, followed by 40 cycles at 95°C for 10 s, 60°C for 30 s. The expression of LINC01600, JUND, ZFP36, and ATF3 was calculated relative to the internal reference gene, GAPDH, using the 2−ΔΔCt method (24). The primer sequences were shown in Supplementary Table 2.
Competing Endogenous RNA Network Construction
The potential target miRNAs of lncRNAs were predicted by miRcode (25) (http://www.mircode.org/) online database. The miRNAs that might regulate PCGs were predicted by TargetScan (26) (http://www.targetscan.org/vert_72/) and DIANA [(27) diana.imis.athena-innovation.gr/DianaTools/index.php] online databases. Venn diagram was used to confirm overlapping miRNAs. Cytoscape software (version 3.6.1; https://cytoscape.org/) was used to visual the ceRNA network.
Statistical Analysis
Statistical analysis was constructed by SPSS (version 24.0) and R software (version 3.4.2; https://www.r-project.org/). Pearson correlation analysis was used to identify the PCGs co-expressed with lncRNAs. The chi-square test was used to identify the correlation between lncRNAs and radioresponse. P < 0.05 was considered statistically significant.
Results
Differentially Expressed lncRNAs and PCGs
According to the cut-off criteria (logFC > 1, FDR < 0.05), 65 differentially expressed lncRNAs (Supplementary Table 3) and 468 differentially expressed PCGs (Supplementary Table 4) were identified between CR group and non-CR group. LINC01600 (logFC = 1.0046, FDR = 0.0155) and JUND (logFC = 1.0210, FDR = 0.0002) were upregulated in non-CR group.
Identification of lncRNAs Associated With Radioresponse
To further identify lncRNAs which were highly correlated with radioresponse from 65 differentially expressed lncRNAs, we performed the chi-square test. According to the median value, the expression of lncRNAs was divided into low and high expression. LINC00919 and LINC02010 were excluded because more than half of the cases did not detect their expression. LINC01600 (P = 0.004), LINC01060 (P = 0.012), MIR137HG (P = 0.032), LINC02006 (P = 0.032), and LINC02531 (P = 0.032) were identified as highly correlated with radioresponse (Table 1 and Supplementary Table 5). We chose LINC01600 with the lowest P-value for subsequent analysis.
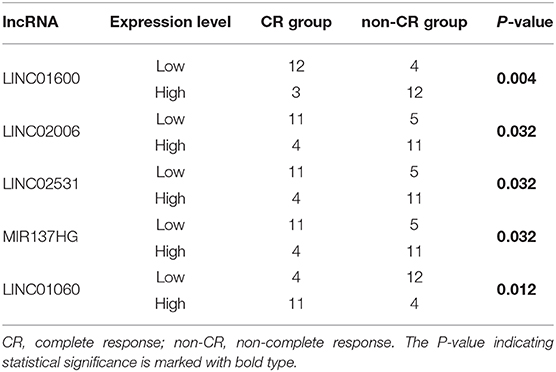
Table 1. Chi-square test between lncRNA expression and radioresponse.
Weighted Gene Co-expression Network Construction and Key Modules Identification
To identify PCGs associated with radioresponse in PCa, we performed a WGCNA analysis. The samples of 31 PCa patients receiving radiotherapy were clustered using average linkage method and Pearson correlation analysis. We excluded 2 outlier samples and finally included 29 samples for subsequent analysis (Figures 1A,B). Next, we performed a network topology analysis of various soft-thresholding powers to have relatively balanced scale independence and average connectivity of WGCNA. In our study, the power of β = 9 (scale free R2 = 0.93) was selected as the soft-thresholding parameter to make sure a scale-free network (Figures 1C–E).
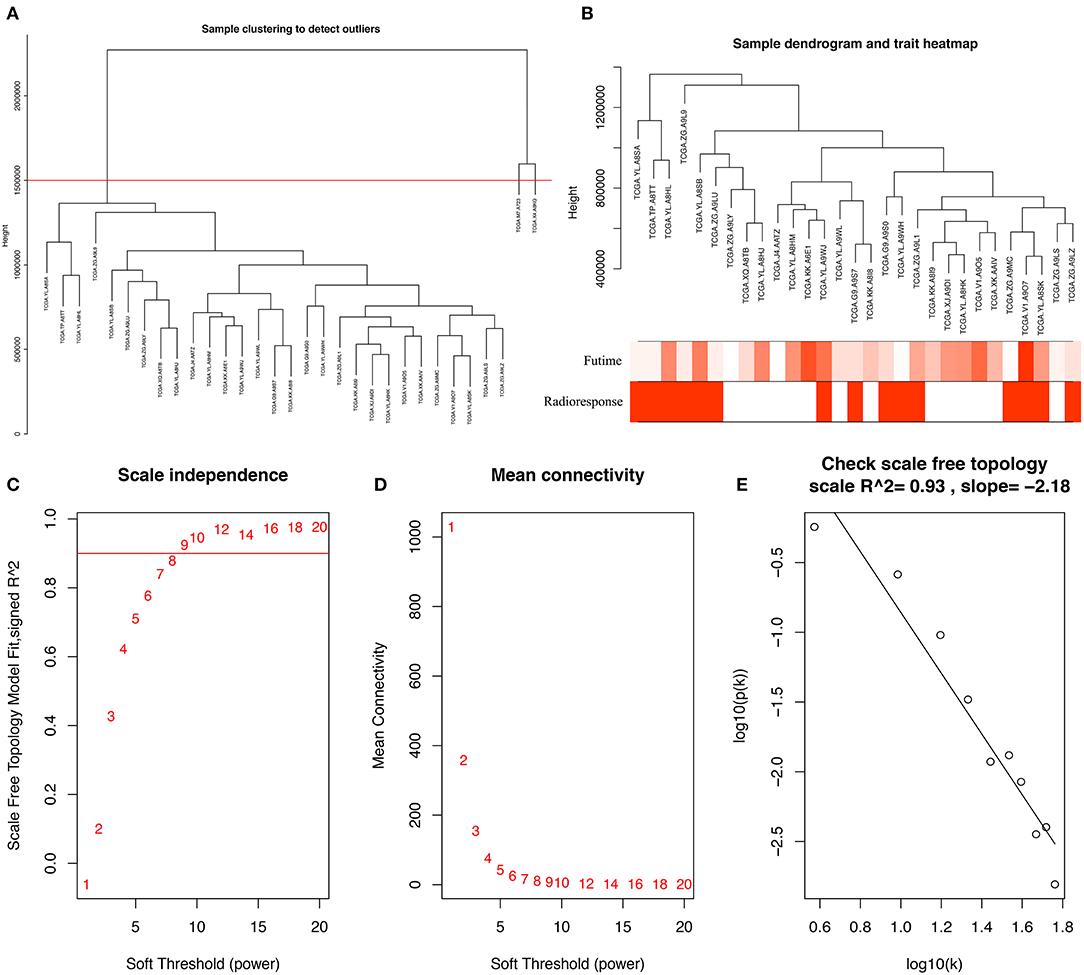
Figure 1. (A) Clustering dendrogram of 31 samples, and excluding two outlier sample. (B) Clustering dendrogram of 29 samples corresponding to clinical characteristics. (C) Analysis of the scale-free fit index for various soft-thresholding powers (β). (D) Analysis of the mean connectivity for various soft-thresholding powers. (E) Checking the scale-free topology when β = 9.
A total of 22 PCG modules were generated in a hierarchical clustering tree through dynamic tree cut and merged dynamics. After merging modules with dissimilarity less than 25%, 20 distinct PCG modules were identified (Figures 2A,B). Correlation analysis was performed between the MEs of each PCG module and radiotherapy outcome. According to P < 0.05 of correlation analysis, the darkred module (Cor = 0.37, P = 0.04) was identified as the PCG module highly correlated with radioresponse (Figure 2C). Subsequently, we calculated the gene significance for radioresponse and the module membership in darkred module. The scatter plot (Cor = 0.34, P = 0.018) further validated the high correlation between the darkred module and radioresponse (Figure 3). The list of PCGs for the darkred module (n = 48) was shown in Supplementary Table 6.
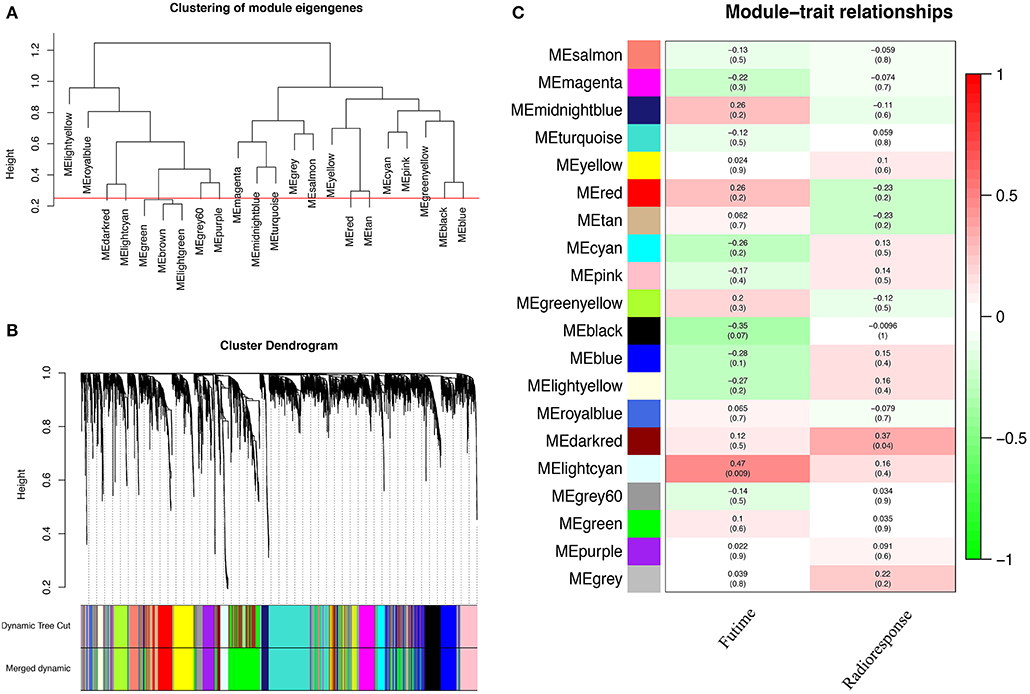
Figure 2. Identification of PCG modules associated with the radioresponse of PCa. (A) The horizontal line defines the threshold, so 20 distinct PCG modules are identified. (B) The dendrogram of all genes is clustered based on a dissimilarity measure (1-TOM). (C) The heatmap shows the correlation between MEs and the radioresponse of PCa. Red represents a positive correlation between PCG modules and clinical characteristics, and green represents a negative correlation between PCG modules and clinical characteristics.
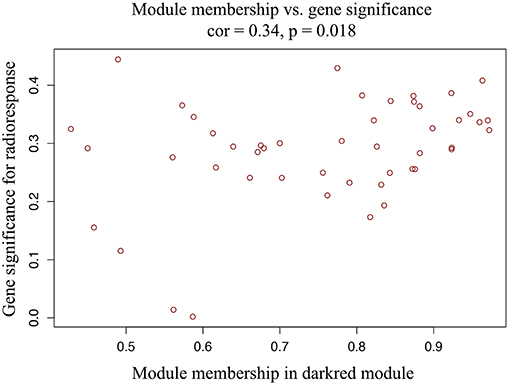
Figure 3. The scatter plot shows the correlation between gene significance for radioresponse and module membership in darkred module (Cor = 0.34, P = 0.018).
Identifying the Potential Target PCGs for LINC01600
In order to screen the potential target PCGs for LINC01600, we performed Pearson correlation analysis between LINC01600 and 17964 PCGs. According to the cut-off criteria of | Pearson correlation coefficient | > 0.4 and P < 0.05, a total of 558 PCGs co-expressed with LINC01600 were screened (Supplementary Table 7).
After taking the intersection of the 558 PCGs co-expressed with LINC01600, the 48 PCGs in the drakred module obtained by WGCNA, and the 468 differentially expressed PCGs between CR group and non-CR group, we obtained the potential target PCGs of LINC01600, that is, JUND, ZFP36, and ATF3 (Figure 4).
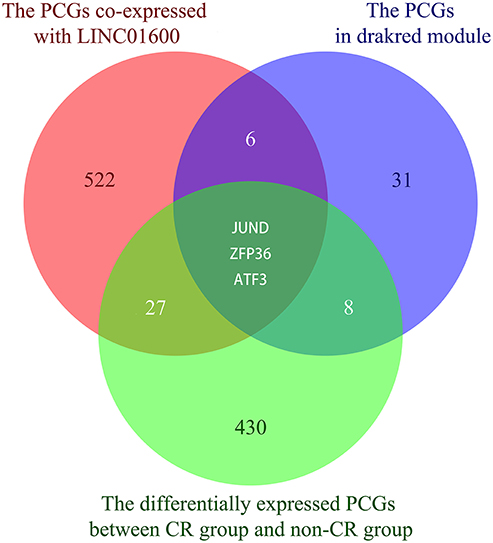
Figure 4. The Venn diagram shows the intersection of the 558 PCGs co-expressed with LINC01600, the 48 PCGs in the drakred module obtained by WGCNA, and the 468 differentially expressed PCGs between CR group and non-CR group.
GO and KEGG Pathway Enrichment Analysis
We performed GO enrichment analysis on 558 PCGs co-expressed with LINC01600. The PCGs in BP group were mainly enriched in transcription, regulation of cell cycle, miRNA metabolic process, double-stand break repair via homologous recombination, DNA replication, and DNA repair. The PCGs in CC group were mainly enriched in trans-Golgi network, small subunit processome, nucleolus, nuclear chromosome, telemetric region, cytoplasm, and chromosome. The PCGs in MF group were mainly enriched in RNA binding, nucleic acid binding, double-stranded RNA binding, DNA binding, damaged DNA binding, and 3–5 exonuclease activity. KEGG pathway analysis revealed that these PCGs were mainly involved in RNA transport, ribosome biogenesis in eukaryotes, pyrimidine metabolism, homologous recombination, DNA replication, and cell cycle (Figure 5). These results indicated that the 558 PCGs co-expressed with LINC01600 were involved in various biological processes such as DNA damage repair, metabolism, cell cycle, and so on, which might be related to cell radioresponse.
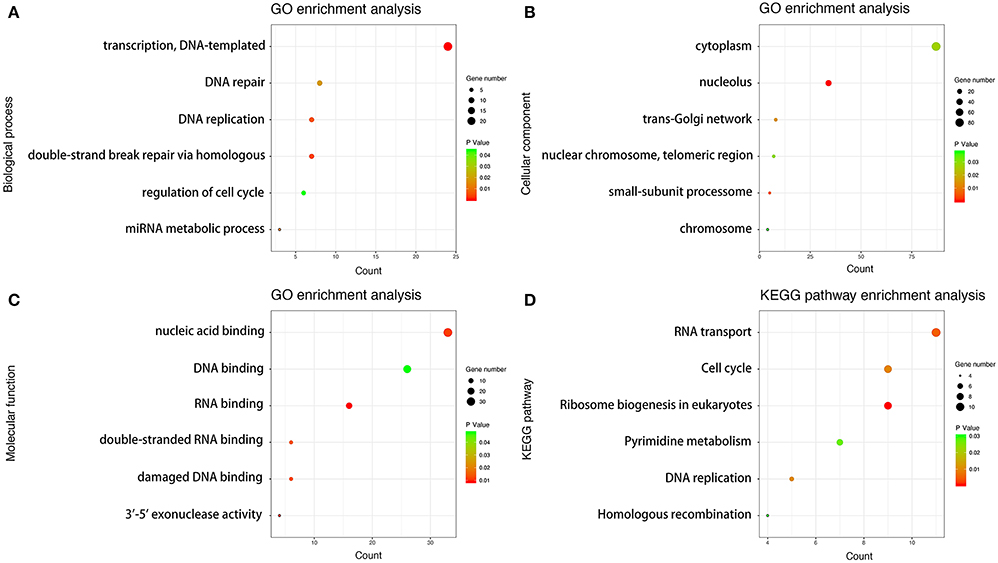
Figure 5. GO and KEGG pathway enrichment analysis. (A) Biological process analysis. (B) Cellular component analysis. (C) Molecular function analysis. (D) KEGG pathway analysis.
Verifying the Differential Expression of LINC01600 and JUND
RT-qPCR was used to detect the expression of LINC01600, JUND, ZFP36, and ATF3 in tumor tissues of 40 PCa patients collected in our hospital. The radioresponse of 40 PCa patients receiving radiotherapy included 20 CR and 20 non-CR. We found that LINC01600 and JUND were significantly upregulated in non-CR group compared with CR group (Figures 6A,B). However, there was no differential expression of ZFP36 and ATF3 between CR group and non-CR group (Figures 6C,D). These results initially verified that LINC01600 and JUND were associated with radioresponse in PCa. We chose JUND as the potential target PCGs of LINC01600 for subsequent analysis.
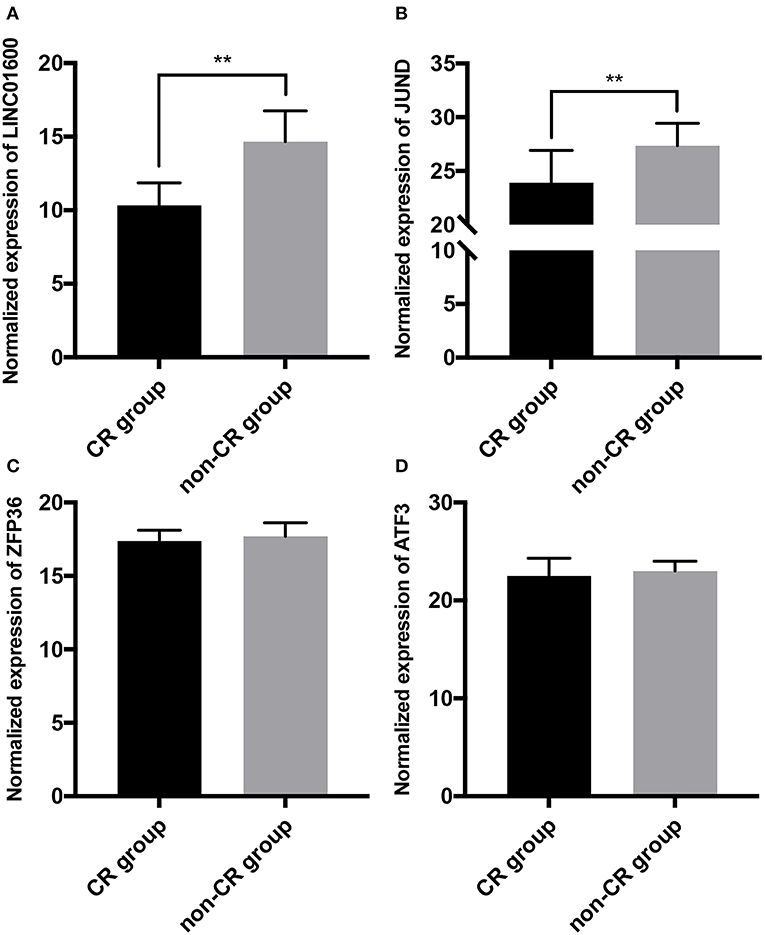
Figure 6. The expression of (A) LINC01600, (B) JUND, (C) ZFP36, and (D) ATF3 is detected by RT-qPCR in tumor tissues of 40 PCa patients collected in our hospital. LINC01600 and JUND are significantly upregulated in non-CR group compared with CR group. There is no differential expression of ZFP36 and ATF3 between CR group and non-CR group (**P < 0.01).
Preliminary Validation of the Target PCG of LINC01600
LINC01600 was downregulated by siRNA at two different sites in PCa cell line. The lncRNA expression of LINC01600 and the mRNA expression of JUND were detected by RT-qPCR. The results showed that after downregulating LINC01600 by si-LINC01600_1 and si-LINC01600_2, the mRNA expression of JUND was also downregulated (Figure 7). In summary, LINC01600 may regulate JUND.
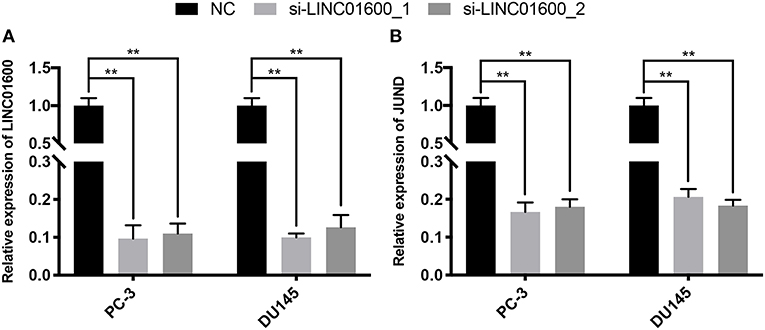
Figure 7. The expression of LINC01600 and JUND in PC-3 and DU145 cell lines is detected by RT-qPCR. After downregulating (A) the expression of LINC01600 by si-LINC01600_1 and si-LINC01600_2, respectively and (B) the mRNA expression of JUND is also downregulated (**P < 0.01).
The Network of ceRNA Construction
To further explore the potential mechanisms of LINC01600, we constructed a ceRNA network of LINC01600—miRNAs—JUND. The miRcode database was used to predict the potential target miRNAs of LINC01600. The TargetScan and DIANA databases were used to predict the miRNAs that might regulate JUND. After taking the intersection of the above two results, four miRNAs, that is, miR-206, miR-490-3p, miR-216b-5p, and miR-613, were screened for constructing the ceRNA network (Figure 8).
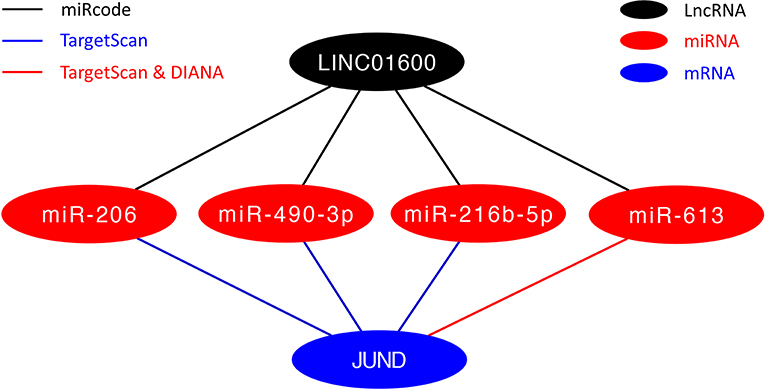
Figure 8. The ceRNA network of LINC01600—miRNAs—JUND.
Discussion
In recent years, the incidence of PCa is significantly increased, although radiotherapy has achieved great success in the treatment of advanced PCa, ~10–45% of PCa is resistant to irradiation. Therefore, it is extremely important to find novel biomarkers that can predict radioresponse, so as to find new therapeutic targets and develop new modalities of the treatment. Increasing evidence has indicated that lncRNAs play important roles in cancer pathologies, prognosis, and therapeutic options. Several previous studies have illustrated that some lncRNAs associated with radiosensitivity in PCa, which are GAS5 (17), UCA1 (28), and HULC (13). However, the above three studies examine the expression of the lncRNAs by RT-qPCR in different PCa cell lines only. The relationship between the expression of lncRNAs in PCa patients and radioresponse is still unclear. To our knowledge, this study is the first to employ large sample high-throughput transcriptome sequencing data and clinical data from TCGA database to screen lncRNA associated with radioresponse in PCa and to explore its potential biological mechanisms.
Through the analysis of the TCGA datasets, a total of 65 differentially expressed lncRNAs and 468 differentially expressed PCGs were found between CR group and non-CR group in radioresponse of PCa. LINC01600 (logFC = 1.0046, FDR = 0.0155) and JUND (logFC = 1.0210, FDR = 0.0002) were upregulated in non-CR group compared with CR group. After chi-square test, five lncRNAs were selected to be highly correlated with radioresponse from the 65 differentially expressed lncRNAs. We chose LINC01600 with the lowest P-value for subsequent analysis. The previous study indicates that LINC01600 is upregulated in lung adenocarcinoma (LUAD) and its promoter and enhancer show increased activity in luciferase reporter assays. The patients with high expression of LINC01600 in LUAD have poor prognoses (29). This indicates that LINC01600 is a carcinogenic lncRNA.
We further explore the potential target PCGs of LINC01600. Pearson correlation analysis found 558 PCGs co-expressed with LINC01600. GO and KEGG enrichment analysis results showed that the 558 PCGs co-expressed with LINC01600 were involved in various biological processes such as DNA damage repair, metabolism, cell cycle, and so on. Many studies have shown that DNA damage repair, metabolism, and cell cycle are highly correlated with radiosensitivity (30–34). This further indicates that LINC01600 and the PCGs co-expressed with it are associated with radioresponse. WGCNA identified the darkred module associated with radioresponse in PCa. After taking the intersection of the 558 PCGs co-expressed with LINC01600, the 48 PCGs in the drakred module obtained by WGCNA, and the 468 differentially expressed PCGs between CR group and non-CR group, 3 PCGs were identified as the potential target PCGs of LINC01600. More importantly, the RT-qPCR results of our collected PCa patients showed that LINC01600 and JUND were highly expressed in non-CR group compared with CR group in radioresponse. After downregulating LINC01600 in PCa cell lines, the mRNA expression of JUND was also downregulated, which indicates that LINC01600 may regulate JUND.
Studies have shown that the expression of JUND is positively correlated with tumor cell proliferation in diffuse large B-cell lymphomas (35). JUND accelerates tumor cell growth, inhibits apoptosis and enhances invasion in non-small cell lung cancer (36). Selective knockdown of JUND expression using siRNA in DU145 and PC3 cells results in significant reduction in cell proliferation, and forced overexpression of JUND increases the proliferation rate in PCa (37). Meanwhile, JUND contributes to escape from programmed cell death and confer radio-resistance of prostate cancer (PCa) cells (38). These results indicate that JUND is an oncogene and it enhances the proliferation capacity and confers radio-resistance of PCa cells. In our study, LINC01600 is identified as an upstream regulator of JUND, which may be involved in the regulation of radioresponse in PCa.
To further explore the potential biological mechanisms of LINC01600, we constructed a ceRNA network of LINC01600—miRNAs—JUND using three online databases, that is, miRcode, TargetScan, and DIANA. After taking the intersection of the potential target miRNAs of LINC01600 and the miRNAs that might regulate JUND, 4 miRNAs, that is, miR-206, miR-490-3p, miR-216b-5p, and miR-613, were screened to construct the ceRNA network. Studies have shown that miR-206 inhibits proliferation and migration of PCa cells by targeting CXCL11 (39). MiR-490-3p inhibits the growth and invasiveness in triple-negative breast cancer by repressing the expression of TNKS2 (40). Overexpression of LINC00518 contributes to the paclitaxel resistance in PCa via sequestering miR-216b-5p (41). MiR-613 inhibits bladder cancer proliferation and migration through targeting SphK1 (42). These results indicate that miR-206, miR-490-3p, miR-216b-5p, and miR-613 are tumor suppressors.
In summary, our study initially reveals the association of LINC01600 with radioresponse in PCa and explores its potential biological mechanisms for further basic and clinical research.
Data Availability Statement
The datasets for this study can be found in the TCGA database https://cancergenome.nih.gov/.
Ethics Statement
This study was approved by the ethics committee of the First Affiliated Hospital of Anhui Medical University. All subjects gave written informed consent in accordance with the Declaration of Helsinki.
Author Contributions
MX is responsible for research design, data collection, statistical analysis, RT-qPCR experiments, and manuscript writing. SG and YL are responsible for research design, data collection, and bioinformatics analysis. JZ, JD, and CY are responsible for providing the PCa specimens. MY and FZ are responsible for data collection. CL and ZT guide research ideas, design, research methods, and manuscript revision.
Funding
This work is supported by the National Natural Science Foundation of China (81630019, 81870519, 81201743, and 81572431), the Postdoctoral Science Foundation Funded Project of Anhui Province (2015B053), and the Natural Science Foundation of Anhui Province (1908085QA27).
Conflict of Interest
The authors declare that the research was conducted in the absence of any commercial or financial relationships that could be construed as a potential conflict of interest.
Acknowledgments
We thank Dr. Shanshan Dan (New York University School of Medicine) for her valuable comments and extensive editing of the manuscript.
Supplementary Material
The Supplementary Material for this article can be found online at: https://www.frontiersin.org/articles/10.3389/fonc.2020.00498/full#supplementary-material
References
1. Siegel RL, Miller KD, Jemal A. Cancer statistics, 2019. CA Cancer J Clin. (2019) 69:7–34. doi: 10.3322/caac.21551
2. Lindenberg ML, Turkbey B, Mena E, Choyke PL. Imaging locally advanced, recurrent, and metastatic prostate cancer: a review. JAMA Oncol. (2017) 3:1415–22. doi: 10.1001/jamaoncol.2016.5840
3. Pahlajani N, Ruth KJ, Buyyounouski MK, Chen DY, Horwitz EM, Hanks GE, et al. Radiotherapy doses of 80 Gy and higher are associated with lower mortality in men with Gleason score 8 to 10 prostate cancer. Int J Radiat Oncol Biol Phys. (2012) 82:1949–56. doi: 10.1016/j.ijrobp.2011.04.005
4. Zelefsky MJ, Chan H, Hunt M, Yamada Y, Shippy AM, Amols H. Long-term outcome of high dose intensity modulated radiation therapy for patients with clinically localized prostate cancer. J Urol. (2006) 176(4 Pt 1):1415–9. doi: 10.1016/j.juro.2006.06.002
5. Li F, Zhou K, Gao L, Zhang B, Li W, Yan W, et al. Radiation induces the generation of cancer stem cells: a novel mechanism for cancer radioresistance. Oncol Lett. (2016) 12:3059–65. doi: 10.3892/ol.2016.5124
6. Kim JS, Chang JW, Yun HS, Yang KM, Hong EH, Kim DH, et al. Chloride intracellular channel 1 identified using proteomic analysis plays an important role in the radiosensitivity of HEp-2 cells via reactive oxygen species production. Proteomics. (2010) 10:2589–604. doi: 10.1002/pmic.200900523
7. Chin C, Bae JH, Kim MJ, Hwang JY, Kim SJ, Yoon MS, et al. Radiosensitization by targeting radioresistance-related genes with protein kinase A inhibitor in radioresistant cancer cells. Exp Mol Med. (2005) 37:608–18. doi: 10.1038/emm.2005.74
8. Jin Y, Xu K, Chen Q, Wang B, Pan J, Huang S, et al. Simvastatin inhibits the development of radioresistant esophageal cancer cells by increasing the radiosensitivity and reversing EMT process via the PTEN-PI3K/AKT pathway. Exp Cell Res. (2018) 362:362–9. doi: 10.1016/j.yexcr.2017.11.037
9. Gloss BS, Dinger ME. The specificity of long noncoding RNA expression. Biochim Biophys Acta. (2016) 1859:16–22. doi: 10.1016/j.bbagrm.2015.08.005
10. Heery R, Finn SP, Cuffe S, Gray SG. Long non-coding RNAs: key regulators of epithelial-mesenchymal transition, tumour drug resistance and cancer stem cells. Cancers (Basel). (2017) 9:E38. doi: 10.3390/cancers9040038
11. Ma C, Shi X, Zhu Q, Li Q, Liu Y, Yao Y, et al. The growth arrest-specific transcript 5 (GAS5): a pivotal tumor suppressor long noncoding RNA in human cancers. Tumour Biol. (2016) 37:1437–44. doi: 10.1007/s13277-015-4521-9
12. Ponting CP, Oliver PL, Reik W. Evolution and functions of long noncoding RNAs. Cell. (2009) 136:629–41. doi: 10.1016/j.cell.2009.02.006
13. Chen C, Wang K, Wang Q, Wang X. LncRNA HULC mediates radioresistance via autophagy in prostate cancer cells. Brazil J Med Biol Res. (2018) 51:e7080. doi: 10.1590/1414-431x20187080
14. Shen XH, Qi P, Du X. Long non-coding RNAs in cancer invasion and metastasis. Mod Pathol. (2015) 28:4–13. doi: 10.1038/modpathol.2014.75
15. Mehra R, Udager AM, Ahearn TU, Cao X, Feng FY, Loda M, et al. Overexpression of the long non-coding RNA SChLAP1 independently predicts lethal prostate cancer. Eur Urol. (2016) 70:549–52. doi: 10.1016/j.eururo.2015.12.003
16. Xu T, Liu CL, Li T, Zhang YH, Zhao YH. LncRNA TUG1 aggravates the progression of prostate cancer and predicts the poor prognosis. Eur Rev Med Pharmacol Sci. (2019) 23:4698–705.
17. Yang J, Hao T, Sun J, Wei P, Zhang H. Long noncoding RNA GAS5 modulates alpha-Solanine-induced radiosensitivity by negatively regulating miR-18a in human prostate cancer cells. Biomed Pharmacother. (2019) 112:108656. doi: 10.1016/j.biopha.2019.108656
18. Luo J, Wang K, Yeh S, Sun Y, Liang L, Xiao Y, et al. LncRNA-p21 alters the antiandrogen enzalutamide-induced prostate cancer neuroendocrine differentiation via modulating the EZH2/STAT3 signaling. Nat Commun. (2019) 10:2571. doi: 10.1038/s41467-019-09784-9
19. Clarke C, Madden SF, Doolan P, Aherne ST, Joyce H, O'Driscoll L, et al. Correlating transcriptional networks to breast cancer survival: a large-scale coexpression analysis. Carcinogenesis. (2013) 34:2300–8. doi: 10.1093/carcin/bgt208
20. Zhai X, Xue Q, Liu Q, Guo Y, Chen Z. Colon cancer recurrenceassociated genes revealed by WGCNA coexpression network analysis. Mol Med Rep. (2017) 16:6499–505. doi: 10.3892/mmr.2017.7412
21. Langfelder P, Horvath S. WGCNA: an R package for weighted correlation network analysis. BMC Bioinformatics. (2008) 9:559. doi: 10.1186/1471-2105-9-559
22. Gong SQ, Xu M, Xiang ML, Shan YM, Zhang H. The expression and effection of microRNA-499a in high-tobacco exposed head and neck squamous cell carcinoma: a bioinformatic analysis. Front Oncol. (2019) 9:678. doi: 10.3389/fonc.2019.00678
23. Huang da W, Sherman BT, Lempicki RA. Systematic and integrative analysis of large gene lists using DAVID bioinformatics resources. Nat Protoc. (2009) 4:44–57. doi: 10.1038/nprot.2008.211
24. Livak KJ, Schmittgen TD. Analysis of relative gene expression data using real-time quantitative PCR and the 2(-Delta Delta C(T)) Method. Methods. (2001) 25:402–8. doi: 10.1006/meth.2001.1262
25. Jeggari A, Marks DS, Larsson E. miRcode: a map of putative microRNA target sites in the long non-coding transcriptome. Bioinformatics. (2012) 28:2062–3. doi: 10.1093/bioinformatics/bts344
26. Agarwal V, Bell GW, Nam JW, Bartel DP. Predicting effective microRNA target sites in mammalian mRNAs. eLife. (2015) 4:e05005. doi: 10.7554/eLife.05005
27. Paraskevopoulou MD, Georgakilas G, Kostoulas N, Vlachos IS, Vergoulis T, Reczko M, et al. DIANA-microT web server v5.0: service integration into miRNA functional analysis workflows. Nucleic Acids Res. (2013) 41:W169–W73. doi: 10.1093/nar/gkt393
28. Fotouhi Ghiam A, Taeb S, Huang X, Huang V, Ray J, Scarcello S, et al. Long non-coding RNA urothelial carcinoma associated 1 (UCA1) mediates radiation response in prostate cancer. Oncotarget. (2017) 8:4668–89. doi: 10.18632/oncotarget.13576
29. Liu B, Chen Y, Yang J. LncRNAs are altered in lung squamous cell carcinoma and lung adenocarcinoma. Oncotarget. (2017) 8:24275–91. doi: 10.18632/oncotarget.13651
30. El Bezawy R, Tinelli S, Tortoreto M, Doldi V, Zuco V, Folini M, et al. miR-205 enhances radiation sensitivity of prostate cancer cells by impairing DNA damage repair through PKCepsilon and ZEB1 inhibition. J Exp Clin Cancer Res. (2019) 38:51. doi: 10.1186/s13046-019-1060-z
31. Qu YY, Hu SL, Xu XY, Wang RZ, Yu HY, Xu JY, et al. Nimotuzumab enhances the radiosensitivity of cancer cells in vitro by inhibiting radiation-induced DNA damage repair. PLoS ONE. (2013) 8:e70727. doi: 10.1371/journal.pone.0070727
32. Jiang Y, Liu Y, Hu H. Studies on DNA damage repair and precision radiotherapy for breast cancer. Adv Exp Med Biol. (2017) 1026:105–23. doi: 10.1007/978-981-10-6020-5_5
33. Chen Y, Li Z, Dong Z, Beebe J, Yang K, Fu L, et al. 14-3-3sigma contributes to radioresistance by regulating DNA repair and cell cycle via PARP1 and CHK2. Mol Cancer Res. (2017) 15:418–28. doi: 10.1158/1541-7786.MCR-16-0366
34. Zheng R, Liu Y, Zhang X, Zhao P, Deng Q. miRNA-200c enhances radiosensitivity of esophageal cancer by cell cycle arrest and targeting P21. Biomed Pharmacother. (2017) 90:517–23. doi: 10.1016/j.biopha.2017.04.006
35. Papoudou-Bai A, Goussia A, Batistatou A, Stefanou D, Malamou-Mitsi V, Kanavaros P. The expression levels of JunB, JunD and p-c-Jun are positively correlated with tumor cell proliferation in diffuse large B-cell lymphomas. Leuk Lymphoma. (2016) 57:143–50. doi: 10.3109/10428194.2015.1034704
36. Zhang Y, Xu X, Zhang M, Wang X, Bai X, Li H, et al. MicroRNA-663a is downregulated in non-small cell lung cancer and inhibits proliferation and invasion by targeting JunD. BMC Cancer. (2016) 16:315. doi: 10.1186/s12885-016-2350-x
37. Millena AC, Vo BT, Khan SA. JunD is required for proliferation of prostate cancer cells and plays a role in transforming growth factor-beta (TGF-beta)-induced inhibition of cell proliferation. J Biol Chem. (2016) 291:17964–76. doi: 10.1074/jbc.M116.714899
38. Zerbini LF, de Vasconcellos JF, Czibere A, Wang Y, Paccez JD, Gu X, et al. JunD-mediated repression of GADD45alpha and gamma regulates escape from cell death in prostate cancer. Cell Cycle. (2011) 10:2583–91. doi: 10.4161/cc.10.15.16057
39. Wang Y, Xu H, Si L, Li Q, Zhu X, Yu T, et al. MiR-206 inhibits proliferation and migration of prostate cancer cells by targeting CXCL11. Prostate. (2018) 78:479–90. doi: 10.1002/pros.23468
40. Jia Z, Liu Y, Gao Q, Han Y, Zhang G, Xu S, et al. miR-490-3p inhibits the growth and invasiveness in triple-negative breast cancer by repressing the expression of TNKS2. Gene. (2016) 593:41–7. doi: 10.1016/j.gene.2016.08.014
41. He J, Sun M, Geng H, Tian S. Long non-coding RNA Linc00518 promotes paclitaxel resistance of the human prostate cancer by sequestering miR-216b-5p. Biol Cell. (2019) 111:39–50. doi: 10.1111/boc.201800054
Keywords: long non-coding RNA, prostate cancer, radioresponse, bioinformatics analysis, WGCNA
Citation: Xu M, Gong S, Li Y, Zhou J, Du J, Yang C, Yang M, Zhang F, Liang C and Tong Z (2020) Identifying Long Non-coding RNA of Prostate Cancer Associated With Radioresponse by Comprehensive Bioinformatics Analysis. Front. Oncol. 10:498. doi: 10.3389/fonc.2020.00498
Received: 03 January 2020; Accepted: 19 March 2020;
Published: 07 April 2020.
Edited by:
Xiao Zhu, Guangdong Medical University, ChinaReviewed by:
Di Wang, Columbia University, United StatesJiong Li, Virginia Commonwealth University, United States
Copyright © 2020 Xu, Gong, Li, Zhou, Du, Yang, Yang, Zhang, Liang and Tong. This is an open-access article distributed under the terms of the Creative Commons Attribution License (CC BY). The use, distribution or reproduction in other forums is permitted, provided the original author(s) and the copyright owner(s) are credited and that the original publication in this journal is cited, in accordance with accepted academic practice. No use, distribution or reproduction is permitted which does not comply with these terms.
*Correspondence: Zhuting Tong, emh1dGluZ190b25nJiN4MDAwNDA7YWhtdS5lZHUuY24=; Chaozhao Liang, bGlhbmdfY2hhb3poYW8mI3gwMDA0MDthaG11LmVkdS5jbg==
†These authors have contributed equally to this work