- 1Department of Molecular Physiology and Biophysics, Roy J. and Lucille A. Carver College of Medicine, The University of Iowa, Iowa City, IA, United States
- 2Department of Anatomy and Cell Biology, Carver College of Medicine, University of Iowa, Iowa City, IA, United States
- 3Department of Biology, College of Liberal Arts and Sciences, University of Iowa, Iowa City, IA, United States
- 4Carver College of Medicine, University of Iowa, Iowa City, IA, United States
- 5Viral Vector Core Facility, Carver College of Medicine, University of Iowa, Iowa City, IA, United States
- 6Department of Internal Medicine, Carver College of Medicine, University of Iowa, Iowa City, IA, United States
- 7Holden Comprehensive Cancer Center, University of Iowa, Iowa City, IA, United States
- 8Department of Radiation Oncology, Roy J. and Lucille A. Carver College of Medicine, The University of Iowa, Iowa City, IA, United States
- 9Department of Pathology, Roy J. and Lucille A. Carver College of Medicine, The University of Iowa, Iowa City, IA, United States
- 10Department of Urology, Roy J. and Lucille A. Carver College of Medicine, The University of Iowa, Iowa City, IA, United States
Patients with malignant melanoma have a 5-year survival rate of only 15–20% once the tumor has metastasized to distant tissues. While MAP kinase pathway inhibitors (MAPKi) are initially effective for the majority of patients with melanoma harboring BRAFV600E mutation, over 90% of patients relapse within 2 years. Thus, there is a critical need for understanding MAPKi resistance mechanisms. In this manuscript, we performed a forward genetic screen using a whole genome shRNA library to identify negative regulators of vemurafenib resistance. We identified loss of NF1 and CUL3 as drivers of vemurafenib resistance. NF1 is a known driver of vemurafenib resistance in melanoma through its action as a negative regulator of RAS. However, the mechanism by which CUL3, a key protein in E3 ubiquitin ligase complexes, is involved in vemurafenib resistance was unknown. We found that loss of CUL3 was associated with an increase in RAC1 activity and MEKS298 phosphorylation. However, the addition of the Src family inhibitor saracatinib prevented resistance to vemurafenib in CUL3KD cells and reversed RAC1 activation. This finding suggests that inhibition of the Src family suppresses MAPKi resistance in CUL3KD cells by inactivation of RAC1. Our results also indicated that the loss of CUL3 does not promote the activation of RAC1 through stabilization, suggesting that CUL3 is involved in the stability of upstream regulators of RAC1. Collectively, our study identifies the loss of CUL3 as a driver of MAPKi resistance through activation of RAC1 and demonstrates that inhibition of the Src family can suppress the MAPKi resistance phenotype in CUL3KD cells by inactivating RAC1 protein.
Background
Melanoma is the deadliest form of skin cancer, causing nearly 10,000 deaths per year (1). While recurrence of stage I and II melanoma can be effectively prevented by wide local excision as the sole therapy (5-year survival rates around 95 and 75%, respectively), metastatic melanoma is more difficult to treat (5-year survival around 56 and 18% for stage III and IV, respectively). Current treatment options include radiation, chemotherapy, targeted therapy, and more recently immunotherapy (2). Fortunately, 63% of late stage melanomas harbor BRAFV600 mutations and can be treated with vemurafenib, a highly selective kinase inhibitor that specifically targets the mutant protein (3, 4). However, while vemurafenib initially provides complete or partial response in over 50% of patients, the majority of patients relapse once tumors acquire resistance to vemurafenib (5). The addition of the MEK inhibitor (MEKi) cobimetinib extended progression free survival and overall survival in these patients. However, again, the majority of patients relapse once resistance occurs (6). Therefore, understanding the mechanisms of MAPKi resistance could provide diagnostic information to predict patients' responses to MAPKi therapy and may also identify novel drug combinations that can delay or prevent MAPKi resistance.
Genetic analysis of progression samples has provided key insights into the most common genetic resistance mechanisms, including BRAFV600 mutant amplification, BRAFV600 mutant truncations, mutant BRAFV600 fusions, RAS genes (NRAS, KRAS, HRAS), RAC1, MAP2K1 or AKT gain-of-function mutations, and loss of function events in CDKN2A, PTEN, PIK3R2, and DUSP4 [for review, Kakadia et al. (7)]. However, these mechanisms explain only 60–70% of cases of BRAFi resistance, leaving a substantial number of resistance mechanisms yet to be identified. Moreover, some of these may not be bona fide resistance drivers on their own as, for example, A375 and SK-MEL-28 cells are CDKN2A mutant and PTEN deficient, respectively, and yet sensitive to vemurafenib. Forward genetic screens have been used for years to study important cancer phenotypes and, more recently, these screens have been developed to understand how loss- or gain-of-function events can drive resistance to BRAFi (8–13). The genetic approaches used to investigate BRAFi resistance include libraries of near-genome-wide reagents such as ORFs, shRNA, and CRISPR guides and can further be subdivided into arrayed or pooled screens. In a pooled screen, each element must provide a selective advantage to cells bearing that element compared to the others in the pool and therefore this format better represents the heterogeneous clonal evolution of cancer. Arrayed screens confer a higher sensitivity since each ORF or guide is tested separately for the phenotype. However, these screens require robotic liquid handling and high-throughput cell analysis instruments, preventing many research laboratories from utilizing this approach. They also do not recapitulate the mixed clonal population of cells that are present during cancer development.
Although multiple screens have been performed to identify drivers of BRAFi resistance, there has been little overlap in the genes identified in the respective screens despite using the same A375 human melanoma cell line (8–13). More specifically, when analyzing the identified loss of function drivers from four screens, only NF1 was identified across all four screens and only seven other genes were identified by three studies and included NF2 and CUL3 (8, 12, 13). Most identified genes (35/48) were only identified by one study. This is even more evident when analyzing the identified gain of function drivers from another four screens (9–11, 13). No gene was identified in all four screens, 70/88 genes were only identified in a single screen, and BRAF overexpression—a known mechanism of resistance—was only identified in two of the screens. When these screens are analyzed together, there are certain patterns of resistance that emerge. In terms of loss of function drivers, many members of the E2/E3 ubiquitin ligase complex, the mediator complex, and the STAGA or SAGA complex are implicated in mediating vemurafenib resistance. Gain of function drivers include G-protein coupled receptors such as lysophosphatidic acid receptors (LPAR), kinases including BRAF and RAF, and receptor tyrosine kinases including Src family members Src, BTK, HCK, and LCK. Due to the lack of reproducibility between screens, we wanted to perform a separate shRNA-based screen using a whole-genome shRNA library and compare our results to previous published findings. In doing so, our aim was to discover shared mechanisms of MAPKi resistance across screens with the hope that these shared mechanisms will be more clinically applicable.
Here we used a shRNA library consisting of 113,001 shRNAs covering 18,938 genes to identify negative regulators of resistance to vemurafenib in the BRAFV600E-expressing human melanoma cell line A375. We identified loss of NF1 and CUL3, identified in previous screens, as drivers of vemurafenib resistance. Loss of CUL3 was associated with an increase of RAC1 activity and MEKS298 phosphorylation. The Src family inhibitor saracatinib decreased both RAC1 activity and MEKS298 phosphorylation and reversed resistance to vemurafenib in CUL3KD cells, suggesting that inhibition of the Src family suppresses the MAPKi resistance phenotype in CUL3KD cells by inactivating RAC1 protein. We demonstrated that RAC1-driven mechanisms of resistance to MAPKi could be prevented through Src inhibition, providing new options for future targeted therapies in melanoma.
Materials and Methods
Cell Culture and Inhibitors
A375 and 451.Lu parental cell lines were obtained from the ATCC and grown in DMEM (Gibco) supplemented with 10% FBS (Gibco) and 1% NEAA (Gibco). Media for A375 and 451.Lu KD derivatives was also supplemented with puromycin (Gold Biotechnology) 0.5 μg/ml. Vemurafenib and saracatinib (Selleckchem) were used at 3 and 2 μM, respectively.
Lentiviral shRNA Screen
A lentivirus shRNA library containing 113,001 shRNAs covering 18,938 genes with an average of 6 shRNAs per gene was purchased from transOMIC technologies inc. Individual shRNAs were randomly spread across 13 pools. Each pZIP lentiviral vector contained the hCMV promoter driving expression of a ZsGreen cassette, a puromycin resistance cassette, and the microRNA scaffold Ultramer containing the individual shRNA (Figure 1B). Viral packaging was performed by the Viral Vector Core at the University of Iowa and the final concentrated and titered library was sequence-confirmed.
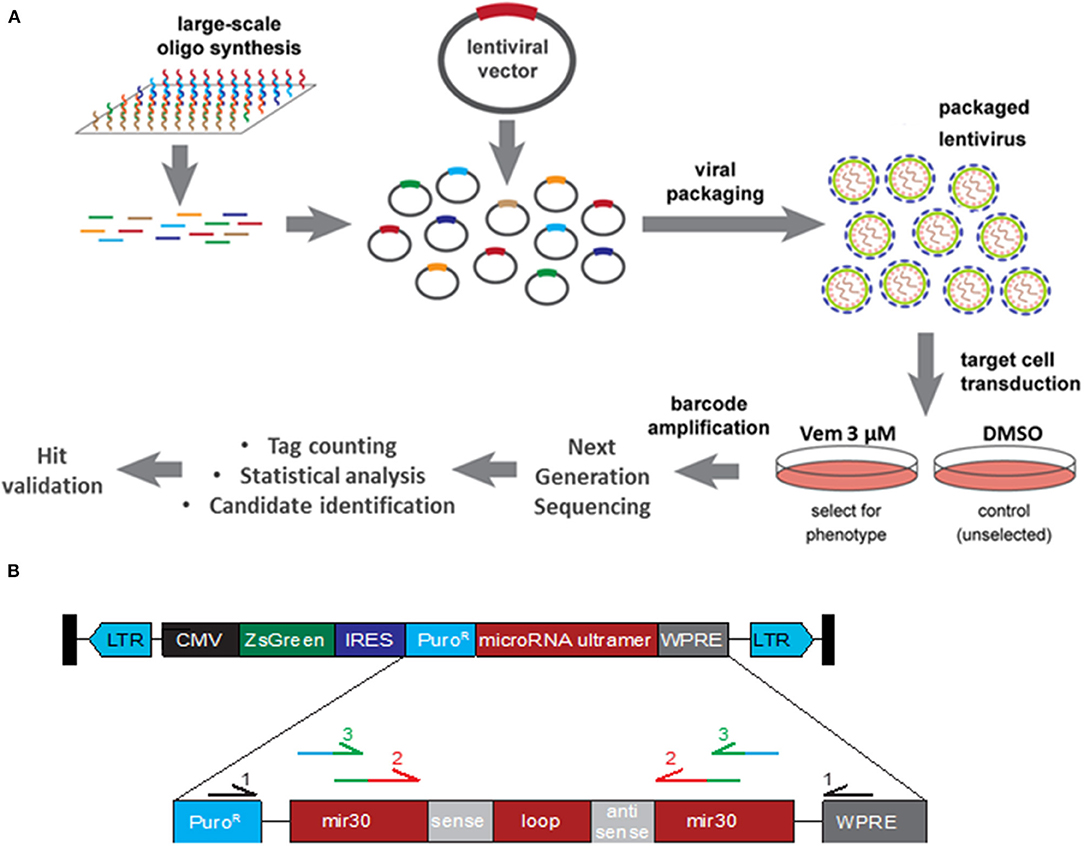
Figure 1. Functional Genomic Screening Overview. (A) Functional Genomic Screening Overview. shRNA screening steps include: viral library preparation, target cell infection, survival selection, guide/ORF recovery by amplification, NGS library preparation, NGS, statistical analysis, candidate identification and validation of selected hits. (B) shRNA construct design. pZIP lentiviral vector contains a CMV promoter driving expression of a ZsGreen cassette, a puromycin resistance cassette (PuroR), and the microRNA scaffold ultramer containing the individual sense and antisense sequence. Primary primers (black) were used to enriched for the shRNA construct. Secondary primers recognition sequence (red) binds to the exogenous mir30 region of shRNA construct while adding sequence (green) for the barcoded tertiary primers to bind to. Tertiary primer: recognition sequence binds to the previous amplicon (green) while adding barcode and Illumina sequencing tag (blue).
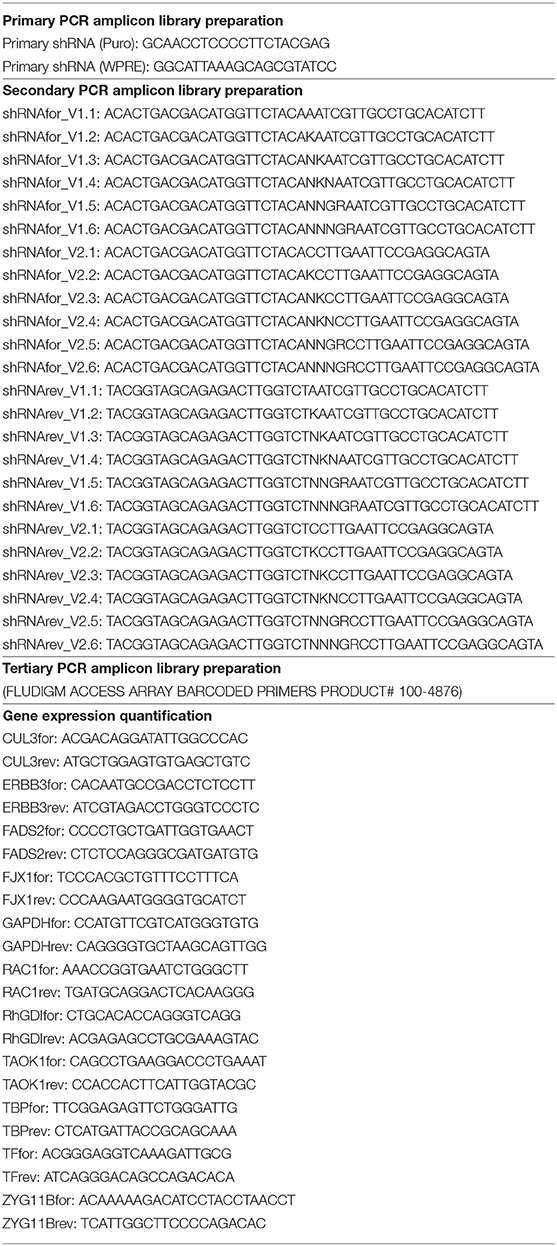
The 13 pools of viruses (obtained from the Viral Vector Core Facility, University of Iowa) were transduced into 3.6 × 10⁷ A375 cells at an MOI of 0.5 TU/cell. For each pool of lentivirus, cells were divided equally into 12 wells and incubated overnight before being pooled back together and split into two flasks. Two days later, one of the two flasks was treated with DMSO and the other with Vemurafenib at 3 μM. A few days later, each flask was divided into three flasks and treated with DMSO or Vemurafenib 3 μM for three and 21 days, respectively, at which time point the flasks reached confluency. Genomic DNA was extracted via GenEluteTM Mammalian Genome DNA miniprep Kit (Sigma). DNA fragments containing the shRNA constructs were amplified three times (Table 1). The first PCR was performed with primers recognizing the puromycin resistance cassette and the WPRE (woodchuck hepatitis virus post-transcriptional regulatory element), both found exclusively in the insert lentivirus construct. This step is necessary to enrich for the shRNA construct since the secondary PCR primers also partially bind to endogenous mir30. The secondary PCR amplifies the shRNA sequence and the tertiary PCR barcodes each sample and tags each amplicon for sequencing via the Illumina HI-Seq 4000 platform.
Screen Analysis
Reads were aligned to target sequences belonging to each shRNA construct used in the screen. Alignment was performed using HISAT2 (14). Only reads that mapped uniquely and had at most one mismatch were considered for further analysis. Final counts reported for a given tag were the raw number of reads normalized by the total number of reads in a given sample, i.e., counts per million. Candidates were selected for validation based on the log2 fold change. Statistical significance was determined using the Mann Whitney U-test. This analysis was implemented using the R programming language.
Hit Validation
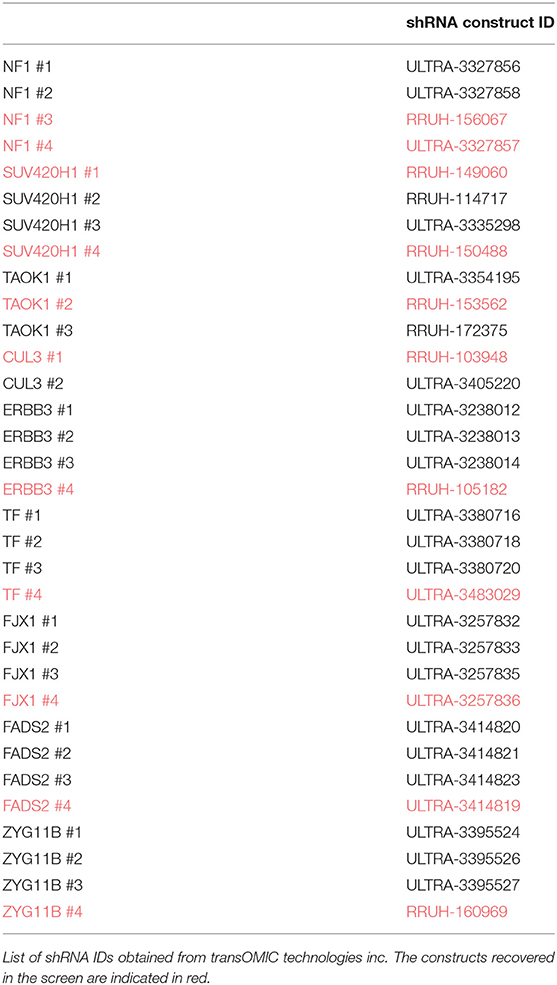
A375 cells were transduced with lentivirus shRNA targeting each of the nine genes selected for validation. Two to four shRNA guides (transOMIC technologies inc.), including those recovered in the screen, were used to target each gene independently (Table 2). 293FT cells were transfected with 1 μg lentiviral shRNA vector, 0.1 μg VSV-G and 0.9 μg PAX2 using Polyfect (Qiagen). Forty-eight hours later, the viral suspension was collected and added to A375 cells along with polybrene (8 μg/ml final). Puromycin (1 μg/ml) was added to the media 2 days after the infection to select for transduced cells. Transduction efficiency was evaluated by FACS (expression of ZsGreen) and knockdown efficiency was evaluated by RT-PCR and/or western blot.
A375 CUL3 and RAC1 Double KD
A375 shNT, A375 shCUL3#1 and A375 shCUL3#2 cells were transduced with retrovirus shRNA targeting RAC1 (transOMIC technologies inc.). GP2-293 cells were transfected with 1 μg pSIREN Hygro ShRNA vector and 1 μg VSV-G using Polyfect (Qiagen). Forty-eight hours later, the viral suspension was collected and added to A375 cells along with polybrene (8 μg/ml final). Puromycin (1 μg/ml) and hygromycin (400 μg/ml) were added to the media 2 days after the infection to select for transduced cells. Knockdown efficiency was evaluated by western blot.
RT-PCR
RNA was extracted using RNeasy Mini Kit (Qiagen, cat # 74104). Retrotranscription was performed on 1 μg of RNA using iScript cDNA Synthesis Kit (Bio-Rad, 170-8890). Real-time amplification was performed with the CFX Connect Real-Time System (Biorad) using iQ SYBR Green Supermix (Bio-Rad, 170-8880) (Table 1).
Viability Assays
For short-term IC50 assays, cells were plated at 1,500 cells/well in 96-well plates and treated the following day with 10-fold serial dilutions of vemurafenib (1 nM−10 μM). After 72 h, cell viability was determined using Cell-Titer-Blue assay (Promega) according to manufacturer's instructions. The Synergy HT plate reader (Biotek, Winooski, VT) was used for signal quantification and the fluorescence values were normalized to the vehicle well for each cell line. Absolute IC50 were calculated with GraphPadPrism software (GraphPad Software, Inc.).
For short term growth assays, cells were plated in triplicate in 96-well plates at a density of 5 × 10² cells per well. The CellTiter-Blue Viability Assay (Promega) was performed serially on pre- and post-inhibitor treated cells. Media containing the specific inhibitor used was renewed every 5 days. Fold change from Day 0 was assessed for each well by comparing pre- and post-inhibitor treated cells.
The effect of 4 days treatment with vemurafenib, saracatinib and the combination vem/sara on cell death and cell cycle progression was evaluated by flow cytometry. Cells were harvested, washed with PBS and either directly stained with propidium iodide 1 μg/ml (cell death) or fixed with ethanol 70% overnight at −20°C prior staining with propidium iodide 35 μg/ml (cell cycle analysis).
For long term growth assays, cells were maintained on vemurafenib (3 μM) or DMSO for 70 days. Every 5 days, the cells were passaged, counted and the population doubling level (PDL) was calculated using the formula: PDLn = 3.32 (log Xt–log X0) + PDLn-1 (with Xt = cell number at that point, X0 = cell number used as inoculum and PDLn-1 = population doubling level at the previous passage). Vemurafenib treatment was renewed at each passage.
Western Blot
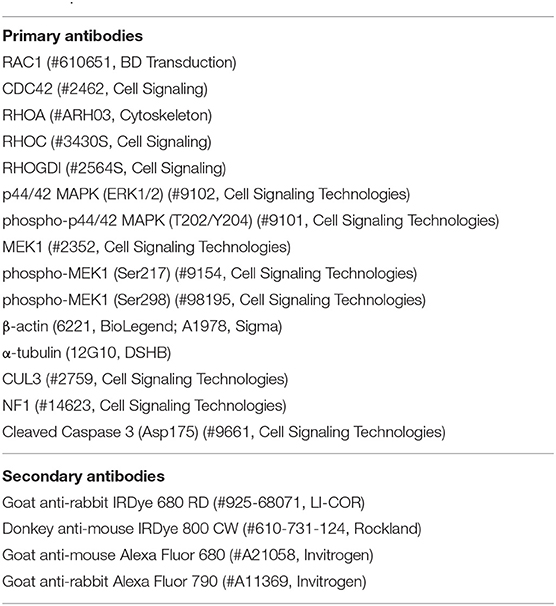
Proteins were extracted with Laemmli buffer, separated on SDS-polyacrylamide gels (NuPAGE® 4–12% Bis-Tris Protein Gels, Novex) and transferred to PVDF membranes (Immobilon-FL) prior to incubation with primary antibody (1/1,000) overnight at 4°C and incubation with corresponding secondary antibody (1/10,000) for 1 h at room temperature (Table 3). The membranes were scanned with an Odyssey infrared imaging system (LI-COR Biosciences, Lincoln NE) and expression of protein was quantified (ImageJ) and normalized to β-actin or α-tubulin expression.
RAC1 Activity Assay
Cells were released from 10 cm dish with trypsin, washed twice with PBS and lysed using RAC1 activity buffer (50 mM Tris, 500 mM NaCl, 50 mM MgCl2, 1% Triton X-100, 0.2 mM PMSF, proteases inhibitor cocktail). To detect GTP-bound RAC1, 800–1,000 μg of protein was incubated with recombinant protein (Rho binding domain of Rhotekin for RhoA/C or of PAK1 for RAC1) (>30 μg) for 45 min at 4°C (5% of the sample was reserved for use as the input control). Samples were washed three times with 1 mL of RAC1 activity buffer and resuspended in 30 μl of loading buffer containing 10% BME. Samples were separated on SDS-polyacrylamide gels to detect RAC1 protein.
Results
Pooled shRNA Transduction Drives Vemurafenib Resistance
To identify genes whose down-regulation confers resistance to MAPKi, we transduced A375 human melanoma cells harboring the BRAFV600E mutation with a lentiviral shRNA library consisting of 113,001 shRNAs covering 18,938 genes with an average of six shRNAs per gene at a MOI of 0.5 (Figure 1A). For each of the 13 pools, the transduced cells were split into six flasks cultured either in the presence of DMSO (three flasks) or 3 μM vemurafenib (three flasks) to ensure biological replicates. Cells reached confluence after 3 days for DMSO-treated flasks and 21 days for vemurafenib-treated flasks. Drug-resistant colonies emerged around 2 weeks after initial vemurafenib treatment. Based on literature and our previous work, spontaneous resistance to 3 μM vemurafenib occurs around 3–4 weeks post-treatment, indicating that shRNA knockdown decreased time to resistance.
Identification of Enriched shRNA Drivers in Vemurafenib Resistant A375
To identify genes in which knockdown via shRNA conferred vemurafenib resistance, the relative abundance of each shRNA was determined by PCR amplification and next generation sequencing of the lentiviral library. To accomplish this, genomic DNA was extracted from 39 DMSO- and 39 vemurafenib-treated cell populations (three flasks per treatment for each of the 13 pools of lentivirus). DNA fragments containing the puromycin resistance cassette and WPRE regions of the lentivirus backbone were amplified to enrich for the exogenous shRNA construct (Figure 1B, Table 1). Subsequent PCR steps barcoded each sample and prepared each fragment for sequencing on the HiSeq 4000 with Fluidigm sequencing primers (Figure 1B, Table 1).
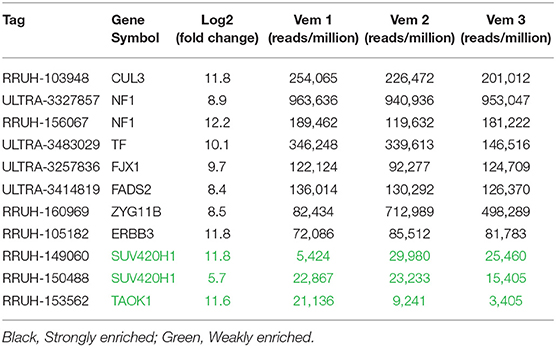
Enriched shRNAs were defined based on criteria including number of fragments per million reads, representation across three independent vemurafenib treated populations, and fold change in comparison to DMSO-treated populations (Supplementary Figure 1). High-performing shRNAs were represented in two groups: strongly enriched (13 genes) and weakly enriched (440 genes). Strongly enriched tags were defined as >50,000 fragments/million normalized reads in all three vemurafenib-treated samples with log2 fold-change above eight over DMSO samples. Weakly enriched shRNAs also met the log2 fold-change of eight threshold but failed the reads/sample cutoff. This data set was highly complex with many tags failing to have similar enrichment patterns across biological replicates of vemurafenib treated populations. To further filter the genes of interest, expression in A375 was analyzed for each gene, and only genes that had baseline expression in A375 were selected for further study (CCLE, Broad Institute). The final gene list we considered for further validation studies included TAOK1, SUV420H1, ERBB3, FADS2, FJX1, TF, ZYG11B, NF1, and CUL3 (Table 4). Of note, two out of four NF1 shRNA constructs were strongly enriched in our screen. This gene represents a positive control in this study since it has previously been identified as a driver of MAPKi resistance in A375 cells using an shRNA screen (8).
Loss of NF1 and CUL3 Confers Vemurafenib Resistance
To verify resistance effects of the nine selected candidates, we independently expressed shRNA guides to these nine genes in A375 cells. Each gene was represented by two to four unique shRNAs including the shRNA sequences that were identified by the screen. After puromycin selection, knockdown was confirmed by qRT-PCR and/or immunoblot analysis. Knockdown cell lines were analyzed for short-term response to vemurafenib and growth in long-term culture while undergoing vemurafenib treatment (Figure 2 and Supplementary Figure 2). Despite an effective reduction of mRNA levels (Supplementary Figure 2, left panel), knockdown of TAOK1, SUV420H1, ERBB3, FADS2, FJX1, TF, and ZYG11B all failed to confer resistance to vemurafenib in both short-term (Supplementary Figure 2, middle panel) and long-term assays (Supplementary Figure 2, right panel). Although one ZYG11B shRNA slightly increased the IC50 and growth in long-term culture, the three others failed to confer resistance, suggesting that the resistance could be due to an off-target effect. On the other hand, while only CUL3 knockdown increased IC50 to vemurafenib in short term culture (159 nM in shNT vs. 589 and 312 nM in shCUL3 #1 and #2, respectively) (Figures 2B,E), all shRNA constructs targeting either CUL3 or NF1 drove resistance to vemurafenib in long-term culture (Figures 2C,F). We also performed the knockdown of CUL3 in a second melanoma cell line, 451.Lu (Supplementary Figure 3A). As expected, knockdown of CUL3 via two independent shRNA constructs drove resistance to vemurafenib in 451.Lu cells shown by an increase of the IC50 in a short-term experiment (122 nM in shNT vs. 3223 and 930 nM in shCUL3 #1 and #2, respectively) (Supplementary Figure 3B).
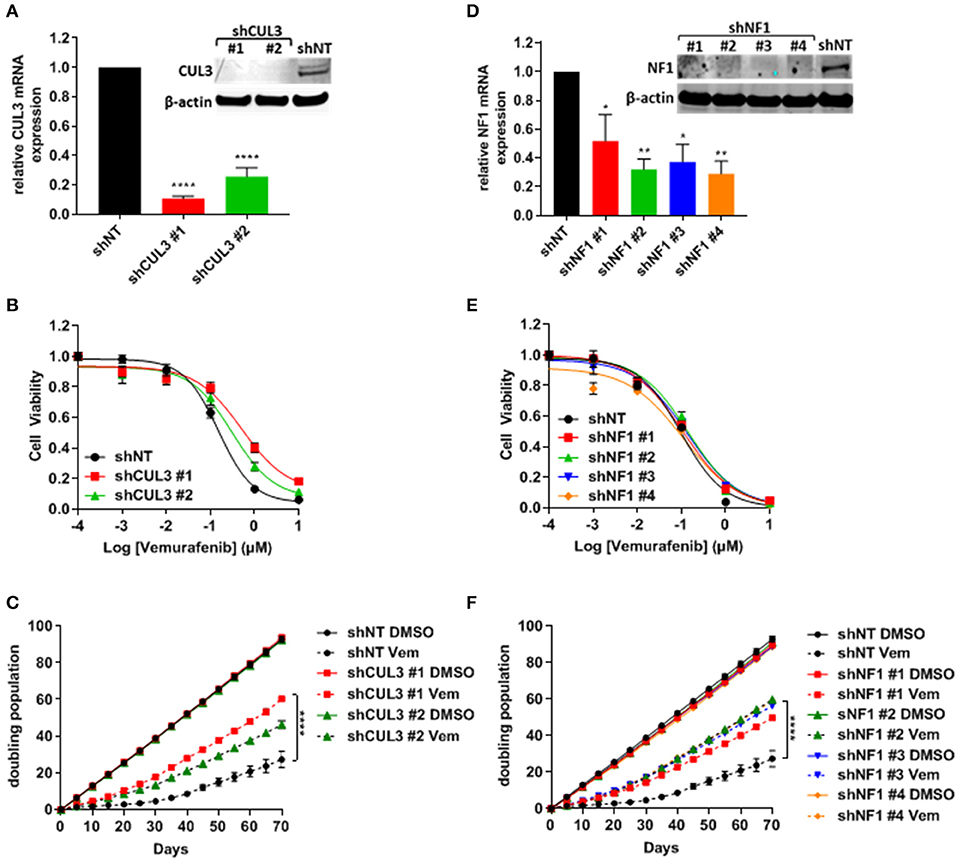
Figure 2. Knockdown of NF1 and CUL3 drive vemurafenib resistance in A375 cells. (A,D) The efficiency of CUL3 (A) and NF1 (D) knockdown in A375 cells was confirmed by RT-PCR and western blot [*p < 0.05; **p < 0.01; ****p < 0.0001 (One-way ANOVA followed by Bonferroni's multiple comparisons test)]. (B,E) Sensitivity to vemurafenib was evaluated in short-term (72 h) dose response assay in CUL3 (B) and NF1 (E) A375 knockdown cells. (C,F) Sensitivity to vemurafenib was evaluated in long-term (70 days) growth assay in CUL3 (C) and NF1 (F) A375 knockdown cells [****p < 0.0001 (Two-way ANOVA followed by Bonferroni's multiple comparisons test)]. n ≥ 3 for each experiment. See Supplementary Figure 6 for original blots.
Vemurafenib Resistance Is Associated With the Reestablishment of MAPK Signaling in CUL3KD Cells
Numerous pathways implicated in driving resistance to vemurafenib have been identified with most mechanisms reestablishing MAPK via phospho-ERK or activating downstream targets of ERK. We demonstrated that resistance to vemurafenib was associated with a sustained activation of the MAPK pathway as shown by the elevated pERK1/2 level in A375 CUL3KD (Figure 3A) and NF1KD (Figure 3B) cells compared to A375 shNT cells after an 18-h treatment with vemurafenib. While the role of NF1 in MAPKi resistance has previously been characterized (8, 15), the mechanism by which loss of CUL3 function contributes to BRAFi-resistance remained unclear despite being previously identified in a CRISPR screen for BRAFi-resistance (12). Therefore, we focused our efforts on determining the underlying mechanisms leading to the reestablishment of MAPK signaling in CUL3KD cells upon vemurafenib treatment. While loss of CUL3 did not affect the phosphorylation of MEK on S217 (RAF-dependent phosphorylation site), it significantly increased the phosphorylation of MEK on S298, a site phosphorylated by PAK1 kinase, in both DMSO- (Figures 3C,D) and vemurafenib-treated conditions (Figures 3C,E). Since PAK1 kinase is a downstream effector of the small GTPase, RAC1, these results suggest that vemurafenib resistance of CUL3KD cells treated with vemurafenib may depend on RAC1 signaling pathways.
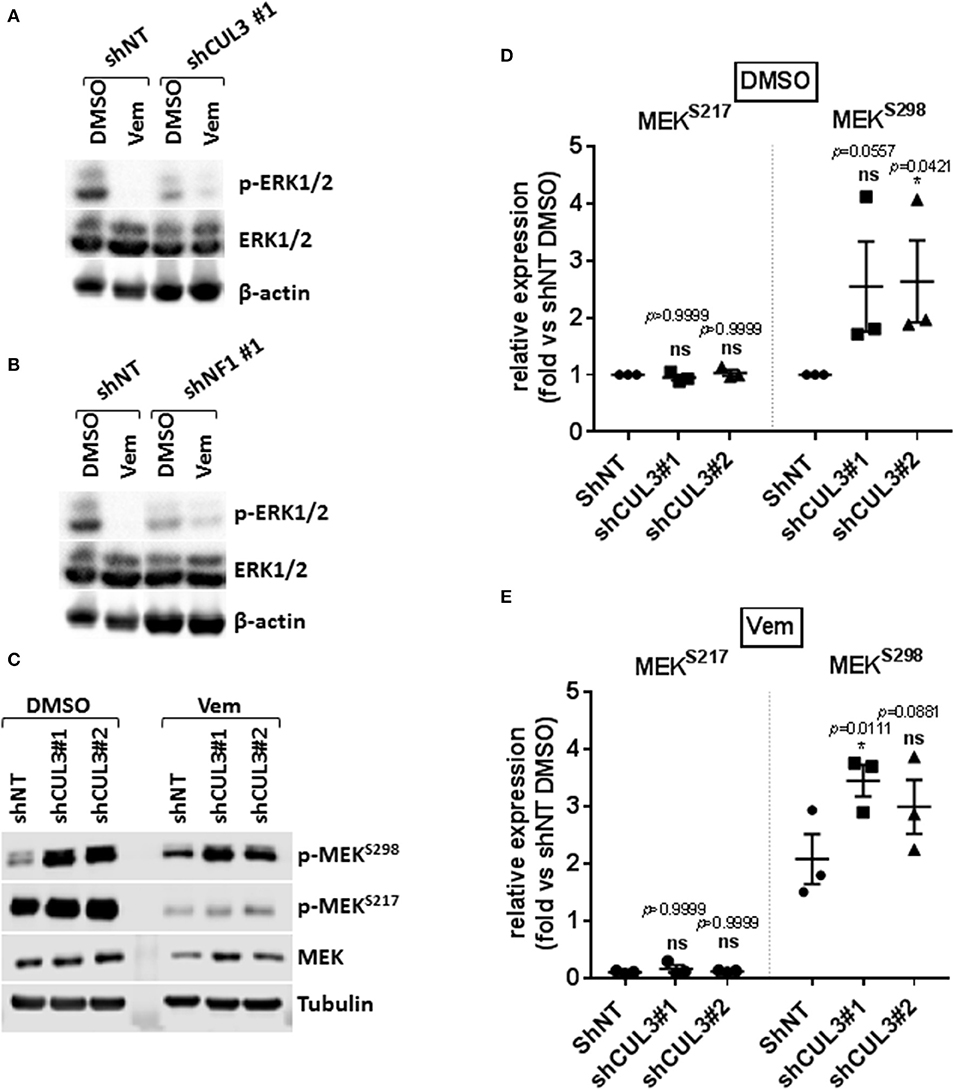
Figure 3. Resistance to vemurafenib is associated with the reestablishment of MAPK signaling in CUL3KD cells. (A,B) Western blot of p-ERK1/2 and total ERK1/2 in A375 NF1KD (A) and CUL3KD (B) cells treated with DMSO or vemurafenib (3 μM) for 18 h. (C–E), Expression (C) and quantification (D,E) of phospho-MEKS217 and phospho-MEKS298 measured by western blot in A375 CUL3KD cells treated with DMSO or vemurafenib (3 μM) for 4 days. *p < 0.05 (Two-way ANOVA followed by Bonferroni's multiple comparisons test), n = 3. See Supplementary Figures 7, 8 for original blots.
CUL3KD Cells Are Sensitive to Vemurafenib + Srci Treatment
Activated Rho-GTPases have been shown to play an important role in MAPKi resistance. Indeed, constitutively active mutant of RAC1 (RAC1P29S) is found in 10% of MAPKi progression melanoma tumors and overexpression of PAK may promote MAPKi resistance in some settings (9, 10, 16–18). Based on our previous work showing that RAC-driven mechanisms of resistance can be ablated with the addition of the Src family inhibitor (Srci) saracatinib (19), we evaluated the effect of vemurafenib in combination with saracatinib. The drug combination decreased the level of pMEKS298 in both A375NT and CUL3KD cells compared to vemurafenib alone (Figures 4A,B) whereas it had no effect on pMEKS217 level (Figures 4A,C). While saracatinib had minimal (A375) or no (451.Lu) effect on its own (Supplementary Figures 4A,B), it had a cytotoxic effect when combined with vemurafenib on A375 CUL3KD (Figure 4D) and 451.Lu CUL3KD (Figure 4E) cells. To confirm the cytotoxic effect of combined vemurafenib/saracatinib treatment, we evaluated the percentage of cell death by staining treated cells with propidium iodide (Supplementary Figure 4C). As anticipated, saracatinib alone did not induce cell death while vemurafenib induced cell death in A375 shNT and to a lesser extent in A375 shCUL3 #1 and #2. However, the vemurafenib/saracatinib combination dramatically increased the percentage of dead cells in all cell lines evaluated. These results were consistent with induction of caspase three cleavage upon vemurafenib or combined vemurafenib/saracatinib (Supplementary Figures 4D,E). Additionally, we investigated the effect of the different treatment on cell cycle progression (Supplementary Figure 4F). Our results indicated that saracatinib on its own does not affect cell cycle progression while vemurafenib induced a cell cycle arrest with an accumulation of cells in G1. However, the addition of saracatinib to vemurafenib does not exacerbate this cell cycle arrest suggesting that the drug combination acts through cell death induction. Finally, RAC1 pull-down activation assays showed increased basal RAC1 activity in A375 (Figure 5A) and 451.Lu (Figure 5B) CUL3KD cells compared to their respective control cells. While the activity of RAC1 remained unchanged upon vemurafenib treatment, it was decreased when cells were treated with vemurafenib plus saracatinib (Figures 5A,B). Thus, these results indicate that the resistance mechanisms driven by knockdown of CUL3 involve the reestablishment of MAPK signaling as a result of the stabilization and Src-dependent activation of RAC1.
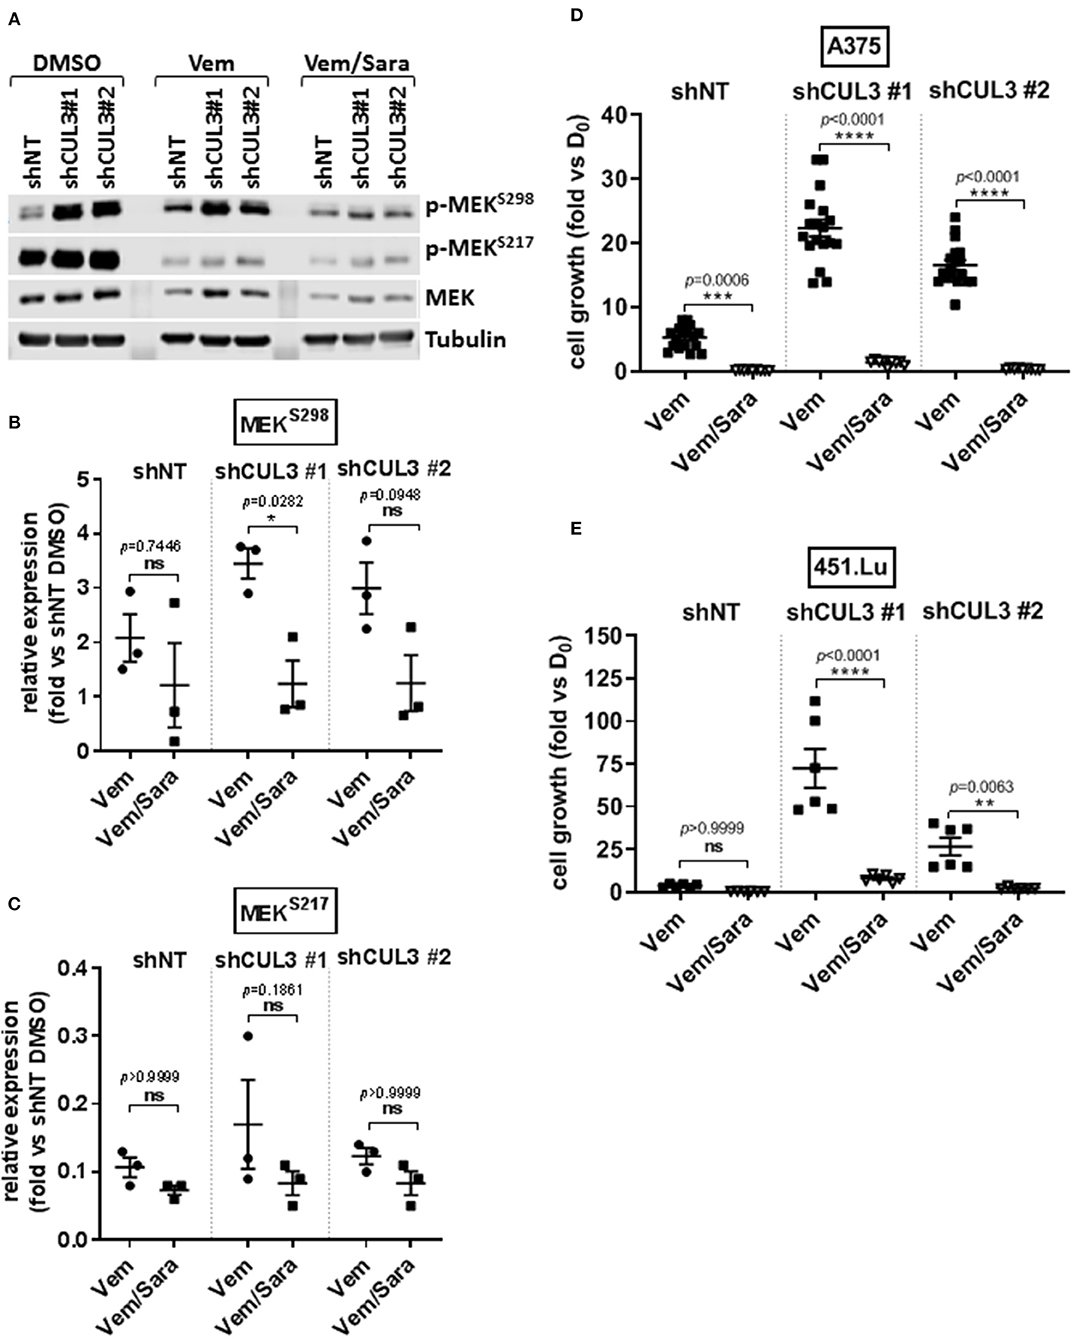
Figure 4. CUL3 Knockdown cells are resistant to Vemurafenib but sensitive to the combination vemurafenib/saracatinib. (A–C) Expression (A) and quantification of phospho-MEKS298 (B) and phospho-MEKS217 (C) measured by western blot in A375 CUL3KD cells treated with vemurafenib (3 μM) alone or in combination with saracatinib (2 μM) for 4 days. (D,E) Effect of vemurafenib (3 μM) alone or in combination with saracatinib (2 μM) on the growth of A375 (D) or 451.Lu (E) CUL3KD cells (10 days treatment). *p < 0.05; **p < 0.01; ***p < 0.001; ****p < 0.0001 (Two-way ANOVA followed by Bonferroni's multiple comparisons test), n ≥ 3 for each experiment. See Supplementary Figure 8 for original blots.
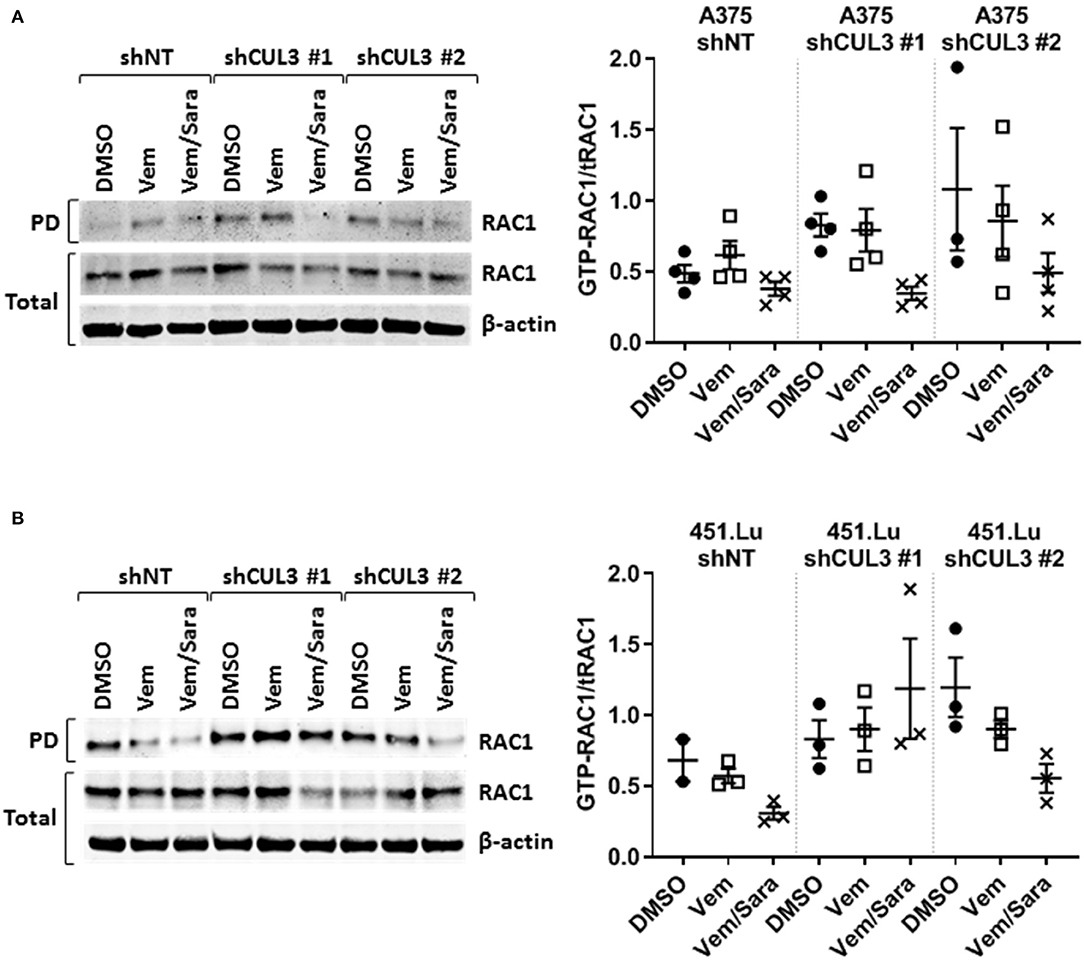
Figure 5. RAC1 activity is increased in CUL3KD cells and inhibited by the combination vemurafenib/saracatinib. Activity of RAC1 was assessed by pulldown of GTP-RAC1 followed by immunoblotting of RAC1 in (A) A375 and (B) 451.Lu CUL3KD cells. See Supplementary Figures 9, 10 for original blots.
CUL3KD Does Not Affect RAC1 Expression
CUL3 is a component of multiple E3 ubiquitin-protein ligase complexes. Cullin proteins serve as a scaffold to connect two functional modules of E3 ubiquitin ligases: the catalytic RING-box protein 1 (RBX1), and a Bric-a-brac/Tramtrack/Broad (BTB) protein which act as an adaptor and substrate recognition subunit and confer specificity to the E3 ubiquitin ligase (20). Thus, loss of CUL3 would be predicted to stabilize many proteins by preventing E3 ubiquitin ligase-mediated degradation. Among others, it was demonstrated that a CUL3 E3 ligase complex, involving the adaptor BACURD, could mediate degradation of Rho GTPases which are known mediators of MAPKi resistance (21). However, while CUL3KD was associated with increased expression of RHOA and CDC42, the levels of RHOC and RAC1 remained unchanged (Figures 6A,B). Alternatively, CUL3 KD could affect RAC1 activity indirectly. For example, CUL3 could mediate the degradation of RHOGDI, and consequently destabilize RhoGTPases, as RHOGDI was shown to interact with CUL3-based E3 ligases (22). However, the expression of RhoGDI was unaffected by CUL3KD (Figures 6A,B). These results indicate that the loss of CUL3 does not promote the activation of RAC1 through its direct or indirect stabilization, suggesting that CUL3 is involved in the stabilization of upstream regulators of RAC1.
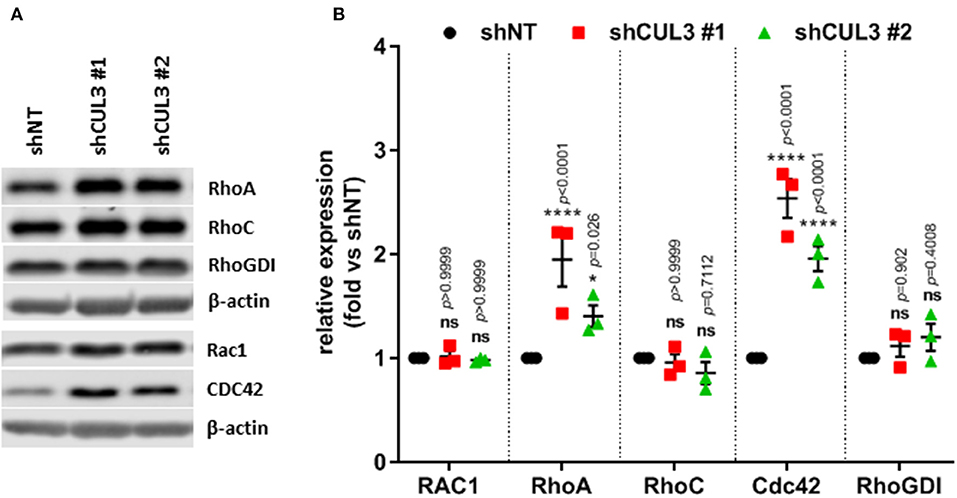
Figure 6. CUL3KD increases expression of RhoA and Cdc42, while having no effect on RhoC, RAC1, and RhoGDI. (A) Expression and quantification (B) of RhoGTPases (RhoA, RhoC, RAC1, and CDC42) and RhoGDI measured by western blot in A375 CUL3KD cells. *p < 0.05; ****p < 0.0001 (Two-way ANOVA followed by Bonferroni's multiple comparisons test), n = 3. See Supplementary Figure 11 for original blots.
RAC1KD Partially Reverses Vemurafenib Resistance in A375 CUL3KD Cells
To evaluate the implication of RAC1 in the vemurafenib resistance mechanism in CUL3 KD cells, we developed A375 double knockdown for both RAC1 and CUL3. While their efficiency remained modest, the constructs shRAC1#1 and shRAC1#2 appeared to perform better at knocking down RAC1 than shRAC1#3 in A375 CUL3KD cells (Supplementary Figures 5A,B). The knockdown status of CUL3 in these derivatives was also confirmed by western blot (Supplementary Figures 5A,C). The partial loss of RAC1 in the A375 shNT cells did not affect their sensitivity to vemurafenib in a 72h dose response assay (Figures 7A,B and Supplementary Figure 5D). However, RAC1 knockdown increased sensitivity of these cells to vemurafenib (3 μM) exposure in a 5 day growth assay, consistent with previously reported results (19) (Figure 7C). In contrast, expression of the shRAC1#1 and shRAC1#2 constructs resulted in a moderate increase in vemurafenib sensitivity in A375 CUL3KD cells with both assays (Figures 7A–C and Supplementary Figures 5E,F). As noted above, shRAC1#3 was the least potent construct at knocking down RAC1 in A375 CUL3KD cells assay consistent with a a lack of effect in both short- and long-term assays. These results indicate that RAC1 is involved in CUL3-dependendent vemurafenib resistance.
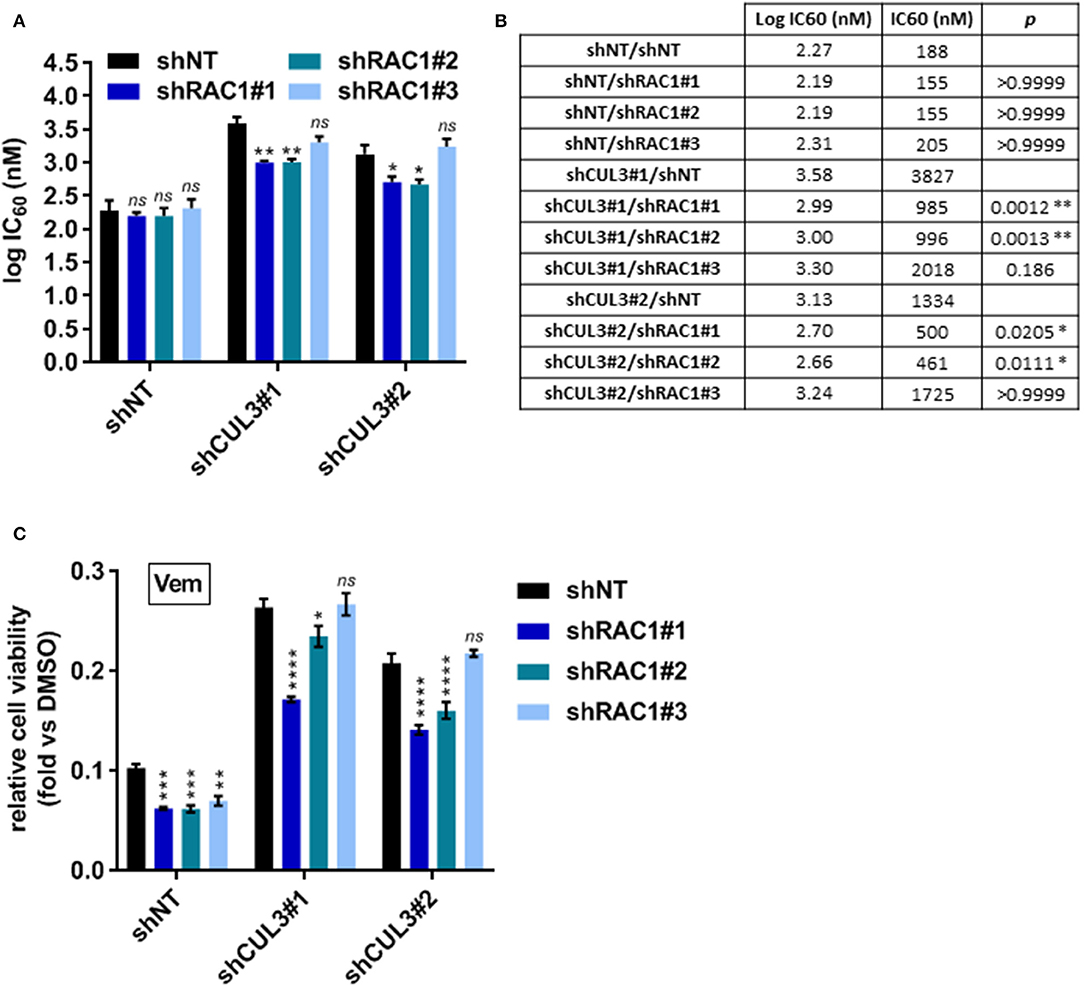
Figure 7. RAC1KD partially reverses vemurafenib resistance in A375 CUL3KD cells. (A,B) Sensitivity of RAC1 CUL3 double KD cells to vemurafenib was evaluated in short-term (72 h) dose response assay (1 nM−10 μM). Log IC60 were calculated and plotted for each cell lines (A). Log IC60 and IC60 values are summarized in (B). (C) Effect of vemurafenib (3 μM) alone or in combination with saracatinib (2 μM) on the growth of A375 cell line derivatives (5 days treatment). *p < 0.05; **p < 0.01; ***p < 0.001; ****p < 0.0001 (Two-way ANOVA followed by Bonferroni's multiple comparisons test), n=3.
Discussion
Here we used an shRNA library to identify negative regulators of resistance to vemurafenib in the BRAFV600E -expressing human melanoma cell line A375. While the screen identified multiple genes as candidate drivers, seven out of nine genes tested did not recapitulate the MAPKi resistant phenotype (Table 4 and Supplementary Figure 2). Thus, despite applying stringent criteria for high confidence hits in the screen, the false positive rate was high. This could reflect combinatorial interactions among the hits identified or stochastic fluctuations in library elements through the multiple steps involved in library preparation, representation in cells, or sequencing. The two drivers that did validate, NF1 and CUL3 (Figure 2), had already been identified in previous forward genetic screens using CRISPR approaches in A375 cells (12, 13). Of note, a shRNA-based screen only identified NF1 (8). None of our other high confidence hits were identified in either of these screens with the exception of TAOK1 which was identified in one of the CRISPR screens (12). However, the authors performed two screens from independent transductions and identified the loss of TAOK1 as a driver of vemurafenib resistance in only one of them. The lack of reproducibility amongst screens and/or the absence of discovering known drivers of resistance in patient samples can be explained by different factors. First, although all pooled library screens follow a similar screening protocol (23), the multi-step nature of this process directly affects the quality of the data. Also, additional steps can be added such as antibiotic selection after target cell infection to enrich for infected cell number, though this may constitute an artificial survival selection. Secondly, these screens have been performed in a single melanoma cell line. Since melanoma is a highly heterogeneous disease, the use of a single cell line may limit the possibility of identifying novel resistance mechanisms. Finally, these screens have employed relatively low doses of vemurafenib. While it is difficult to model the pharmacodynamics of vemurafenib exposure in cell culture that melanoma cells experience in patients, prior work has demonstrated that both plasma and intratumoral doses are significantly higher than those conventionally used in cell culture (24). Additionally, low doses of vemurafenib only have a cytostatic effect on A375 cells, while ninety percent of patients experience tumor regression on BRAFi therapy. Therefore, understanding shared or novel resistance mechanisms across cell lines and patient samples at pharmacologically relevant doses is crucial in understanding how to prevent BRAFi resistance.
Most mechanisms implicated in driving BRAFi resistance have been associated with the reactivation of MAPK signaling. NF1, which encodes neurofibromin, is a tumor suppressor which negatively regulates RAS proteins by converting active GTP-bound RAS into the inactive GDP-bound state. Since RAS is an upstream regulator of RAF proteins, how NF1 loss confers resistance to vemurafenib through sustained MAPK pathway activation is well understood (8). How the loss of CUL3 contributes to BRAFi resistance in melanoma is less clear. CUL3 mutation or down-regulation is observed in different types of cancer including lung cancer, oral squamous cell carcinoma and other squamous cell cancers, sporadic PRCC2 (type 2 papillary renal cell carcinoma) and liver cancer (25–28). In addition, a recent study using a transposon mutagenesis screen in mice indicates that CUL3 is a tumor suppressor in lung cancer (29). We show here that the loss of both CUL3 and NF1 were associated with reactivation of the MAPK pathway (Figure 3). More precisely, the loss of CUL3 resulted in increased phosphorylation of MEK on S298, a PAK1-specific phosphorylation site, suggesting that loss of CUL3 increases the activation of PAK1 (Figures 3C,E). Overexpression of PAK is a known driver of MAPKi resistance, and constitutive activating mutations of RAC1 (RAC1P29S), an upstream effector of PAK1, are found in 10% of MAPKi progression melanoma tumors (9, 10, 16–18). Our previous work showed that RAC-driven mechanisms of vemurafenib resistance can be ablated with the addition of the Src inhibitor saracatinib (19). We evaluated the effect of this combination of vemurafenib and saracatinib on CUL3KD cells (19). The addition of saracatinib decreased pMEKS298 level and abolished vemurafenib resistance in CUL3KD cells (Figure 4). While the exact mechanism of action is still unclear, the efficacy of the drug combination relies on its ability to induce cell death rather than inducing a cell cycle arrest (Supplementary Figure 4). As we previously showed, the efficacy of Srci relied on the ability of Src family proteins to activate GEFs to drive MAPKi resistance (19, 30, 31). This is consistent with the fact that the combination vemurafenib plus saracatinib was able to decrease RAC1 activity, which was elevated in basal and vemurafenib-treated condition in CUL3KD vs. CUL3NT cells (Figure 5). Prior studies have implicated Src in mediating vemurafenib resistance (10, 32–34). However, Src may function both upstream and downstream of RAC1 in some settings, where the two signaling proteins mutually regulate each other (35). Therefore, the ability of Src family inhibition to prevent various resistance mechanisms is most likely due to the ability of Src to participate in many pathways driving resistance. However, because saracatinib is a pan-Src inhibitor, we do not know which Src proteins are important for mitigating MAPKi resistance. As Src is rarely the primary driver of tumorigenesis, Src inhibitors, including saracatinib, have shown little activity in monotherapy trials in solid tumor malignancies (36). Saracatinib as a single agent to treat metastatic melanoma demonstrated no effect, but its activity against MAPKi-resistant melanoma has not been tested (37). Our results presented here support our previous findings identifying the combination BRAFi plus Srci as a viable mechanism to treat RAC1-driven MAPKi resistance mechanisms (19).
Our results do not yet directly reveal the CUL3 substrate that mediates BRAFi resistance. CUL3 plays a critical role in the polyubiquitination and subsequent degradation of specific protein substrates as part of an E3 ubiquitin ligase complex. CUL3 Speckle type BTB/POZ protein (SPOP), kelch-like ECH-associated protein (Keap1) and kelch-like family member 20 (KLHL2.0), being the most representative cancer-associated adaptors of CUL3 (38). The transcription factor NRF2, which promotes cell survival following oxidative damage, is one of the best described targets of CUL3 in the context of cancer through the interaction of CUL3 with the BTB/POZ domain protein Keap1 (39–41). An increase of Nrf2 pathway activation, resulting from the disruption of KEAP1/CUL3/RBX1 E3-ubiquitin ligase complex is observed in many cancers and potentially leads to chemoresistance (28, 42–47). Thus, Nrf2 is an attractive candidate for further study in the context of BRAFi resistance. Alteration of ubiquitinating/deubiquitinating enzymes have been implicated in BRAFi resistance. For example, downregulation of the ubiquitin ligase RNF125 was shown to be involved in intrinsic and adaptive resistance to BRAFi in melanomas through the inhibition of JAK/STAT signaling (48). However, we did not observe alteration of JAK/STAT signaling in our CUL3 KD cells (data not shown). Interestingly, the same authors also identified loss of RBX1 as a driver of vemurafenib resistance. Finally, the loss of USP28, a deubiquitinating enzyme, was shown to stabilize BRAF thus promoting resistance to RAF inhibitor therapy (49).
Our results indicate that CUL3 regulates the activity of RAC1 (Figure 5). Rho GTPases have been shown to be targeted by the CUL3–BACURD E3 ubiquitin ligase for degradation (21). While the role of RAC1 in BRAFi resistance is evident, the role of RHOA, RHOC, and their downstream effector Rho-kinase (ROCK) is less clear with conflicting evidence as to whether ROCK inhibition promotes or inhibits MAPKi in melanoma, and our recent study showed that, in contrast to RAC1 knockdown, which sensitized A375 cells to vemurafenib treatment, knockdown of either RHOA or CDC42 had no such effect (16, 18, 19, 50). Our results indicated that the loss of CUL3 did not affect the expression of RAC1, suggesting that CUL3 does not target RAC1 directly (Figure 6). RhoGDI, which controls the homeostasis of Rho proteins, has been shown to interact with CUL3-based E3 ligases (22, 51). However, our results indicate that CUL3 does not modulate RAC1 activity by targeting RhoGDI, as CUL3KD did not change the expression of RhoGDI (Figure 6). While our results indicate that the loss of CUL3 leads to the activation of RAC1 in melanoma cells and confers resistance to BRAFi, the exact mechanism leading to RAC1 activation in CUL3KD cells is still unclear. One possible mechanism is that CUL3 could promote the degradation of GEFs required for the activation of RAC1 as, for example, CUL3 KBTBD6/KBTBD7 ubiquitin ligase was shown to target TIAM1, a RAC1-specific GEF (52). Another possible mechanism might be a ubiquitin ligase complex specifically targeting the GTP-bound form of RAC1. Torrino et al. previously demonstrated that the ubiquitin ligase HACE1 could preferentially lead to the ubiquitination of GTP-bound RAC1 and that its loss resulted in increased GTP-bound RAC1 cellular levels (53).
Using a forward genetic screen, we identified loss of NF1 and CUL3 as drivers of vemurafenib resistance in melanoma, independently confirming results from similar genetic screens. We show here that CUL3 acts to limit RAC1 activation. When the expression of CUL3 is compromised, the activity of RAC1 is enhanced, thus promoting RAC1-dependent BRAF-independent cell growth. These data confirm our prior findings indicating that Src family inhibitors could represent new treatment options to manage RAC1-driven resistance mechanisms to BRAF inhibitors in melanoma.
Data Availability Statement
All relevant data generated or analyzed for this study are included in the article/Supplementary Material.
Author Contributions
MV, CF, MM, MH, CS, AD, and RP conceived and designed the study. MV, CF, AV, EZ, TF, LZ, and KH conducted the experiments. MV, CF, EZ, and AD contributed to data analysis. MV and CF wrote the manuscript. MH, CS, AD, and RP supervised the research. All authors read and approved the final manuscript.
Funding
This work was supported by a NIH-funded Institutional National Research Service Award (5T32 CA78586-20), pilot funding from the University of Iowa Carver College of Medicine and a Mezhir Award from the Holden Comprehensive Cancer Center.
Conflict of Interest
The authors declare that the research was conducted in the absence of any commercial or financial relationships that could be construed as a potential conflict of interest.
Acknowledgments
Viral Vector Core Facility, Carver College of Medicine, University of Iowa. Iowa Institute of Human Genetics (IIHG) Genomics Division, Carver College of Medicine, University of Iowa. These cores resources are supported in part by the Holden Comprehensive Cancer Center (P30 CA086862).
Supplementary Material
The Supplementary Material for this article can be found online at: https://www.frontiersin.org/articles/10.3389/fonc.2020.00442/full#supplementary-material
Abbreviations
BACURD, BTB/POZ domain-containing adapter for CUL3-mediated RhoA degradation protein; BME, β-mercaptoethanol; BTB, Bric-a-brac/Tramtrack/Broad; BTK, Bruton's tyrosine kinase; CCLE, Cancer cell line encyclopedia; CDC42, Cell division control protein 42 homolog; CDKN2A, Cyclin-dependent kinase Inhibitor 2A; CRISPR, Clustered regularly interspaced short palindromic repeats; CUL3, Cullin 3; DMSO, Dimethyl sulfoxide; DNA, Deoxyribonucleic acid; DUSP4, Dual specificity protein phosphatase 4; ERBB3, Erb-B2 receptor tyrosine kinase 3; ERK, Extracellular signal-regulated kinase; FACS, Fluorescence-activated cell sorting; FADS2, Fatty acid desaturase 2; FBS, Fetal bovine serum; FJX1, Four-jointed box kinase 1; GDP, Guanosine 5′-diphosphate; GEFs, Guanine nucleotide exchange factors; GTP, Guanosine-5′-triphosphate; HCK, Tyrosine-protein kinase HCK; hCMV, Human cytomegalovirus; HNSCC, Head and neck squamous cell carcinoma; IC50, Half maximal inhibitory concentration; KBTBD6, Kelch repeat and BTB domain containing 6; KBTBD7, Kelch repeat and BTB domain containing 7; Keap1, Kelch-like ECH-associated protein; KLHL20, Kelch-like family member 20; LCK, Lymphocyte-specific protein tyrosine kinase; MAP2K1, Mitogen-activated protein kinase kinase 1 (a.k.a. MEK1); MAPK, Mitogen-activated protein kinase; MAPKi, MAP kinase pathway inhibitors; MEK, Mitogen-activated protein kinase kinase; MEKi, MEK inhibitor; mRNA, Messenger RNA; MOI, Multiplicity of infection; NEAA, Non-essential amino acid; NF1, Neurofibromin 1; NF2, Neurofibromin 2; NGS, Next-generation sequencing; NRF2, Nuclear factor erythroid 2-related factor 2; ORF, Open reading frame; PAK1, Serine/threonine-protein kinase PAK 1; PAX2, Paired box gene 2; PBS, Phosphate-buffered saline; PDL, Population doubling level; PIK2R2, Phosphoinositol-3 kinase regulatory subunit 2; PRCC2, Type 2 papillary renal cell carcinoma; PTEN, Phosphatase and TENsin homolog; PVDF, Polyvinylidene difluoride; RBX1, RING-box protein 1; RHOA, Ras homolog gene family, member A; RHOC, Ras homolog gene family, member C; RHOGDI, Rho GDP-dissociation inhibitor; RNA, Ribonucleic acid; RT-PCR, Reverse transcription polymerase chain reaction; SAGA, SPT-ADA-GCN5 acetylase; SDS, Sodium dodecyl sulfate; shRNA, Short hairpin RNA; SPOP, speckle type BTB/POZ protein; STAGA, SPT3-TAF(II)31-GCN5L acetylase; SUV420H1, a.k.a. Lysine methyltransferase 5B (KMT5B); TAOK1, Thousand and one amino acid protein kinase 1; TF, Transferrin; TIAM1, T-cell lymphoma invasion and metastasis-inducing protein 1; VSV-G, Glycoprotein of vesicular stomatitis virus; WPRE, Woodchuck hepatitis virus post-transcriptional regulatory element; ZYG11B, Zyg-11 family member B.
References
1. Cronin KA, Lake AJ, Scott S, Sherman RL, Noone A-M, Howlader N, et al. Annual Report to the Nation on the Status of Cancer, part I: National cancer statistics. Cancer. (2018) 124:2785–800. doi: 10.1002/cncr.31551
2. Schoffer O, Schülein S, Arand G, Arnholdt H, Baaske D, Bargou RC, et al. Tumour stage distribution and survival of malignant melanoma in Germany 2002-2011. BMC Cancer. (2016) 16:936. doi: 10.1186/s12885-016-2963-0
3. Davies H, Bignell GR, Cox C, Stephens P, Edkins S, Clegg S, et al. Mutations of the BRAF gene in human cancer. Nature. (2002) 417:949–54. doi: 10.1038/nature00766
4. Hodis E, Watson IR, Kryukov GV, Arold ST, Imielinski M, Theurillat J-P, et al. A landscape of driver mutations in melanoma. Cell. (2012) 150:251–63. doi: 10.1016/j.cell.2012.06.024
5. Chapman PB, Hauschild A, Robert C, Haanen JB, Ascierto P, Larkin J, et al. Improved survival with vemurafenib in melanoma with BRAF V600E mutation. N Engl J Med. (2011) 364:2507–16. doi: 10.1056/NEJMoa1103782
6. Ascierto PA, McArthur GA, Dréno B, Atkinson V, Liszkay G, Di Giacomo AM, et al. Cobimetinib combined with vemurafenib in advanced BRAF(V600)-mutant melanoma (coBRIM): updated efficacy results from a randomised, double-blind, phase 3 trial. Lancet Oncol. (2016) 17:1248–60. doi: 10.1016/S1470-2045(16)30122-X
7. Kakadia S, Yarlagadda N, Awad R, Kundranda M, Niu J, Naraev B, et al. Mechanisms of resistance to BRAF and MEK inhibitors and clinical update of US Food and Drug Administration-approved targeted therapy in advanced melanoma. OncoTargets Ther. (2018) 11:7095–107. doi: 10.2147/OTT.S182721
8. Whittaker SR, Theurillat J-P, Van Allen E, Wagle N, Hsiao J, Cowley GS, et al. A genome-scale RNA interference screen implicates NF1 loss in resistance to RAF inhibition. Cancer Discov. (2013) 3:350–62. doi: 10.1158/2159-8290.CD-12-0470
9. Johannessen CM, Boehm JS, Kim SY, Thomas SR, Wardwell L, Johnson LA, et al. COT drives resistance to RAF inhibition through MAP kinase pathway reactivation. Nature. (2010) 468:968–72. doi: 10.1038/nature09627
10. Johannessen CM, Johnson LA, Piccioni F, Townes A, Frederick DT, Donahue MK, et al. A melanocyte lineage program confers resistance to MAP kinase pathway inhibition. Nature. (2013) 504:138–42. doi: 10.1038/nature12688
11. Konermann S, Brigham MD, Trevino AE, Joung J, Abudayyeh OO, Barcena C, et al. Genome-scale transcriptional activation by an engineered CRISPR-Cas9 complex. Nature. (2015) 517:583–8. doi: 10.1038/nature14136
12. Shalem O, Sanjana NE, Hartenian E, Shi X, Scott DA, Mikkelson T, et al. Genome-scale CRISPR-Cas9 knockout screening in human cells. Science. (2014) 343:84–7. doi: 10.1126/science.1247005
13. le Sage C, Lawo S, Panicker P, Scales TME, Rahman SA, Little AS, et al. Dual direction CRISPR transcriptional regulation screening uncovers gene networks driving drug resistance. Sci Rep. (2017) 7:17693. doi: 10.1038/s41598-017-18172-6
14. Kim D, Langmead B, Salzberg SL. HISAT: a fast spliced aligner with low memory requirements. Nat Methods. (2015) 12:357–360. doi: 10.1038/nmeth.3317
15. Larribère L, Utikal J. Multiple roles of NF1 in the melanocyte lineage. Pigment Cell Melanoma Res. (2016) 29:417–25. doi: 10.1111/pcmr.12488
16. Krauthammer M, Kong Y, Ha BH, Evans P, Bacchiocchi A, McCusker JP, et al. Exome sequencing identifies recurrent somatic RAC1 mutations in melanoma. Nat Genet. (2012) 44:1006–14. doi: 10.1038/ng.2359
17. Lu H, Liu S, Zhang G, Bin Wu null, Zhu Y, Frederick DT, et al. PAK signalling drives acquired drug resistance to MAPK inhibitors in BRAF-mutant melanomas. Nature. (2017) 550:133–6. doi: 10.1038/nature24040
18. Watson IR, Li L, Cabeceiras PK, Mahdavi M, Gutschner T, Genovese G, et al. The RAC1 P29S hotspot mutation in melanoma confers resistance to pharmacological inhibition of RAF. Cancer Res. (2014) 74:4845–52. doi: 10.1158/0008-5472.CAN-14-1232-T
19. Feddersen CR, Schillo JL, Varzavand A, Vaughn HR, Wadsworth LS, Voigt AP, et al. Src-dependent DBL family members drive resistance to vemurafenib in human melanoma. Cancer Res. (2019) 79:5074–87. doi: 10.1101/561597
20. Cheng J, Guo J, Wang Z, North BJ, Tao K, Dai X, et al. Functional analysis of Cullin 3 E3 ligases in tumorigenesis. Biochim Biophys Acta Rev Cancer. (2018) 1869:11–28. doi: 10.1016/j.bbcan.2017.11.001
21. Chen Y, Yang Z, Meng M, Zhao Y, Dong N, Yan H, et al. Cullin mediates degradation of RhoA through evolutionarily conserved BTB adaptors to control actin cytoskeleton structure and cell movement. Mol Cell. (2009) 35:841–55. doi: 10.1016/j.molcel.2009.09.004
22. Bennett EJ, Rush J, Gygi SP, Harper JW. Dynamics of cullin-RING ubiquitin ligase network revealed by systematic quantitative proteomics. Cell. (2010) 143:951–65. doi: 10.1016/j.cell.2010.11.017
23. Schaefer C, Mallela N, Seggewiß J, Lechtape B, Omran H, Dirksen U, et al. Target discovery screens using pooled shRNA libraries and next-generation sequencing: a model workflow and analytical algorithm. PLoS ONE. (2018) 13:e0191570. doi: 10.1371/journal.pone.0191570
24. Funck-Brentano E, Alvarez JC, Longvert C, Abe E, Beauchet A, Funck-Brentano C, et al. Plasma vemurafenib concentrations in advanced BRAFV600mut melanoma patients: impact on tumour response and tolerance. Ann Oncol. (2015) 26:1470–5. doi: 10.1093/annonc/mdv189
25. Thu KL, Pikor LA, Chari R, Wilson IM, Macaulay CE, English JC, et al. Genetic disruption of KEAP1/CUL3 E3 ubiquitin ligase complex components is a key mechanism of NF-kappaB pathway activation in lung cancer. J Thorac Oncol. (2011) 6:1521–9. doi: 10.1097/JTO.0b013e3182289479
26. Kossatz U, Breuhahn K, Wolf B, Hardtke-Wolenski M, Wilkens L, Steinemann D, et al. The cyclin E regulator cullin 3 prevents mouse hepatic progenitor cells from becoming tumor-initiating cells. J Clin Invest. (2010) 120:3820–33. doi: 10.1172/JCI41959
27. Lin D-C, Dinh HQ, Xie J-J, Mayakonda A, Silva TC, Jiang Y-Y, et al. Identification of distinct mutational patterns and new driver genes in oesophageal squamous cell carcinomas and adenocarcinomas. Gut. (2018) 67:1769–79. doi: 10.1136/gutjnl-2017-314607
28. Ooi A, Dykema K, Ansari A, Petillo D, Snider J, Kahnoski R, et al. CUL3 and NRF2 mutations confer an NRF2 activation phenotype in a sporadic form of papillary renal cell carcinoma. Cancer Res. (2013) 73:2044–51. doi: 10.1158/0008-5472.CAN-12-3227
29. Dorr C, Janik C, Weg M, Been RA, Bader J, Kang R, et al. Transposon mutagenesis screen identifies potential lung cancer drivers and CUL3 as a tumor suppressor. Mol Cancer Res. (2015) 13:1238–47. doi: 10.1158/1541-7786.MCR-14-0674-T
30. Bustelo XR. Vav family exchange factors: an integrated regulatory and functional view. Small GTPases. (2014) 5:9. doi: 10.4161/21541248.2014.973757
31. Gupta M, Qi X, Thakur V, Manor D. Tyrosine phosphorylation of Dbl regulates GTPase signaling. J Biol Chem. (2014) 289:17195–202. doi: 10.1074/jbc.M114.573782
32. Girotti MR, Pedersen M, Sanchez-Laorden B, Viros A, Turajlic S, Niculescu-Duvaz D, et al. Inhibiting EGF receptor or SRC family kinase signaling overcomes BRAF inhibitor resistance in melanoma. Cancer Discov. (2013) 3:158–67. doi: 10.1158/2159-8290.CD-12-0386
33. Fallahi-Sichani M, Becker V, Izar B, Baker GJ, Lin J-R, Boswell SA, et al. Adaptive resistance of melanoma cells to RAF inhibition via reversible induction of a slowly dividing de-differentiated state. Mol Syst Biol. (2017) 13:905. doi: 10.15252/msb.20166796
34. Vergani E, Vallacchi V, Frigerio S, Deho P, Mondellini P, Perego P, et al. Identification of MET and SRC activation in melanoma cell lines showing primary resistance to PLX4032. Neoplasia. (2011) 13:1132–42. doi: 10.1593/neo.111102
35. Ouyang M, Sun J, Chien S, Wang Y. Determination of hierarchical relationship of Src and Rac at subcellular locations with FRET biosensors. Proc Natl Acad Sci USA. (2008) 105:14353–8. doi: 10.1073/pnas.0807537105
36. Puls LN, Eadens M, Messersmith W. Current status of Src inhibitors in solid tumor malignancies. Oncologist. (2011) 16:566–78. doi: 10.1634/theoncologist.2010-0408
37. Gangadhar TC, Clark JI, Karrison T, Gajewski TF. Phase II study of the Src kinase inhibitor saracatinib (AZD0530) in metastatic melanoma. Invest New Drugs. (2013) 31:769–73. doi: 10.1007/s10637-012-9897-4
38. Chen H-Y, Chen R-H. Cullin 3 ubiquitin ligases in cancer biology: functions and therapeutic implications. Front Oncol. (2016) 6:113. doi: 10.3389/fonc.2016.00113
39. Cullinan SB, Gordan JD, Jin J, Harper JW, Diehl JA. The Keap1-BTB protein is an adaptor that bridges Nrf2 to a Cul3-based E3 ligase: oxidative stress sensing by a Cul3-Keap1 ligase. Mol Cell Biol. (2004) 24:8477–86. doi: 10.1128/MCB.24.19.8477-8486.2004
40. Eggler AL, Small E, Hannink M, Mesecar AD. Cul3-mediated Nrf2 ubiquitination and antioxidant response element (ARE) activation are dependent on the partial molar volume at position 151 of Keap1. Biochem J. (2009) 422:171–80. doi: 10.1042/BJ20090471
41. Ma Q, He X. Molecular basis of electrophilic and oxidative defense: promises and perils of Nrf2. Pharmacol Rev. (2012) 64:1055–81. doi: 10.1124/pr.110.004333
42. Singh A, Misra V, Thimmulappa RK, Lee H, Ames S, Hoque MO, et al. Dysfunctional KEAP1-NRF2 interaction in non-small-cell lung cancer. PLoS Med. (2006) 3:e420. doi: 10.1371/journal.pmed.0030420
43. Ohta T, Iijima K, Miyamoto M, Nakahara I, Tanaka H, Ohtsuji M, et al. Loss of Keap1 function activates Nrf2 and provides advantages for lung cancer cell growth. Cancer Res. (2008) 68:1303–9. doi: 10.1158/0008-5472.CAN-07-5003
44. Tian B, Lu Z-N, Guo X-L. Regulation and role of nuclear factor-E2-related factor 2 (Nrf2) in multidrug resistance of hepatocellular carcinoma. Chem Biol Interact. (2018) 280:70–6. doi: 10.1016/j.cbi.2017.12.014
45. Eichenmüller M, Trippel F, Kreuder M, Beck A, Schwarzmayr T, Häberle B, et al. The genomic landscape of hepatoblastoma and their progenies with HCC-like features. J Hepatol. (2014) 61:1312–20. doi: 10.1016/j.jhep.2014.08.009
46. Martinez VD, Vucic EA, Pikor LA, Thu KL, Hubaux R, Lam WL. Frequent concerted genetic mechanisms disrupt multiple components of the NRF2 inhibitor KEAP1/CUL3/RBX1 E3-ubiquitin ligase complex in thyroid cancer. Mol Cancer. (2013) 12:124. doi: 10.1186/1476-4598-12-124
47. Loignon M, Miao W, Hu L, Bier A, Bismar TA, Scrivens PJ, et al. Cul3 overexpression depletes Nrf2 in breast cancer and is associated with sensitivity to carcinogens, to oxidative stress, and to chemotherapy. Mol Cancer Ther. (2009) 8:2432–40. doi: 10.1158/1535-7163.MCT-08-1186
48. Kim H, Frederick DT, Levesque MP, Cooper ZA, Feng Y, Krepler C, et al. Downregulation of the ubiquitin ligase RNF125 underlies resistance of melanoma cells to BRAF inhibitors via JAK1 deregulation. Cell Rep. (2015) 11:1458–73. doi: 10.1016/j.celrep.2015.04.049
49. Saei A, Palafox M, Benoukraf T, Kumari N, Jaynes PW, Iyengar PV, et al. Loss of USP28-mediated BRAF degradation drives resistance to RAF cancer therapies. J Exp Med. (2018) 215:1913–28. doi: 10.1084/jem.20171960
50. Smit MA, Maddalo G, Greig K, Raaijmakers LM, Possik PA, van Breukelen B, et al. ROCK1 is a potential combinatorial drug target for BRAF mutant melanoma. Mol Syst Biol. (2014) 10:772. doi: 10.15252/msb.20145450
51. Boulter E, Garcia-Mata R, Guilluy C, Dubash A, Rossi G, Brennwald PJ, et al. Regulation of Rho GTPase crosstalk, degradation and activity by RhoGDI1. Nat Cell Biol. (2010) 12:477–83. doi: 10.1038/ncb2049
52. Genau HM, Huber J, Baschieri F, Akutsu M, Dötsch V, Farhan H, et al. CUL3-KBTBD6/KBTBD7 ubiquitin ligase cooperates with GABARAP proteins to spatially restrict TIAM1-RAC1 signaling. Mol Cell. (2015) 57:995–1010. doi: 10.1016/j.molcel.2014.12.040
Keywords: melanoma, forward genetic screen, MAPKi resistance, CUL3 ubiquitin ligase, Rac1, Src inhibitor
Citation: Vanneste M, Feddersen CR, Varzavand A, Zhu EY, Foley T, Zhao L, Holt KH, Milhem M, Piper R, Stipp CS, Dupuy AJ and Henry MD (2020) Functional Genomic Screening Independently Identifies CUL3 as a Mediator of Vemurafenib Resistance via Src-Rac1 Signaling Axis. Front. Oncol. 10:442. doi: 10.3389/fonc.2020.00442
Received: 19 December 2019; Accepted: 12 March 2020;
Published: 03 April 2020.
Edited by:
Deborah Lang, Boston University, United StatesReviewed by:
Emily Avitan-hersh, Rambam Health Care Campus, IsraelPieter Johan Adam Eichhorn, National University of Singapore, Singapore
Copyright © 2020 Vanneste, Feddersen, Varzavand, Zhu, Foley, Zhao, Holt, Milhem, Piper, Stipp, Dupuy and Henry. This is an open-access article distributed under the terms of the Creative Commons Attribution License (CC BY). The use, distribution or reproduction in other forums is permitted, provided the original author(s) and the copyright owner(s) are credited and that the original publication in this journal is cited, in accordance with accepted academic practice. No use, distribution or reproduction is permitted which does not comply with these terms.
*Correspondence: Adam J. Dupuy, YWRhbS1kdXB1eUB1aW93YS5lZHU=; Michael D. Henry, bWljaGFlbC1oZW5yeUB1aW93YS5lZHU=
†These authors have contributed equally to this work
 Marion Vanneste
 Charlotte R. Feddersen
 Afshin Varzavand3
 Elliot Y. Zhu
 Lei Zhao
 Robert Piper
 Adam J. Dupuy
 Michael D. Henry