
95% of researchers rate our articles as excellent or good
Learn more about the work of our research integrity team to safeguard the quality of each article we publish.
Find out more
ORIGINAL RESEARCH article
Front. Oncol. , 17 April 2019
Sec. Cancer Imaging and Image-directed Interventions
Volume 9 - 2019 | https://doi.org/10.3389/fonc.2019.00272
This article is part of the Research Topic Advances in Label Free Tissue Imaging with Laser Scanning Microscopy Techniques View all 8 articles
 Danielle Tokarz1
 Richard Cisek1
 Ariana Joseph1
 Ahmad Golaraei2,3,4
 Kamdin Mirsanaye2,3
 Serguei Krouglov2,3
 Sylvia L. Asa5
 Brian C. Wilson4,6*
 Virginijus Barzda2,3*
Thin tissue sections of normal and tumorous pancreatic tissues stained with hematoxylin and eosin were investigated using multiphoton excitation fluorescence (MPF), second harmonic generation (SHG), and third harmonic generation (THG) microscopies. The cytoplasm, connective tissue, collagen and extracellular structures are visualized with MPF due to the eosin stain, whereas collagen is imaged with endogenous SHG contrast that does not require staining. Cellular structures, including membranous interfaces and nuclear components, are seen with THG due to the aggregation of hematoxylin dye. Changes in the collagen ultrastructure in pancreatic cancer were investigated by a polarization-sensitive SHG microscopy technique, polarization-in, polarization-out (PIPO) SHG. This involves measuring the orientation of the linear polarization of the SHG signal as a function of the linear polarization orientation of the incident laser radiation. From the PIPO SHG data, the second-order non-linear optical susceptibility ratio, χ(2)zzz'/χ(2)zxx', was obtained that serves as a structural parameter for characterizing the tissue. Furthermore, by assuming C6 symmetry, an additional second-order non-linear optical susceptibility ratio, χ(2)xyz'/χ(2)zxx', was obtained, which is a measure of the chirality of the collagen fibers. Statistically-significant differences in the χ(2)zzz'/χ(2)zxx' values were found between tumor and normal pancreatic tissues in periductal, lobular, and parenchymal regions, whereas statistically-significant differences in the full width at half maximum (FWHM) of χ(2)xyz'/χ(2)zxx' occurrence histograms were found between tumor and normal pancreatic tissues in periductal and parenchymal regions. Additionally, the PIPO SHG data were used to determine the degree of linear polarization (DOLP) of the SHG signal, which indicates the relative linear depolarization of the signal. Statistically-significant differences in DOLP values were found between tumor and normal pancreatic tissues in periductal and parenchymal regions. Hence, the differences observed in the χ(2)zzz'/χ(2)zxx' values, the FWHM of χ(2)xyz'/χ(2)zxx' values and the DOLP values could potentially be used to aid pathologists in diagnosing pancreatic cancer.
Pancreatic cancer is currently the third-leading cause of death from cancer in the USA (1). It is rarely detected at an early stage, since symptoms are often not present until the cancer has spread to other organs, thereby making it one of the deadliest cancers. A diagnosis of cancer is confirmed by visualizing a stained thin section of tissue obtained at biopsy or surgical resection using bright-field microscopy. The initiation of cancer has been attributed to the progressive accumulation of somatic mutations in epithelial cells (2). In addition, recent studies also implicate the tumor microenvironment, including the extracellular matrix (ECM), blood vasculature and inflammatory cells and fibroblasts, in cancer promotion (3–7). During cancer initiation and progression, mechanisms responsible for ensuring normal organ development and function are deregulated, leading to ECM disorganization (8), so that a technique that identifies and quantifies structural details in the ECM as well as permits the distinction of cells present in the ECM would improve cancer diagnosis.
Collagen, the most abundant protein in the ECM, gives rise to strong second harmonic generation (SHG) signals without staining (9–14), so that the collagen distribution within the pancreatic tissue microenvironment can be visualized with SHG microscopy (15–17). Cells present in the ECM, and stained with standard histological dyes such as hematoxylin and eosin (H&E), give rise to strong multiphoton excitation fluorescence (MPF) and third harmonic generation (THG) signals (18, 19). Therefore, quantification of nuclei shape and size can be performed with THG microscopy (19, 20). Additionally, polarization-sensitive SHG microscopy can be performed to extract collagen structural information (21–30). Previously, polarization-sensitive SHG microscopy has been used to determine structural differences in normal and malignant breast tissue (31–33), models of ovarian cancer (34–37), colon cancer (38), non-small cell lung carcinoma (39), squamous-cell carcinoma (40), and follicular variant papillary thyroid carcinoma, as well as classical papillary thyroid carcinoma (41, 42). Of those studies, malignant breast tissue (32), non-small cell lung carcinoma (39), and thyroid carcinoma (41, 42) were performed using polarization-in, polarization-out (PIPO) SHG microscopy. Currently, faster polarization-sensitive SHG microscopy techniques are being developed with the use of liquid-crystal (43) and electro-optic modulators (44, 45) or through the use of multiple detectors to deduce Stokes parameters (46–48). These techniques are promising for dynamic studies.
In this paper, SHG, MPF, THG, and polarization-sensitive SHG microscopy are used to visualize normal and tumorous pancreatic tissue. The SHG intensities and polarization parameters related to the structure of collagen are extracted including the χ(2)zzz'/χ(2)zxx' value associated with the distribution of fibers, as well as the χ(2)xyz'/χ(2)zxx' value related to the chiral structure of collagen. Additionally, the degree of linear polarization (DOLP) of SHG associated with the presence of disorder of collagen fibers is determined. The THG intensities of cells present in normal and tumorous pancreatic tissues are also measured. The study investigates the possibility of whether pancreatic cancer diagnosis by identifying cancer cells using THG imaging or polarization-resolved SHG imaging of the extracellular matrix is viable. For this, the SHG and THG intensities as well as the SHG polarization parameters in tumor tissue were compared with those in three distinct regions in normal pancreatic tissue all commonly found in a single tissue section. The architecture of normal pancreatic tissue consists of ducts, fibrous septa that delineate lobes and lobules, and parenchyma composed of acinar cells and scattered endocrine cells; where each tissue type has a distinct biological function. Due to the varying architecture of these units, it is important to compare any differences in the SHG and THG intensities, and the SHG polarization parameters amongst the normal tissue to understand their variability across normal tissue elements before comparing them to those measured from tumor taken from the same area of the pancreas. In this study, all tumors were adenocarcinomas that originate from ducts or ductules but infiltrate to involve all components of the pancreas. Other tumors that originate in pancreas may have different properties and a future study of in situ tumor is likely needed to determine whether the tumor tissue retains a structural remnant of its originating tissue.
Samples of normal human pancreas from five patients and pancreatic ductal adenocarcinoma tissue samples from ten patients were obtained with informed consent and institutional approval (University Health Network Toronto, Canada). The tissues were handled as per standard clinical histology protocols. Thin sections (5 μm) were cut from formalin-fixed paraffin-embedded tissues, mounted on glass slides and stained with H&E for histopathologic analysis. All slides were scanned at ×20 magnification using a whole-slide scanner (ScanScope XT: Leica Biosystems, Germany).
In each slide, 110 × 110 μm regions of interest, as identified by a pathologist (S.L.A), were scanned. Identification was performed by assessing the tissue architecture and cytology of the tumor cells in the high resolution bright-field microscopy images. A total of 47 tumor and 51 normal regions were imaged to determine quantitative differences between tumor and normal tissue. Two-tailed t-tests of statistical significance were performed.
A custom-built Yb:KGW laser operating at 1028 nm, 14.3 MHz repetition rate and ~450 fs pulse duration (49) was used for MPF, SHG and THG imaging. This was coupled to a custom-built non-linear optical microscope, described previously (50, 51). Briefly, galvanometric scanning mirrors (VM1000, Cambridge Technology, USA) were used to raster scan the beam through a 0.75 numerical aperture (NA) air objective lens (Plan-Apochromat 20×, Carl Zeiss AG, Germany) that does not alter polarization at up to 10 frames per second. MPF, SHG and THG signals were collected in transmission mode through a custom-built 0.85 NA collection objective lens (Omex Technologies, USA). A pulse energy of ~0.05 nJ was used for MPF imaging and a pulse energy of ~1 nJ was used for SHG and THG imaging.
For the MPF channel, the 525–630 nm band was collected (FF01-578/105 filter, Semrock Inc., USA), which included mostly eosin fluorescence. SHG was filtered with an interference filter centered at 514.5 nm with 10 nm bandwidth (F10-514.5, CVI Laser Optics, USA). For both MPF and SHG imaging, the intense excitation light requires additional filtering using a Schott color glass filter (BG39, CVI Laser Optics, USA). THG signals were selected by a single bandpass interference filter of 340 nm with 10 nm bandwidth (F10-340, CVI Laser Optics, USA). The signals were measured using single-photon-counting detectors (H7421-40, Hamamatsu Photonics K.K., Japan).
For polarization measurements of SHG signals, the polarization-in, polarization-out (PIPO) technique was used, as previously described (52). Briefly, the microscope was modified by addition of a polarization-state generator (PSG), consisting of a linear polarizer (IR 1100 BC4, Laser Components, Germany) followed by a half-wave plate (532GR-42, Comar Optics Ltd., United Kingdom) placed immediately before the excitation objective lens for rotation of the incident laser polarization. To measure the polarization of the SHG signal, a polarization-state analyzer (PSA) was used, consisting of a linear polarizer (10LP-VIS-B, Newport Corporation, USA) located after the collection objective lens. A typical PIPO SHG measurement consisted of recording an SHG image at 9 emission polarization angles for each of 9 half-wave plate angles. Every 9 images an additional image was obtained at reference polarizer and analyzer angles as a control. A pulse energy of ~0.5 nJ was used for PIPO SHG imaging. To measure the variation in SHG intensity between normal and tumor tissues, the PSG was modified by adding a quarter-wave plate (WPQ05M-1064, Thorlabs, Inc., USA) just before the excitation objective lens in order to obtain circularly polarized light.
The second-order non-linear optical susceptibility tensor components ratio of collagen fibers was determined from PIPO SHG measurements as described previously (52, 53). Briefly, a laboratory Cartesian coordinate system (XYZ) was defined with respect to the principal propagation direction of the laser (Y), where XZ is defined as the image plane. The average orientation of collagen fibers in a voxel was defined by modified spherical angles, where δ is the average in-plane fiber orientation measured from the Z-axis, and α is the out-of-plane tilt angle of the fiber.
Assuming C6 symmetry, the SHG intensity can be described as a function of the laser electric field polarization orientation (θ) and the orientation of the analyzer (ϕ) (54):
The primed coordinate denotes the molecular susceptibility projected onto the image plane. Equation (1) shows that 3 second-order non-linear optical susceptibility tensor component ratios of an arbitrarily oriented fiber could be deduced from PIPO SHG measurements. It was assumed that χ(2)xxz'/χ(2)zxx' = 1 in order to reduce the free-parameter space for more accurate fitting, and is valid as long as collagen behaves as rod-like structures with a dominant χ(2)zzz (55). The molecular second-order non-linear optical susceptibility tensor component ratios (χ(2)zzz/χ(2)zxx and χ(2)xyz/χ(2)zxx) of an arbitrarily oriented fiber at an angle α from the imaging plane is related to the measured susceptibility ratios (R or χ(2)zzz'/χ(2)zxx' and C or χ(2)xyz'/χ(2)zxx', respectively) as:
The equations show that at low α angles, R is representative of its molecular counterpart, while the measured C parameter would be near 0, conversely larger measured C values, closer to their molecular counterparts are only expected from fibers at higher α. Alternatively, when non-chiral cylindrical (C6v) symmetry is assumed, χ(2)xyz'/χ(2)zxx' = 0 in Equation (1) (52, 53). In addition to extracting the R and C values, a third parameter known as the degree of linear polarization (DOLP) was extracted from:
Stokes parameters, s0, s1 and s2, describe the SHG polarization, defined as: s0 = I0+I90, s1 = I0−I90, and s2 = I45−I−45, where Ia is the SHG intensity at the analyzer angle a. According to double-Stokes-Mueller polarimetry theory (56), a measurement of the DOLP depends on the angle between the incident polarization of the laser and the measured collagen fiber angle (δ). When the laser polarization orientation is 90° from the collagen axis, the SHG signal intensity is reduced and noise dominates the signal, causing the DOLP to be unreliable. However, meaningful data were obtained by averaging together DOLP measurements at 8 incident laser polarizations (0, 22.5, 45, 67.5, 90, 112.5, 135, and 157.5°), and for each one, two DOLP calculations were averaged, one using measurements at analyzer angles 0, 45, 90, and 135° and another at 22.5, 67.5, 112.5, and 157.5°. Analysis and fitting of PIPO SHG data with Equations (1)–(3) were performed using custom MATLAB (The Mathworks, Inc.) software. Since the tissues were thin (5 μm), birefringence was neglected (53).
H&E stained histopathology sections of normal and tumorous human pancreatic tissue were imaged with MPF, SHG and THG microscopy (Figure 1). In general, the MPF signal from H&E stained tissues visualizes the entire extracellular matrix due to the eosin staining (Figures 1B,G,L,Q). The SHG signal is generated intrinsically from collagen (Figures 1C,H,M,R), while the THG signal is predominantly generated by hemalum complexes from chromatin-bound hematoxylin (19). Hence, THG visualizes nuclear material, including nucleoli and the nuclear envelope.
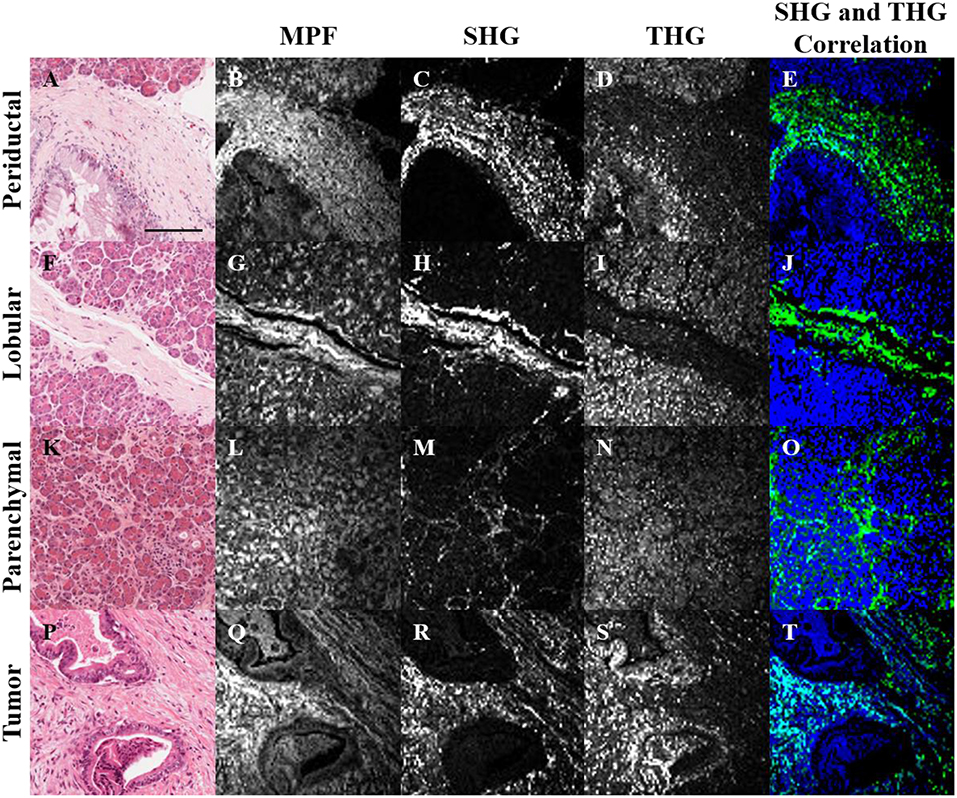
Figure 1. Bright-field (A,F,K,P), MPF (B,G,L,Q), SHG (C,H,M,R), and THG (D,I,N,S) images of periductal (A–E), lobular (F–J) and parenchymal (K–O) regions of normal pancreas, as well as tumor tissue (P–T). SHG and THG images were correlated (E,J,O,T), where regions with correlation between SHG and THG are visualized in cyan, while uncorrelated SHG and THG are visualized in green and blue, respectively. The scale bar (in A) represents 125 μm.
Structural cross-correlation image analysis between the 3 imaging modalities was performed using an overlap and threshold algorithm (57, 58). In normal tissue, the SHG and THG signals were largely uncorrelated (Figures 1E,J,O), but more correlation was observed in tumor (Figure 1T), likely due to the increased content of chromatin in the nuclei of collagenous tumor regions. Further rigorous analysis is needed in order to quantify and determine the statistical significance of this observation. Analysis of the correlation between MPF and the other signals was not useful, since the MPF from eosin is not selective for collagen or nuclei (Figures 1D,I,N,S).
Representative images of the SHG intensity of collagen in the normal periductal, lobular, and parenchymal tissues and in tumor are shown in Figures 2A–D. The values are independent of the fiber orientation angle, δ, since circularly polarized laser light was used. Furthermore, in order to perform valid intensity comparisons, identical laser powers and pixel dwell times were used. In general, the SHG intensity of periductal collagen (3,250 ± 1,750 photon counts: Figure 2A) was the highest, followed by lobular (2,250 ± 1,500: Figure 2B) and parenchymal (900 ± 700: Figure 2C) tissue. The higher SHG intensity of periductal and lobular collagen is attributed to the thick and densely arranged collagen around ducts and lobes as compared to the parenchymal region where the collagen fibers are thinner and sparsely arranged (59), although collagen disorder in the focal volume may also play a role. The SHG intensity of collagen in tumor (1,700 ± 800: Figure 2D) was less than in periductal and lobular regions and typically higher than parenchymal collagen however, a statistically-significant difference was not observed.
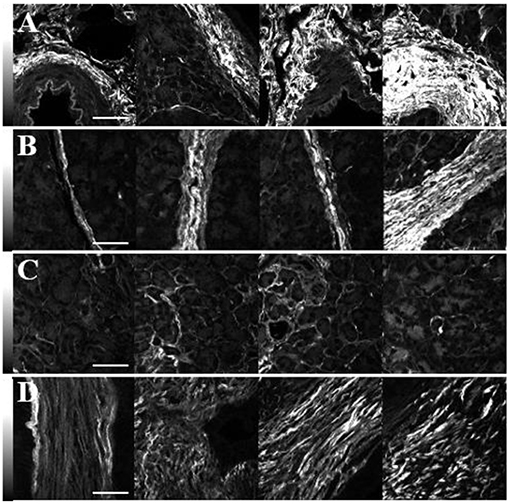
Figure 2. SHG intensity comparison of collagen in the periductal (A), lobular (B) and parenchymal (C) regions of normal pancreas as well as in tumor (D). The imaging laser was circularly polarized and identical conditions were used for all the images. The scale bars represent 50 μm, and the intensity scale bars represent the SHG signal in each pixel.
Although variations of the highest SHG intensities are easily visualized in Figure 2, in each tissue type, the SHG intensity is highly variable. For example, the row of images in Figure 2B shows intense SHG intensity from the thick lobular collagenous region while parenchymal collagen, next to the lobular collagen, has significantly lower intensities, complicating diagnosis by using SHG intensity. Hence, measurements of the ultrastructure of collagen in normal and cancerous human pancreas tissue were performed via polarization-sensitive SHG measurements.
Figure 3 shows typical results of PIPO SHG imaging of periductal, lobular, parenchymal, and tumor tissues. These were analyzed using C6v symmetry, revealing for each pixel the structural parameter, R, which depends on several factors including: the ultrastructure of individual collagen fibers, the collagen disorder within the laser beam focal volume and the tilt angle, α, between the image plane and the collagen fibers Equation (2). Previously, R has been investigated in collagen of different animal species, including in human normal and tumor tissues to quantify the levels of collagen disorder (32, 39, 42). The R value ranges from ~1.1 observed from well-ordered collagen in tibia (53) to a theoretical maximum of 3 for the most disordered structures (with the assumption that χ(2)xxz'/χ(2)zxx' = 1). The maps of the fitted R values for typical normal and tumor pancreas tissue samples are seen in Figure 3 column 3, while the adjacent graphs in column 4 indicate the corresponding R-values occurrence histograms from which the mean R values as well as the width of the distribution can be calculated, as summarized in Table 1. The mean R values in normal periductal, lobular, and parenchymal pancreas were significantly smaller than in tumor (p < 0.05). The histogram widths were generally larger for normal tissue than tumor tissue, where those of periductal and lobular regions were significantly larger than those of tumor tissue (p < 0.02), indicating that the tumor tissue has a narrower collagen orientation distribution.
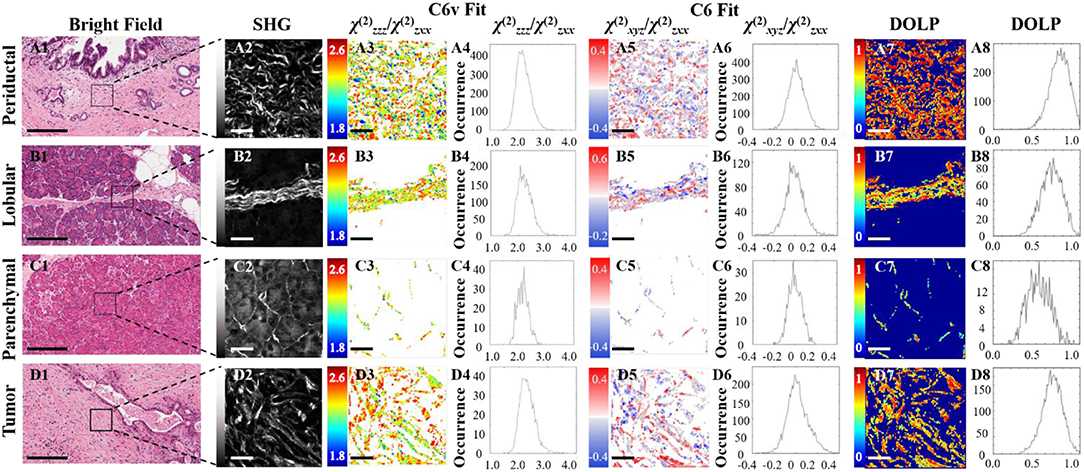
Figure 3. PIPO SHG of collagen in normal periductal (A), lobular (B) and parenchymal (C) pancreas tissues, and in pancreatic cancer (D). Bright-field images (A1,B1,C1,D1) where the scale bar represents 200 μm, and the corresponding SHG intensity images (A2,B2,C2,D2) of the regions of interest are shown, together with color-coded maps of the fitted R values (A3,B3,C3,D3) assuming C6v symmetry and the occurrence histograms of the R values (A4,B4,C4,D4) where the scale bar represents 25 μm. Color-coded maps of the fitted C values (A5, B5, C5, D5) and their occurrence histograms (A6,B6,C6,D6) assuming C6 symmetry are also shown, along with maps of the extracted DOLP values (A7,B7,C7,D7) and occurrence histograms (A8,B8,C8,D8) where the scale bar represents 25 μm.
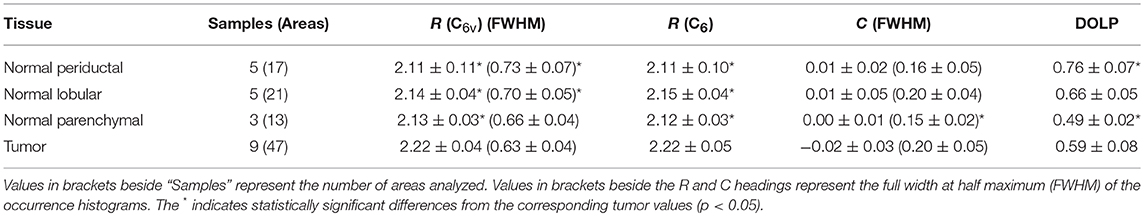
Table 1. R, C, and corresponding DOLP values (mean ± standard deviation) assuming C6v symmetry and C6 symmetry.
The polarization-sensitive SHG measurements were also analyzed using the more general C6 symmetry, in order to evaluate whether the resultant additional chiral fitting component, C, would be informative in the characterization of pancreatic collagen. Fitting using Equation (1) also reveals the R parameter from the C6 fit, which corresponds well with the R parameter from the C6v fit (see Table 1). The fitted C values seen in Figure 3 column 5 visualize the distribution of the collagen polarity, meaning that the two colors indicate if the average tilt of fibers in the focal volume is above or below the imaging plane. These images show that collagen fibers are clustered into small positive and negative polarity regions similarly in normal and tumor samples.
The occurrence histograms of C values using C6 symmetry are shown in Figure 3 column 6. The width of the occurrence histograms is related to the distribution of collagen tilt angles. The histograms were fit with a Gaussian function and the average C values and the occurrence widths were obtained. The average values for normal tissues were not significantly different than that for tumor tissue, which is unsurprising as this parameter depends on the angle at which the tissue was sectioned, which was arbitrary from sample to sample. However, the widths of the C value occurrence histograms for normal parenchymal pancreas was significantly smaller than that of tumor tissue (p < 0.05), while those for normal periductal and parenchymal tissues were significantly different from normal lobular pancreas tissue when the number of regions is taken into account (p < 0.02 and p < 0.001, respectively, see Table 1), likely related to structural variations in the collagen.
Disordered collagen fibers and the presence of small collagen fiber segments within the focal volume may produce depolarized SHG signals, which can be characterized by calculating the DOLP for each pixel of the PIPO SHG images. The influence of birefringence and scattering due to SHG propagation through birefringent tissue regions can be considered as negligible, since the tissue sections are sufficiently thin (5 μm) that there is minimal cumulative retardation of the light. An additional assumption that the scattering of the polarized SHG light is negligible is also reasonable, considering that the tissue samples are all the same thickness (60). The DOLP for normal periductal and parenchymal tissues were significantly different than for tumor (p < 0.002 and p < 0.01, respectively). The values for periductal tissues were higher than for tumor, while the values for parenchymal tissues were lower than for tumor. Lower average DOLP values in tumor tissues have previously been found in classical papillary thyroid carcinoma and follicular variant of papillary thyroid carcinoma tissues (42).
The H&E stained sections were also imaged with THG using linearly polarized laser light. The analysis is valid since the THG intensity images from H&E stain were found to be independent of the orientation of laser polarization (19). Figure 4 shows typical H&E-stained bright-field (Figures 4A1,B1,C1,D1) and THG (Figures 4A3,B3,C3,D3) images and the corresponding SHG images (Figures 4A2,B2,C2,D2) for periductal (A), lobular (B), parenchymal (C) and cancerous (D) tissue regions. The nuclear envelope and nucleoli can be seen in the THG images (Figures 4A3,B3,C3,D3), due to THG enhancement by hematoxylin aggregation (19). Hence, the regions around nuclei in the different tissue types were analyzed using SHG and THG contrast. SHG from collagen lying in between nuclei is seen in Figures 4A2,B2,C2,D2 and appears strongest for periductal tissue (A), indicating higher collagen density in the matrix around nuclei. Parenchymal tissue showed lower SHG intensity, indicating reduced collagen density, while tissue surrounding nuclei in lobular and tumor tissues had the lowest collagen density. The nuclei within normal periductal, lobular and parenchymal pancreas tissues appear round and small (Figures 4A3,B3,C3), while those within tumor cells appear elongated and larger (Figure 4D3). We approximate nuclei as ellipses, and measured the length of the long axis (L) and the short axis (S) of the nuclei manually using imaging software (ImageJ 1.52a, NIH), and ellipticity (e) was calculated as: . The average ellipticity was statistically-significantly larger for nuclei in the tumor regions (2.6 ± 0.4) compared the periductal (1.7 ± 0.1), lobular (1.6 ± 0.1), and parenchymal (1.6 ± 0.2) regions of normal tissue (p < 0.01, p < 0.002, and p < 0.01, respectively, based on the number of samples). There is not a significant difference in these parameters between nuclei imaged in the periductal, lobular, and parenchymal regions of normal tissue. The nuclear shape and size are easily observed with THG, with essentially no background signal from the extracellular matrix and thus, THG imaging could be used for automated analysis of nuclear size and shape for early cancer detection. The THG intensity was also compared between the different types of tissue, but there was no statistically-significant difference between normal (2,300 ± 1,000) periductal, lobular or parenchymal tissues compared with tumor (3,000 ± 1,500).
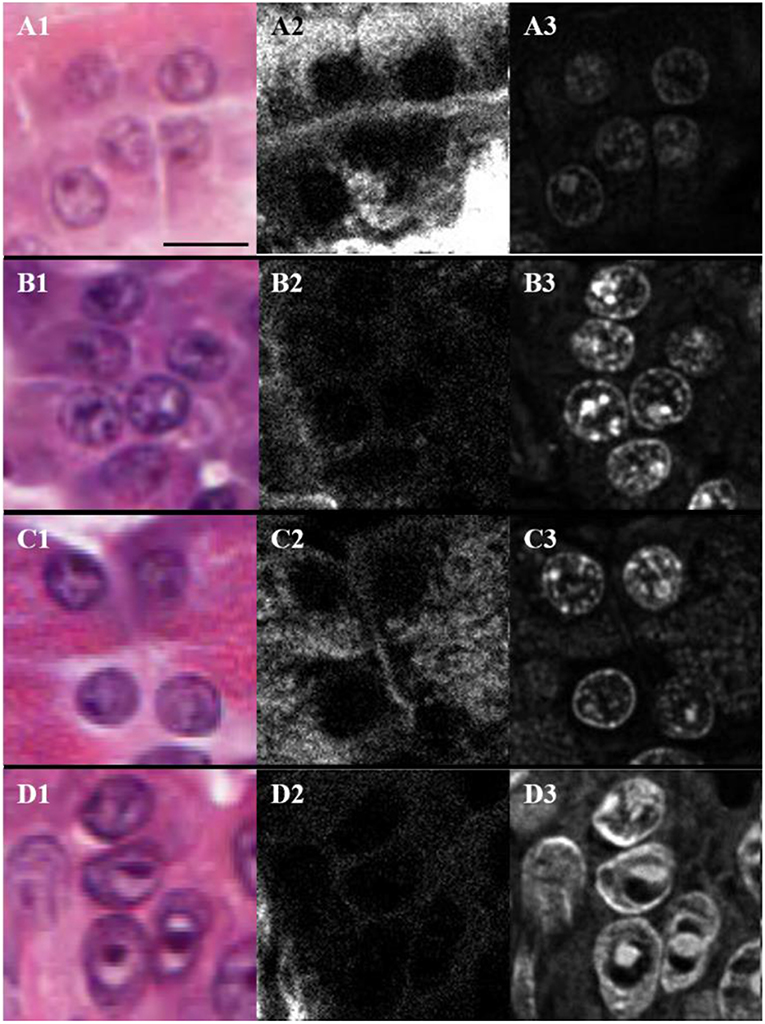
Figure 4. Bright-field (A1,B1,C1,D1), SHG (A2,B2,C2,D2), and THG (A3,B3,C3,D3) images of nuclei present in the periductal (A), lobular (B) and parenchymal (C) regions of normal pancreas as well as in tumor (D) where the scale bar represents 10 μm.
Quantitative polarization-resolved SHG values can be used to distinguish between normal and tumor pancreatic tissues. In particular, normal periductal, lobular and parenchymal tissues are significantly different from tumor tissue, as indicated by their R values. Additionally, periductal and lobular tissues are significantly different from tumor with respect to the FWHM of R occurrence, while parenchymal tissue is significantly different from tumor considering the FWHM of C occurrence. Moreover, parenchymal and periductal tissues have significantly different DOLP values from tumor tissue. A limitation of the present study was the relatively small number of patient samples available. However, considering instead the number of regions-of-interest measured, the DOLP values would statistically distinguish lobular tissue from tumor, while the FWHM of the C occurrence values would also segregate periductal tissue from tumor. Overall, these results indicate the potential of using polarization SHG parameters for automated cancer diagnosis, for example, by adding PIPO SHG based contrast to histopathology slide scanners, where the SHG parameters for each image pixel in the entire section is determined; regions of concern would then be flagged for pathologist review, based on standardized SHG parameters.
The observed changes in the R values for collagenous tissues have been previously attributed to variations in the amino acid content of the triple helices, the arrangement of the triple helices into fibrils and fibers, and the distribution of fibrils and fibers within the laser focal volume (39). We have previously reported similar variations in R between normal and tumor tissues in human lung (39), breast (32), and thyroid (42), indicative of increased structural disorder with malignancy. The FWHM of the C occurrence parameter is based on the intrinsic chirality of the collagen, but only collagen fibers pointing out of the image plane can have a significant C value, so that the observed variations in this parameter likely originate from different angular distributions of the collagen fibers (54).
Several significant variations in the DOLP values were observed across the normal pancreatic tissue types and distinguishes parenchymal from lobular and periductal tissues. Parenchymal tissues had the lowest DOLP values, even lower than in tumor, indicating the most depolarized SHG. Since the tissue samples are thin, scattering of the laser or SHG light or birefringence that would induce elliptical polarization are unlikely to be the dominant effects. Notably, if birefringence was the cause of the DOLP variation, then periductal or lobular tissue would be expected to show a larger effect, since they both have significantly higher collagen content.
Parenchymal tissue is also significantly different than the other tissues when the number of regions measured is considered, rather than the number of patients. In particular, the FWHM of R occurrence statistically distinguishes parenchymal from lobular and periductal tissues, while the FWHM of C occurrence distinguishes parenchymal from lobular tissues. Interestingly, the R parameter does not distinguish between the different normal tissues, indicating that these have similar fiber ultrastructure. On the other hand, the FWHM of R occurrence distinguishes between the parenchymal, lobular and periductal tissues, showing some disparity in the collagen. Additionally, the FWHM of C occurrence indicates that the ultrastructure of the parenchymal collagen is closer to that of periductal tissue, and that these have differences in collagen fiber angle, α, or chirality as compared to lobular pancreas. The significant DOLP variations, as well as the FWHM of C and R, are attributed to variations in collagen organization in these tissues. It is known that periductal collagen consists of short concentric segments (61) and parenchymal collagen comprises of short segments, whereas lobular collagen appears to consist of long and straight segments. The measurements here indicate that parenchymal collagen may consist of the shortest segments within the laser focal volume, followed closely by periductal collagen. This distinction of collagen between the periductal, lobular and parenchymal regions is surprising and should be investigated further.
An additional independent cancer marker in pathological tissues treated with H&E dyes is the quantification of nuclei size and shape by performing THG imaging. This information could be used by automated algorithms for differentiating cancer cells. By using a laser excitation of 1030 nm, the THG signals at 343 nm have sufficient transmission through glass for efficient detection, as compared with 800 nm laser excitation, commonly used in non-linear optical imaging, which results in THG signal at 267 nm, where glass absorbs the signals. Therefore, with 1030 nm lasers, SHG and THG can be performed simultaneously without severely affecting the imaging parameters and hence, it is beneficial to combine THG in the analysis, allowing correlations in collagen structure with nuclei size and shape for a more robust cancer diagnosis.
Human pancreas tissue samples were successfully imaged by polarization-resolved SHG, MPF, and THG microscopies. Using the several polarization SHG parameters (R, FWHM of C occurrence and DOLP), the normal tissue can be distinguished from tumor tissue. These parameters could be used together for automated cancer detection and as a research tool to understand how the extracellular matrix is formed and evolves with tumor initiation and progression. Further, variations between the collagen structure within normal tissue types were also observed, indicating that collagen structure and ultrastructure vary even within a single organ according to the tissue function. THG microscopy also revealed differences in the nuclear morphology. Combined SHG and THG imaging can be applied for automated cancer detection and can also be used to study the interaction of cancer cells with collagenous structures of the extracellular matrix.
This study was carried out in accordance with the recommendations of the Tri-Council Policy Statement and the University Health Network Research Ethics Board. Additional written consent for this study was not needed to be obtained because the tissues used in this study were collected from a biobank where consent had already been received. The protocol was approved by the University Health Network Research Ethics Board.
DT, RC, SA, BW, and VB: project concept and design. DT, RC, and SA: tissue collection and curation. DT, RC, AJ, and SA: formal analysis. BW and VB: funding acquisition. DT, RC, AG, KM, and SK: methodology. DT, RC, and VB: validation. DT and AJ: visualization. DT, RC, and VB: manuscript writing. DT, RC, AJ, AG, KM, SK, SA, BW, and VB: manuscript editing.
The authors declare that the research was conducted in the absence of any commercial or financial relationships that could be construed as a potential conflict of interest.
This research was supported by the Natural Sciences and Engineering Research Council of Canada (NSERC RGPIN-2017-06923 and DGDND-2017-00099) and the Canadian Institutes of Health Research (CIHR) through a Collaborative Health Research Project (CHRP) grant (CPG-134752 and CHRPJ 462842-14). The authors thank the staff of the Advanced Optical Microscopy Facility at University Health Network for assistance with whole-slide scanning.
2. Bhowmick NA, Neilson EG, Moses HL. Stromal fibroblasts in cancer initiation and progression. Nature. (2004) 432:332–337. doi: 10.1038/nature03096
3. Sternlicht MD, Lochtest A, Sympson CJ, Huey B, Rougier JP, Gray JW, et al. The stromal proteinase MMP3/stromelysin-1 promotes mammary carcinogenesis. Cell. (1999) 98:137–46. doi: 10.1016/S0092-8674(00)81009-0
4. Paszek MJ, Zahir N, Johnson KR, Lakins JN, Rozenberg GI, Gefen A, et al. Tensional homeostasis and the malignant phenotype. Cancer Cell. (2005) 8:241–54. doi: 10.1016/j.ccr.2005.08.010
5. Erler JT, Bennewith KL, Nicolau M, Dornhöfer N, Kong C, Le QT, et al. Lysyl oxidase is essential for hypoxia-induced metastasis. Nature. (2006) 440:1222–6. doi: 10.1038/nature04695
6. Erler JT, Bennewith KL, Cox TR, Lang G, Bird D, Koong A, et al. Hypoxia-induced lysyl oxidase is a critical mediator of bone marrow cell recruitment to form the premetastatic niche. Cancer Cell. (2009) 15:35–44. doi: 10.1016/j.ccr.2008.11.012
7. Levental KR, Yu H, Kass L, Lakins JN, Egeblad M, Erler JT, et al. Matrix crosslinking forces tumor progression by enhancing integrin signaling. Cell. (2009) 139:891–906. doi: 10.1016/j.cell.2009.10.027
8. Lu P, Weaver VM, Werb Z. The extracellular matrix: a dynamic niche in cancer progression. J Cell Biol. (2012) 196:395–406. doi: 10.1083/jcb.201102147
9. Freund I, Deutsch M. Second-harmonic microscopy of biological tissue. Opt Lett. (1986) 11:94–96. doi: 10.1364/OL.11.000094
10. Williams RM, Zipfel WR, Webb WW. Multiphoton microscopy in biological research. Curr Opin Chem Biol. (2001) 5:603–8. doi: 10.1016/S1367-5931(00)00241-6
11. Kim B-M, Eichler J, Da Silva LB. Frequency doubling of ultrashort laser pulses in biological tissues. Appl Opt. (1999) 38:7145–50. doi: 10.1364/AO.38.007145
12. Kim BM, Eichler J, Reiser KM, Rubenchik AM, Da Silva LB. Collagen structure and nonlinear susceptibility: effects of heat, glycation, and enzymatic cleavage on second harmonic signal intensity. Lasers Surg Med. (2000) 27:329–35. doi: 10.1002/1096-9101(2000)27:4<329::AID-LSM5>3.0.CO;2-C
13. Campagnola PJ, Millard AC, Terasaki M, Hoppe PE, Malone CJ, Mohler WA. Three-dimensional high-resolution second-harmonic generation imaging of endogenous structural proteins in biological tissues. Biophys J. (2002) 82:493–508. doi: 10.1016/S0006-3495(02)75414-3
14. Zipfel WR, Williams RM, Christie R, Nikitin AY, Hyman BT, Webb WW. Live tissue intrinsic emission microscopy using multiphoton-excited native fluorescence and second harmonic generation. Proc Natl Acad Sci USA. (2003) 100:7075–80. doi: 10.1073/pnas.0832308100
15. Hu W, Zhao G, Wang C, Zhang J, Fu L. Nonlinear optical microscopy for histology of fresh normal and cancerous pancreatic tissues. PLoS ONE. (2012) 7:e37962. doi: 10.1371/journal.pone.0037962
16. Drifka CR, Eliceiri KW, Weber SM, Kao WJ. A bioengineered heterotypic stroma-cancer microenvironment model to study pancreatic ductal adenocarcinoma. Lab Chip. (2013) 13:3965–75. doi: 10.1039/c3lc50487e
17. Xu J, Chen Y, Chen H, Hong Z, Shi Z, Zhuo S, et al. Identifying the neck margin status of ductal adenocarcinoma in the pancreatic head by multiphoton microscopy. Sci Rep. (2017) 7:4586. doi: 10.1038/s41598-017-04771-w
18. Yu CH, Tai SP, Kung CT, Lee WJ, Chan YF, Liu HL, et al. Molecular third-harmonic-generation microscopy through resonance enhancement with absorbing dye. Opt Lett. (2008) 33:387–9. doi: 10.1364/OL.33.000387
19. Tuer A, Tokarz D, Prent N, Cisek R, Alami J, Dumont DJ, et al. Nonlinear multicontrast microscopy of hematoxylin-and-eosin-stained histological sections. J Biomed Opt. (2010) 15:026018. doi: 10.1117/1.3382908
20. Adur J, Pelegati VB, de Thomaz AA, Baratti MO, Almeida DB, Andrade LALA, et al. Optical biomarkers of serous and mucinous human ovarian tumor assessed with nonlinear optics microscopies. PLoS ONE. (2012) 7:e47007. doi: 10.1371/journal.pone.0047007
21. Freund I, Deutsch M, Sprecher A. Connective tissue polarity. Optical second-harmonic microscopy, crossed-beam summation, and small-angle scattering in rat-tail tendon. Biophys J. (1986) 50:693–712. doi: 10.1016/S0006-3495(86)83510-X
22. Stoller P, Kim BM, Rubenchik AM, Reiser KM, Da Silva LB. Polarization-dependent optical second-harmonic imaging of a rat-tail tendon. J Biomed Opt. (2002) 7:205–14. doi: 10.1117/1.1431967
23. Stoller P, Reiser KM, Celliers PM, Rubenchik AM. Polarization-modulated second harmonic generation in collagen. Biophys J. (2002) 82:3330–42. doi: 10.1016/S0006-3495(02)75673-7
24. Stoller P, Celliers PM, Reiser KM, Rubenchik AM. Quantitative second-harmonic generation microscopy in collagen. Appl Opt. (2003) 42:5209–19. doi: 10.1364/AO.42.005209
25. Williams RM, Zipfel WR, Webb WW. Interpreting second-harmonic generation images of collagen I fibrils. Biophys J. (2005) 88:1377–86. doi: 10.1529/biophysj.104.047308
26. Erikson A, Ortegren J, Hompland T, Davies CD, Lindgren M. Quantification of the second-order nonlinear susceptibility of collagen I using a laser scanning microscope. J Biomed Opt. (2007) 12:1–10. doi: 10.1117/1.2772311
27. Tiaho F, Recher G, Rouède D. Estimation of helical angles of myosin and collagen by second harmonic generation imaging microscopy. Opt Express. (2007) 15:12286–95. doi: 10.1364/OE.15.012286
28. Nadiarnykh O, Campagnola PJ. Retention of polarization signatures in SHG microscopy of scattering tissues through optical clearing. Opt Express. (2009) 17:5794–806. doi: 10.1364/OE.17.005794
29. Gusachenko I, Latour G, Schanne-Klein M-C. Polarization-resolved second harmonic microscopy in anisotropic thick tissues. Opt Express. (2010) 18:19339–52. doi: 10.1364/oe.18.019339
30. Su PJ, Chen WL, Chen YF, Dong CY. Determination of collagen nanostructure from second-order susceptibility tensor analysis. Biophys J. (2011) 100:2053–62. doi: 10.1016/j.bpj.2011.02.015
31. Ambekar R, Lau T-Y, Walsh M, Bhargava R, Toussaint KC. Quantifying collagen structure in breast biopsies using second-harmonic generation imaging. Biomed Opt Express. (2012) 3:2021–35. doi: 10.1364/BOE.3.002021
32. Golaraei A, Kontenis L, Cisek R, Tokarz D, Done SJ, Wilson BC, et al. Changes of collagen ultrastructure in breast cancer tissue determined by second-harmonic generation double stokes-mueller polarimetric microscopy. Biomed Opt Express. (2016) 7:4054–68. doi: 10.1364/BOE.7.004054
33. Okoro C, Kelkar V, Sivaguru M, Emmadi R, Toussaint KC. Second-harmonic patterned polarization-analyzed reflection confocal microscopy of stromal collagen in benign and malignant breast tissues. Sci Rep. (2018) 8:16243. doi: 10.1038/s41598-018-34693-0
34. Tilbury K, Lien CH, Chen SJ, Campagnola PJ. Differentiation of col i and Col III isoforms in stromal models of ovarian cancer by analysis of second harmonic generation polarization and emission directionality. Biophys J. (2014) 106:354–65. doi: 10.1016/j.bpj.2013.10.044
35. Campbell KR, Campagnola PJ. Wavelength-dependent second harmonic generation circular dichroism for differentiation of Col i and Col III isoforms in stromal models of ovarian cancer based on intrinsic chirality differences. J Phys Chem B. (2017) 121:1749–57. doi: 10.1021/acs.jpcb.6b06822
36. Campbell KR, Campagnola PJ. Assessing local stromal alterations in human ovarian cancer subtypes via second harmonic generation microscopy and analysis. J Biomed Opt. (2017) 22:116008. doi: 10.1117/1.JBO.22.11.116008
37. Campbell KR, Chaudhary R, Handel JM, Patankar MS, Campagnola PJ. Polarization-resolved second harmonic generation imaging of human ovarian cancer. J Biomed Opt. (2018) 23:066501. doi: 10.1117/1.JBO.23.6.066501
38. Birk JW, Tadros M, Moezardalan K, Nadyarnykh O, Forouhar F, Anderson J, et al. Second harmonic generation imaging distinguishes both high-grade dysplasia and cancer from normal colonic mucosa. Dig Dis Sci. (2014) 59:1529–34. doi: 10.1007/s10620-014-3121-7
39. Golaraei A, Cisek R, Krouglov S, Navab R, Niu C, Sakashita S, et al. Characterization of collagen in non-small cell lung carcinoma with second harmonic polarization microscopy. Biomed Opt Express. (2014) 5:3562–7. doi: 10.1364/BOE.5.003562
40. Hristu R, Stanciu SG, Tranca DE, Stanciu GA. Improved quantification of collagen anisotropy with polarization-resolved second harmonic generation microscopy. J Biophotonics. (2017) 10:1171–9. doi: 10.1002/jbio.201600197
41. Tokarz D, Cisek R, Golaraei A, Krouglov S, Navab R, Niu C, et al. Tumor tissue characterization using polarization-sensitive second harmonic generation microscopy. Proceedings of SPIE Progress in Biomedical Optics and Imaging.
42. Tokarz D, Cisek R, Golaraei A, Asa SL, Barzda V, Wilson BC. Ultrastructural features of collagen in thyroid carcinoma tissue observed by polarization second harmonic generation microscopy. Biomed Opt Express. (2015) 6:3475–81. doi: 10.1364/BOE.6.003475
43. Lien C-H, Tilbury K, Chen S-J, Campagnola PJ. Precise, motion-free polarization control in Second Harmonic Generation microscopy using a liquid crystal modulator in the infinity space. Biomed Opt Express. (2013) 4:1991–2002. doi: 10.1364/BOE.4.001991
44. Dewalt EL, Sullivan SZ, Schmitt PD, Muir RD, Simpson GJ. Polarization-modulated second harmonic generation ellipsometric microscopy at video rate. Anal Chem. (2014) 86:8448–56. doi: 10.1021/ac502124v
45. Ducourthial G, Affagard JS, Schmeltz M, Solinas X, Lopez-Poncelas M, Bonod-Bidaud C, et al. Monitoring dynamic collagen reorganization during skin stretching with fast polarization-resolved second harmonic generation imaging. J Biophotonics. (2019) e201800336. doi: 10.1002/jbio.201800336. [Epub ahead of print].
46. Mazumder N, Qiu J, Foreman MR, Macias-Romero C, Hu CW, Tsai HR, et al. Polarization-resolved second harmonic generation microscopy with a four-channel Stokes-polarimeter. Opt Express. (2012) 20:14090–14099. doi: 10.1364/OE.20.014090
47. Mazumder N, Qiu J, Foreman MR, Romero CM, Török P, Kao FJ. Stokes vector based polarization resolved second harmonic microscopy of starch granules. Biomed Opt Express. 2013) 4:538–47. doi: 10.1364/BOE.4.000538
48. Mazumder N, Xiang LY, Qiu J, Kao FJ. Investigating starch gelatinization through Stokes vector resolved second harmonic generation microscopy. Sci Rep. (2017) 7:45816. doi: 10.1038/srep45816
49. Major A, Cisek R, Sandkuijl D, Barzda V. Femtosecond Yb:KGd(WO4)2laser with > 100 nJ of pulse energy. Laser Phys Lett. (2009) 6:272–4. doi: 10.1002/lapl.200810127
50. Greenhalgh C, Prent N, Green C, Cisek R, Major A, Stewart B, et al. Influence of semicrystalline order on the second-harmonic generation efficiency in the anisotropic bands of myocytes. Appl Opt. (2007) 46:1852–9. doi: 10.1364/AO.46.001852
51. Carriles R, Schafer DN, Sheetz KE, Field JJJ, Cisek R, Barzda V, Sylvester AW, et al. Imaging techniques for harmonic and multiphoton absorption fluorescence microscopy. Rev Sci Instrum. (2009) 80:10364–71. doi: 10.1063/1.3184828
52. Tuer AE, Krouglov S, Prent N, Cisek R, Sandkuijl D, Yasufuku K, et al. Nonlinear optical properties of type I collagen fibers studied by polarization dependent second harmonic generation microscopy. J Phys Chem B. (2011) 115:12759–69. doi: 10.1021/jp206308k
53. Tuer AE, Akens MK, Krouglov S, Sandkuijl D, Wilson BC, Whyne CM, et al. Hierarchical model of fibrillar collagen organization for interpreting the second-order susceptibility tensors in biological tissue. Biophys J. (2012) 103:2093–105. doi: 10.1016/j.bpj.2012.10.019
54. Golaraei A, Mirsanaye K, Ro Y, Krouglov S, Akens MK, Wilson BC, et al. Collagen chirality and three-dimensional orientation studied with polarimetric second-harmonic generation microscopy. J Biophotonics. (2019) 12:e201800241. doi: 10.1002/jbio.201800241
55. Dailey CA, Burke BJ, Simpson GJ. The general failure of Kleinman symmetry in practical nonlinear optical applications. Chem Phys Lett. (2004) 390:8–13. doi: 10.1016/j.cplett.2004.03.109
56. Samim M, Krouglov S, Barzda V. Double stokes mueller polarimetry of second-harmonic generation in ordered molecular structures. J Opt Soc Am B. (2015) 32:451. doi: 10.1364/JOSAB.32.000451
57. Barzda V, Govindjee Sharkey TD. Non-linear contrast mechanisms for optical microscopy. In: Aartsma TJ, Matysik J, editors. Biophysical Techniques in Photosynthesis II. Dordrecht: Springer. p. 35–54.
58. Cisek R, Prent N, Greenhalgh C, Sandkuijl D, Tuer A, Major A, et al. Multicontrast nonlinear imaging microscopy. In: Yakovlev VV, editor. Biochemical Applications of Nonlinear Optical Spectroscopy. New York, NY: CRC Press. p. 71–102.
59. Longnecker D. Anatomy and histology of the pancreas. Am Pancreat Assoc. (2014) 1:1–26. doi: 10.3998/panc.2014.3
60. Fung KLB, Samim M, Gribble A, Barzda V, Vitkin IA. Monte carlo simulation of polarization-sensitive second-harmonic generation and propagation in biological tissue. J Biophotonics. (2018) 11:e201800036. doi: 10.1002/jbio.201800036
Keywords: collagen, optical pathology, medical imaging, non-linear optical polarimetry, non-linear optical microscopy
Citation: Tokarz D, Cisek R, Joseph A, Golaraei A, Mirsanaye K, Krouglov S, Asa SL, Wilson BC and Barzda V (2019) Characterization of Pancreatic Cancer Tissue Using Multiphoton Excitation Fluorescence and Polarization-Sensitive Harmonic Generation Microscopy. Front. Oncol. 9:272. doi: 10.3389/fonc.2019.00272
Received: 26 November 2018; Accepted: 25 March 2019;
Published: 17 April 2019.
Edited by:
Paolo Bianchini, Istituto Italiano di Tecnologia, ItalyReviewed by:
Nirmal Mazumder, Manipal Academy of Higher Education, IndiaCopyright © 2019 Tokarz, Cisek, Joseph, Golaraei, Mirsanaye, Krouglov, Asa, Wilson and Barzda. This is an open-access article distributed under the terms of the Creative Commons Attribution License (CC BY). The use, distribution or reproduction in other forums is permitted, provided the original author(s) and the copyright owner(s) are credited and that the original publication in this journal is cited, in accordance with accepted academic practice. No use, distribution or reproduction is permitted which does not comply with these terms.
*Correspondence: Brian C. Wilson, YnJpYW4ud2lsc29uQHVobnJlc2VhcmNoLmNh
Virginijus Barzda, dmlyZ2lzLmJhcnpkYUB1dG9yb250by5jYQ==
Disclaimer: All claims expressed in this article are solely those of the authors and do not necessarily represent those of their affiliated organizations, or those of the publisher, the editors and the reviewers. Any product that may be evaluated in this article or claim that may be made by its manufacturer is not guaranteed or endorsed by the publisher.
Research integrity at Frontiers
Learn more about the work of our research integrity team to safeguard the quality of each article we publish.