
94% of researchers rate our articles as excellent or good
Learn more about the work of our research integrity team to safeguard the quality of each article we publish.
Find out more
ORIGINAL RESEARCH article
Front. Oncol., 26 February 2019
Sec. Genitourinary Oncology
Volume 9 - 2019 | https://doi.org/10.3389/fonc.2019.00072
 Rebekah L. Robinson1
 Ashok Sharma1,2
 Shan Bai1
 Saleh Heneidi3Tae Jin Lee1Sai Karthik Kodeboyina1Nikhil Patel3
 Shruti Sharma1,4*
Renal cell carcinomas (RCC) are heterogeneous and can be further classified into three major subtypes including clear cell, papillary and chromophobe. Signal transducer and activator of transcription 3 (STAT3) is commonly hyperactive in many cancers and is associated with cancer cell proliferation, invasion, migration, and angiogenesis. In renal cell carcinoma, increased STAT3 activation is associated with increased metastasis and worse survival outcomes, but clinical trials targeting the STAT3 signaling pathway have shown varying levels of success in different RCC subtypes. Using RNA-seq data from The Cancer Genome Atlas (TCGA), we compared expression of 32 STAT3 regulated genes in 3 RCC subtypes. Our results indicate that STAT3 activation plays the most significant role in clear cell RCC relative to the other subtypes, as half of the evaluated genes were upregulated in this subtype. MMP9, BIRC5, and BCL2 were upregulated and FOS was downregulated in all three subtypes. Several genes including VEGFA, VIM, MYC, ITGB4, ICAM1, MMP1, CCND1, STMN1, TWIST1, and PIM2 had variable expression in RCC subtypes and are potential therapeutic targets for personalized medicine.
Renal cancer is among the top ten most common cancer types globally, and 85% of renal cancers are classified as renal cell carcinomas (RCC) (1, 2). RCC tumors are heterogeneous and can be further classified into subtypes, the most common of which are clear cell (KIRC), papillary (KIRP), and chromophobe (KICH) carcinoma. Earlier studies have shown that Signal transducer and activator of transcription 3 (STAT3) signaling plays an important role in the growth of renal cancers, and increased STAT3 activation has been associated with progression of pathological stages and worse overall survival (3–5). STAT3 is a transcription factor involved in many physiological processes including cell growth, proliferation, inflammation, and apoptosis (6–9). STAT3 is activated by several cytokines and growth factors that signal through glycoprotein 130 (gp130). In response to these signals, members of the Janus-activated kinase (JAK) family phosphorylate STAT3 at Tyr705, which dimerizes STAT3 and translocates it to the nucleus to activate transcription (1, 7). Under normal physiological conditions STAT3 activation is tightly regulated, but in cancer an increase in extracellular signaling or the development of constitutive activity results in the aberrant expression of STAT3 regulated genes (7, 10–12). Current scientific evidence indicates that persistently activated STAT3 plays an important role in tumor onset and progression via mechanisms involving proliferation, invasion, and migration (10, 13, 14). Additionally, it can also promote cancer stem cell self-renewal and differentiation by altering gene expression through epithelial-mesenchymal transition (EMT) phenotypes in cancer cells and by regulating the tumor microenvironment (10, 15). It has also been shown to cooperate with hypoxia-inducible factor 1-alpha (HIF1A) to induce VEGF expression, thus promoting tumor angiogenesis (16).
In this study, we compare and contrast the expression of clinically significant genes involved in the STAT3 pathway in different renal cancer subtypes by analyzing datasets from The Cancer Genome Atlas (TCGA). We explored the most well–characterized 32 STAT3-regulated genes involved in cancer cell invasion (CDH1, ICAM1, ITGB4, ITGB6, MUC1, PTK2, STMN1) (8, 12, 17–19); cell proliferation (CCND1, CCNB1, CDC25A, MYC, PIM1, PIM2, CDK1, CDKN1A, JUN, FOS) (8, 20–22); cell survival (BCL2, BCL2L1, BIRC5, MCL1) (23); angiogenesis (VEGF, HIF1A, FGF2) (8, 24); metastasis (TWIST1, MMP-1,−2,−9, VIM) (8, 12); and inflammation (IL1B, IL6, CSF1) (8, 25) (Figure 1). Then we examined the expression levels of these 32 STAT3-regulated genes in clear cell, papillary, and chromophobe RCC using the TCGA gene expression RNA seq data.
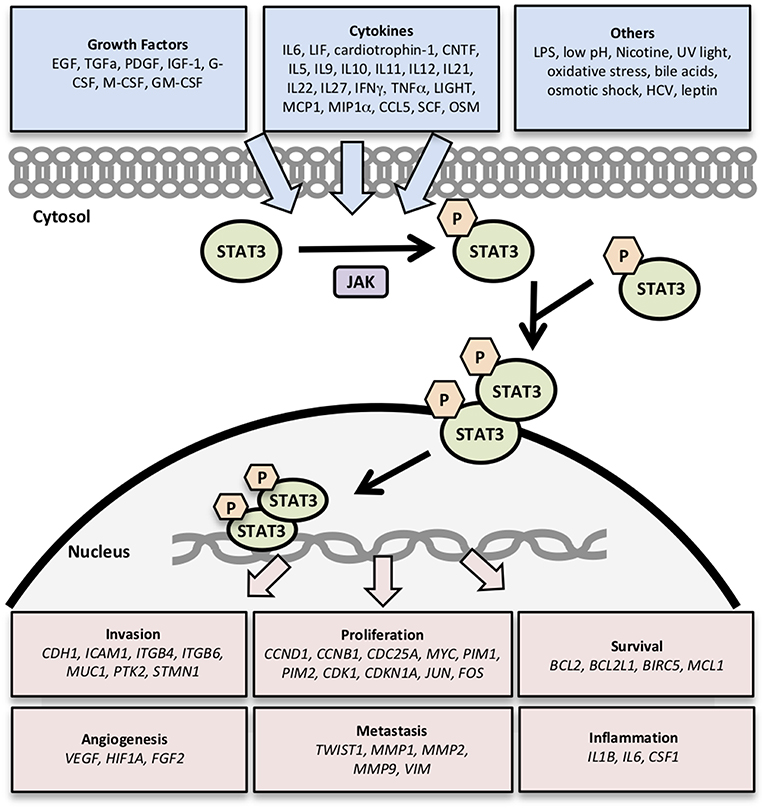
Figure 1. Genes regulated by STAT3 signaling. Activation of STAT3 signaling by growth factors, cytokines, and other stimuli results in the transcription of genes related to cancer cell survival, proliferation, invasion, angiogenesis, metastasis, and inflammation.
The TCGA gene expression RNAseq data (IlluminaHiSeq: log2-normalized_count+1) was downloaded from Xena browser (https://xenabrowser.net/datapages/) for three renal cancer types including clear cell carcinoma (KIRC−533 tumor, 72 normal), papillary carcinoma (KIRP−290 tumor, 32 normal), and chromophobe carcinoma (KICH−66 tumor, 25 normal) (26). Statistical analyses were performed to evaluate the expression levels of 32 STAT3-regulated genes in these RCC subtypes.
All statistical analyses were performed using the R language and environment for statistical computing (R version 3.2.2; R Foundation for Statistical Computing; www.r-project.org). The normalized counts were log2 transformed prior to all statistical analyses to achieve normal distribution. The potential differences in the gene expression between cancer patients and adjacent normal were initially examined using a t-test and Bonferroni correction (p < 0.0016) was used to adjust p-values for multiple testing. Boxplots were created to visualize the distribution of gene expression in cancer patients and adjacent normal. The biomarker potential of individual genes, which refers to the gene's diagnostic power to differentiate cancer patients from respective controls, was assessed using the area under the curve (AUC) of the receiver operating characteristic (ROC) curves.
The expression fold change values (tumor vs. unmatched adjacent normal) for selected 32 STAT3-regulated genes in 3 different renal cancer subtypes are presented in Table 1. Comparisons of significantly upregulated and downregulated genes in the three cancer subtypes relative to normal tissue are shown using Venn diagrams (Figures 2A,B). Interestingly, using significance level α = 0.0016, three genes including MMP9, BIRC5, and BCL2 were significantly upregulated whereas, only one gene (FOS) was significantly downregulated in all three subtypes. Expression of several genes varied substantially between the cancer subtypes suggesting significant differences in STAT3 pathway activation in these three renal cancer subtypes.
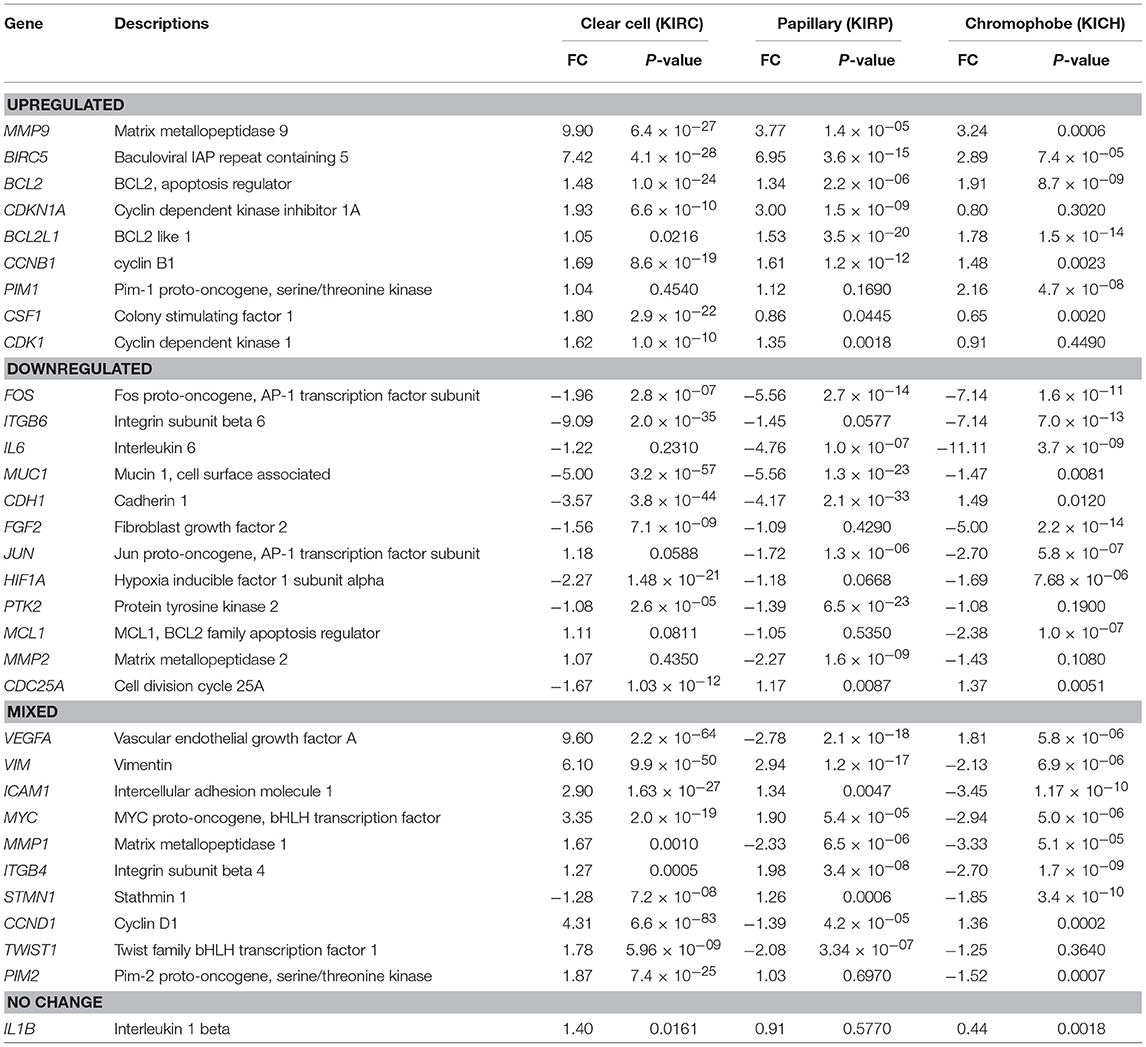
Table 1. STAT3-regulated gene expression fold change across RCC subtypes.
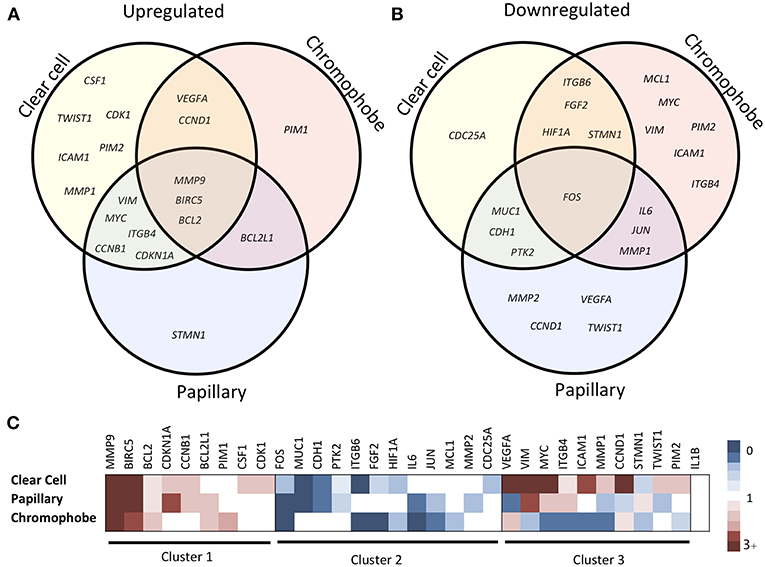
Figure 2. Comparison of STAT3-regulated gene expression changes in three RCC subtypes. Venn diagram showing significantly upregulated (A) and downregulated (B) genes across clear cell, papillary and chromophobe renal cancer subtypes. Heatmap (C) shows gene expression fold change values in tumor as compared to unmatched adjacent normal. Red color represents increased expression, blue represents decreased expression and white represents no significant change.
A total of 16 genes were significantly upregulated and 9 genes were significantly downregulated in clear cell carcinoma. The genes with more than 2-fold upregulation include MMP9 (9.90-fold), VEGFA (9.60-fold), BIRC5 (7.42-fold), VIM (6.10-fold), CCND1 (4.31-fold), MYC (3.35-fold) and ICAM1 (2.90-fold). Six genes including ICAM1 (2.90-fold), PIM2 (1.87-fold), CSF1 (1.80-fold), MMP1 (1.67-fold), TWIST1 (1.78-fold), and CDK1 (1.62-fold) were upregulated only in clear cell, but not in papillary or chromophobe. Five most downregulated genes in clear cell carcinoma include, ITGB6 (−9.09-fold), MUC1 (−5.00-fold), CDH1 (−3.57-fold), HIF1A (−2.27-fold) and FOS (−1.96-fold). Among the downregulated genes CDC25A (−1.67-fold) was downregulated only in clear cell carcinoma but not in other two subtypes.
A total of 21 genes were significantly changed (10 upregulated and 11 downregulated) in papillary renal carcinoma. Genes with greatest upregulation (>2-fold) include BIRC5 (6.95-fold), MMP9 (3.77-fold), VIM (2.94-fold), and CDKN1A (3.00-fold). STMN1 gene was slightly upregulated in papillary (1.26-fold), whereas it was downregulated in clear cell and chromophobe. Genes with more than 2-fold downregulation in papillary include, FOS (−5.56-fold), IL6 (−4.76-fold), MUC1 (−5.56-fold), CDH1 (−4.17-fold), MMP2 (−2.27-fold), VEGFA (−2.78-fold), MMP1 (−2.33-fold), and TWIST1 (−2.08-fold). Of note, among the downregulated genes MMP2, VEGFA, CCND1, and TWIST1 were downregulated only in papillary carcinoma but were either unchanged or upregulated in other two subtypes.
In chromophobe we found significant alterations in the expression of 21 genes (7 upregulated and 14 downregulated). Three genes with more than 2-fold upregulation are BIRC5 (2.89-fold), MMP9 (3.24-fold), and PIM1 (2.16-fold). PIM1 gene was only upregulated in chromophobe and it was unchanged in clear cell and papillary subtypes. Almost half of the STAT3 regulated genes were significantly downregulated in chromophobe. Genes with more than 2-fold downregulation in chromophobe include, FOS (−7.14-fold), ITGB6 (−7.14-fold), IL6 (−11.11-fold), FGF2 (−5.00-fold), JUN (−2.70-fold), MCL1 (−2.38-fold), VIM (−2.13-fold), ICAM1 (−3.45-fold), MYC (−2.94-fold), MMP1 (−3.33-fold), and ITGB4 (−2.70-fold). Among these genes MYC, VIM, ICAM1, and ITGB4 were downregulated only in chromophobe but upregulated in other two subtypes.
Based on the expression patterns, we divided all 32 genes into four groups (up, down, mixed, no change) (Figure 2C). A cluster of 9 genes including MMP9, BIRC5, BCL2, CDKN1A, BCL2L1, CCNB1, PIM1, CSF1, and CDK1 was either upregulated or unchanged but was not downregulated in any subtype. On the other hand, another cluster of 12 genes including FOS, ITGB6, IL6, MUC1, CDH1, FGF2, JUN, HIF1A, PTK2, MCL1, MMP2, and CDC25A was either downregulated or unchanged but was not upregulated in any subtype. Another group of 10 genes including VEGFA, VIM, ICAM1, MYC, MMP1, ITGB4, STMN1, CCND1, TWIST1, and PIM2 had considerable variation between subtypes. For example, VEGFA was upregulated in clear cell (9.60-fold) and chromophobe (1.81-fold) but downregulated in papillary (−2.78-fold) (Figure 3). VIM was upregulated in clear cell (6.10-fold) and papillary (2.94-fold) but downregulated in chromophobe (−2.13-fold). ICAM1 was upregulated in clear cell (2.90-fold), downregulated in chromophobe (−3.45-fold), and not significantly changed in papillary. Similarly, remaining genes of this cluster had a mixed expression pattern as shown in Figure 2C. Only the expression of IL1B was unchanged in all three subtypes.
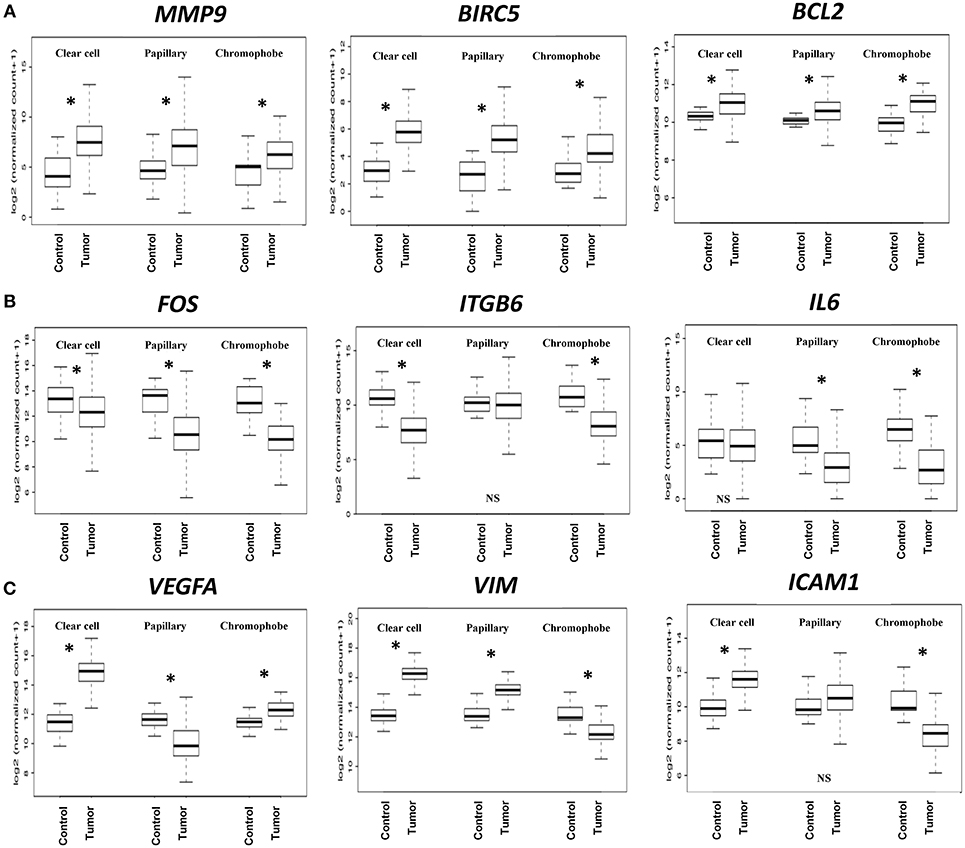
Figure 3. Boxplots of relative gene expression across RCC subtypes. The boxplots represent the distribution of expression in tumor and control samples. (A) MMP9, BIRC5, and BCL2 are significantly upregulated in all three subtypes; (B) FOS, ITGB6, and IL6 genes are either downregulated or not changed; (C) VEGFA, VIM, and ICAM1 have variable expression across subtypes. *p < 0.0016, NS = not significant.
The biomarker potential of the genes was evaluated using the Receiver Operator Characteristic (ROC) analyses using cases and controls. The Area under the Curve (AUC) values for all the genes in the three cancer types are presented in Supplemental Table 1. The ROC curves for some representative genes with the highest AUC values for each renal cancer type are presented in Figure 4. In clear cell, eight genes had an excellent biomarker potential with AUC values > 0.9 (VEGFA: 0.964, VIM: 0.964, CCND1: 0.951, ITGB6: 0.935, BIRC5: 0.934, MUC1: 0.924, CDH1: 0.923, and ICAM1: 0.902). Two genes had AUC values > 0.9 in both papillary (VIM: 0.936, BIRC5: 0.921) and chromophobe (FOS: 0.928, ITGB6: 0.916).
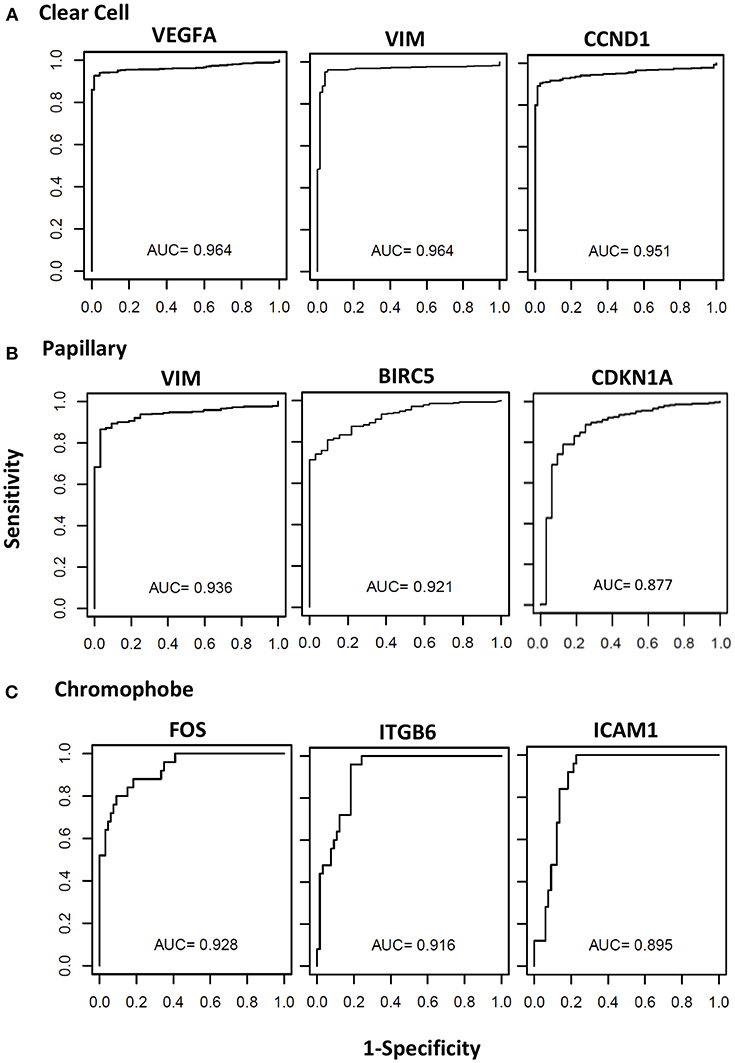
Figure 4. Receiver operating curves (ROC) of STAT3-regualed genes. The diagnostic power of individual genes to differentiate cancer patients and respective controls was assessed using the area under the curve (AUC) of the receiver operating characteristic (ROC) curves. The ROC curves and AUC values of top three performing genes in clear cell (A), papillary (B), and chromophobe (C) are shown.
Renal cell carcinoma is the ninth most common malignancy worldwide, and as many as 25% of RCC patients have metastatic disease at diagnosis. Despite significant improvements in survival over the past decade, patients with stage III and stage IV RCC have 5-year survival rates of only 53 and 8%, respectively (27). Approximately 70% of RCC tumors have clear cell histology, and while it is well-established that loss of the von Hippel-Lindau (VHL) tumor suppressor gene is the common mechanism of tumorigenesis in familial and sporadic clear cell tumors, many other clinically significant gene mutations have been identified and these tumors show significant genetic variability (28, 29). Papillary tumors, which are classified as type I or type II based on tumor histology, account for 10% of RCC tumors, and while familial cases are linked to c-MET mutations the cause of sporadic cases remains unclear (28, 29). Chromophobe tumors account for < 5% of RCC tumors and typically show whole chromosome deletions, though the impact of these losses has not been fully characterized; mutations in PTEN and TP53 have been identified, but they are only present in a minority of cases (28, 29). The majority of both basic science and clinical studies focus mostly on clear cell RCC and exclude other subtypes. Also, despite clear differences in molecular pathogenesis, current treatment guidelines for all types of RCC are the same.
The transcription factor STAT3 is known to be important for renal development and tubulogenesis, and high levels of STAT3 activation have been observed during periods of active kidney growth in newborn mice (30–32). While STAT3 is highly expressed in adult kidney tissue, its activity under normal, healthy conditions is extremely low (33). Because of this high expression, however, STAT3 can be activated very quickly in response to stimuli. In a model of acute kidney injury induced by HgCl2, STAT3 activation in renal tissue has been linked to interleukin-6 (IL-6) signaling; because normal renal tissue does not express the IL-6 receptor, this activity has been linked to IL-6 trans-signaling, which involves signaling through a soluble form of the IL-6 receptor (34).
Additionally, it is well established that increased STAT3 activation correlates with both advanced metastatic disease and worse survival in RCC. Furthermore, the majority of this increased activity is due to overstimulation of STAT3-linked receptors by increased growth factor and cytokine signaling rather than constitutive activation (4). Multi-kinase inhibitors sunitinib and sorafenib target many of these receptors and have shown promise in both in vitro models and clinical trials (35, 36). A clinical trial of both of these drugs in papillary and chromophobe patients showed prolonged progression-free survival, though chromophobe patients showed much better response than papillary (37). Another analysis measuring STAT3 activation across RCC subtypes by detection of phosphorylated STAT3 in tissue microarray showed similar numbers of tumors with activated STAT3 in clear cell and papillary RCC (57–59%), while fewer chromophobe cases (33%) showed STAT3 activation; however, the small sample size and possibility of false negatives due to small tissue core size may limit the usefulness of these conclusions (1).
In the present study, we utilized TCGA gene expression dataset to compare expression of 32 genes that are regulated by STAT3 to both evaluate the STAT3 activation across RCC subtypes and to further analyze the downstream effects of this activation. Overall, our analysis indicates that STAT3 activation plays a pivotal role in clear cell RCC, as 16 of the 32 genes evaluated were upregulated in this subtype compared to only 10 in papillary and 7 in chromophobe. Clear cell and papillary showed the most similarities in gene expression, with 11 genes showing similar expression patterns. For confirmation, we repeated this analysis using Gene Expression Omnibus (GEO) dataset GSE6344 (38), which measured gene expression in clear cell RCC tumors and matched normal tissue. Out of the 16 significantly upregulated genes in our analysis of clear cell RCC, we could confirm the increased expression of 8 genes in the GSE6344 dataset, including VEGFA, BIRC5, VIM, CCND1, MYC, CDKN1A, CDK1, and BCL2. Among the nine downregulated genes in clear cell carcinoma, three gene including STMN1, HIF1A, and MUC1 could be confirmed in this new dataset.
We identified a cluster of 9 genes that were either upregulated or unchanged but not downregulated in any subtype. Three of these genes, including matrix metalloproteinase 9 (MMP9), survivin (BIRC5), and B cell lymphoma 2 (BCL2), were significantly upregulated in all three subtypes. The roles of these genes in RCC have already been well established (39–41). CDKN1A, which encodes the protein p21 that inhibits cell proliferation, was upregulated in clear cell and papillary, and its expression is associated with decreased proliferation in RCC cell lines (42). BCL2L1, of which the major protein product is Bcl-xl, is a well-known inhibitor of apoptosis and was upregulated in papillary and chromophobe RCC. Interestingly, its overexpression is linked to gain or amplification of chromosome 20q, which has been reported in RCC, and STAT3 inhibition has been shown to decrease BCL2L1 expression in RCC cell lines (36, 43, 44). CCNB1 (cyclin B1) was upregulated in clear cell and papillary RCC in our analysis, and its overexpression has been linked to poor survival in all three subtypes of RCC (45). PIM1 was only overexpressed in chromophobe RCC in our analysis, but its overexpression has been reported in many cancers, including RCC, and it has been shown to be a promising therapeutic target using RCC cell lines (46). CDK1 (cyclin-dependent kinase 1) was upregulated in clear cell in our analysis and has shown to be associated with worse survival and recurrence in RCC (47). CSF1 (macrophage colony-stimulating factor) was overexpressed in clear cell RCC in our analysis. Sunitinib, which inhibits many receptors related to STAT3 including the CSF-1 receptor, has been shown to decrease myeloid-derived suppressor cell (MDSC) levels in RCC patients in clinical trial, though it is difficult to determine which specific receptor may be responsible for this effect (48). Interestingly, the small molecule inhibitor specific to the CSF-1 receptor GW2580 showed promise in decreasing MDSC recruitment and function in an in vivo tumor model, and exploration into its effectiveness in clear cell RCC should be further explored (49).
Among another cluster of 10 genes that showed variable expression changes across subtypes (VEGFA, VIM, ICAM1, MYC, MMP1, ITGB4, STMN1, CCND1, TWIST1, PIM2), 9 were upregulated in clear cell (Figure 2). In the papillary subtype, 4 of these genes were upregulated and another 4 were downregulated, whereas in chromophobe 7 of these were downregulated. VEGFA was upregulated in clear cell and chromophobe, but was downregulated in papillary RCC. The role of VEGF in clear cell RCC is well known, and bevacizumab, a VEGF inhibitor, is a well-established therapy for use in combination with erlotinib, a receptor tyrosine kinase inhibitor, to treat advanced metastatic clear cell RCC (50). VIM (vimentin) was upregulated in both clear cell and papillary, but downregulated in chromophobe. Vimentin has been established as a histological marker for distinguishing clear cell from chromophobe RCC, as chromophobe is considered to be negative for vimentin expression as only 2% express vimentin (51). ICAM1 (intracellular adhesion molecule 1) was upregulated in clear cell, unchanged in papillary, and downregulated in chromophobe; while ICAM1 expression is linked to increased leukocyte infiltration of RCC tumors, much is still unknown about endothelial activation and RCC disease progression (52, 53). MYC is known to be upregulated in clear cell and papillary RCC, which is consistent with our analysis (54–56). MYC was downregulated in chromophobe RCC, and to our knowledge MYC expression in chromophobe RCC has not been previously evaluated. MMP1 was upregulated in clear cell, and downregulated in both papillary and chromophobe. Interestingly, a polymorphism causing increased expression of MMP1 has been linked to increased risk of many tumors, including RCC, but the risk is only seen in males, suggesting MMP1 regulation may be sex-dependent (57). ITGB4 (integrin beta 4) was upregulated in both clear cell and papillary, and downregulated in chromophobe. While increased ITGB4 overexpression has been correlated with metastasis in RCC, to our knowledge, the differential expression of ITGB4 across RCC subtypes has never before been reported (58). Interestingly, STMN1 was the only gene to be upregulated in papillary, but downregulated in both clear cell and chromophobe. In an immunohistochemistry analysis of RCC tumors, all three subtypes stained positively for stathmin, but papillary tumors showed the highest percentage of strongly positive staining (59). CCND1 (cyclin D1) was upregulated in clear cell and chromophobe, but was downregulated in papillary; overexpression in clear cell RCC is linked to loss of the VHL gene (60). TWIST1 (twist-related protein 1) was upregulated in clear cell, downregulated in papillary, and unchanged in chromophobe. TWIST1 is a transcription factor and its cellular location plays an important role in its activity; a recent study showed that a high level of cytoplasmic TWIST1 is an indicator of poor prognosis (61). PIM2 (serine/threonine-protein kinase Pim-2) was upregulated in clear cell, downregulated in chromophobe, and unchanged in papillary. In clear cell RCC, increased PIM2 expression is correlated with more advanced disease and metastasis (62).
We also identified a cluster of 12 genes which was downregulated or unchanged, but not upregulated in any subtype. FOS (c-Fos) was the only gene that was significantly downregulated in all three RCC subtypes in our analysis; this protein dimerizes with c-Jun to form the transcription factor AP-1, which is involved in cell proliferation. Of note, c-Fos activation is linked to VHL inactivation, and elevated c-FOS expression is correlated with worse survival (63). JUN (c-Jun) was unchanged in clear cell, but downregulated in both papillary and chromophobe. ITGB6 (integrin beta 6), FGF2 (basic fibroblast growth factor, FGF-β) and HIF1A were strongly downregulated in clear cell and chromophobe, but unchanged in papillary. While ITGB6 has been described in subclinical inflammation in normal renal tissue, but to our knowledge it has not been evaluated in RCC (64). FGF-β plays a role in RCC tumor growth, its expression is not correlated with clinical outcomes (65). Also, loss of normal HIF1A regulation, which is normally degraded in normoxic conditions, is linked to loss of the VHL gene in RCC (66). IL6 (interleukin-6) was unchanged in clear cell, but downregulated in both papillary and chromophobe in our analysis. This contradicts published data showing that RCC tumors express much higher levels of IL6 than normal renal tissue and RCC cell lines utilize IL-6 as an autocrine growth factor (67). MUC1 (mucin 1), CDH1 (cadherin-1, E-cadherin), and PTK2 (protein tyrosine kinase 2 or focal adhesion kinase [FAK]) were downregulated in clear cell and papillary, but unchanged in chromophobe. MUC1 has previously been described as a prognostic marker in RCC (68), whereas loss of E-cadherin is associated with metastasis and poor prognosis in RCC (69). Though FAK levels are increased in many cancers, but seem to have not been implicated in RCC tumor formation (70). MCL1 (Mcl-1, Bcl2L3), an anti-apoptotic gene in the Bcl2 family, was downregulated in chromophobe and unchanged in clear cell and papillary. In RCC, Mcl-1 expression is linked to TNF-alpha-related apoptosis-inducing ligand (TRAIL) resistance, and sorafenib has been shown to reduce both expression of Mcl-1 and TRAIL resistance (71). MMP2 was downregulated in papillary RCC in our analysis, but interestingly it has been shown that like MMP9, increased expression of MMP2 in RCC is an indicator of poor prognosis across subtypes (39). CDC25A was only downregulated in clear cell RCC; CDC25A expression has been shown to be inhibited by sunitinib in RCC (36).
Nine STAT3-regulated genes (VEGFA, VIM, VVND1, ITGB6, BIRC5, MUC1, CDH1, ICAM1, and FOS) were identified as potential biomarkers to distinguish tumor from normal renal tissue by ROC analyses, with AUC values > 0.9 in at least one RCC subtype. VEGFA was identified as a candidate biomarker in clear cell, and as previously mentioned its role in clear cell RCC is well-established (50). VIM was identified as a candidate biomarker for both clear cell and papillary, and was significantly upregulated in both subtypes in our analysis. Vimentin has already been established as an immunohistochemistry marker to distinguish clear cell and papillary from both normal renal tissue and other renal cancer types (72). Additionally, vimentin expression has been correlated with poor survival in RCC patients (73), though this study did not differentiate between tumor subtypes. CCND1 showed biomarker potential and high expression in clear cell in our analysis, and though high cyclin D1 has been correlated with better prognosis in clear cell, expression alone as measured by immunohistochemistry was not an independent prognostic factor (74). ITGB6 was identified as a candidate biomarker in clear cell and chromophobe, and it was significantly downregulated in both subtypes. As previously noted, to our knowledge this gene has not been evaluated in RCC and both its role in RCC biology and biomarker potential should be further explored. BIRC5 was strongly upregulated in all three subtypes, but was only identified as a candidate biomarker in clear cell and papillary. Increased expression of survivin is well-characterized in RCC, and though high survivin expression has been correlated with increased tumor aggressiveness and poor prognosis in RCC overall, the prognostic value of survivin expression has not been explored in individual subtypes (75, 76). MUC1 showed biomarker potential in clear cell, in which it was strongly downregulated. Similar expression patterns have been reported, though differences in cytoplasmic and membranous expression were observed in benign, malignant, and metastatic RCC tissues, and its role as a biomarker for clear cell RCC should be evaluated further (77). CDH1 was identified as a candidate biomarker in clear cell, in which it was downregulated, and as previously mentioned the loss of CHD1 has been associated with metastasis and poor prognosis (69). ICAM1 showed was upregulated in clear cell, and its biomarker potential in this subtype should be further explored. Finally, FOS was downregulated in all subtypes but only showed biomarker potential in chromophobe, where it had the highest AUC value in this subtype. As previously mentioned elevated c-FOS expression has been correlated with worse survival, but this study was limited to clear cell cases, and the role of FOS in chromophobe RCC should be evaluated (63).
In conclusion, STAT3 signaling is linked to cancer proliferation, survival, invasion, angiogenesis, metastasis, and inflammation, and has been shown to be an effective therapeutic target in RCC treatment. Overall our results suggest that STAT3 signaling differs between clear cell, papillary, and chromophobe RCC, and that it plays a more significant role in clear cell than in the other subtypes. Of the genes evaluated, we found specific genes upregulated or downregulated in RCC subtypes, and their roles in the pathogenesis of RCC should be further explored, including as potential therapeutic targets. The unmet need is to develop therapies/drugs targeting genes associated with STAT3 pathway in the renal cancer subtypes.
The datasets analyzed for this study can be found in The Cancer Genome Atlas (https://cancergenome.nih.gov).
RR, AS, and SS wrote the manuscript and created figures and tables. RR, AS, SB, TL, and SK performed data analysis. RR, AS, SS, SH, and NP contributed to data interpretation and made revisions to the manuscript, tables, and figures.
This research was supported by Institutional Start-Up Package to SS from Medical College of Georgia at Augusta University, Augusta, GA, USA.
The authors declare that the research was conducted in the absence of any commercial or financial relationships that could be construed as a potential conflict of interest.
The Supplementary Material for this article can be found online at: https://www.frontiersin.org/articles/10.3389/fonc.2019.00072/full#supplementary-material
1. Guo C, Yang G, Khun K, Kong X, Levy D, Lee P, et al. Activation of Stat3 in renal tumors. Am J Transl Res. (2009) 1:283–90.
2. Barata PC, Rini BI. Treatment of renal cell carcinoma: current status and future directions. CA Cancer J Clin. (2017) 67:507–524. doi: 10.3322/caac.21411
3. Horiguchi A, Oya M, Marumo K, Murai M. STAT3, but not ERKs, mediates the IL-6-induced proliferation of renal cancer cells, ACHN and 769P. Kidney Int (2002) 61:926–38. doi: 10.1046/j.1523-1755.2002.00206.x
4. Horiguchi A, Oya M, Shimada T, Uchida A, Marumo K, Murai M. Activation of signal transducer and activator of transcription 3 in renal cell carcinoma- a study of incidence and its association with pathological features and clinical outcome. J Urol. (2002) 168:762–5. doi: 10.1016/S0022-5347(05)64741-6
5. Santoni MA, Conti F, Piva F, Massari C, Ciccarese L, Burattini L, et al. Role of STAT3 pathway in genitourinary tumors. Future Sci. OA. (2015) 1:FSO15. doi: 10.4155/fso.15.13
6. Hodge DR, Hurt EM, Farrar WL. The role of IL-6 and STAT3 in inflammation and cancer. Eur J Cancer. (2005) 41:2502–12. doi: 10.1016/j.ejca.2005.08.016
7. Rebe C, Vegran F, Berger H, Ghiringhelli F. STAT3 activation: A key factor in tumor immunoescape. JAKSTAT (2013) 2:e23010. doi: 10.4161/jkst.23010
8. Siveen KS, Sikka S, Surana R, Dai X, Zhang J, Kumar A, et al. Targeting the STAT3 signaling pathway in cancer: role of synthetic and natural inhibitors. Biochim Biophys Acta (2014) 1845:136–54. doi: 10.1016/j.bbcan.2013.12.005
10. Huang S. Regulation of metastases by signal transducer and activator of transcription 3 signaling pathway: clinical implications. Clin Cancer Res. (2007) 13:1362–6. doi: 10.1158/1078-0432.CCR-06-2313
11. Kaminska K, Czarnecka AM, Escudier B, Lian F, Szczylik C. Interleukin-6 as an emerging regulator of renal cell cancer. Urol Oncol. (2015) 33:476–485. doi: 10.1016/j.urolonc.2015.07.010
12. Cui Y, Li Y, Li J, Zhang HY, Wang F, Bai X, et al. STAT3 regulates hypoxia-induced epithelial mesenchymal transition in oesophageal squamous cell cancer. Oncol Rep. (2016) 36:108–116. doi: 10.3892/or.2016.4822
13. Zhao C, Wang W, Yu W, Jou D, Wang Y, Ma H, et al. A novel small molecule STAT3 inhibitor, LY5, inhibits cell viability, colony formation, and migration of colon and liver cancer cells. Oncotarget (2016) 7:12917–26. doi: 10.18632/oncotarget.7338
14. Saini U, Naidu S, ElNaggar AC, Bid HK, Wallbillich JJ, Bixel K, et al. Elevated STAT3 expression in ovarian cancer ascites promotes invasion and metastasis: a potential therapeutic target. Oncogene (2017) 36:168–81. doi: 10.1038/onc.2016.197
15. Colomiere M, Ward AC, Riley C, Trenerry MK, Cameron-Smith D, Findlay J, et al. Cross talk of signals between EGFR and IL-6R through JAK2/STAT3 mediate epithelial-mesenchymal transition in ovarian carcinomas. Br J Cancer (2009) 100:134–44. doi: 10.1038/sj.bjc.6604794
16. Pawlus MR, Wang L, Hu CJ. STAT3 and HIF1alpha cooperatively activate HIF1 target genes in MDA-MB-231 and RCC4 cells. Oncogene (2014) 33:1670–9. doi: 10.1038/onc.2013.115
17. Guo W, Pylayeva Y, Pepe A, Yoshioka T, Muller WJ, Inghirami. Beta 4 integrin amplifies ErbB2 signaling to promote mammary tumorigenesis. Cell (2006) 126:489–502. doi: 10.1016/j.cell.2006.05.047
18. Azare J, Leslie K, Al-Ahmadie H, Gerald W, Weinreb PH, Violette SM, et al. Constitutively activated Stat3 induces tumorigenesis and enhances cell motility of prostate epithelial cells through integrin beta 6. Mol Cell Biol. (2007) 27:4444–53. doi: 10.1128/MCB.02404-06
19. Jang YS, Kang JH, Woo JK, Kim H, Hwang JI, Lee SJ, et al. Ninjurin1 suppresses metastatic property of lung cancer cells through inhibition of interleukin 6 signaling pathway. Int J Cancer (2016) 139:383–95. doi: 10.1002/ijc.30021
20. Fletcher S, Drewry JA, Shahani VM, Page B, Gunning PT. Molecular disruption of oncogenic signal transducer and activator of transcription 3 (STAT3) protein. Biochem Cell Biol. (2009) 87:825–833. doi: 10.1139/o09-044
21. Jarnicki A, Putoczki T, Ernst M. Stat3: linking inflammation to epithelial cancer - more than a gut feeling? Cell Div. (2010) 5:14. doi: 10.1186/1747-1028-5-14
22. Liu Y, Li H, Feng J, Cui X, Huang W, Li Y, et al. Lin28 induces epithelial-to-mesenchymal transition and stemness via downregulation of let-7a in breast cancer cells. PLoS ONE (2013) 8:e83083. doi: 10.1371/journal.pone.0083083
23. Pensa S, Regis G, Boselli D, Novelli F, Poli V. STAT1 and STAT3 in Tumorigenesis: two sides of the same coin? In: Madame Curie Bioscience Database [Internet]. Austin, TX: Landes Bioscience (2000-2013). Available online at: https://www.ncbi.nlm.nih.gov/books/NBK6568/
24. Xiong H, Zhang GX, Tian Q, Sun D-F, Liang Q-C, Zhang Y-J, et al. Inhibition of JAK1, 2/STAT3 signaling induces apoptosis, cell cycle arrest, and reduces tumor cell invasion in colorectal cancer cells. Neoplasia (2008) 10:287–97. doi: 10.1593/neo.07971
25. Wani N, Nasser MW, Ahirwar DK, Zhao H, Miao Z, Shilo K, et al. C-X-C motif chemokine 12/C-X-C chemokine receptor type 7 signaling regulates breast cancer growth and metastasis by modulating the tumor microenvironment. Breast Cancer Res. (2014) 16:R54. doi: 10.1186/bcr3665
26. Tailor PD, Kodeboyina SK, Bai S, Patel N, Sharma S, Ratnani A, et al. Diagnostic and prognostic biomarker potential of kallikrein family genes in different cancer types. Oncotarget (2018) 9:17876. doi: 10.18632/oncotarget.24947
27. Society TAC. Survival Rates for Kidney Cancer by Stage. (2017). Available online at: https://www.cancer.org/cancer/kidney-cancer/detection-diagnosis-staging/survival-rates.html
28. Jonasch E, Gao J, Rathmell WK. Renal cell carcinoma. BMJ (2014) 349:g4797. doi: 10.1136/bmj.g4797
29. Motzer RJ, Jameson JL, Fauci AS, Kasper D, Hauser SL, Longo DL, et al. (2018). Renal Cell Carcinoma. Harrison's Principles of Internal Medicine. 20 edn. New York, NY, McGraw-Hill Education.
30. Santos OF, Barros EJ, Yang M, Matsumoto K, Nakamura T, Park M. Involvement of hepatocyte growth factor in kidney development. Dev Biol. (1994) 163:525–9. doi: 10.1006/dbio.1994.1169
31. Boccaccio C, Ando M, Tamagnone L, Bardelli A, Michieli P, Battistini C, et al. Induction of epithelial tubules by growth factor HGF depends on the STAT pathway. Nature (1998) 391:285. doi: 10.1038/34657
32. Weimbs T, Talbot J. STAT3 signaling in polycystic kidney disease. Drug Discov Today Dis Mech. (2013) 10:e113–8. doi: 10.1016/j.ddmec.2013.03.001
33. Talbot JJ, Shillingford JM, Vasanth S, Doerr N, Mukherjee S, Kinter MT, et al. Polycystin-1 regulates STAT activity by a dual mechanism. Proc Natl Acad Sci USA. (2011) 108:7985–90. doi: 10.1073/pnas.1103816108
34. Nechemia Arbely Y, Barkan D, Pizov G, Shriki A, Rose-John S, Galun E, et al. IL-6/IL-6R axis plays a critical role in acute kidney injury. J Am Soc Nephrol. (2008) 19:1106–15. doi: 10.1681/ASN.2007070744
35. Escudier B, Eisen T, Stadler WM, Szczylik C, Oudard S, Negrier S, et al. Sorafenib in advanced clear-cell renal-cell carcinoma. N Engl J Med. (2007) 356:125–34. doi: 10.1056/NEJMoa060655
36. Xin H, Zhang C, Herrmann A, Du Y, Figlin R, Yu H. Sunitinib inhibition of Stat3 induces renal cell carcinoma tumor cell apoptosis and reduces immunosuppressive cells. Cancer Res. (2009) 69:2506–13. doi: 10.1158/0008-5472.CAN-08-4323
37. Choueiri TK, Plantade A, Elson P, Negrier S, Ravaud A, Oudard S, et al. Efficacy of sunitinib and sorafenib in metastatic papillary and chromophobe renal cell carcinoma. J Clin Oncol. (2008) 26:127–31. doi: 10.1200/JCO.2007.13.3223
38. Gumz ML, Zou H, Kreinest PA, Childs AC, Belmonte LS, LeGrand SN, et al. Secreted frizzled-related protein 1 loss contributes to tumor phenotype of clear cell renal cell carcinoma. Clin Cancer Res. (2007) 13:4740–9. doi: 10.1158/1078-0432.CCR-07-0143
39. Kallakury BVS, Karikehalli S, Haholu A, Sheehan CE, Azumi N, Ross JS. Increased expression of matrix metalloproteinases 2 and 9 and tissue inhibitors of metalloproteinases 1 and 2 correlate with poor prognostic variables in renal cell carcinoma. Clin Cancer Res (2001) 7:3113–9.
40. Mahotka C, Krieg T, Krieg A, Wenzel M, Suschek CV, Heydthausen M, et al. Distinct in vivo expression patterns of survivin splice variants in renal cell carcinomas. Int J Cancer (2002) 100:30–36. doi: 10.1002/ijc.10450
41. Itoi T, Yamana K, Bilim V, Takahashi K, Tomita F. Impact of frequent Bcl-2 expression on better prognosis in renal cell carcinoma patients. Br J Cancer (2004) 90:200–5. doi: 10.1038/sj.bjc.6601454
42. Xu Y, Xia Q, Rao Q, Shi S, Shi Q, Ma H, et al. DCN deficiency promotes renal cell carcinoma growth and metastasis through downregulation of P21 and E-cadherin. Tumour Biol. (2016) 37:5171–83. doi: 10.1007/s13277-015-4160-1
43. Jiang F, Richter J, Schraml P, Bubendorf L, Gasser T, Sauter G, et al. Chromosomal Imbalances in Papillary Renal Cell Carcinoma. Am J Pathol. (1998) 153:1467–73. doi: 10.1016/S0002-9440(10)65734-3
44. Sanjmyatav J, Junker K, Matthes S, Muehr M, Sava D, Sternal M, et al. Identification of genomic alterations associated with metastasis and cancer specific survival in clear cell renal cell carcinoma. J Urol. (2011) 186:2078–83. doi: 10.1016/j.juro.2011.06.050
45. Ikuerowo SO, Kuczyk MA, Mengel ME, van der Heyde E, Shittu OB, Vaske U, et al. Alteration of subcellular and cellular expression patterns of cyclin B1 in renal cell carcinoma is significantly related to clinical progression and survival of patients. Int J Cancer (2006) 119:867–74. doi: 10.1002/ijc.21869
46. Mahalingam D, Espitia CM, Medina EC, Esquivel J, Kelly KR, Bearss D, et al. Targeting PIM kinase enhances the activity of sunitinib in renal cell carcinoma. Br J Cancer (2011) 105:1563–73. doi: 10.1038/bjc.2011.426
47. Hongo F, Takaha N, Oishi M, Ueda T, Nakamura T, Naitoh Y, et al. CDK1 and CDK2 activity is a strong predictor of renal cell carcinoma recurrence. Urol Oncol. (2014) 32:1240–6. doi: 10.1016/j.urolonc.2014.05.006
48. Ko JS, Zea AH, Rini BI, Ireland J, Elson P, Cohen P, et al. Sunitinib mediates reversal of myeloid-derived suppressor cell accumulation in renal cell carcinoma patients. Clin Cancer Res. (2009) 15:2148–57. doi: 10.1158/1078-0432.CCR-08-1332
49. Priceman SJ, Sung JL, Shaposhnik Z, Burton JB, Torres-Collado AX, Moughon DL, et al. Targeting distinct tumor-infiltrating myeloid cells by inhibiting CSF-1 receptor- combating tumor evasion of antiangiogenic therapy. Blood (2010) 115:1461–71. doi: 10.1182/blood-2009-08-23741
50. Escudier B, Pluzanska A, Koralewski P, Ravaud A, Bracarda S, Szczylik C, et al. Bevacizumab plus interferon alfa-2a for treatment of metastatic renal cell carcinoma: a randomised, double-blind phase III trial. Lancet (2007) 370:2103–11. doi: 10.1016/S0140-6736(07)61904-7
51. Zhao W, Tian B, Wu C, Peng Y, Wang H, Gu W, et al. DOG1, cyclin D1, CK7, CD117 and vimentin are useful immunohistochemical markers in distinguishing chromophobe renal cell carcinoma from clear cell renal cell carcinoma and renal oncocytoma. Pathol Res Pract. (2015) 211:303–7. doi: 10.1016/j.prp.2014.12.014
52. Hemmerlein B, Scherbening J, Kugler A, Radzun HJ. Expression of VCAM-1, ICAM-1, E- and P-selectin and tumour-associated macrophages in renal cell carcinoma. Histopathology (2000) 37:78–83. doi: 10.1046/j.1365-2559.2000.00933.x
53. Juengel E, Krueger G, Rutz J, Nelson K, Werner I, Relja B, et al. Renal cell carcinoma alters endothelial receptor expression responsible for leukocyte adhesion. Oncotarget (2016) 7:20410–24. doi: 10.18632/oncotarget.780
54. Furge KA, Chen J, Koeman J, Swiatek P, Dykema K, Lucin K, et al. Detection of DNA copy number changes and oncogenic signaling abnormalities from gene expression data reveals MYC activation in high-grade papillary renal cell carcinoma. Cancer Res. (2007) 67:3171–6. doi: 10.1158/0008-5472.CAN-06-4571
55. Shroff EH, Eberlin LS, Dang VM, Gouw A, Gabay M, Adam SJ, et al. MYC oncogene overexpression drives renal cell carcinoma in a mouse model through glutamine metabolism. Proc Natl Acad Sci USA. (2015) 112:6539–44. doi: 10.1073/pnas.1507228112
56. Bailey ST, Smith AM, Kardos J, Wobker SE, Wilson HL, Krishnan B, et al. MYC activation cooperates with Vhl and Ink4a/Arf loss to induce clear cell renal cell carcinoma. Nat Commun. (2017) 8:15770. doi: 10.1038/ncomms15770
57. Hirata H, Naito K, Yoshihiro S, Matsuyama H, Suehiro Y, Hinoda Y. A single nucleotide polymorphism in the matrix metalloproteinase-1 promoter is associated with conventional renal cell carcinoma. Int J Cancer (2003) 106:372–4. doi: 10.1002/ijc.11229
58. Korhonene M, Laitinen L, Ylanne J, Koukoulis GK, Quaranta V, Juusela H, et al. Integrin distributions in renal cell carcinomas of various grades of malignancy. Am J Pathol. (1992) 141:1161–71.
59. Seliger B, Menig M, Lichtenfels R, Atkins D, Bukur J, Halder T, et al. Identification of markers for the selection of patients undergoing renal cell carcinoma-specific immunotherapy. Proteomics (2003) 3:979–90. doi: 10.1002/pmic.200300404
60. Bindra RS, Vasselli JR, Stearman R, Marston Linehan W, Rd K. VHL-mediated Hypoxia regulation of cyclin D1 in renal carcinoma cells. Cancer Res. (2002) 62. 3014–9.
61. Rasti A, Madjd Z, Abolhasani M, Mehrazma M, Janani L, Saeednejad Zanjani L, et al. Cytoplasmic expression of Twist1, an EMT-related transcription factor, is associated with higher grades renal cell carcinomas and worse progression-free survival in clear cell renal cell carcinoma. Clin Exp Med. (2018) 18:177–90. doi: 10.1007/s10238-017-0481-2
62. Luo W, Ma Y, Cortes E, Omilian A, Bshara W, Azabdaftari G, et al. Abstract 4625: Tumor expression of PIM kinases in renal cell carcinoma and the association with disease progression. Cancer Res. (2018) 78:4625. doi: 10.1158/1538-7445.AM2018-4625
63. Hirata H, Hinoda Y, Shahryari V, Deng G, Nakajima K, Tabatabai Z, et al. Long noncoding RNA MALAT1 promotes aggressive renal cell carcinoma through Ezh2 and interacts with miR-205. Cancer Res. (2015) 75:1322–31. doi: 10.1158/0008-5472.CAN-14-2931
64. Breuss JM, Gallo J, DeLisser HM, Klimanskaya IV, Folkesson HG, TPitter JF, et al. Expression of the β6 integrin subunit in development, neoplasia and tissue repair suggests a role in epithelial remodeling. J Cell Sci. (1995) 108:2241–51.
65. Emoto N, Isozaki O, Ohmura E, Ito F, Tsushima T, Shizume K, et al. Basic fibroblast growth factor (FGF-2) in renal cell carcinoma, which is indistinguishable from that in normal kidney, is involved in renal cell carcinoma growth. J Urol. (1994) 152:1626–31. doi: 10.1016/S0022-5347(17)32492-8
66. Krieg M, Haas R, Brauch H, Acker T, Flamme I, Plate K, et al. Up-regulation of hypoxia-inducible factors HIF-1α and HIF-2α under normoxic conditions in renal carcinoma cells by von Hippel-Lindau tumor suppressor gene loss of function. Oncogene (2000) 19:5435. doi: 10.1038/sj.onc.1203938
67. Hong DS, Angelo LS, Kurzrock R. Interleukin-6 and its receptor in cancer. Cancer (2007) 110:1911–28. doi: 10.1002/cncr.22999
68. Kraus S, Abel PD, Nachtmann CH, Linsenmann J, Weidner W, Stamp GW, et al. MUC1 mucin and trefoil factor 1 protein expression in renal cell carcinoma: correlation with prognosis. Human Pathol. (2002) 33:60–67. doi: 10.1053/hupa.2002.29682
69. Katagiri A, Watanabe R, Tomita Y. E-cadherin expression in renal cell cancer and its significance in metastasis and survival. Br J Cancer (1995) 71:376. doi: 10.1038/bjc.1995.76
70. McLean GW, Carragher NO, Avizienyte E, Evans J, Brunton V, Frame MC, et al. The role of focal-adhesion kinase in cancer—a new therapeutic opportunity. Nat Rev Cancer (2005) 5:505. doi: 10.1038/nrc1647
71. Ricci MS, Kim S-H, Ogi K, Plastaras JP, Ling J, Wang W, et al. Reduction of TRAIL-induced Mcl-1 and cIAP2 by c-Myc or sorafenib sensitizes resistant human cancer cells to TRAIL-induced death. Cancer Cell (2007) 12:66–80. doi: 10.1016/j.ccr.2007.05.006
72. Skinnider BF, Folpe AL, Hennigar RA, Lim SD, Cohen C, Tamboli P, et al. Distribution of cytokeratins and vimentin in adult renal neoplasms and normal renal tissue: potential utility of a cytokeratin antibody panel in the differential diagnosis of renal tumors. Am J Surg Pathol. (2005) 29:747–54. doi: 10.1097/01.pas.0000163362.78475.63
73. Sabo E, Miselevich I, Bejar J, Segenreich M, Wald M, Moskovitz B, et al. The role of vimentin expression in predicting the long-term outcome of patients with localized renal cell. Carcinoma (1997) 80:864–8. doi: 10.1046/j.1464-410X.1997.00489.x
74. Lima MS, Pereira RA, Costa RS, Tucci S, Dantas M, Muglia VF, et al. The prognostic value of cyclin D1 in renal cell carcinoma. Int Urol Nephrol. (2014) 46:905–13. doi: 10.1007/s11255-013-0602-0
75. Xiong C, Liu H, Chen Z, Yu Y, Liang C. Prognostic role of survivin in renal cell carcinoma: a system review and meta-analysis. (2016) 33:102–7. doi: 10.1016/j.ejim.2016.06.009
76. Pu Z, G-Z Wu and Q.J.O Wang. Clinicalpathological and prognostic significance of survivin expression in renal cell carcinoma: a meta-analysis. Oncotarget (2017) 8:19825. doi: 10.18632/oncotarget.15082
Keywords: STAT3, gene expression, TCGA, RNA-seq, renal cell carcinoma
Citation: Robinson RL, Sharma A, Bai S, Heneidi S, Lee TJ, Kodeboyina SK, Patel N and Sharma S (2019) Comparative STAT3-Regulated Gene Expression Profile in Renal Cell Carcinoma Subtypes. Front. Oncol. 9:72. doi: 10.3389/fonc.2019.00072
Received: 23 October 2018; Accepted: 25 January 2019;
Published: 26 February 2019.
Edited by:
Walter J. Storkus, University of Pittsburgh, United StatesReviewed by:
Leonard Joseph Appleman, University of Pittsburgh, United StatesCopyright © 2019 Robinson, Sharma, Bai, Heneidi, Lee, Kodeboyina, Patel and Sharma. This is an open-access article distributed under the terms of the Creative Commons Attribution License (CC BY). The use, distribution or reproduction in other forums is permitted, provided the original author(s) and the copyright owner(s) are credited and that the original publication in this journal is cited, in accordance with accepted academic practice. No use, distribution or reproduction is permitted which does not comply with these terms.
*Correspondence: Shruti Sharma, c2hzaGFybWFAYXVndXN0YS5lZHU=
Disclaimer: All claims expressed in this article are solely those of the authors and do not necessarily represent those of their affiliated organizations, or those of the publisher, the editors and the reviewers. Any product that may be evaluated in this article or claim that may be made by its manufacturer is not guaranteed or endorsed by the publisher.
Research integrity at Frontiers
Learn more about the work of our research integrity team to safeguard the quality of each article we publish.