 Marianna A. Zolotovskaia1,2*
 Maxim I. Sorokin3,4
 Sergey A. Roumiantsev1
 Nikolay M. Borisov2,3
 Anton A. Buzdin3,4,5
- 1Department of Oncology, Hematology and Radiotherapy of Pediatric Faculty, Pirogov Russian National Research Medical University, Moscow, Russia
- 2Oncobox Ltd., Moscow, Russia
- 3The Laboratory of Clinical Bioinformatics, I.M. Sechenov First Moscow State Medical University, Moscow, Russia
- 4Omicsway Corp., Walnut, CA, United States
- 5The Laboratory of Systems Biology, Shemyakin-Ovchinnikov Institute of Bioorganic Chemistry, Moscow, Russia
DNA mutations play a crucial role in cancer development and progression. Mutation profiles vary dramatically in different cancer types and between individual tumors. Mutations of several individual genes are known as reliable cancer biomarkers, although the number of such genes is tiny and does not enable differential diagnostics for most of the cancers. We report here a technique enabling dramatically increased efficiency of cancer biomarkers development using DNA mutations data. It includes a quantitative metric termed Pathway instability (PI) based on mutations enrichment of intracellular molecular pathways. This method was tested on 5,956 tumor mutation profiles of 15 cancer types from The Cancer Genome Atlas (TCGA) project. Totally, we screened 2,316,670 mutations in 19,872 genes and 1,748 molecular pathways. Our results demonstrated considerable advantage of pathway-based mutation biomarkers over individual gene mutation profiles, as reflected by more than two orders of magnitude greater numbers by high-quality [ROC area-under-curve (AUC)>0.75] biomarkers. For example, the number of such high-quality mutational biomarkers distinguishing between different cancer types was only six for the individual gene mutations, and already 660 for the pathway-based biomarkers. These results evidence that PI value can be used as a new generation of complex cancer biomarkers significantly outperforming the existing gene mutation biomarkers.
Introduction
Cancer is a multifactorial disease which is conditioned by alterations arising from biological, chemical, radiological impacts, as well as inherited. Tumor transformation is characterized by frequent accumulation of genetic mutations (1). The pivotal initiating role here belongs to DNA damage and genome instability (2, 3). The resulting combinations of gene mutations driving cancer development vary dramatically among different cancers types and individual patients (4).
Recently, high throughput studies of cancer genomes were initiated to identify mutation enrichment specific for the different cancer types. For example, the large scale projects like Wellcome Trust Sanger Institute's Cancer Genome Project, the International Cancer Genome Consortium (ICGC), The Cancer Genome Atlas (TCGA) showed very high molecular heterogeneity of cancer, not only between different cancer types, but also among the individual tumors of the same type (5–8). This allowed to considerably advance current understanding of carcinogenetic molecular mechanisms by documenting complete or near-complete landscapes of pathological somatic mutations including base substitutions and gene fusions. Many of the alterations revealed appeared promising for molecular cancer diagnostics in order to improve and personalize the treatment regimens (9, 10).
Identification of informative and robust genetic markers of cancer is one of the major tasks of the contemporary biomedicine. Many reports have been published featuring cancer-specific mutations and gene fusions, as well as epigenetic alterations (11–13). Some of them are already widely used in clinical practice as the biomarkers, but the problem of finding new relevant and informative cancer markers with higher sensitivity and specificity is largely unsolved (10, 14). Further accumulation of cancer type- and condition-specific biomarkers can be a key to a more effective, personalized treatment (15).
Despite recent success in high throughput analysis of molecular basis for cancer transformation, traditionally the focus is being made on the roles of the individual genes (16, 17). However, this approach cannot always explain tumor development in a comprehensive way. Apparently, this is most probably due to the mode of gene functioning as the nodes of molecular pathways, where roles of individual genes are highly interconnected and frequently interchangeable (18).
Previously, the analysis of molecular pathways at the level of gene expression was successfully applied for cancer investigations (19–21). Several approaches for measuring molecular pathway activities were proposed for the expression data at both mRNA, protein and microRNA levels (22–27). The extent of pathway activation, so called pathway activation strength (PAS), is a cumulative value aggregating relative expression levels of the enclosed gene products in relation with their functional roles in a pathway (28).
Interestingly, for most of the cancer types investigated the molecular pathways were shown to be stronger expression biomarkers of cancer than the individual genes (29). PAS was also proven to be more stable and experimental platform-independent metric than the individual gene expression patterns (30). This property appeared to be fundamental and linked with the ability to aggregate individual gene expression levels, thus decreasing experimental errors, as modeled in a recent investigation (25). PAS biomarkers are also used for predicting efficiencies of target cancer drugs in the ongoing clinical trials (24). However, to our knowledge, this type of quantitative pathway approach was never applied before for the mutation data, including human cancers.
Here, for the first time, we propose a new type of molecular biomarkers based on DNA mutation impacts on the molecular pathways. We introduced a quantitative metric termed Pathway instability (PI) proportionate to the relative number of mutated genes in a pathway and developed a specific bioinformatic algorithm for quantization thereof. Using high throughput gene mutation profiles, we identified affected molecular pathways that specifically define the major human cancer types. We took cancer somatic mutation data published in the TCGA project for 5,956 patients representing 15 different cancer types. Totally, we screened 2,316,670 mutations in 19,872 genes and 1,748 molecular pathways. The robustness of mutation-based molecular pathway approach dramatically exceeded that for the individual gene biomarkers. This trend was also reproducible when only truncating mutations were considered for PI calculations, thus confirming consistency of the new method. Finally, we provide a list of 660 novel robust cancer type-specific pathway mutation biomarkers.
Materials and Methods
DNA Mutation Data
The source DNA mutation dataset was obtained from the database of COSMIC (the Catalog Of Somatic Mutations In Cancer) project (31). We downloaded the verified somatic mutations data from COSMIC website, database version 76 (32). The initial dataset contained 6,651,236 mutation records for 20,528 genes from 19,434 individual tumor samples of 37 primary localizations. For statistical consistence, we took only those tumor localizations having at least 100 tumor samples profiled during The Cancer Genome Atlas (TCGA) project (33). The TCGA mutation profiles were selected because they represented the largest collection of uniformly treated biosamples profiled using the same deep sequencing platforms (34). Totally, we analyzed 2,316,670 mutations in 5,956 tumor genetic profiles corresponding to 15 primary localizations: breast, central nervous system, cervical, endometrium, ovaries, prostate, kidney, urinary tract, liver, hematopoietic and lymphoid tissue, stomach, large intestine, lung, thyroid, and skin (Supplementary Table 1). The database accession numbers of 5,956 samples are given in Supplementary Table 3.
In parallel, for the additional analysis we selected a fraction of gene truncating mutations that possibly lead to the loss of gene function. We meant truncating mutations as those having the following labels in COSMIC description: “Deletion-Frameshift,” “Insertion-Frameshift,” “Complex-frameshift,” “Substitution-Nonsense.” Totally, we selected 161,760 truncating mutations in 5,297 tumor samples corresponding to the same 15 cancer types (Supplementary Table 2). The database accession numbers of 5,297 samples are given in Supplementary Table 4.
Molecular Pathways
The structures of 3,121 molecular pathways were taken from the following public databases: Reactome (35), NCI Pathway Interaction Database (36), Kyoto Encyclopedia of Genes and Genomes (37), HumanCyc (38), Biocarta (39), Qiagen (40). For all the pathways, the gene contents were extracted and cataloged. For further analyses, we pre-selected 1,748 molecular pathways each including at least 10 gene products.
Principal Component Analysis
The Principal component analysis (PCA) was performed with package made 4 in R.
Clustering Dendrograms
For clustering, we used Ward's criterion and Ward.d2 algorithm (41) for the gene- (nMR) and pathway- (PI) specific mutation metrics.
Results
In this study, we applied quantitative molecular pathway approach to human cancer DNA mutation data. We developed algorithm for quantization of mutational impact on molecular pathways and applied it for screening of 1,748 human pathways. The DNA mutation data was extracted from the Catalog Of Somatic Mutations In Cancer (COSMIC) database (32). For the reasons of statistical significance, we analyzed here only the tumor localizations having at least 100 complete exome sequencing-profiled tumor samples, totally fifteen primary localizations and 5,956 individual tumor specimens (Supplementary Table 1). For parallel analysis, we also selected a subset of 161,760 truncating mutations for 5,297 tumor samples of the same cancer types (Supplementary Table 2).
Pathway Instability (PI) Scoring
Pathway instability (PI) scoring for a molecular pathway depends on the mutation frequencies in the genes participating in this pathway. To assess mutation burden of the individual genes, we introduced Mutation rate (MR) value calculated according to the formula:
where MRn is the Mutation rate of a gene n; N mut(n,g) is the total number of mutations identified for a gene n in a group of samples g; N samples (g) is the number of samples in a group g. However, the MR values strongly positively correlated with the lengths of gene coding DNA sequences (CDS)s, Spearman correlation was 0.798 for all mutations and 0.629 for truncating mutations, p < 2.2e-16 in both cases (Supplementary Images 1A,C), most probably because larger genes had higher probabilities to accumulate mutations.
To avoid the bias linked with the CDS lengths, we next introduced a Normalized mutation rate (nMR) value expressed by the formula:
where nMRn is the Normalized mutation rate of a gene n; MRn is the Mutation rate of a gene n; Length CDS(n) is the length of CDS of a gene n in nucleotides.
In contrast to the previous metric, nMR did not correlate with the size of CDS for the respective genes (Supplementary Images 1B,D; rank correlation 0.151 for all mutations and 0.024 for truncating mutations). nMR scores calculated using all mutations for each tumor sample are listed in Supplementary Data Sheet 1, nMR scores calculated based on truncating mutations only are listed in Supplementary Data Sheet 2.
We next calculated Pathway instability (PI) scores for every pathway to estimate their relative enrichments by cancer-specific mutations. Pathway instability is expressed by the formula:
where PIp is Pathway instability score for a pathway p; nMRn is the Normalized mutation rate of gene n; PGp.n is pathway-gene indicator that equals to one if gene n belongs to pathway p, or equals to zero if gene n doesn't belong to pathway p; Np–total number of gene products that belong to pathway p. Unlike previous metrics for pathway activation scoring based on gene expression data, the current equation for PI calculation doesn't have coefficients defining activator or repressor molecular roles of genes participating in a molecular pathway under investigation (28). This has been done because for most of mutations their functional roles (neutral, repressing or activating gene function) remain unclear. Pathway instability (PI) (calculation also doesn't utilize logarithmation of nMR scores during summation because the number of mutations in tumor is not lower than in the reference normal tissue.
Cancer Type-Specific Pathway Instability (PI) Mutation Signatures
Totally, we calculated PI scores for 1,748 molecular pathways in 5,956 tumor samples representing fifteen primary localizations: breast, central nervous system, cervical, endometrium, ovaries, prostate, kidney, urinary tract, liver, hematopoietic and lymphoid tissue, stomach, large intestine, lung, thyroid, and skin for all mutations (Supplementary Data Sheet 3) and in 5,297 tumors for only truncating mutations (Supplementary Data Sheet 4).
Each tumor sample was characterized by a complete set of Normalized mutation rate (nMR) values for all individual genes and by the Pathway instability (PI) values for 1,748 molecular pathways. As shown by the principal component analysis (PCA), the complete sets of 19,872 nMR biomarkers and 1,748 PI biomarkers could not distinguish between the tumor localization types (Figures 1A,B). The PCA revealed no significant differences for the different cancer types both at the gene-based and pathway-based levels, although pathway-based approach covered most of the variation by the first component, unlike gene-based level of data analysis, where dramatically lower proportion of variation was covered. Similar figure was seen for the fraction of truncating mutations, where the variation of first principal component did not exceed 1.85% for genes and 19.77% for pathways (Figures 1C,D). The most likely reason for lack of tumor type-specific clustering may be the redundancy of features at high sparsity of the mutation data.
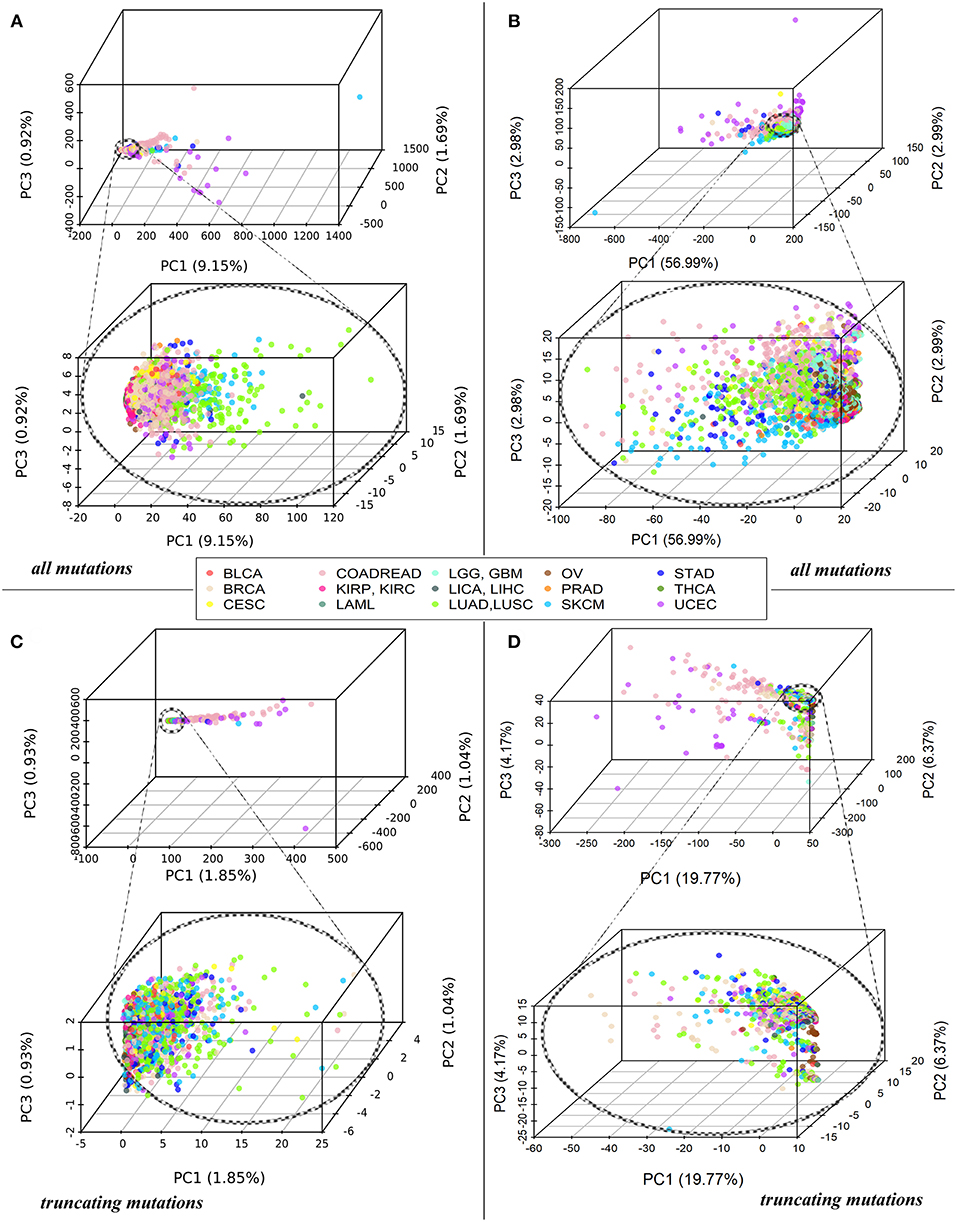
Figure 1. (A) PCA of Normalized mutation rate (nMR) patterns based on all mutations for 5,956 samples representing 15 primary human tumor localizations, reflected by the color key. Each point on the plot represents one tumor sample. Abbreviations for the cancer types: BRCA, breast invasive carcinoma; LGG, brain lower grade glioma; GBM, glioblastoma multiforme; CESC, cervical squamous cell carcinoma and endocervical adenocarcinoma; UCEC, uterine corpus endometrial carcinoma; LAML, acute myeloid leukemia; KIRP, kidney renal papillary cell carcinoma; KIRC, kidney renal clear cell carcinoma; COADREAD, colorectal cancer; LICA, liver cancer; LIHC, liver hepatocellular carcinoma; LUAD, lung adenocarcinoma; LUSC, lung squamous cell carcinoma; OV, ovarian serous cystadenocarcinoma; PRAD, prostate adenocarcinoma; SKCM, skin cutaneous melanoma; STAD, stomach adenocarcinoma; THCA, thyroid carcinoma; BLCA, bladder urothelial carcinoma. (B) PCA of Pathway instability (PI) patterns based on all mutations for the same samples. (C) PCA of Normalized mutation rate (nMR) patterns based on the truncating mutations for 5,297 tumor samples. (D) PCA of Pathway instability (PI) patterns based on the truncating mutations for 5,297 tumor samples.
However, many molecular pathways had characteristic PI scores that were clearly distinctive of the different tumor types, as shown by the high area under the ROC curve (AUC) values. The AUC value is the universal biomarker robustness characteristics depending on its sensitivity and specificity(42). It varies from 0.5 till 1 and positively correlates with the quality of a biomarker. The AUC discrimination threshold is typically 0.7 or 0.75. The parameters with greater AUC are considered good-quality biomarkers, and vice-versa (43). This statistical approach is also applicable to mutation research in human cancer (44–46). We performed the ROC AUC test in two ways: (i) for comparing every separately taken tumor type (localization) vs. all other tumors, and (ii) for all possible pairwise comparisons among the tumor types.
In parallel, the same AUC tests were performed also for every gene nMR characteristics of every sample. The tests were performed for all mutations and in parallel—for only truncating mutations (Supplementary Tables 5, 6, respectively). The data analysis pipeline is schematized on Figure 2. In this way, we could compare the biomarker potentials of the individual gene mutations (nMR) with the aggregated pathway-based mutation characteristics (PI).
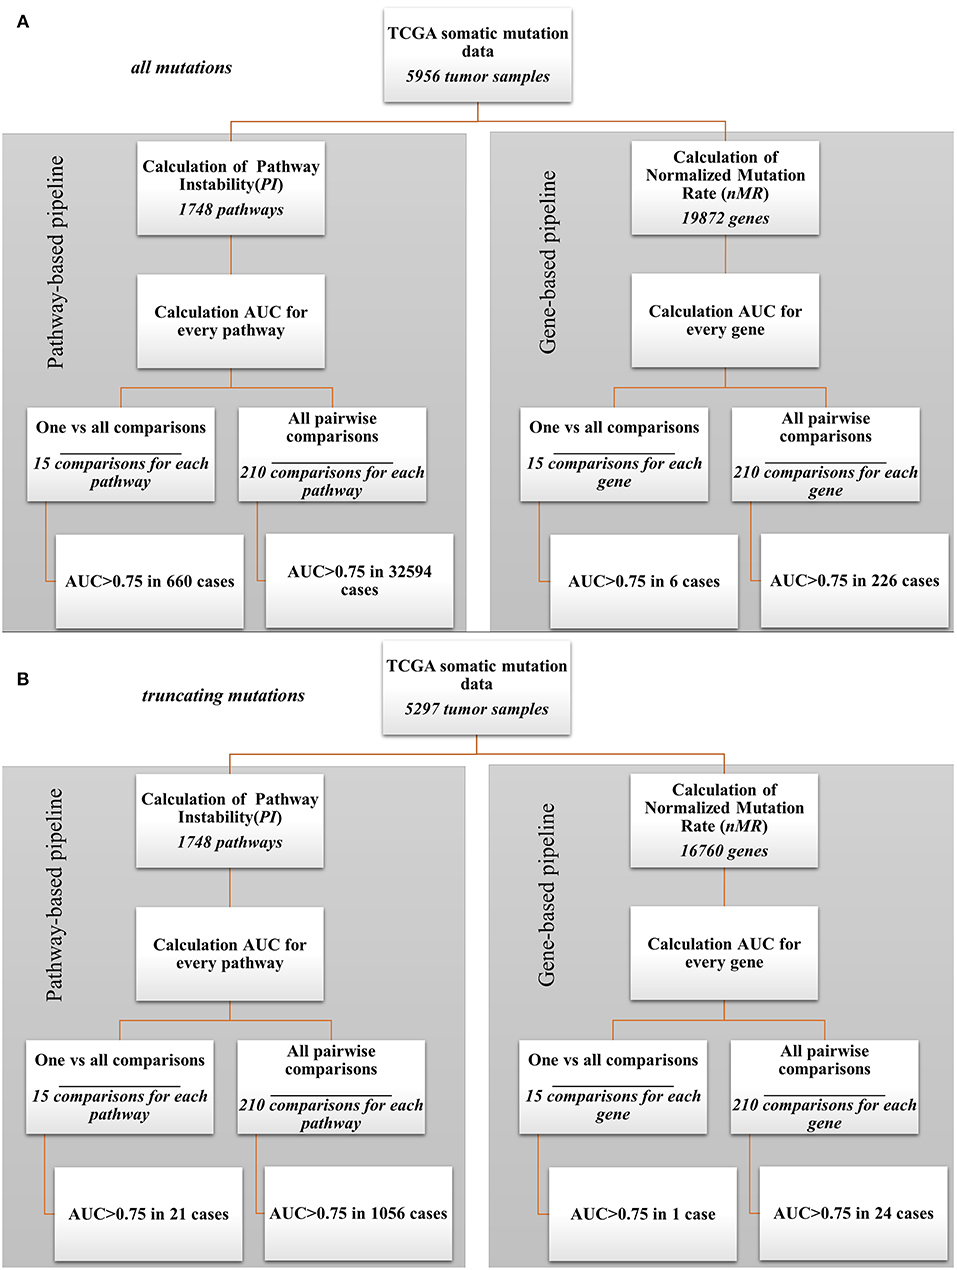
Figure 2. Bioinformatic comparison of quality for pathway- and gene-based mutation biomarkers: (A) for all mutations; (B) for truncating mutations.
Our analysis revealed a dramatic advantage of the pathway based (PI) compared to gene based (nMR) approach in finding good quality biomarkers in all types of the comparisons made. For example, for the analyzes when one tumor localization was compared against fourteen others, the total number of good quality (AUC>0.75) biomarkers was 660 for all mutations and 21 for truncating mutations for the pathways (PI), compared to only six for all mutations and one for truncating mutations for the individual genes (nMR). Similarly, for the pairwise comparisons we identified totally 32,594 good quality PI biomarkers vs. only 226 nMR biomarkers for all mutations (Figure 2A). For the truncating mutations, we discovered in pairwise comparisons 1,056 good quality PI biomarkers vs. only 24 nMR biomarkers (Figure 2B). Provided that the initial number of potential pathway biomarkers (1748) was one order of magnitude lower than the number of gene biomarkers (19,872 for all mutations and 16,760 for truncating mutations), this further strengthens the advantage of a PI-based approach.
Cancer Type Specific Biomarkers
For the dataset of all mutations, the cancer type-specific six gene mutation biomarkers were APC for colorectal cancer, PTEN for endometrial cancer, BRAF for thyroid cancer and MUC16, DNAH5, TTN for cutaneous melanoma. These genes were previously linked with the respective cancer types in the literature (47–50), but the overall number of six biomarkers may seem negligible provided they were obtained for fifteen comparisons (Figure 2A). In contrast, the pathway approach returned here as much as 660 reliable biomarkers representing 428 pathways. Different localizations had markedly different numbers of marker pathways (Figure 3A). Gene and pathway mutation biomarkers could be found for four and eight tumor localizations, respectively. In the case of truncating mutations, we found gene and pathway biomarkers for colorectal cancer only (Figures 3B,D).
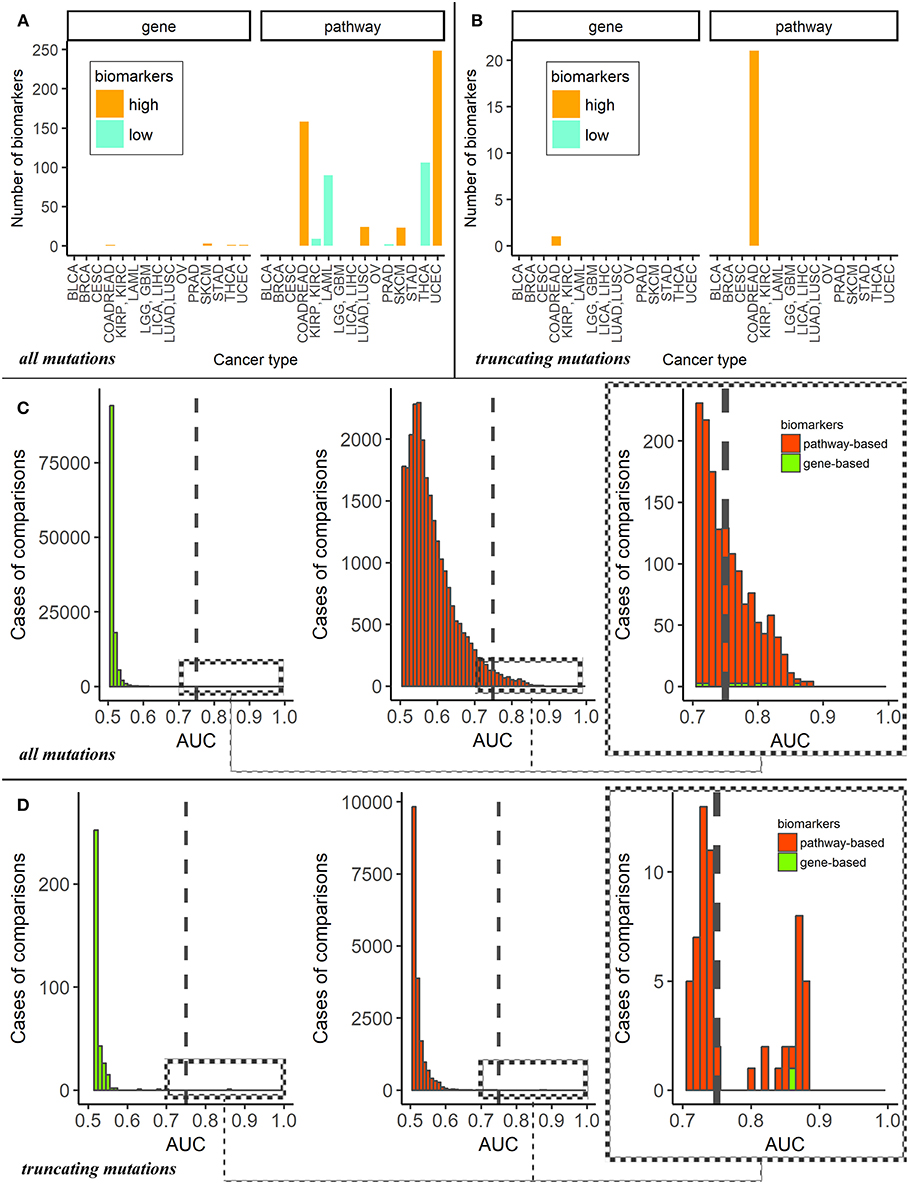
Figure 3. (A) Numbers of mutation marker genes and molecular pathways in “one vs. all” cancer type comparisons for all mutations. The cancer types are abbreviated as follows: BRCA, breast invasive carcinoma; LGG, brain lower grade glioma; GBM, glioblastoma multiforme; CESC, cervical squamous cell carcinoma and endocervical adenocarcinoma; UCEC, uterine corpus endometrial carcinoma; LAML, acute myeloid leukemia; KIRP, kidney renal papillary cell carcinoma; KIRC, kidney renal clear cell carcinoma; COADREAD, colorectal cancer; LICA, liver cancer; LIHC, liver hepatocellular carcinoma; LUAD, lung adenocarcinoma; LUSC, lung squamous cell carcinoma; OV, ovarian serous cystadenocarcinoma; PRAD, prostate adenocarcinoma; SKCM, skin cutaneous melanoma; STAD, stomach adenocarcinoma; THCA, thyroid carcinoma; BLCA, bladder urothelial carcinoma. (B) Numbers of mutation marker genes and molecular pathways in “one vs. other cancer types” comparisons for truncating mutations only. (C) AUC distributions of pathway- and genes-based mutation biomarkers for all mutations. Cut-off AUC level of high-quality biomarkers is set 0.75. AUC were obtained as the result of “one vs. others” comparisons. (D) AUC distributions of pathway—and genes-based mutation biomarkers for truncating mutations only. Cut-off level of high-quality biomarkers is set 0.75. AUC were obtained in “one vs. other cancer types” comparisons.
For the first time, we provide here the list of tumor type-specific pathway biomarkers based on all mutation for eight localizations investigated: colorectal, kidney, non-small cell lung, prostate, thyroid cancers, hematological malignancies, cutaneous melanoma and uterine corpus endometrial carcinoma (Supplementary Table 7). The list of colorectal cancer specific pathway biomarkers obtained using truncating mutations is shown on Supplementary Table 8.
Despite the large number of good-quality pathway biomarkers (Figures 3A,C), all of them were applicable only for eight localizations of the fifteen totally investigated. Colorectal cancer and endometrial carcinoma had maximum number of pathway-based biomarkers. It should be noted that characteristic tumor type-specific PI scores could be either higher or lower than the average values for other cancer types, thus resulting in “high” or “low” biomarkers (Figure 3A).
Using total pool of mutations, we next identified molecular pathways that were frequently mutated in all the cancer types under study. To this end, we selected 1,145 pathways having AUC < 0.7 in all tumor types (Supplementary Table 9) and intersected them with the list of top 10% pathways sorted according to the average PI values. The selected short list contained 18 pathways that were most frequently mutated in all cancer types (Table 1).
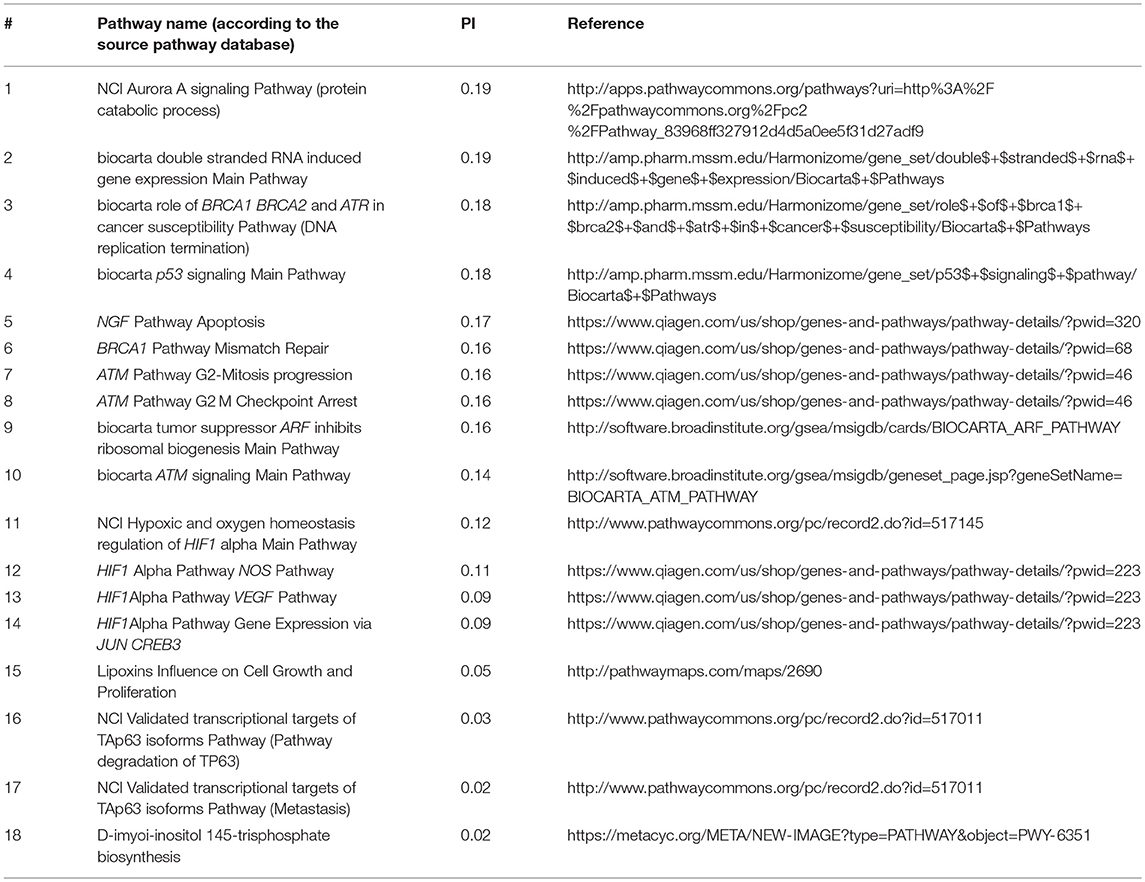
Table 1. Intersection of top 10% molecular pathways by average PI and molecular pathways with AUC < 0.7 for all cancer types.
On the other hand, we also screened for the pathways that were most informative as biomarkers (AUC>0.75) for the maximum number of cancer types. Top 25 most informative biomarker pathways are shown on Table 2.
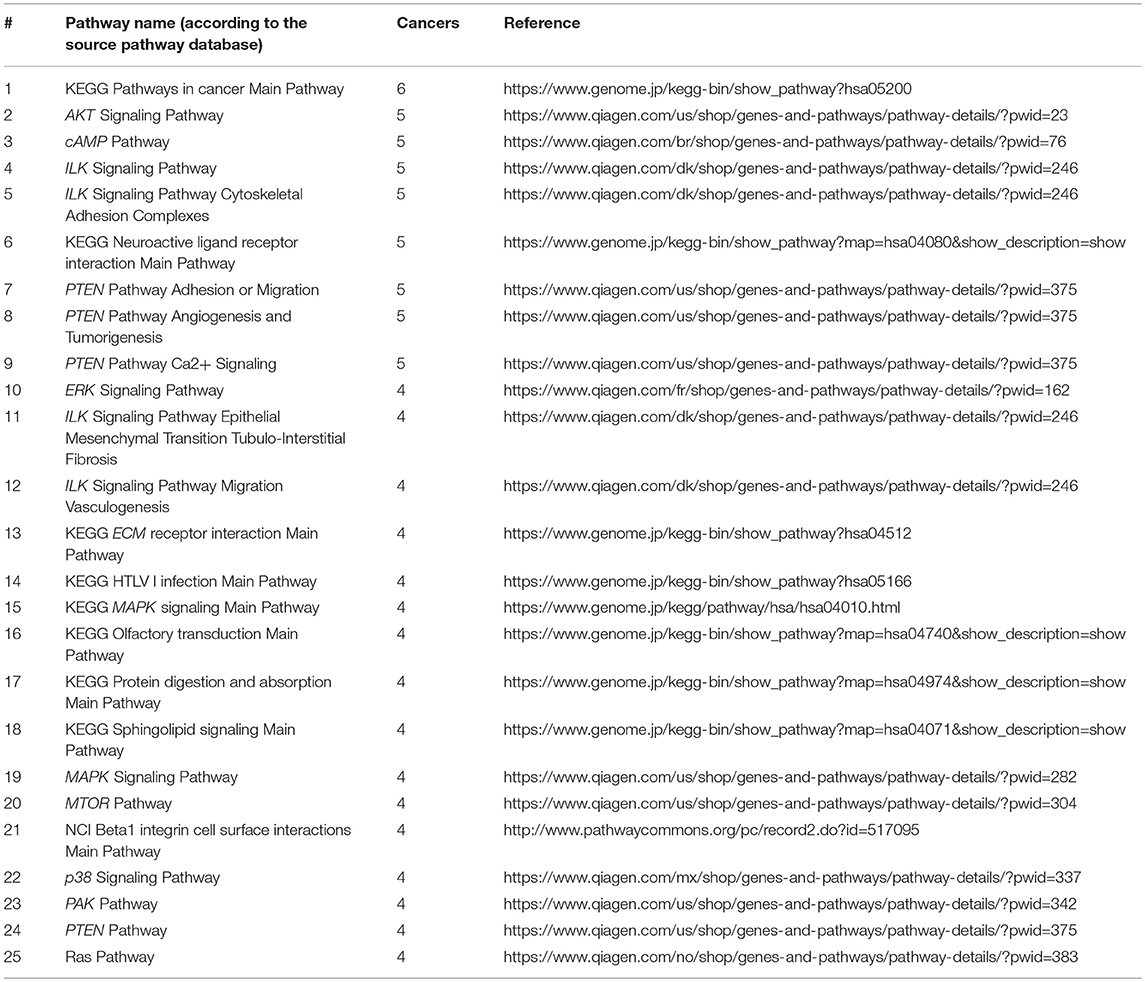
Table 2. Top 25 molecular pathways sorted by the number of cancer types where PI score serves as a good biomarker distinguishing from the other fourteen localizations (AUC>0.75).
Pairwise Comparison Biomarkers
The number of high quality biomarkers identified in pairwise comparisons can be characteristic of tumor mutational landscapes and their relative similarities. For example, when two cancer types under comparison have little or no specific biomarkers, this suggests small differences in their mutation profiles. In contrast, high number of biomarkers would mean more distinct mutation profiles. Based on the numbers of high quality ROC AUC biomarkers, a distance matrix can be created for all the tumor localizations under comparison, and a clustering dendrogram can be built. In this study, we used pairwise comparisons to analyze common features and clustering of 15 tumor types. The distance matrix was built separately for the gene (nMR) and the pathway (PI) mutation biomarkers (Figure 4A and Supplementary Image 2A for all and truncating mutations, respectively).
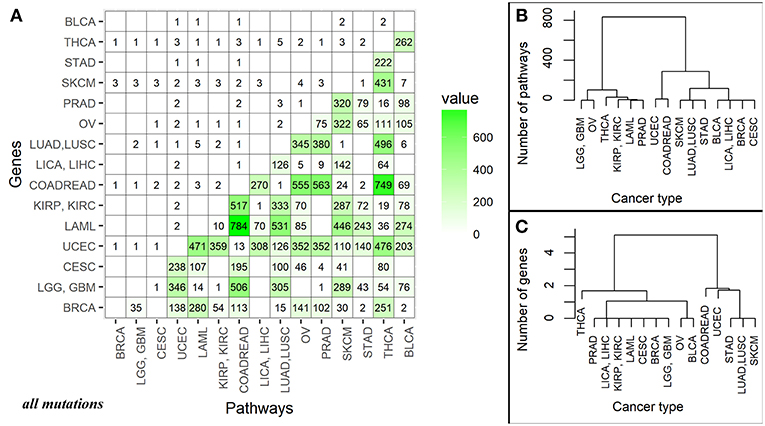
Figure 4. (A) Data matrix of high quality (AUC>0.75) biomarkers for pairwise comparisons between the different cancer localizations calculated based on all mutations. The cancer types are abbreviated as follows: BRCA, breast invasive carcinoma; LGG, brain lower grade glioma; GBM, glioblastoma multiforme; CESC, cervical squamous cell carcinoma and endocervical adenocarcinoma; UCEC, uterine corpus endometrial carcinoma; LAML, acute myeloid leukemia; KIRP, kidney renal papillary cell carcinoma; KIRC, kidney renal clear cell carcinoma; COADREAD, colorectal cancer; LICA, liver cancer; LIHC, liver hepatocellular carcinoma; LUAD, lung adenocarcinoma; LUSC, lung squamous cell carcinoma; OV, ovarian serous cystadenocarcinoma; PRAD, prostate adenocarcinoma; SKCM, skin cutaneous melanoma; STAD, stomach adenocarcinoma; THCA, thyroid carcinoma; BLCA, bladder urothelial carcinoma. The lower triangle shows numbers of high-quality biomarkers for pathway-based data (PI); the upper triangle—for individual gene-based mutation data (nMR). The intersection of cancer localization terms indicates number of the effective biomarkers for the respective comparison. (B) Cluster dendrogram built for the fifteen cancer types based on mutation biomarker (PI) data for all mutations. Number of biomarkers was used as the distance metric. (C) Cluster dendrogram built for the fifteen cancer types based on mutation biomarker (nMR) data for all mutations. Number of biomarkers was used as the distance metric.
For all mutations, in a series of pairwise comparisons we found that the number of biomarkers that distinguish between the two cancer types varies greatly depending on the localizations compared (Figure 4A). The number of PI roughly two orders of magnitude per instance exceeded the number of nMR biomarkers (Figure 4A).
There was also an overall correlation between these numbers (correlation 0.69, p-value = 3.677e-16), for example, all fourteen comparisons having no good biomarkers according to PI values, also had no nMR biomarkers there (Figure 4A). The numbers of biomarkers differed for PI up to 784 and for nMR—only up to 5 per instance. Provided obviously higher number of the effective biomarkers, the pathway-based approach can be regarded beneficial and much more informative than the gene-based mutation analysis.
For the truncating mutations, we found that the number of respective pathway biomarkers was also significantly higher (up to 43 pathway biomarkers vs. only one gene biomarker), but they were identified in a smaller group of cancer types (Supplementary Image 2A). Nevertheless, the correlation between gene and pathway pairwise comparisons was 0.634, p-value = 3.62e-13.
Clustering Dendrograms of Cancer Localizations
Taking number of molecular pathways with significant AUC as a metric of the proximity between cancer types, we built clustering dendrograms for the 15 investigated cancer types. The dendrograms generated for the different cancer types differed considerably for the nMR and PI data. We focused on the results based on all mutations, because the dendrograms built using only truncating mutations were not biologically informative (Supplementary Images 2B,C).
First of all, the nMR-based tree had lower number of major clades (three vs. four for the PI data tree). Second, distances between the cancer localizations were more degenerated on the nMR tree (Figures 4B,C). These features may reflect the approximately two orders of magnitude lower numbers of biomarkers used to construct dendrograms identified for the nMR data. Clade compositions were largely similar between both types of tree, but the above considerations suggest in favor of using pathway- rather than gene-specific tree based on mutation data.
Interestingly, positions on the clades of all the dendrograms were not linked with the anatomical proximities of the respective localizations in human body. This suggests that accumulations of characteristic mutations in cancers are following complex mechanisms that are not yet completely understood.
Discussion
Bioinformatic approaches based on measuring of molecular pathway activation were efficient in finding biomarkers using high throughput proteomics (25), mRNA (27, 51), microRNA (26) and even transcription factor binding site data (52). Here, we applied molecular pathway scoring approach to large scale mutation data. For the first time, we developed reliable universal method of measuring mutation enrichment of molecular pathways. It should be noted that the idea of collapsing mutation data has been already reflected in several previous studies. For example, bioinformatic tool BioBin overcomes sparsity of data by combining mutations into bins at the levels of molecular pathways, protein families, evolutionary conversed regions and regulatory regions (53, 54). An alternative approach for the same has been provided by the method Network regularized sparse non-negative TRI matrix factorization for PATHway identification using known molecular pathways and gene interaction networks (55). Unlike previous methods, our approach focuses on generation of universal parameters that objectively assess the mutation load of a molecular pathway. Previous approaches evaluated mutation load only based on presence or absence of a mutation, not considering number of gene products-pathway participants and lengths of their DNA coding sequences, which hindered accurate comparison of pathways. These major problems were addressed by the current PI approach, which provides clear, simple and reliable universal measure of mutation burden of molecular pathways.
We adopted this method for finding mutation biomarkers of cancers. On the example of 5,956 exome sequencing profiles of different cancer patients we showed at least two order of magnitude superior performance of the pathway instability scoring compared to the single gene-based approach.
In the current approach, we did not classify the effects of the different mutations on the pathway activities because only a minor fraction of the mutations identified has been experimentally characterized in terms of its impact on the protein and pathway functionalities. However, further accumulation of these data on a high throughput basis will make it possible to improve the PI calculation by adding the specific coefficients reflecting effect of every individual mutation on the respective protein. To assess stability of PI scoring, we also tested a version of this method considering only a minor fraction of truncating mutations that most likely led to the loss of gene function. Truncating mutations have demonstrated the same trends as the total fraction of mutations, thus confirming PI scoring robustness.
This method can be easily translated to comparisons of every sets of human exome or complete genome data. To this end, for every sample, mutations should be identified for the genes participating in the molecular pathways under investigation (1,748 pathways including 8,543 genes in this study). Pathway instability (PI) scores are then calculated showing relative mutation burden of each pathway in every biosample. These findings can be valuable per se for better understanding of the individual mechanisms of carcinogenesis. Furthermore, ROC AUC test can be next applied to the PI data to identify reliable biomarkers of the sample groups under comparison. All these procedures can be done by using publicly available bioinformatic tools, and the gene compositions of 1,748 molecular pathways required for PI calculation are available in the respective databases (35–40).
Taken together, our data suggest that in addition to better understanding of fundamental tissue-specific mechanisms of carcinogenesis, molecular pathway approach can be beneficial in finding reliable tumor type-specific biomarkers for identification of tumor origin in the low- or non-differentiated tumor histotypes. Pathway instability (PI) mutation data can be used as the additional criteria for differential diagnostics in oncology. Tumor relationship based on the pathway specific genetic signatures such as those shown on Figure 4C may help optimize design of the basket clinical trials. This may be also beneficial to help to predict common patterns in response to drugs and different treatment regimens.
Although a major focus of this study was made on the specific deviations in PI between the cancer types, we could also identify molecular pathways that were strongly mutated in all the cancer types, as previously predicted in the literature (19, 21).
Finally, we provide the list of 660 marker molecular pathways that distinguish between the major human cancer types. This list can be helpful for better understanding molecular grounds of carcinogenesis and for further investigations in molecular oncology and drug development.
Data Availability Statement
The datasets analyzed in this study are available in COSMIC public repository (COSMICv76; CosmicGenomeScreensMutantExport.tsv.gz, https://cancer.sanger.ac.uk/cosmic/download).
Author Contributions
MZ developed algorithms, did mutation/Pathway instability analyses, planned the research, and wrote the manuscript. SR planned the research, extracted, and filtered cancer mutation data. MS completed the molecular pathway database. NB developed algorithms, did statistical analyses, and planned the research. AB developed algorithms, planned the research, and wrote the manuscript.
Funding
This work was supported by Amazon and Microsoft Azure grants for cloud-based computational facilities for this study, by the Russian Science Foundation grant no. 18-15-00061 and by the Omicsway (Walnut, USA) research program in digital oncology.
Conflict of Interest Statement
The authors declare that the research was conducted in the absence of any commercial or financial relationships that could be construed as a potential conflict of interest.
Acknowledgments
We cordially thank Prof. Donald Geman (Johns Hopkins University, USA) for fruitful discussion and useful suggestions on the algorithm development and design of this study.
Supplementary Material
The Supplementary Material for this article can be found online at: https://www.frontiersin.org/articles/10.3389/fonc.2018.00658/full#supplementary-material
Supplementary Data Sheet 1. nMR scores for 19 872 genes in 5956 tumor samples. The scores were calculated using all mutations data.
Supplementary Data Sheet 2. nMR scores for 16 760 genes in 5297 tumor samples. The scores were calculated using truncating mutations data.
Supplementary Data Sheet 3. PI scores for 1748 molecular pathways in 5956 tumor samples. The scores were calculated using all mutations data.
Supplementary Data Sheet 4. PI scores for 1748 molecular pathways in 5297 tumor samples. The scores were calculated using truncating mutations data.
Supplementary Table 1. Tumor localizations and numbers of tumor samples investigated for each cancer type, for all mutations.
Supplementary Table 2. Tumor localizations and numbers of tumor samples investigated for each cancer type, for only truncating mutation.
Supplementary Table 3. The database accession numbers and primary localizations of 5956 tumor samples.
Supplementary Table 4. The database accession numbers and primary localizations of 5297 tumor samples containing truncating mutations.
Supplementary Table 5. AUC values for comparisons of every separately taken tumor type (localization) versus all other tumor types, calculated for all mutations. The sheet “Pathway biomarkers” contains AUC values and AUC 95% confidence intervals for pathways having AUC > 0.75 in at least one of the comparisons. The sheet “Gene biomarkers” includes AUC values and AUC 95% confidence intervals for genes having AUC > 0.75 in at least one of the comparisons.
Supplementary Table 6. AUC values for comparisons of every separately taken tumor type (localization) versus all other tumor types, calculated for truncating mutations. The sheet “Pathway biomarkers” contains AUC values and AUC 95% confidence intervals for pathways having AUC > 0.75 in at least one of the comparisons. The sheet “Gene biomarkers” includes AUC values and AUC 95% confidence intervals for genes having AUC > 0.75 in at least one of the comparisons.
Supplementary Table 7. List of tumor type-specific good-quality pathway biomarkers for eight tumor types, obtained using all mutations data. Every sheet corresponds to the primary localization of tumors and contains pathway names, AUC values and their 95% confidence interval (CI), mark about PI values of this tumor type relative to others, average PI scores for all cancer types, average PI for this cancer type. TCGA abbreviations of tumor types were used: uterine corpus endometrial carcinoma - UCEC, acute myeloid leukemia - LAML, kidney renal papillary cell carcinoma - KIRP, kidney renal clear cell carcinoma - KIRC, colorectal cancer - COADREAD, lung adenocarcinoma - LUAD, lung squamous cell carcinoma - LUSC, prostate adenocarcinoma - PRAD, skin cutaneous melanoma - SKCM, thyroid carcinoma - THCA. The data about all mutations was used.
Supplementary Table 8. List of colorectal cancer specific good-quality pathway biomarkers, obtained using truncating mutations data. The table contains pathway names, AUC values and their 95% confidence intervals (CI), note PI scores for colorectal cancer relative to other cancer types.
Supplementary Table 9. 1145 pathways with AUC < 0.7 for all tumor types in comparisons of every separately taken tumor type (localization) versus all other tumor types. All mutations data were used.
Supplementary Image 1. Correlations with gene coding DNA sequence lengths. (A) Correlation of Mutation rates (MR) and gene CDS lengths calculated for 5956 samples from fifteen tumor localizations, for all mutations. (B) Correlation of Normalized mutation rates (nMR) and gene CDS lengths calculated for the same biosamples, for all mutations. (C) Correlation of Mutation rates (MR) and gene CDS lengths calculated for 5297 samples from fifteen tumor localizations, for truncating mutations. (D) The correlation of Normalized mutation rates (nMR) and gene CDS lengths for the same biosamples, for truncating mutations.
Supplementary Image 2. (A) Data matrix of high quality (AUC > 0.75) biomarkers for pairwise comparisons between different cancer types based on truncating mutations only. The cancer types are abbreviated as follows: breast invasive carcinoma - BRCA, brain lower grade glioma - LGG, glioblastoma multiforme - GBM, cervical squamous cell carcinoma and endocervical adenocarcinoma - CESC, uterine corpus endometrial carcinoma - UCEC, acute myeloid leukemia - LAML, kidney renal papillary cell carcinoma - KIRP, kidney renal clear cell carcinoma - KIRC, colorectal cancer - COADREAD, liver cancer - LICA, liver hepatocellular carcinoma - LIHC, lung adenocarcinoma - LUAD, lung squamous cell carcinoma - LUSC, ovarian serous cystadenocarcinoma - OV, prostate adenocarcinoma - PRAD, skin cutaneous melanoma - SKCM, stomach adenocarcinoma - STAD, thyroid carcinoma - THCA, bladder urothelial carcinoma - BLCA. The lower triangle shows numbers of good biomarkers for pathway-based data (PI); the upper triangle - for individual gene-based mutation data (nMR). (B) Clustering dendrogram built for the fifteen cancer types based on mutation biomarker (PI) data for truncating mutations. Number of biomarkers was used as the distance metric. (C) Clustering dendrogram built for the above fifteen cancer types using mutation biomarker (nMR) data for truncating mutations. Number of biomarkers was used as the distance metric.
Abbreviations
CDS length, coding DNA sequence length; COSMIC, Catalog Of Somatic Mutations In Cancer; ICGC, International Cancer Genome Consortium; MR, Mutation rate; nMR, Normalized mutation rate; PAS, pathway activation strength; PCA, principal component analysis; PI, Pathway instability; ROC AUC, Receiver Operator Characteristics Area Under the Curve; TCGA, The Cancer Genome Atlas.
References
1. Sieber O, Heinimann K, Tomlinson I. Genomic stability and tumorigenesis. Semin Cancer Biol. (2005) 15:61–6. doi: 10.1016/j.semcancer.2004.09.005
2. Jakóbisiak M, Lasek W, Gołab J. Natural mechanisms protecting against cancer. Immunol Lett. (2003) 90:103–22. doi: 10.1016/j.imlet.2003.08.005
3. Cha HJ, Yim H. The accumulation of DNA repair defects is the molecular origin of carcinogenesis. Tumor Biol. (2013) 34:3293–302. doi: 10.1007/s13277-013-1038-y
4. Vogelstein B, Papadopoulos N, Velculescu VE, Zhou S, Diaz LA, Kinzler KW, et al. Cancer genome landscapes. Science (2013) 339:1546–58. doi: 10.1126/science.1235122
5. Kandoth C, McLellan MD, Vandin F, Ye K, Niu B, Lu C, et al. Mutational landscape and significance across 12 major cancer types. Nature (2013) 502:333–9. doi: 10.1038/nature12634
6. Bignell GR, Greenman CD, Davies H, Butler AP, Edkins S, Andrews JM, et al. Signatures of mutation and selection in the cancer genome. Nature (2010) 463:893–8. doi: 10.1038/nature08768
7. Campbell PJ, Yachida S, Mudie LJ, Stephens PJ, Pleasance ED, Stebbings LA, et al. The patterns and dynamics of genomic instability in metastatic pancreatic cancer. Nature (2010) 467:1109–13. doi: 10.1038/nature09460
8. International Cancer Genome Consortium TICG, Hudson TJ, Anderson W, Artez A, Barker AD, Bell C, et al. International network of cancer genome projects. Nature (2010) 464:993–8. doi: 10.1038/nature08987
9. Rafiq S, Khan S, Tapper W, Collins A, Upstill-Goddard R, Gerty S, et al. A genome wide meta-analysis study for identification of common variation associated with breast cancer prognosis. PLoS ONE (2014) 9:e101488. doi: 10.1371/journal.pone.0101488
10. Mitra AP, Lerner SP. Potential role for targeted therapy in muscle-invasive bladder cancer: lessons from the cancer genome atlas and beyond. Urol Clin North Am. (2015) 42:201–15. doi: 10.1016/j.ucl.2015.01.003
11. Keshaviah A, Dellapasqua S, Rotmensz N, Lindtner J, Crivellari D, Collins J, et al. CA15-3 and alkaline phosphatase as predictors for breast cancer recurrence: a combined analysis of seven International Breast Cancer Study Group trials. Ann Oncol. (2006) 18:701–8. doi: 10.1093/annonc/mdl492
12. Krishnan STM, Philipose Z, Rayman G. Lesson of the week: hypothyroidism mimicking intra-abdominal malignancy. BMJ (2002) 325:946–7. doi: 10.1136/bmj.325.7370.946
13. Sonnenschein C, Soto AM. Theories of carcinogenesis: an emerging perspective. Semin Cancer Biol. (2008) 18:372–7. doi: 10.1016/j.semcancer.2008.03.012
14. Røsland GV, Engelsen AST. Novel points of attack for targeted cancer therapy. Basic Clin Pharmacol Toxicol. (2015) 116:9–18. doi: 10.1111/bcpt.12313
15. Duffy MJ. Clinical use of tumor biomarkers: an overview. Klin Biochem Metab. (2017) 25:157–61. Available online at: http://www.cskb.cz/res/file/KBM-pdf/2017/2017-4/KBM-2017-4-Duffy-157.pdf (Accessed August 29, 2018).
16. Sowter HM, Ashworth A. BRCA1 and BRCA2 as ovarian cancer susceptibility genes. Carcinogenesis (2005) 26:1651–6. doi: 10.1093/carcin/bgi136
17. Thériault C, Pinard M, Comamala M, Migneault M, Beaudin J, Matte I, et al. MUC16 (CA125) regulates epithelial ovarian cancer cell growth, tumorigenesis and metastasis. Gynecol Oncol. (2011) 121:434–43. doi: 10.1016/j.ygyno.2011.02.020
18. Zhang Q, Burdette JE, Wang JP. Integrative network analysis of TCGA data for ovarian cancer. BMC Syst Biol. (2014) 8:1338. doi: 10.1186/s12918-014-0136-9
19. Chong ML, Loh M, Thakkar B, Pang B, Iacopetta B, Soong R. Phosphatidylinositol-3-kinase pathway aberrations in gastric and colorectal cancer: meta-analysis, co-occurrence and ethnic variation. Int J Cancer (2014) 134:1232–8. doi: 10.1002/ijc.28444
20. Li H, Zeng J, Shen K. PI3K/AKT/mTOR signaling pathway as a therapeutic target for ovarian cancer. Arch Gynecol Obstet. (2014) 290:1067–78. doi: 10.1007/s00404-014-3377-3
21. Toren P, Zoubeidi A. Targeting the PI3K/Akt pathway in prostate cancer: challenges and opportunities. Int J Oncol. (2014) 45:1793–801. doi: 10.3892/ijo.2014.2601
22. Buzdin AA, Zhavoronkov AA, Korzinkin MB, Venkova LS, Zenin AA, Smirnov PY, et al. Oncofinder, a new method for the analysis of intracellular signaling pathway activation using transcriptomic data. Front Genet. (2014) 5:55. doi: 10.3389/fgene.2014.00055
23. Ozerov IV, Lezhnina KV, Izumchenko E, Artemov AV, Medintsev S, Vanhaelen Q, Aliper A, et al. In silico pathway activation network decomposition analysis (iPANDA) as a method for biomarker development. Nat Commun. (2016) 7:13427. doi: 10.1038/ncomms13427
24. Buzdin A, Sorokin M, Garazha A, Sekacheva M, Kim E, Zhukov N, et al. Molecular pathway activation - new type of biomarkers for tumor morphology and personalized selection of target drugs. Semin Cancer Biol. (2018) 53:110–24. doi: 10.1016/j.semcancer.2018.06.003
25. Borisov N, Suntsova M, Sorokin M, Garazha A, Kovalchuk O, Aliper A, et al. Data aggregation at the level of molecular pathways improves stability of experimental transcriptomic and proteomic data. Cell Cycle (2017) 16:1810–23. doi: 10.1080/15384101.2017.1361068
26. Artcibasova AV, Korzinkin MB, Sorokin MI, Shegay PV, Zhavoronkov AA, Gaifullin N, et al. MiRImpact, a new bioinformatic method using complete microRNA expression profiles to assess their overall influence on the activity of intracellular molecular pathways. Cell Cycle (2016) 15:689–98. doi: 10.1080/15384101.2016.1147633
27. Aliper AM, Korzinkin MB, Kuzmina NB, Zenin AA, Venkova LS, Smirnov PY, et al. Mathematical justification of expression-based Pathway Activation Scoring (PAS). Methods Mol Biol. (2017) 1613:31–51. doi: 10.1007/978-1-4939-7027-8_3
28. Buzdin AA, Prassolov V, Zhavoronkov AA, Borisov NM. Bioinformatics meets biomedicine: oncofinder, a quantitative approach for interrogating molecular pathways using gene expression data. Methods Mol Biol. (2017) 1613:53–83. doi: 10.1007/978-1-4939-7027-8_4
29. Borisov NM, Terekhanova NV, Aliper AM, Venkova LS, Smirnov PY, Roumiantsev S, et al. Signaling pathways activation profiles make better markers of cancer than expression of individual genes. Oncotarget (2014) 5:10198–205. doi: 10.18632/oncotarget.2548
30. Buzdin AA, Zhavoronkov AA, Korzinkin MB, Roumiantsev SA, Aliper AM, Venkova LS, et al. The OncoFinder algorithm for minimizing the errors introduced by the high-throughput methods of transcriptome analysis. Front Mol Biosci. (2014) 1:8. doi: 10.3389/fmolb.2014.00008
31. Forbes SA, Beare D, Gunasekaran P, Leung K, Bindal N, Boutselakis H, et al. COSMIC: exploring the world's knowledge of somatic mutations in human cancer. Nucleic Acids Res. (2015) 43:D805–11. doi: 10.1093/nar/gku1075
32. Forbes SA, Beare D, Boutselakis H, Bamford S, Bindal N, Tate J, et al. COSMIC: somatic cancer genetics at high-resolution. Nucleic Acids Res. (2017) 45:D777–83. doi: 10.1093/nar/gkw1121
33. Home - The Cancer Genome Atlas - Cancer Genome - TCGA. Available online at: https://cancergenome.nih.gov/ (Accessed September 19, 2018).
34. Tomczak K, Czerwinska P, Wiznerowicz M. The Cancer Genome Atlas (TCGA): an immeasurable source of knowledge. Contemp Oncol. (2015) 19:A68–77. doi: 10.5114/wo.2014.47136
35. Croft D, Mundo AF, Haw R, Milacic M, Weiser J, Wu G, et al. The Reactome pathway knowledgebase. Nucleic Acids Res. (2014) 42:D472–7. doi: 10.1093/nar/gkt1102
36. Schaefer CF, Anthony K, Krupa S, Buchoff J, Day M, Hannay T, et al. PID: the pathway interaction database. Nucleic Acids Res. (2009) 37:D674–9. doi: 10.1093/nar/gkn653
37. Kanehisa M, Goto S. KEGG: kyoto encyclopedia of genes and genomes. Nucleic Acids Res. (2000) 28:27–30. doi: 10.1093/nar/28.1.27
38. Romero P, Wagg J, Green ML, Kaiser D, Krummenacker M, Karp PD. Computational prediction of human metabolic pathways from the complete human genome. Genome Biol. (2004) 6:R2. doi: 10.1186/gb-2004-6-1-r2
39. Nishimura D. BioCarta. Biotech Softw Internet Rep. (2001) 2:117–120. doi: 10.1089/152791601750294344
40. QIAGEN - Sample to Insight. Available online at: https://www.qiagen.com/us/shop/genes-and-pathways/pathway-central/ (Accessed September 19, 2018).
41. Murtagh F, Legendre P. Ward's Hierarchical Agglomerative Clustering Method: which algorithms implement ward's criterion? J Classif. (2014) 31:274–95. doi: 10.1007/s00357-014-9161-z
43. Boyd JC. Mathematical tools for demonstrating the clinical usefulness of biochemical markers. Scand J Clin Lab Invest Suppl. (1997) 227:46–63. doi: 10.1080/00365519709168308
44. Chen L, Zhou Y, Tang X, Yang C, Tian Y, Xie R, et al. EGFR mutation decreases FDG uptake in non-small cell lung cancer via the NOX4/ROS/GLUT1 axis. Int J Oncol. (2018) 54:370–80. doi: 10.3892/ijo.2018.4626
45. Tanioka M, Fan C, Parker JS, Hoadley KA, Hu Z, Li Y, et al. Integrated analysis of RNA and DNA from the phase III trial CALGB 40601 identifies predictors of response to trastuzumab-based neoadjuvant chemotherapy in HER2-positive breast cancer. Clin Cancer Res. (2018) 24:5292–304. doi: 10.1158/1078-0432.CCR-17-3431
46. Liu T, Cheng G, Kang X, Xi Y, Zhu Y, Wang K, et al. Noninvasively evaluating the grading and IDH1 mutation status of diffuse gliomas by three-dimensional pseudo-continuous arterial spin labeling and diffusion-weighted imaging. Neuroradiology (2018) 60:693–702. doi: 10.1007/s00234-018-2021-5
47. Fodde R. The APC gene in colorectal cancer. Eur J Cancer (2002) 38:867–71. doi: 10.1016/S0959-8049(02)00040-0
48. Risinger JI, Hayes K, Maxwell GL, Carney ME, Dodge RK, Barrett JC, et al. PTEN mutation in endometrial cancers is associated with favorable clinical and pathologic characteristics. Clin Cancer Res. (1998) 4:3005–10.
49. Cohen Y, Xing M, Mambo E, Guo Z, Wu G, Trink B, et al. BRAF mutation in papillary thyroid carcinoma. JNCI J Natl Cancer Inst. (2003) 95:625–7. doi: 10.1093/jnci/95.8.625
50. Lawrence MS, Stojanov P, Polak P, Kryukov GV, Cibulskis K, Sivachenko A, et al. Mutational heterogeneity in cancer and the search for new cancer-associated genes. Nature (2013) 499:214–8. doi: 10.1038/nature12213
51. Zhu Q, Izumchenko E, Aliper AM, Makarev E, Paz K, Buzdin AA, et al. Pathway activation strength is a novel independent prognostic biomarker for cetuximab sensitivity in colorectal cancer patients. Hum genome Var. (2015) 2:15009. doi: 10.1038/hgv.2015.9
52. Nikitin D, Penzar D, Garazha A, Sorokin M, Tkachev V, Borisov N, et al. Profiling of human molecular pathways affected by retrotransposons at the level of regulation by transcription factor proteins. Front Immunol. (2018) 9:30. doi: 10.3389/fimmu.2018.00030
53. Moore CB, Wallace JR, Frase AT, Pendergrass SA, Ritchie MD. BioBin: a bioinformatics tool for automating the binning of rare variants using publicly available biological knowledge. BMC Med Genomics (2013) 6(Suppl. 2):S6. doi: 10.1186/1755-8794-6-S2-S6
54. Kim D, Li R, Dudek SM, Wallace JR, Ritchie MD. Binning somatic mutations based on biological knowledge for predicting survival: an application in renal cell carcinoma. Pac Symp Biocomput. (2015)20:96–107. doi: 10.1142/9789814644730_0011
Keywords: cancer, DNA mutation, molecular pathways, biomarker, pathway instability
Citation: Zolotovskaia MA, Sorokin MI, Roumiantsev SA, Borisov NM and Buzdin AA (2019) Pathway Instability Is an Effective New Mutation-Based Type of Cancer Biomarkers. Front. Oncol. 8:658. doi: 10.3389/fonc.2018.00658
Received: 19 October 2018; Accepted: 12 December 2018;
Published: 04 January 2019.
Edited by:
Rengyun Liu, Johns Hopkins University, United StatesReviewed by:
Dokyoon Kim, Geisinger Health System, United StatesQi Zhao, Sun Yat-sen University Cancer Center (SYSUCC), China
Copyright © 2019 Zolotovskaia, Sorokin, Roumiantsev, Borisov and Buzdin. This is an open-access article distributed under the terms of the Creative Commons Attribution License (CC BY). The use, distribution or reproduction in other forums is permitted, provided the original author(s) and the copyright owner(s) are credited and that the original publication in this journal is cited, in accordance with accepted academic practice. No use, distribution or reproduction is permitted which does not comply with these terms.
*Correspondence: Marianna A. Zolotovskaia, em9sb3RvdnNrYXlhQG9uY29ib3guY29t