 C. Gaillard
 H. Lotz1
- 1University Lyon, University Claude Bernard Lyon 1, CNRS/IN2P3, IP2I Lyon, Villeurbanne, France
- 2University Lyon, University Claude Bernard Lyon 1, IUT Lyon-1, Département Chimie, Lyon, France
- 3IRSN, LETR—BP3, St-Paul-Lez-Durance Cedex, France
We present new insights into the study of the UO2+x/U4O9 equilibrium in UO2 as a function of the hyper-stoichiometry (x) by coupling HERFD-XANES at the uranium M4-edge with micro-Raman spectroscopy mapping. XANES allowed the measurement of uranium speciation in the samples, while Raman spectroscopy was used to individually characterize the composition and localization of the different oxide phases. UO2 pellets were oxidized under dry conditions at temperatures above the UO2+x/U4O9 phase transition to reach hyper-stoichiometries in the range of 0.01 ≤ x ≤ 0.1. Combining both techniques, we could determine the proportions of U4O9 and UO2+x. We show that at a low O/U ratio, U4O9 is present as small clusters inside UO2 grains. As the O/U increases, we found evidence of the formation of a network of U4O9 crystallized inside the UO2+x grains. The variation of the UO2+x phase hyper-stoichiometry (x) was evaluated as a function of the sample oxidation.
1 Introduction
Uranium oxide UO2 is widely studied because of its use as a nuclear fuel in nuclear pressurized water reactor power plants. An important parameter that can affect the fuel’s performance is fuel oxidation, which can occur during normal reactor operations in the case of a defective rod or during reactor accident conditions. Under LOCA (LOss of Coolant Accident) conditions, fuel oxidizes due to high temperatures and the steam environment, affecting its thermal properties and the release of fission products (Horlait et al., 2023; Kudo et al., 2007; Le Gall et al., 2020). Understanding oxidation mechanisms and characterizing formed oxide phases are therefore important to evaluate all consequences of this type of accident. Both the kinetics of oxidation and the crystallographic structures of the U–O oxide phases (α, β, γ- U4O9, U3O7, α, β- U3O8) have been studied extensively (Taylor, 2005; Mc Eachern and Taylor, 1998; Rousseau et al., 2006; Desgranges et al., 2011; Garrido et al., 2006; Soulié et al., 2019; Mc Eachern, 1997). UO2 has a fluorite structure of Fm-3m. At high temperatures, UO2 oxidation forms a UO2+x single phase, where oxygen atoms are incorporated into the fluorite structure in interstitial octahedral sites. At lower temperatures, UO2+x coexists with α-U4O9 (=UO2.25). In hyper-stoichiometric compounds, the charge balance is made by the valence change of uranium cations from U4+ to U5+, while interstitial oxygen atoms are accommodated as Willis clusters involving two oxygen vacancies, two oxygen O′ atoms, and two O″ atoms. A further increase in interstitial oxygen atoms leads to a distortion of the unit cell from cubic to tetragonal and ultimately to a monoclinic structure. The formation of U4O9 (and U3O7) involves a slight volume reduction, while the formation of U3O8 involves a 36% volume increase.
The transition mechanism from UO2+x to U4O9 has been widely investigated in terms of phase transition, establishing the U–O equilibrium phase diagram (Bannister and Buykx, 1974; Blackburn, 1958; Gronvold, 1955; Guéneau et al., 2002; Higgs et al., 2007; Ishii et al., 1970; Lierde et al., 1970; Matsui and Naito, 1975). However, few have studied the morphological changes in polycrystalline UO2 after oxidative treatments. Whillock and Pearce studied the distribution and percentage of U4O9 in oxidized UO2 (total O/U ratio between 2.05 and 2.12) (Whillock and Pearce, 1990). They found different types of morphology for U4O9 in UO2, from needles to starbursts or massive blocks, as the U4O9 proportion varies from 20% to 40%. Schaner studied the UO2–U4O9 equilibrium phase diagram between UO2.006 and UO2.176 on polycrystalline UO2 pellets using metallographic techniques (Schaner, 1960), finding that U4O9 solubility in UO2+x depends on temperature. In addition, photomicrographs of the sample surfaces taken after different oxidative treatments at 900 °C show that the U4O9 morphology inside UO2+x grains depends on the O/U ratio and on the experimental procedure used to cool the samples at ambient temperature (slow temperature decrease or quenching below the phase transition limit).
In this study, we contribute to the study of the UO2+x/U4O9 equilibrium in UO2 as a function of hyper-stoichiometry by coupling HERFD-XANES at the uranium M4-edge with micro-Raman spectroscopy mapping. XANES allows the measurement of uranium speciation in the samples, while Raman spectroscopy individually characterizes the composition and localization of the different oxide phases in UO2 pellets. Combining both techniques, we could determine the proportion between U4O9 and UO2+x and evaluate the variation of the UO2+x phase stoichiometry (x) as a function of the sample oxidation.
2 Materials and methods
2.1 Sample preparation
Depleted UO2 pellets (diameter 9 mm × 1.6 mm thick) of high bulk density (97.5% of the theoretical density) sintered at 1750 °C under reducing conditions (Ar/H2 5%) for 5 h were provided by Framatome. Their average grain size was 11 μm, which is comparable to that of the PWR nuclear fuel. The pellets were polished on one side by the PRIMEVerre company (Montpellier, France) with a ¼ µm diamond paste. The samples were then annealed in a PECKLY© tubular furnace at 1000 °C for 10 h under vacuum (10–7 mbar) to de-gas adsorbed species on the pellets. Second, annealing at 1600 °C for 4 h in a NABERTHERM© tubular furnace was performed under a Ar/H2 5% gas mixture flowing through ultrahigh capacity oxygen and moisture traps. This thermal treatment allowed annealing of the polishing defects while avoiding UO2 oxidation.
UO2 oxidation was performed by thermal annealing under a dry atmosphere using different protocols according to the samples (Table 1). Before and after each annealing, the pellets were weighted with a Sartorius μ-balance with a ±2 μg accuracy. The O/U ratio was calculated from the mass gain of the samples during annealing, with an error of ±0.001.
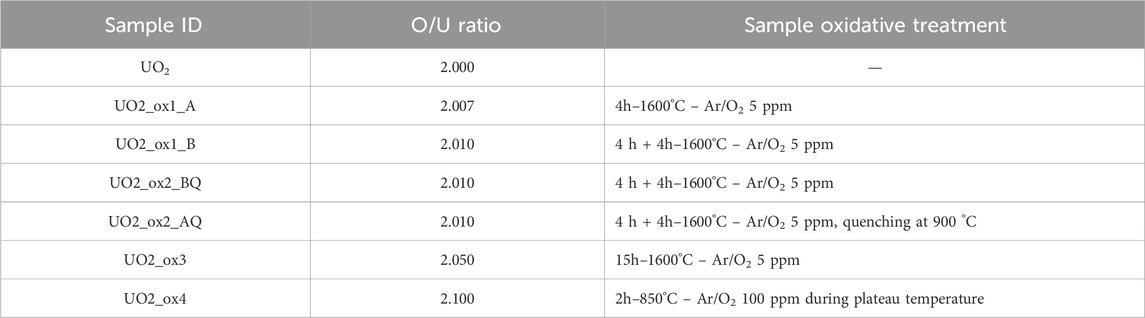
Table 1. Summary of the sample oxidative treatments.
Samples UO2_ox1_A and UO2_ox1_B correspond to the same initial pellet. For UO2_ox1_A, the pellet was annealed in a NABERTHERM© tubular furnace at 1600 °C under an Ar/O2 5 ppm gas flow over 4 h, with a ramping of 300°/h for heating and cooling. After annealing, the pellet was weighed and analyzed by Raman spectroscopy. It was then oxidized a second time following the same experimental protocol (sample UO2_ox1_B) to reach a final O/U ratio of 2.010. The sample UO2_ox2 was submitted to the same annealing treatment as UO2_ox1_B to reach a 2.010 stoichiometry. Then, it was annealed in a steel tubular furnace at 900 °C for an hour under an Ar/O2 5 ppm gas flow. According to the O/U phase diagram (Guéneau et al., 2002; Lindemer and Besmann, 1985), this annealing condition allows the dissolution of any U4O9 phase that might be present in the sample to form the sole UO2+x phase. Sample quenching was then performed to keep this UO2+x phase at an ambient temperature. This rapid sample cooling, from 900 °C to room temperature, was achieved in 10 minutes under the same atmospheric conditions as those during the annealing (Ar/O2 5 ppm gas flow). After this quenching, no mass variation was detected on the pellet, so we can assume that its final stoichiometry was the same as before quenching (2.010). Sample UO2_ox3 was prepared by annealing at 1600 °C under an Ar/O2 5 ppm gas flow for 15 h. Sample UO2_ox4 was obtained using a SETARAM© thermobalance. The UO2 pellet was placed in a quartz boat suspended in an oven. The analyzer was placed in a vacuum for 30 min and then filled with a carrier gas to avoid any gaseous pollution. The gases used were He and Ar/O2 100 ppm, the introduction of O2 being controlled by an oxygen sensor. In order to reach the O/U ratio = 2.10, oxidation was performed at 850 °C. A ramp of 10°C.min-1 was programmed up to 850 °C, then plateaued at 850 °C until the mass gain was reached, and finally the heating was switched off. O2 was added only during the plateau at 850 °C, while the increase and decrease in temperature were performed under He. The mass gain was achieved in 3.5 h. Supplementary Figure S1 displays the mass gain variation with time and temperature; these curves show that the mass gain of the pellet is linear with time at 850 °C. The change of atmosphere at the end of the plateau combined with the decrease of temperature (approximately 30 °C/min) probably limited the oxidation to a negligible level during the cooling stage.
2.2 HERFD-XANES measurements at the U M4-edge
High Energy Resolution Fluorescence Detected XANES (HERFD-XANES) data were measured at the MARS beamline of the SOLEIL synchrotron (Saint-Aubin, France) (Sitaud et al., 2012) on pellets. Spectra were measured at room temperature at the U M4-edge (3728 eV) using a double-crystal monochromator (DCM) equipped with a pair of Si(111) crystals. Higher harmonic rejection and vertical focusing were achieved using the Si strip of each mirror inserted before and after the DCM with a 4 mrad incidence angle. The beam size was 250 × 150 µm. The incident energy was calibrated using the absorption K-edge of potassium of a KBr pellet (3608.4 eV). HERFD-XANES was performed using the crystal-analyzer emission spectrometer in the Rowland geometry and a KETEK single-element silicon solid-state detector. The Mβ emission line of U (3339 eV) was analyzed using the 220 reflection of an Si (220) bent, diced crystal analyzer with a curvature radius of 1 m. The samples were oriented at 45° with respect to the incident beam. An He-filled balloon was used to reduce the scattering of the incident and emitted X-rays by the air between the sample and the crystal analyzer and the detector. No evolution of the spectra was observed during measurements under the beam. Collected spectra were normalized using ATHENA software (Ravel and Newville, 2005). The contributions of U(IV) and U(V) were derived from the linear combination of UO2 and U4O9 reference spectra.
2.3 Raman analysis
Raman spectroscopy analyses were performed on a Renishaw Invia Qontor equipped with a 1800 gr/mm grating using a He−Ne laser (633 nm). Mapping was recorded using a ×50 objective from 200 to 1300 cm−1. Great care was taken to ensure that the laser did not induce any structural modification during the measurements. Starting with low to high laser powers, analyses were repeated on the same point on a pellet surface to optimize our measurement parameters and verify that Raman spectra did not change under the effect of the beam. The incident laser power was thus fixed to 0.9 mW. A silicon standard was used to calibrate the spectrometer with its line frequency fixed at 520.5 cm−1. Raman mapping was performed on UO2 pellets with a spatial resolution of 1 × 1 μm2. Each mapping covered at least ten grains and the depth probed was estimated to be 3–5 µm (Griffiths and Hubbard, 1991). Data were processed on WIRE 5.4 software.
2.4 AFM
Atomic force microscopy (AFM) was performed on a NaioAFM microscope (Liestal, Switzerland) fitted with a 190 Al cantilever tip with the following dimensions: length, 225 μm; width, 38 μm; tip radius, 10 nm. The cantilever spring constant was 48 N m−1. Data analysis was performed using Nanosurf, Naio control software in the dynamic mode. The AFM images were recorded in air and at room temperature. Data treatment was performed using Gwyddion software.
3 Results
3.1 Chemical state of uranium in oxidized samples
HERFD-XANES at the U M4-edge probes the 5f unoccupied states, and it has been shown to be suitable for differentiating U(V) species from U(IV) and U(VI) (Kvashnina and Butorin, 2022). Therefore, we used this technique on UO2 oxidized samples in order to determine the uranium oxidation state. It must be noted that at this edge, the UO2 pellet is probed only over the first micrometer. Figure 1 displays the HERFD-XANES spectrum of a stoichiometric UO2 compared with spectra of oxidized samples at different O/U ratios. The first peak at 3725.3 eV corresponds to U(IV), while the second peak observed at 3726.4 eV corresponds to the presence of U(V). This latter peak is thus the signature of hyper-stoichiometry.
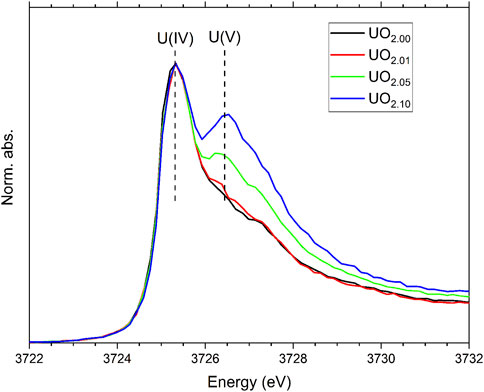
Figure 1. HERFD-XANES spectra at the U M4-edge of stoichiometric UO2 and oxidized UO2 samples at different O/U (see Table 1 for sample details).
UO2 oxidation can lead to the formation of different species: UO2+x, which is a mixture of U(IV) and U(V); U4O9 composed of 50% U(IV) and 50% U(V); U3O8 containing a mixture of U(V) and U(VI) (Leinders et al., 2020). We did not consider the latter oxide as we had no evidence of a U(VI) signal, which was further confirmed by Raman analysis (see below). Thus, spectra were fitted by a linear combination of U(IV) and U(V) reference spectra in order to determine the proportion between uranium oxidation degrees. Table 2 gives these results and the O/U ratio calculated from this proportion. The less oxidized sample UO2_ox1_B contained approximately 10% U4O9. Sample UO2_ox3 contained 30% U4O9 and a stoichiometry at the surface which was slightly higher than the average obtained by mass gain measurements (O/U = 2.08 vs. 2.05). Analysis of the UO2_ox4 sample showed a noticeable higher hyper-stoichiometry at the extreme surface (2.16) than average (2.10), and the presence of 65% U4O9.
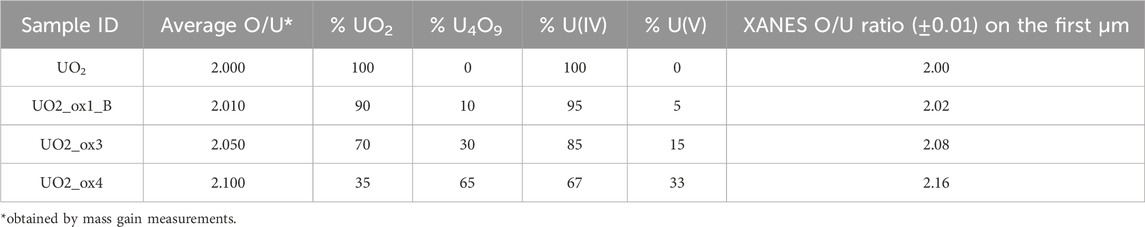
Table 2. Proportion of U(IV) and U(V) and stoichiometries in UO2 oxidized samples, obtained by linear fitting of HERFD-XANES spectra using reference compounds UO2 and U4O9. The average O/U ratio was obtained by mass gain measurements after oxidation treatments.
3.2 Speciation of uranium oxide phases by Raman spectroscopy
Raman spectroscopy was used to identify the different crystallographic phases that may be present in samples after oxidation. Three phases were expected: stoichiometric UO2, UO2+x, and U4O9. Their respective Raman spectra are shown in Supplementary Figure S2, and Raman mappings of stoichiometric UO2 were published in Gaillard et al. (2024). For stoichiometric UO2, the most intense band is the T2g band located at 444.6 cm−1, typical of the fluorite structure. This triply degenerate mode corresponds to the symmetrical vibration of oxygen atoms around an uranium atom (Keramidas and White, 1973). The second most intense band located at ∼1150 cm−1 corresponds to the 2LO band, an overtone of the first-order LO phonon (Livneh and Sterer, 2006; Elorrieta et al., 2018). Recent studies (Gaillard et al., 2024; Livneh, 2022) have shown that this band has a second weak contribution at 1196 cm−1; we did not take this into account in this study as it does not give additional information. Indeed, this band has the same behavior as the 1196 cm-1 one upon the formation of U4O9. Bands of very weak intensities are noticeable between 500 and 700 cm−1. These so-called U bands are correlated with the presence of defects in the UO2 crystallographic structure and to the formation of domains having a local symmetry lower than that of perfect UO2 (Guimbretière et al., 2012; Simon et al., 2023). The UO2+x spectrum is similar in shape to the UO2 spectrum. A slight blueshift of the T2g band is expected as the result of the UO2 lattice contraction (Spino and Peerani, 2008; Allen et al., 1982; He and Shoesmith, 2010). The insertion of oxygen atoms in the UO2 fluorite structure entails the presence of defects in the material, which is seen on the Raman spectrum by a slight widening of the T2g peak and an increase of the intensity of the U defect bands. Different features are observed on the U4O9 spectrum. A strong decrease of the T2g intensity and increase of the U band intensity are observed, while the 2LO band is no longer visible. We also observe a strong width widening of the T2g band, which shifts from ∼445 cm−1 in UO2 to ∼454 cm−1 in U4O9.
Thus, strong differences are present between U4O9 and UO2/UO2+x Raman spectra. In particular, the absence/presence of the 2LO band at 1150 cm−1 was used to detect the presence of U4O9 in the oxidized pellets. Table 3 summarizes the T2g band position and width measured, respectively, in the UO2+x and U4O9 phases of each oxidized sample.
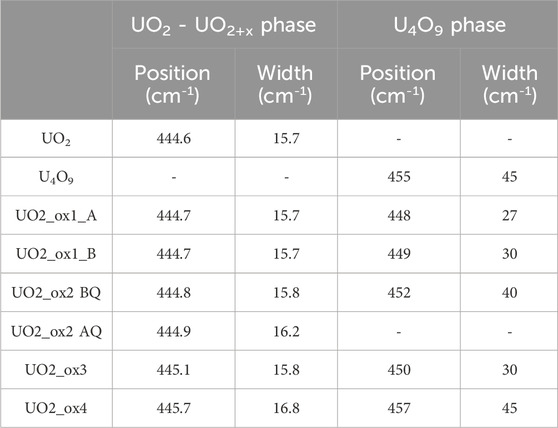
Table 3. Summary of the T2g band position and width in UO2/UO2+x and U4O9 phases (BQ = before quenching, AQ = after quenching, cf. part 2.2).
3.2.1 UO2 microstructure at low O/U (≤2.010)
Figure 2 presents Raman mappings of the UO2_ox1 sample oxidized twice consecutively. The first oxidation (on the left of the figure) led to an O/U ratio of 2.007 (sample UO2_ox1_A), while the second oxidation (on the right of the figure) led to a 2.010 stoichiometry (sample UO2_ox1_B). For both O/U ratios, the same region was analyzed by Raman spectroscopy in order to study the evolution of the sample surface morphology. On the optical image (Figure 2A), the region analyzed on sample UO2_ox1_A is indicated with a red rectangle, while the region analyzed on sample UO2_ox1_B corresponds to the whole optical picture. Mappings of the 2LO band intensity are displayed in Figures 2B,C, respectively. For both samples, we observe black areas of micrometric size where the 2LO band intensity is very weak. Raman spectra extracted from one of these regions are presented in Figure 3A for both samples, corresponding to U4O9 species. The 2LO band is visible, although its intensity is weak, probably because the zone probed by the laser also detected a UO2+x phase. In these U4O9 areas, the T2g band position and width values (Table 3) are intermediate between those of UO2 and U4O9.
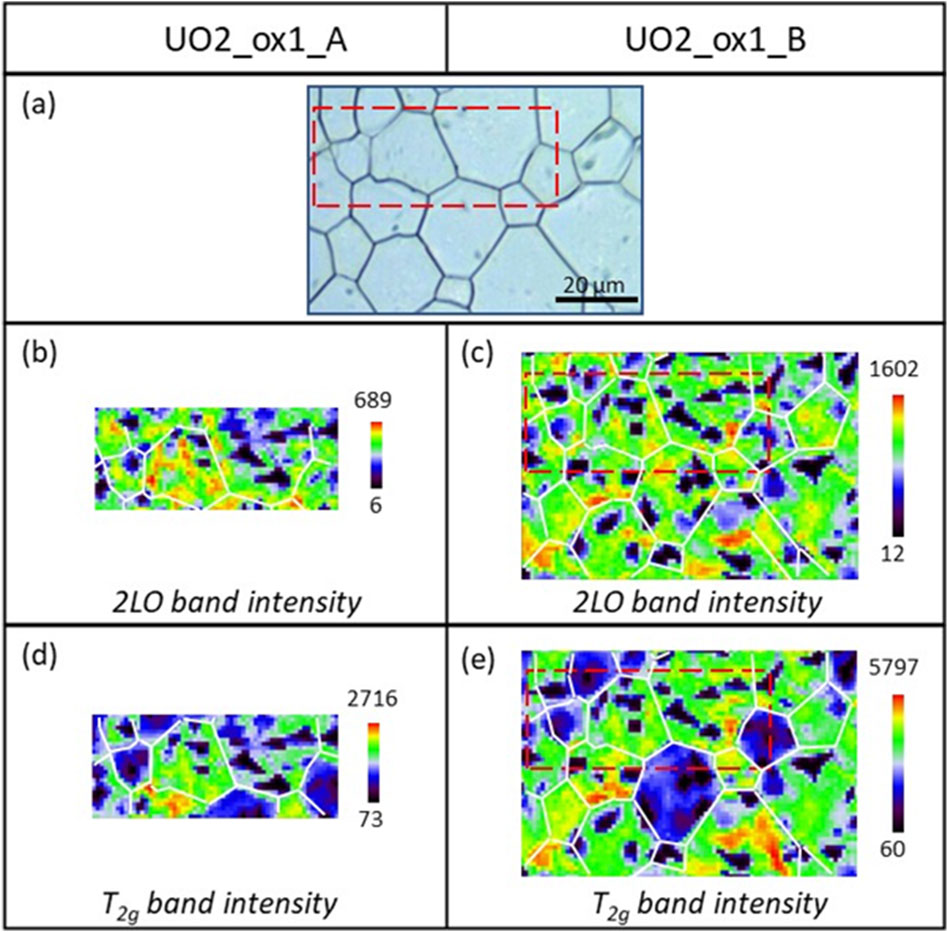
Figure 2. Raman mapping of the 2LO and T2g band intensities at the surface of sample UO2_ox1 after two oxidations (samples UO2_ox1_A on the left and UO2_ox1_B on the right). (A) Optical picture of the analyzed region; (B) and (C) Raman mapping of the 2LO band intensity; (D) and (E) Raman mapping of the T2g band intensity. The color scale corresponds to the intensity scale, from the lowest (black) to the highest (red) value. For clarity, grain boundaries visible on the optical picture are represented by white lines on the mapping.
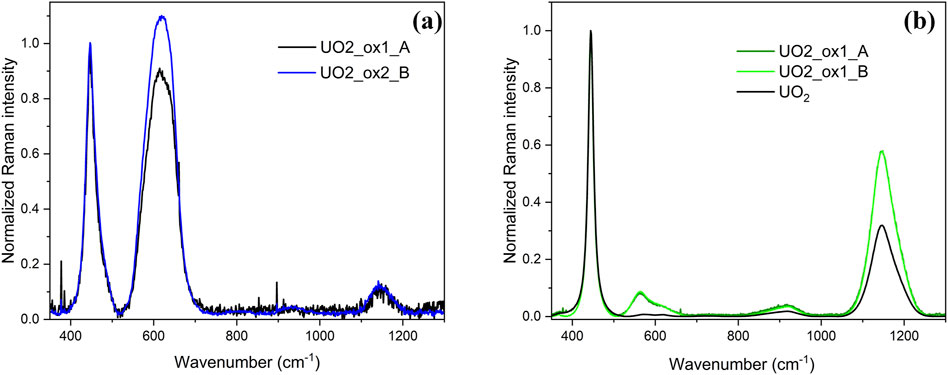
Figure 3. Raman spectra extracted from UO2_ox1_A and UO2_ox1_B sample mappings (cf. Figure 2). (A) Individual Raman spectra extracted in U4O9 area (back pixels on the mapping); (B) individual Raman spectra extracted in UO2+x area (green pixels on the mapping). Spectra were normalized on the T2g band intensity for comparison.
Outside the U4O9 zones, the 2LO band intensity mapping is quite homogeneous at the surface of the samples. Raman spectra extracted from this region, on the same grain for the two samples (UO2_ox1_A and UO2_ox1_B), are presented in Figure 3B and are identical. For comparison, a spectrum of stoichiometric UO2 is also shown in Figure 3B. We did not observe significant changes on the T2g band (same position and width, see Table 3) compared to UO2. However, the defect band intensity is noticeably higher than the stoichiometric UO2 spectrum.
On both samples, the U4O9 phase forms aggregates inside grains, located heterogeneously. Note that no U4O9 aggregates are present in grain boundaries. Comparing the first and second oxidation, U4O9 aggregates have similar shapes, sizes, and locations on samples. This indicates that during the second oxidation, U4O9 clusters formed in the same zones than during the first oxidation. This is noticeable considering the experiment that was performed; during the second oxidation process at 1600 °C, the U4O9 phases formed in sample UO2_ox1_A dissolved and then re-crystallized during the sample cooling. Thus, U4O9 crystallization inside grains is not a random process but is a reversible process that occurs in defined locations inside UO2 grains. In addition, the U4O9 aggregate size is comparable for both oxidations, probably because the final O/M ratios after the two oxidation treatments are close (2.007 and 2.010).
Figures 2D,E map the T2g band intensity for both oxidized samples. Outside the U4O9 clusters, we observe that this T2g intensity depends on grains. This effect is well-known and is due to the dependence of the T2g intensity on the different crystalline orientations of UO2 grains (Morgan et al., 2021; Maslova et al., 2019). Thus, the precipitation of U4O9 clusters inside grains does not affect global crystallography within the grain.
We performed AFM mapping on sample UO2_ox1_B. Particular interest was given to regions containing the U4O9 phase. Supplementary Figure S3A displays the Raman 2LO band intensity mapping which locates U4O9 zones on the pellet surface. This mapping was used to select two areas, indicated by white squares on Supplementary Figure S3A, where surface mapping was done by AFM. Supplementary Figures S3B–E show the 2D and 3D topography images. The color scale, from dark to light brown, indicates the roughness contrast at the surface. U4O9 zones are clearly visible as darker zones, which means that they correspond to lower planes (up to ∼50 nm) than UO2 zones. So we evidence that U4O9 formation entails a measurable local contraction of the lattice inside UO2 grains, even if the lattice parameter of both oxides only differ slightly: 5.44 Å for U4O9 (Gronvold, 1955; Allen and Holmes, 1995; Cooper and Willis, 2004) and 5.47 Å for UO2 (Gronvold, 1955; Desgranges et al., 2009; Leinders et al., 2015).
In conclusion, we detected the coexistence of UO2 and U4O9 phases for low hyper-stoichiometric UO2. The latter oxide crystallizes inside UO2 grains as micrometric clusters entail a local lattice contraction without altering the overall crystallography of the grains.
3.2.2 Effect of quenching on U4O9 formation
Quenching is a rapid cooling process which strongly limits atomic displacements and phase transformation. It permits obtaining at room temperature crystallographic phases formed at high temperature. Therefore, quenching, instead of a slow decrease in temperature, is an effective process for overcoming the precipitation of U4O9 formed during heating treatment (Gronvold, 1955; Schaner, 1960; Yao et al., 2018). Sample UO2_ox2 was first submitted to an oxidative annealing in order to obtain an O/U = 2.010. Then, it was submitted to a second thermal treatment at a temperature that entails the dissolution of the U4O9 phase (900°C) followed by quenching. No weight evolution of the pellet was measured before and after the quenching, indicating that the O/U ratio did not change during the experiment.
Raman spectroscopy was used to analyze the sample before and after quenching (Figure 4). Before quenching (Figures 4A,C), Raman mapping of the 2LO band intensity (Figure 4C) evidenced in black the presence of U4O9 clusters, as characterized previously. Interestingly, it is possible to see the shape of the U4O9 region on the optical picture with a weak contrast of color between U4O9 and UO2 (see white circles). Figures 4B and D present the optical picture and the corresponding 2LO band intensity mapping performed in the same zone after quenching from 900 °C. We observed the disappearance of the U4O9 aggregates. Thus, the sample is solely composed of a UO2.01 phase.
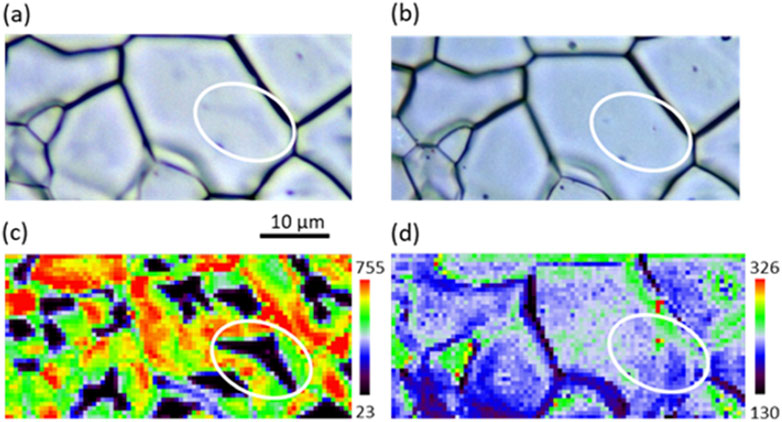
Figure 4. Effect of quenching on the 2LO band intensity Raman mapping of sample UO2_ox2. (A) Optical picture of the analyzed zone before and (B) after quenching; (C) and (D) Raman mapping of the 2LO intensity before (C) and after quenching (D).
As observed previously for sample UO2_ox1, the Raman mapping exhibited two vibrational signatures, U4O9 and UO2+x, before quenching. After quenching, only the UO2+x vibrational signature is present. Figure 5 presents the average spectra of UO2+x zones on the Raman mapping before (mapping without U4O9 areas) and after (whole mapping) quenching. Their shapes are identical except for a strong increase of defect band intensity after quenching. This can be explained by the dissolution of U4O9 aggregates at 900 °C and the incorporation of oxygen atoms in the UO2+x lattice which increases defect concentration. This phenomenon is also visible by the slight widening of the T2g band from 15.8 to 16.2 cm−1 and a slight but significant shift in the T2g band position (cf. Table 3).
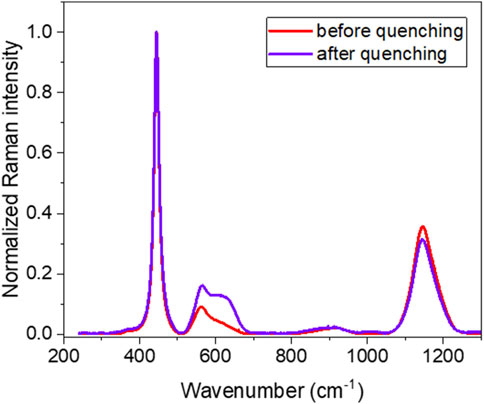
Figure 5. Effect of quenching on the Raman spectra of sample UO2_ox2. Average spectra of UO2+x zones on the Raman mapping before quenching (red); average spectrum of the mapping after quenching (blue). For comparison, spectra are normalized to the T2g band intensity.
3.2.3 Oxidized UO2 microstructure for O/U = 2.050
Raman mapping of the sample UO2_ox3 is presented in Figure 6. According to mass gain measurements, this sample has an average hyper-stoichiometry of 2.05, while HERFD-XANES analysis shows that its hyper-stoichiometry in the first micrometer is slightly higher at 2.08. This corresponds to the presence of approximately 30% of U4O9 in the sample, confirmed by the Raman analysis. Indeed, the 2LO band mapping intensity (Figure 6B) highlights numerous dark spots distributed over the sample surface, which correspond mainly to U4O9, as is shown on the Raman spectrum extracted from one of the black pixels (Supplementary Figure S4). In this sample, U4O9 does not form big clusters inside grains, as shown previously for lower stoichiometric samples, but is present in a rather homogeneous distribution as very small clusters inside grains (cf. Figure 6B). Supplementary Figure S3 also presents a spectrum extracted from a green pixel of the mapping; it is typical of a UO2+x phase and exhibits a shift of the T2g band to 445.1 cm−1. It is interesting to note that these UO2+x zones correspond mainly to grain boundaries, where little U4O9 is detected. Grains are slightly visible on the Raman mapping of the T2g band intensity (Figure 6C). So, despite the presence of about 30% of U4O9, the grain crystalline orientation is somehow maintained, and the fluorite structure remains present.
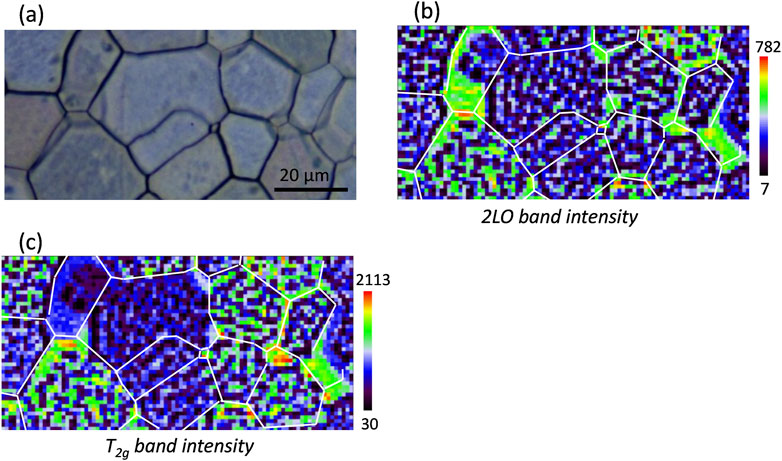
Figure 6. Raman mapping of sample UO2_ox3. (A) Optical picture of the analyzed zone; (B) 2LO band intensity mapping; (C) T2g band intensity mapping.
3.2.4 Oxidized UO2 microstructure for O/U = 2.10
Sample UO2_ox4 was prepared with a final hyper-stoichiometry of 2.10, following the protocol explained in experimental Section (2.2). HERFD-XANES analysis shows that it contains approximately 65% U4O9 on the first micrometer, resulting in a hyper-stoichiometry of 2.16. Its Raman mapping is presented in Figure 7. The 2LO band intensity mapping displays dark areas distributed as a zebra pattern on the sample surface. We did not observe any difference between grain and grain boundaries. As shown in Figure 8, these dark areas correspond to pure U4O9. Elsewhere on the pellet, Raman spectra show the presence of UO2+x. A spectrum extracted on a green pixel of the mapping is shown in Figure 8. A noticeable shift of the T2g band position in the UO2+x area measures 445.7 cm−1, larger than that measured at x = 2.05. Thus, as global hyper-stoichiometry increases, the proportion of U4O9 and the hyper-stoichiometry of the UO2+x phase increase. The T2g band intensity mapping is displayed in Figure 8C. Despite the large U4O9 concentration, it is still possible to distinguish the contrast between grains in the UO2+x phase. So, as observed at lower hyper-stoichiometries, the UO2 lattice is maintained despite the growth of the U4O9 phase.
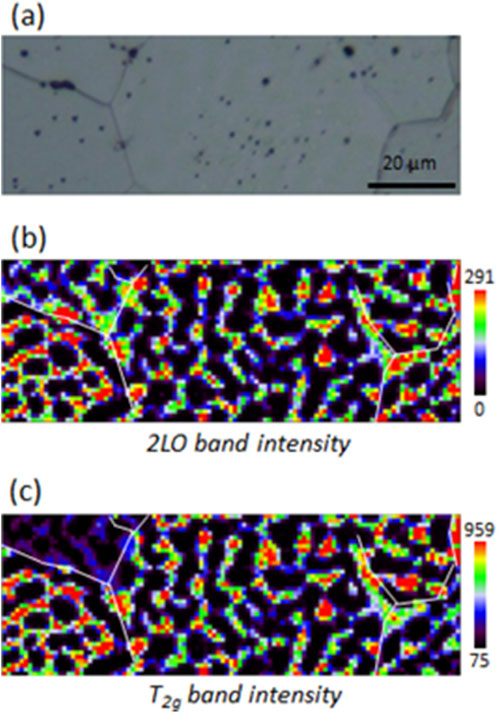
Figure 7. Raman mappings of sample UO2_ox4. (A) Optical picture of the analyzed zone; (B) 2LO band intensity mapping; (C) T2g band intensity mapping.
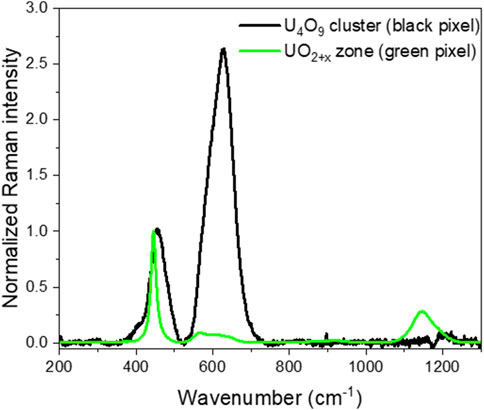
Figure 8. Raman spectra extracted on the mapping of sample UO2_ox4 in U4O9 clusters (black pixel on the mapping) and in UO2+x zone (green pixel on the mapping). Spectra are normalized to the T2g band intensity.
3.2.5 UO2+x phase composition as a function of the sample hyper-stoichiometry
Table 3 summarizes the T2g band position measured in UO2+x phase of oxidized samples, and we observe that this position shifts with the global hyper-stoichiometry of samples. Thanks to these measurements, it is possible to evaluate the O/M ratio specifically in UO2+x phases of our samples. Indeed, the increase of hyper-stoichiometry entails a contraction of the fluorite lattice parameter (Gronvold, 1955). This effect has a direct impact on the T2g band position, which is expected to shift to higher frequencies according to the Equation 1 (McBride et al., 1994):
where γ is the Gruneisen parameter (2.17 for UO2), ω is the T2g position for stoichiometric UO2, and Δa is the variation of the lattice parameter compared to the UO2 one (a0).
Therefore, knowing the T2g band position shift from pristine UO2 (ΔT2g), it is possible to determine the corresponding variation of the lattice parameter (Δa) (Medyk et al., 2020), and thus to evaluate the O/M ratio in the UO2+x phase. Indeed, the variation of the UO2+x lattice parameter as a function of x has been widely reported in the literature (Spino and Peerani, 2008). Results are given in Table 4, where they are compared with the O/U ratio calculated for the whole pellet from mass gain after oxidative treatments. For low oxidized samples UO2_ox1 and UO2_ox2_BQ, the T2g band shift measured in the UO2+x phase inside grains is uncertain; the corresponding O/U is actually close to 2. This means that in these samples, most additional oxygen atoms have formed the U4O9 phase while the UO2+x phase is stoichiometric or nearly so. In sample UO2_ox2_AQ formed by a sole UO2+x phase, the O/U value obtained by Raman measurement is in line with that obtained by mass gain measurement: ∼2.01. For samples UO2_ox3 and UO2_ox4, O/U ratios of the UO2+x phase increase with the global hyper-stoichiometry of the samples (respectively 2.010 and 2.023) and correspond roughly to 20% of the global O/U ratio.
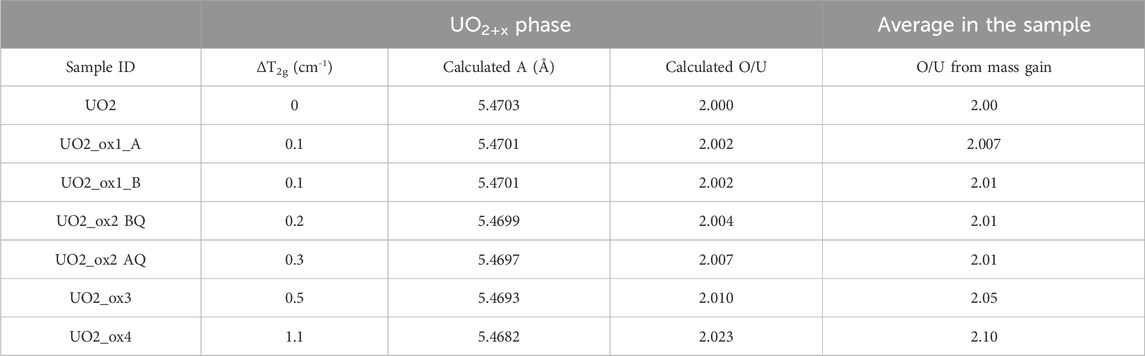
Table 4. Calculation of lattice parameters A and O/U ratio in the UO2+x phase of analyzed samples, from the T2g band shift ΔT2g. For comparison, O/U ratios obtained by mass gain are given.
4 Discussion
Our study consisted of oxidizing UO2 pellets, initially stoichiometric, to hyper-stoichiometries up to 2.1. As expected from the U–O phase diagram, we characterized two crystallographic phases, UO2+x and U4O9, by coupling HERFD-XANES and Raman spectroscopy measurements at room temperature. A significant discrepancy is observed between the calculated O/U ratios from XANES measurements and that obtained from the mass gain of samples for the most oxidized sample at 2.1. Indeed, the hyper-stoichiometry is higher at the extreme surface of the sample (XANES probes the first micrometer) than expected. Contrary to other samples, its thermal treatment was performed at 850 °C, not at 1600 °C. At the latter, the oxygen diffusion coefficient (D) in stoichiometric polycrystalline UO2 pellets is in the order of 10−6 cm2/s (Sabioni et al., 2000). Therefore, a constant repartition of oxygen over the whole pellet depth is obtained after a 4-h annealing, and the hyper-stoichiometry can be considered as constant inside the sample. This may not be the case at 850 °C for a 3.5 h annealing. The oxygen diffusion coefficient is significantly lower at this temperature, in the order of 10−11–10−12 cm2/s (Sabioni et al., 2000; Dorado et al., 2011; Berthinier et al., 2013). This corresponds to a diffusion of oxygen over the first ∼20 µm in sample UO2_ox4. However, it is known that the increase of UO2 stoichiometry entails a significant increase of oxygen diffusion. Large discrepancies exist in the literature concerning oxygen diffusion coefficients in UO2+x, probably because of the different experimental protocols used to make D measurements (Bittel et al., 1969; Bayoglu and Loreznzelli, 1984; Lay, 1970; Ruello et al., 2004). According to those data, the oxygen diffusion coefficient may range from 10−8 to 10−13 cm2/s at 850 °C. Therefore, it is difficult to precisely evaluate the diffusion depth of oxygen in sample UO2_ox4. It is expected to be above 20 µm but may not be large enough to assure a constant repartition of oxygen over the whole depth. This question will be addressed in further research by the characterization of pellet cross-sections.
Some have noticed preferential oxidation as a function of the grain orientation, based on work on UO2 single-crystals (Allen et al., 1988a; Allen et al., 1988b). We did not observe this phenomenon, as the amount of U4O9 was homogeneous at the pellet surface whatever the O/U. However, the experimental conditions used by Allen (300 °C, 1 torr of O2) significantly differ from ours and led to the formation of upper oxides (U3O7 and U3O8) not observed in our work. This also highlights the effect of the oxidative conditions on the nature of the oxides formed. In our study, oxidative annealing treatments were performed at 1600 °C or 850 °C—temperatures where the sole existing phase is UO2+x. The crystallographic phases we further characterized at room temperature are those “allowed” to form during the sample cooling—UO2+x and U4O9 according to the U–O phase diagram. When oxidation treatments are performed at lower temperature and under stronger oxidative conditions such as air, a prompt conversion of U4O9 into U3O7 and eventually U3O8 is observed (De Bona et al., 2022; Milena-Perez et al., 2023; Teixeira and Imakuma, 1991).
Thanks to the analysis of Raman mapping, we could evaluate the composition of the UO2+x phases as a function of the global O/U ratio of samples, while XANES could help evaluate the proportion of U4O9 inside samples. At low O/U (∼0.01), the UO2+x phase can be considered stoichiometric, which means that samples are composed of UO2 and ∼10% of U4O9. For O/U ≥ 2.05, samples are composed of U4O9 and of a UO2+x phase whose hyper-stoichiometry increases with the global O/U ratio. For O/U = 2.05, samples are composed of ∼70% of UO2.01 and ∼30% of U4O9, while at O/U = 2.1, they are composed of ∼65% U4O9 and 35% UO2.02. We thus observe that UO2+x phases display quite low O/M ratios, even for high global hyper-stoichiometries.
We could detect the U4O9 growth mechanism inside grains. At low hyper-stoichiometry (2.01), U4O9 is present as micrometric clusters inside stoichiometric UO2 grains. These clusters were formed during the slow cooling of our sample from a homogeneous UO2+x phase. Such clusters were evidenced by Allen et al. (1983) but for highly oxidized UO2 pellets at O/U = 2.24. As the hyper-stoichiometry increases to O/U = 2.1, these clusters coalesce to form a U4O9 network at the surface of the material. This kind of microstructure can be compared to those reported by previous research, showing that the precipitation of U4O9 in UO2+x leads to a Widmanstätten needle structure or the formation of platelets (Tuxworth and Evans, 1959) (Lierde et al., 1970; Whillock and Pearce, 1990; Schaner, 1960). The formation of U4O9 entails a local lattice contraction inside grains, evidenced by AFM, but without affecting the surrounding UO2 matrix. Even for high hyper-stoichiometry (x > 2.1) where U4O9 is the main crystallographic phase, the UO2 lattice is preserved and, consequently, we always observe a joint presence of two crystallographic phases. This is comparable with observations made by Allen et al. (1983) on UO2 pellets and Leinders et al. (2016) on UO2 nanopowders. We also show by twice oxidizing a UO2 sample at high temperature (1600 °C) that U4O9 clustering inside UO2 grains is not a random process and that it occurs in defined zones inside grains. One may link this fact with the presence of defects in grains that may constitute nucleation sites. The precipitation of U4O9 in UO2+x occurs by the agglomeration of oxygen atoms that produces defects. For this reason, some authors consider that the interface between UO2+x and U4O9 is equivalent to dislocations (Chevrel, 1992). One may envision that after the re-dissolution of U4O9, dislocations remain and, during the second oxidation annealing, favor the recrystallization of U4O9 in the same zone of grains. We have also observed that the formation of U4O9 occurs only inside grains, not in grain boundaries. The latter contain a high concentration of defects like dislocations that entail a lower crystallinity and, probably, tensile strains that may entail the clustering of U4O9.
5 Conclusion
We studied the UO2+x/U4O9 phase equilibrium in UO2 in the hyper-stoichiometry range 0.01 < × < 0.1 after thermal oxidation treatments performed under dry conditions at 850 °C or 1600 °C. By coupling HERFD-XANES at the uranium M4-edge and micro-Raman spectroscopy mapping, we could determine the proportion between each phase and their composition.
At low O/U, U4O9 is present as small clusters inside UO2 grains. Their formation, occurring during the slow cooling of our samples, does not occur in a random area of grains. Indeed, we show by twice repeating the annealing/cooling process that the U4O9 cluster size and location are identical. The presence of U4O9 entails a local contraction of the lattice, measurable by AFM, which does not affect the global structure of grains, even at a high U4O9 concentration.
As the O/U increases, the proportion of U4O9 and the UO2+x phase hyper-stoichiometry increase, leading to the formation of a network of U4O9 crystallized inside UO2+x grains. However, even for highly oxidized samples, we observed that the UO2+x phases exhibit only a slight O/M, meaning that during the slow cooling process, most of the additional oxygen atoms are incorporated as U4O9 in the samples.
Data availability statement
The raw data supporting the conclusions of this article will be made available by the authors, without undue reservation.
Author contributions
CG: conceptualization, formal analysis, funding acquisition, investigation, project administration, supervision, and writing–original draft. HL: formal analysis, investigation, and writing–original draft. LS: formal analysis, investigation, and writing–original draft. YP: funding acquisition and writing–review and editing. RD: funding acquisition and writing–review and editing. NM: funding acquisition and writing–review and editing.
Funding
The authors declare that financial support was received for the research, authorship, and/or publication of this article. The authors acknowledge the support of the French Agence Nationale de la Recherche (ANR) under grant ANR-21-CE05-0035 (project BENEFICIA).
Acknowledgments
We acknowledge S. Forel (LMI, UCBL, France) for her assistance using AFM, and M. Pijolat, V. Péres, and L. Vieille (Mines St Etienne, France) for the TGA experiments. The authors would also like to thank R. Fillol (IP2I) for his helpful technical contribution. We acknowledge SOLEIL for the provision of synchrotron radiation facilities, and we would like to thank M. Hunault and P-L. Solari for assistance in using beamline MARS.
Conflict of interest
The authors declare that the research was conducted in the absence of any commercial or financial relationships that could be construed as a potential conflict of interest.
Publisher’s note
All claims expressed in this article are solely those of the authors and do not necessarily represent those of their affiliated organizations, or those of the publisher, the editors, and the reviewers. Any product that may be evaluated in this article, or claim that may be made by its manufacturer, is not guaranteed or endorsed by the publisher.
Supplementary material
The Supplementary Material for this article can be found online at: https://www.frontiersin.org/articles/10.3389/fnuen.2024.1465080/full#supplementary-material
References
Allen, G. C., Buswell, J. T., and Tempest, P. A. (1983). Ordering phenomena in U4O9-y crystals studied by Transmission electron Microscopy. J. Chem. Soc. Dalton Trans., 589–590. doi:10.1039/dt9830000589
Allen, G. C., and Holmes, N. R. (1995). A mechanism for the UO2 to α-U3O8 phase transformation. J. Nucl. Mater. 223, 231–237. doi:10.1016/0022-3115(95)00025-9
Allen, G. C., Tempest, P. A., and Tyler, J. W. (1982). Coordination model for the defect structure of hyperstoichiometric UO2+x and U4O9. Nature 295, 48–49. doi:10.1038/295048a0
Allen, G. C., Tempest, P. A., and Tyler, J. W. (1988a). Characterisation of crystalline UO2 oxidised in 1 torr of oxygen at 25, 225 and 300°C; Part 1. X-Ray Photoelectron Spectroscopy. J. Chem. Soc. Faraday Trans. 84, 4049. doi:10.1039/f19888404049
Allen, G. C., Tempest, P. A., and Tyler, J. W. (1988b). Characterization of crystalline UO2 oxidized in 1 Torr of oxygen at 25, 225 and 300°C; Part 2. X-ray diffraction and Scanning electron Microscopy. J. Chem. Soc. Faraday Trans. 84, 4061. doi:10.1039/f19888404061
Bannister, M. J., and Buykx, W. J. (1974). A dilatometric study of the solubility of U4O9 in UO2. J. Nucl. Mater. 55, 345–351. doi:10.1016/0022-3115(75)90075-6
Bayoglu, A. S., and Loreznzelli, R. (1984). Oxygen diffusion in fcc fluorite type nonstoichiometric nuclear oxides MO2+/-x. Sol. State Ion. 12, 53–66. doi:10.1016/0167-2738(84)90130-9
Berthinier, C., Rado, C., Chatillon, C., and Hodaj, F. (2013). Thermodynamic assessment of oxygen diffusion in non-stoichiometric UO2+/-x from experimental data and Frenkel pair modeling. J. Nucl. Mater. 433, 265–286. doi:10.1016/j.jnucmat.2012.09.011
Bittel, J. T., Sjodahi, I. H., and White, J. F. (1969). Steam oxidation kinetics and oxygen diffusion in UO2 at high temperatures. J. Am. Ceram. Soc. 52, 446. doi:10.1111/j.1151-2916.1969.tb11976.x
Blackburn, P. E. (1958). Oxygen dissociation pressures over uranium oxides. J. Phys. Chem. 62, 897–902. doi:10.1021/j150566a001
Chevrel, H., Frlttage à basse temperature du dioxyde d'uranium, en conditions de sur-stoechiometrie temporaire, Rapport CEA R-5569, (1992).
Cooper, R. I., and Willis, B. T. M. (2004). Refinement of the structure of β-U4O9. Acta Crystallogr. Sect. A 60, 322–325. doi:10.1107/s010876730401219x
De Bona, E., Popa, K., Walter, O., Cologna, M., Hennig, C., Scheinost, A. C., et al. (2022). Oxidation of micro- and nanograined UO2 pellets by in situ synchrotron X-ray diffraction. Inorg. Chem. 61, 1843–1850. doi:10.1021/acs.inorgchem.1c02652
Desgranges, L., Baldinozzi, G., Rousseau, G., Nièpce, J. C., and Calvarin, G. (2009). Neutron diffraction study of the in situ oxidation of UO2. Inorg. Chem. 48, 7585–7592. doi:10.1021/ic9000889
Desgranges, L., Baldinozzi, G., Siméone, D., and Fischer, H. E. (2011). Refinement of the α-U4O9 crystalline structure: new insight into the U4O9 -> U3O8 transformation. Inorg. Chem. 50, 6146–6151. doi:10.1021/ic200316b
Dorado, B., Garcia, P., Carlot, G., Fraczkiewicz, M., Pasquet, B., Freyss, M., et al. (2011). First-principles calculation and experimental study of oxygen diffusion in uranium dioxide. Phys. Rev. B 83, 035126. doi:10.1103/physrevb.83.035126
Elorrieta, J. M., Bonales, L. J., Baonza, V. G., and Cobos, J. (2018). Temperature dependence of the Raman spectrum of UO2. J. Nucl. Mater. 503, 191–194. doi:10.1016/j.jnucmat.2018.03.015
Gaillard, C., Sarrasin, L., Panetier, C., Pipon, Y., Ducher, R., and Moncoffre, N. (2024). Isotopic effect of oxygen on the Raman mapping of a polycrystalline uranium dioxide UO2. J. Raman Spectrosc. 55, 678–687. doi:10.1002/jrs.6660
Garrido, F., Nowicki, L., and Thomé, L. (2006). Channeling investigation of the crystalline structure of U4O9-y. Phys. Rev. B 74, 184114. doi:10.1103/physrevb.74.184114
Griffiths, T. R., and Hubbard, H. V.St.A. (1991). Absorption spectrum of single-crystal UO2: identification of and effect of temperature on the peak positions of essentially all optical transitions in the visible to near infrared regions using derivative spectroscopy. J. Nucl. Mater. 185, 243–259. doi:10.1016/0022-3115(91)90510-e
Gronvold, F. (1955). High-temperature X-ray study of uranium oxides in the UO2 - U3O8 region. J. Inorg. Nucl. Chem. 1, 357–370. doi:10.1016/0022-1902(55)80046-2
Guéneau, C., Baichi, M., Labroche, D., Chatillon, C., and Sundman, B. (2002). Thermodynamic assessment of the uranium-oxygen system. J. Nucl. Mater. 304, 161–175. doi:10.1016/s0022-3115(02)00878-4
Guimbretière, G., Desgranges, L., Canizarès, A., Carlot, G., Caraballo, R., Jégou, C., et al. (2012). Determination of in-depth damaged profile by Raman line scan in a pre-cut He2+ irradiated UO2. Appl. Phys. Lett. 100, 251914. doi:10.1063/1.4729588
He, H., and Shoesmith, D. (2010). Raman spectroscopic studies of defect structures and phase transition in hyper-stoichiometric UO2+x. Phys. Chem. Chem. Phys. 12, 8108. doi:10.1039/b925495a
Higgs, J. D., Thompson, W. T., Lewis, B. J., and Vogel, S. C. (2007). Kinetics of precipitation of U4O9 from hyperstoichiomectric UO2+x. J. Nucl. Mater. 366, 297–305. doi:10.1016/j.jnucmat.2007.03.054
Horlait, D., Domange, J., Amany, M.-L., Gérardin, M., Barthe, M.-F., Carlot, G., et al. (2023). Experimental investigation of Kr diffusion in UO2+x: slight deviations from stoichiometry, significant effects on diffusion kinetics and mechanisms. J. Nucl. Mater. 574, 154191. doi:10.1016/j.jnucmat.2022.154191
Ishii, T., Naito, K., and Oshima, K. (1970). X-ray study on a phase transition and a phase diagram on the U4O9 phase. Solid State Commun. 8, 677–683. doi:10.1016/0038-1098(70)90194-8
Keramidas, V. G., and White, W. B. (1973). Raman spectra of oxides with the fluorite structure. J. Chem. Phys. 59, 1561–1562. doi:10.1063/1.1680227
Kudo, T., Kida, M., Nakamura, T., Nagase, F., and Fuketa, T. (2007). Effects of fuel oxidation and dissolution on volatile fission product release under severe accident conditions. J. Nucl. Sci. Technol. 44, 1428–1435. doi:10.1080/18811248.2007.9711390
Kvashnina, K. O., and Butorin, S. M. (2022). High-energy resolution X-ray spectroscopy at actinide M4,5 and ligand K edges: what we know, what we want to know, and what we can know. Chem. Comm. 58, 327–342. doi:10.1039/d1cc04851a
Lay, K. W. (1970). Oxygen chemical diffusion coefficient of uranium dioxide. J. Am. Ceram. Soc. 53, 369–373. doi:10.1111/j.1151-2916.1970.tb12134.x
Le Gall, C., Audubert, F., Lechelle, J., Pontillon, Y., and Hazemann, J.-L. (2020). Contribution to the study of fission products release from nuclear fuels in severe accident conditions: effect of the pO2 on Cs, Mo and Ba speciation, EPJ Nuclear. Sci. Technol. 6, 2. doi:10.1051/epjn/2019058
Leinders, G., Bes, R., Kvashnina, K. O., and Verwerft, M. (2020). Local structure in U(IV) and U(V) environments: the case of U3O7. Inorg. Chem. 59, 4576–4587. doi:10.1021/acs.inorgchem.9b03702
Leinders, G., Cardinaels, T., Binnemans, K., and Verwerft, M. (2015). Accurate lattice parameter measurements of stoichiometric uranium dioxide. J. Nucl. Mater. 459, 135–142. doi:10.1016/j.jnucmat.2015.01.029
Leinders, G., Pakarinen, J., Delville, T., Binnemans, K., and Verwerft, M. (2016). Low-temperature oxidation of fine UO2 powders: a process of nanosized domain development. Inorg. Chem. 55, 3915–3927. doi:10.1021/acs.inorgchem.6b00127
Lierde, W. V., Pelsmaekers, J., and Lecocq-Robert, A. (1970). On the phase limits of U4O9. J. Nucl. Mater. 37, 276. doi:10.1016/0022-3115(70)90157-1
Lindemer, T. B., and Besmann, T. M. (1985). Chemical thermodynamic representation of UO2+/-x. J. Nucl. Mater. 130, 473–488. doi:10.1016/0022-3115(85)90334-4
Livneh, T. (2022). Resonant Raman scattering in UO2 revisited. Phys. Rev. B 105, 045115. doi:10.1103/physrevb.105.045115
Livneh, T., and Sterer, E. (2006). Effect of pressure on the resonant multiphonon Raman scattering in UO2. Phys. Rev. B 73, 085118. doi:10.1103/physrevb.73.085118
Maslova, O. A., Iltis, X., Desgranges, L., Ammar, M. R., Genevois, C., Bilbao, E. d., et al. (2019). Characterization of an UO2 ceramic via Raman imaging and electron backscattering diffraction. Mater. Charact. 147, 280–285. doi:10.1016/j.matchar.2018.11.006
Matsui, T., and Naito, K. (1975). Phase relation and defect structures of nonstoichiometric U4O9+/-y and UO2+x at high temperature. J. Nucl. Mater. 56, 327. doi:10.1016/0022-3115(75)90050-1
McBride, J. R., Hass, K. C., Poindexter, B. D., Weber, W. H., Pr, Nd, Eu, Gd, et al. (1994). Raman and x-ray studies of Ce1−xRExO2−y, where RE=La, Pr, Nd, Eu, Gd, and Tb. Appl. Phys. 76, 2435–2441. doi:10.1063/1.357593
Mc Eachern, R. J. (1997). A review of kinetic data on the rate of U3O7 formation on UO2. J. Nucl. Mater. 245, 238. doi:10.1016/S0022-3115(96)00733-7
Mc Eachern, R. J., and Taylor, P. (1998). A review of the oxidation of uranium dioxide at temperatures below 400°C. J. Nucl. Mater. 254, 87. doi:10.1016/S0022-3115(97)00343-7
Medyk, L., Manara, D., Colle, J. Y., Bouexière, D., Vigier, J.-F., Marchetti, L., et al. (2020). Determination of the plutonium content and O/M ratio of (U,Pu)O 2-x using Raman spectroscopy. J. Nucl. Mater. 541, 152439. doi:10.1016/j.jnucmat.2020.152439
Milena-Perez, A., Rodriguez-Villagra, N., Fernandez-Carretero, S., and Nunez, A., Thermal air oxidation of UO2: joint effect of precursor’s nature and particle size distribution, Prog. Nucl. Ener., 159 (2023) 104629. doi:10.1016/j.pnucene.2023.104629
Morgan, P. K., Prusnick, T. A., Velez, M. A., Rickert, K., Turner, D. B., and Mann, J. M. (2021). Identifying crystallographic faces of the fluorites urania and thoria with rotational polarized Raman spectroscopy. J. Raman Spectrosc. 52, 1902–1909. doi:10.1002/jrs.6236
Ravel, B., and Newville, M. (2005). ATHENA, ARTEMIS, HEPHAESTUS: data analysis for X-ray absorption spectroscopy using IFEFFIT. J. Synchrotron Rad. 12, 537–541. doi:10.1107/s0909049505012719
Rousseau, G., Desgranges, L., Charlot, F., Millot, N., Nièpce, J. C., Pijolat, M., et al. (2006). A detailed study of UO2 to U3O8 oxidation phases and the associated rate-limiting steps. J. Nucl. Mater. 355, 10–20. doi:10.1016/j.jnucmat.2006.03.015
Ruello, P., Chirlesan, G., Petot-Ervas, G., Petot, C., and Desgranges, L. (2004). Chemical diffusion in uranium dioxide - influence of defect interactions. J. Nucl. Mater. 325, 202–209. doi:10.1016/j.jnucmat.2003.12.007
Sabioni, A. C. S., Ferraz, W. B., and Millot, F. (2000). Effect of grain boundaries on uranium and oxygen diffusion in polycrystalline UO2. J. Nucl. Mater. 278, 364–369. doi:10.1016/s0022-3115(99)00250-0
Schaner, B. E. (1960). Metallographic determination of the UO2-U4O9 phase diagram. J. Nucl. Mater. 2, 110–120. doi:10.1016/0022-3115(60)90038-6
Simon, P., Canizarès, A., Raimboux, N., and Desgranges, L. (2023). How can Raman spectroscopy be used to study nuclear fuel? MRS Bull. 48, 118–123. doi:10.1557/s43577-022-00371-w
Sitaud, B., Solari, P. L., Schlutig, S., Llorens, I., and Hermange, H. (2012). Characterization of radioactive materials using the MARS beamline at the synchrotron SOLEIL. J. Nucl. Mater. 425, 238–243. doi:10.1016/j.jnucmat.2011.08.017
Soulié, A., Baldinozzi, G., Garrido, F., and Crocombette, J.-P. (2019). Clusters of oxygen interstitials in UO2+x and α-U4O9: structure and arrangements. Inorg. Chem. 58, 12678–12688. doi:10.1021/acs.inorgchem.9b01483
Spino, J., and Peerani, P. (2008). Oxygen stoichiometry shift of irradiated LWR-fuels at high burn-ups: review of data and alternative interpretation of recently published results. J. Nucl. Mater. 375, 8–25. doi:10.1016/j.jnucmat.2007.10.007
Taylor, P. (2005). Thermodynamic and kinetic aspects of UO2 fuel oxidation in air at 400-2000 K. J. Nucl. Mater. 344, 206–212. doi:10.1016/j.jnucmat.2005.04.043
Teixeira, S. R., and Imakuma, K. (1991). High temperature X-ray diffraction study of the U4O9 formation on UO2 sintered plates. J. Nucl. Mater. 178, 33–39. doi:10.1016/0022-3115(91)90453-e
Tuxworth, R. H., and Evans, W. (1959). Habit planes for U4O9 precipitation in uranium dioxide. J. Nucl. Mater. 3, 302–303. doi:10.1016/0022-3115(59)90027-3
Whillock, S., and Pearce, J. H. (1990). A method of determining the distribution of U4O9 in oxidised UO2. J. Nucl. Mater. 175, 121–128. doi:10.1016/0022-3115(90)90278-u
Keywords: UO2, oxidation, U4O9, Raman spectroscopy, HERFD-XANES
Citation: Gaillard C, Lotz H, Sarrasin L, Pipon Y, Ducher R and Moncoffre N (2024) Insights into the UO2+x/U4O9 phase characterization in oxidized UO2 pellets as a function of hyper-stoichiometry. Front. Nucl. Eng. 3:1465080. doi: 10.3389/fnuen.2024.1465080
Received: 15 July 2024; Accepted: 16 September 2024;
Published: 15 October 2024.
Edited by:
Thierry Wiss, Joint Research Centre, GermanyReviewed by:
Romain Vauchy, Japan Atomic Energy Agency, JapanLionel Desgranges, Commissariat à l’Energie Atomique et aux Energies Alternatives (CEA), France
Copyright © 2024 Gaillard, Lotz, Sarrasin, Pipon, Ducher and Moncoffre. This is an open-access article distributed under the terms of the Creative Commons Attribution License (CC BY). The use, distribution or reproduction in other forums is permitted, provided the original author(s) and the copyright owner(s) are credited and that the original publication in this journal is cited, in accordance with accepted academic practice. No use, distribution or reproduction is permitted which does not comply with these terms.
*Correspondence: C. Gaillard, Z2FpbGxhcmRAaXBubC5pbjJwMy5mcg==