 Edgar C. Buck*
 Dallas D. Reilly
 Luke E. SweetAaron D. NicholasForrest D. Heller
 Gabriel B. Hall
 Richard A. ClarkAmanda J. Casella
- Pacific Northwest National Laboratory, Richland, WA, United States
The degradation of the internal structure of plutonium (IV) oxalate during calcination was investigated with Transmission Electron Microscopy (TEM), electron diffraction, Electron Energy-Loss Spectroscopy (EELS), and 4D Scanning TEM (STEM). TEM lift-outs were prepared from samples that had been calcined at 300°C, 450°C, 650°C and 950°C. The resulting phase at all calcination temperatures was identified as PuO2 with electron diffraction. The grain size range was obtained with high-resolution TEM. In addition, 4D STEM images were analyzed to provide grain size distributions. In the 300°C calcined sample, the grains were <10 nm in diameter, at 650°C, the grains ranged from 10 to 20 nm, and by 950°C, the grains were 95–175 nm across. Using the Kolmogorov-Smirnov (K-S) two sample test, it was shown that morphological measurements obtained from 4D-STEM provided statistically significant distributions to distinguish samples at the different calcination conditions. Using STEM-EELS, carbon was shown to be present in the low temperature calcined samples associated with oxalate but had formed carbon (possibly graphite) deposits in the 950°C calcined sample. This work highlights the new methods of STEM-EELS and 4D-STEM for studying the internal structure of special nuclear materials (SNM).
Introduction
The oxalate anion is a common precipitating agent for f-elements from acidic solutions and provides an efficient pathway to metal oxalate precursors that can then be thermally converted to f-element oxides (Facer and Harmon, 1954; Dollimore, 1987; Runde et al., 2009; Vitart et al., 2017). In the case of actinides, there is significant interest in understanding solid phase morphology because the overall morphology of the oxalate is preserved during calcination (Machuron-Mandard and Madic, 1996; Tyrpekl et al., 2017; Ausdemore et al., 2022). Calcination is defined as the use of high temperatures to remove volatile molecular species from a solid. Understanding of the physical and chemical properties of these actinide oxalate and oxide compounds is integral to the field of nuclear forensics research and development for Special Nuclear Materials (SNM) (Mayer et al., 2005; Orr et al., 2015; Chung et al., 2016; Scott et al., 2019; Burr et al., 2021; Corbey et al., 2021; Said and Hixon, 2021; Ausdemore et al., 2022; Hainje et al., 2023; McDonald et al., 2023). Special Nuclear Materials are defined as plutonium materials and uranium that is enriched in either 233U or 235U (Schwantes et al., 2022). Isostructural with Pu(C2O4)2•6H2O, the precipitation of Th(C2O4)2•6H2O have been studied in detail by Tyrpekl and co-workers. In their microscopy-based study, the effect of pH and reactant concentrations on the morphological changes was evaluated (Tyrpekl et al., 2017). Christian et al. and others have studied the decomposition of [Pu(C2O4)2•6H2O] (Pu(IV) oxalate) with Raman (South and Roy, 2021; Christian et al., 2022; Christian et al., 2023) demonstrating that the conditions in which the crystals are grown impact the degree of hydration and the particle morphology. The Pu(IV) oxalate is thought to alter to Pu(III) oxalate upon heating to 170°C-190°C depending on the atmosphere (Orr et al., 2015). This reduction process may also occur via radiolysis over time (Corbey et al., 2021). Particle (or grain) size measurements for PuO2 formed from the calcination of Pu(IV) oxalate have been made by Bonato and co-workers (Bonato et al., 2020) and the calcination of Np-oxalates to NpO2 has been investigated with Scanning Transmission Electron Microscopy (STEM) by Peruski and Powell (Peruski and Powell, 2020).
To prepare PuO2 for fuel in the Experimental Breeder Reactor II facility at the Idaho, United States, and in the Fast Flux Test Facility at Hanford, WA, United States, the calcination temperature was limited to 380°C followed by hydrofluorination (i.e., reaction with HF gas). Most of the mass loss during the transformation of Pu(IV) oxalate to PuO2 occurs between ∼25°C and 350°C (Facer and Harmon, 1954). This study examines the types of microstructural information that can be obtained from the internal structure of these materials with transmission electron microscopy and its ancillary techniques.
Microscale morphology and composition provides clues about production of SNM, and the technical basis that could link these features to processing history is progressing for the plutonium oxalates and oxides (Ausdemore et al., 2022; LaCount et al., 2023). Clear trends have been observed in the thorium oxalates and oxides (Tyrpekl et al., 2017) and uranium oxides (Keegan et al., 2014; Tamasi et al., 2017; Jones et al., 2018; Ly et al., 2019; Schwerdt Ian et al., 2019; Thompson et al., 2021; McDonald et al., 2023). During calcination, the material undergoes radical changes, some of which is visible from surface morphological with Scanning Electron Microscopy (SEM) imaging or related methods. X-ray diffraction (XRD) and Raman do provide long-range order and crystallite size in actinide solids and can be more representative of the bulk material (Bouëxière et al., 2019). However, by examining the internal material transformations with high resolution methods such as Transmission Electron Microscopy (TEM), it may be possible to gain new insight into the calcination process even from partial SNM particles that may not be amenable to bulk analyses.
A major problem with TEM, however, is that the area analyzed by the technique is exceedingly small. The TEM is inherently a sub-micrometer technique and relating observations to the bulk properties is an on-going issue. In this paper, we explore the use of 4D-Scanning Transmission Electron Microscopy (4D-STEM) as a new approach for investigating SNM and compare this method to the more conventional TEM imaging methods. The name “4D-STEM” refers to recording 2D images of a converged electron probe producing a diffraction pattern, over a 2D grid of probe positions from an image. At each probe position (x, y), a 2D diffraction pattern is acquired on a digital camera. This results in a 4-dimensional data set that will contain xn × yn diffraction patterns and may be several Gigabits in size (Ophus, 2019; Bustillo et al., 2021). Electron energy-loss spectroscopy (EELS) can provide quantitative information on light elements and is generally more sensitive than x-ray energy dispersive spectroscopy (EDS) (Hofer et al., 2016). EELS can be sensitive to light elements and owing to the edge energy of the actinide O4,5 edges at ∼100 eV–120 eV and the C-K and O-K edges at 298 eV and 532 eV, respectively, is an efficient method for analyzing SNM. The presence of carbon in these materials is important to access however this analysis can be made difficult through use of carbon deposition in sample preparation and possible contamination from the microscope vacuum.
The objective of this study was to use STEM/TEM analyses to develop a particle size distribution and to describe the any compositional and structural changes that occurred during the calcination process.
Experimental
Caution! These experiments used 239Pu which is an alpha (α)-emitting radionuclide; standard precautions should be followed for handling this radioactive material. High α-activity materials can also damage electron and x-ray detectors on electron microscopes.
The plutonium solution was purified by anion exchange using Reillex™ HPQ resin. The resin was conditioned with 7 M HNO3, then loaded with the plutonium solution. The column was then washed with 7 M HNO3 followed by elution with 0.35 M HNO3. The oxalate precipitation step was conducted at 55°C. A 0.9 M oxalic acid solution was added to the Pu(IV) nitrate solution (termed forward strike) over a period of 30 min with active stirring by an overhead mixer. Sub-samples were extracted during this process and analyzed in the SEM. After the addition of oxalic acid, the slurry was cooled to approximately 10°C, and digested for an additional 30 min. After digestion, the solids were allowed to settle, and the supernatant liquid was decanted. The Pu(IV) oxalate solids were washed three times with a 0.05 M oxalic acid, 2 M HNO3 solution. On the third wash, the solids were transferred and separated by vacuum filtration (Corbey et al., 2021). The Pu(IV) oxalate was divided into equal portioned samples, which were then calcined to different thermal profiles targeting maximum temperatures of 300°C, 450°C, 650°C and 950°C in air. The thermal profiles for each calcination are shown in Supplementary Figure S1 in the Supplementary Material (SI) section. The times for all calcinations were the same except at 300°C which was shorter than the rest. The shorter time was chosen for the 300°C sample to be representative of an intermediate product prior to hydrofluorination, this time was also used for a sample calcined to 250°C that was not used in this TEM analysis.
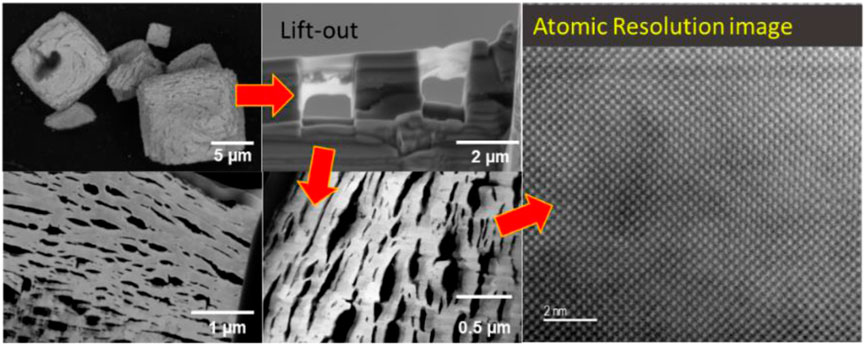
Particles of the calcined materials were deposited onto sticky carbon mounts. The particles were protected by a deposition of a layer of carbon, followed by a layer of Pt (see SI Section, Supplementary Figure S2). The lift-out specimens were then produced with standard methods with a Ga-ion beam on the FEI (Thermo-Fisher Inc., Hillsboro, OR) Helios 660 SEM-FIB. The final thinning process was with a low energy Ga-ion beam to avoid the possibility of deposition of Ga into the specimen. The lift-outs were examined with a JEOL (JEOL Inc., Japan) ARM300F (GrandARM) microscope operated at 300 keV and equipped HAADF and BF detectors, with dual Centurio EDS detectors, Gatan (Gatan Inc., Pleasanton, CA) OneView Digital camera for TEM imaging and diffraction, Gatan STEMx system for 4D STEM (Ophus, 2019), and a Gatan Image Filter (GIF) Continuum for EELS analysis. STEM images were obtained using an annular dark field detector and compositional analysis was obtained with EDS and EELS. STEM-EELS were collected with a 85 mrad collection semi-angle and a 29.7 mrad convergence semi-angle and used the Pu-O4,5 (∼110 eV), C-K (298 eV), and O-K edges (532 eV) with a dispersion of 0.25 eV/Ch. 4D-STEM images were collected using the smallest C1 aperture (10 µ), and alpha set at L1, and the diffraction patterns were projected onto the chamber OneView camera.
Samples were also analyzed under conventional TEM mode, enabling selected area electron diffraction (SAED) patterns to be collected. The SAED were calibrated with a MoO3 standard from Ted Pella (Ted Pella Inc., Redding, CA). The errors in the measurements are more pronounced for the larger d-spacings. PuO2 (ICSD 01-073-7903) crystallizes into the cubic fluorite type structure (CaF2) with space group Fm3m. The diffraction patterns were analyzed with CrysTBox software (Klinger and Jäger, 2015). The ‘ringGUI’ tools within CrysTBox was used for diffraction analysis. The distances between individual diffraction spots were quantified and the indices of corresponding planes were assigned to the rings from collected powder patterns. 4D-STEM images were processed with DigitalMicrograph™ phase contrast software routines (see SI section). The resulting images were then processed with Morphological Analysis of MAterials (MAMA) image analysis software (Gaschen et al., 2016; Schwerdt et al., 2018) to provide grain size distributions. Data was further analyzed and plotted using Jupyter Notebook Python packages (matplotlib, pandas, seaborn, numpy) with statistical analyses using scipy.stats.
Results and discussion
Following calcination of the Pu(IV) oxalate there was a significant decrease in the volume and color change in the solids (see Figure 1). Each specimen was held at their respective calcination temperatures for the same time (∼200 min) except in the case of the 300°C sample which was held at highest temperature for ∼100 min as discussed earlier. The starting material had a yellow-brown coloration but resulting powders following calcination were initially dark brown but became progressively light with increasing calcination temperature. When analyzed with SEM, the precipitated plutonium (IV) oxalate and the calcined product were shown to possess a distinct cubic shape (see Figure 2). Figures 2A, B show the growth of the Pu(IV) oxalate over 20 min of reaction from around 2 µm in diameter to some close to 40 µm in diameter. Sub-samples were extracted during the precipitation process and then imaged in the SEM in a dried state. Similar work on the formation of Pu(IV) oxalate has been conducted by our group using in situ liquid cells (Meadows et al., 2020). This morphology which is characteristic of Pu(IV) oxalate was preserved during the calcination process. The major difference between the non-calcined and calcined specimens were the numerous cracks in the particles and the reduction in the total volume of the solid. The calcined particles did not exceed 15 µm in diameter whereas, many of the freshly precipitated Pu(IV) oxalate particles exceeded 20 µm in diameter. The cracking appeared to increase with increasing temperature which was most likely related to the release of H2O, CO, and CO2 during the calcination process, and which has been reported widely in the literature (Claparede et al., 2011; Orr et al., 2015). A complete analysis of the particle agglomerates, in terms of the overall surface morphology, has being investigated by others (Scott et al., 2019; Corbey et al., 2021).
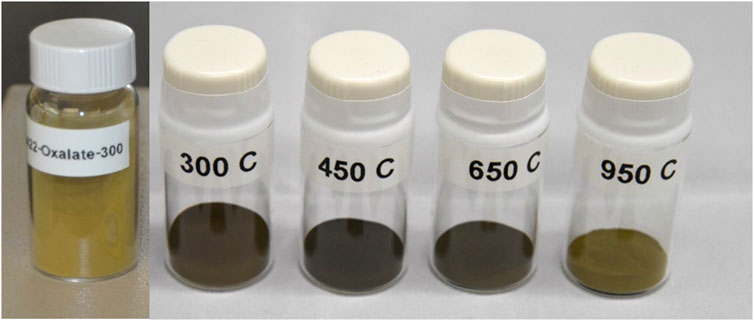
Figure 1. Photographs of the yellow Pu(IV) oxalate and the darker Pu oxide powders following calcination at different temperatures (see for Supplementary Figure S1 the temperature profile).
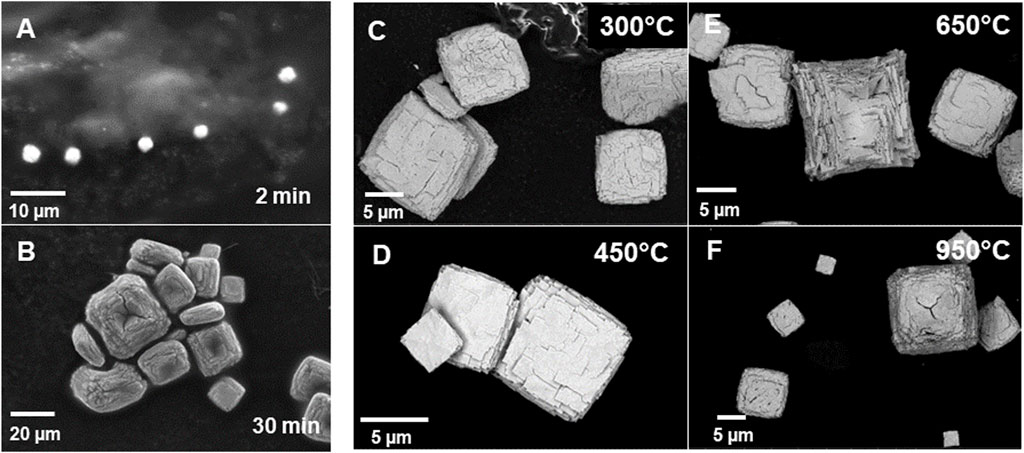
Figure 2. Series of SEM-BSE images of the Pu (IV) oxalate calcined at (A) precipitated Pu(IV) oxalate reacted at 55°C in solution after 2 min of reaction, (B) Precipitated Pu(IV) oxalate after 30 min of reaction, (C) 300°C, (D) 450°C, (E) 650°C, and (F) 950°C. Note the changes in magnification scale-bar and the significant reduction in particle size with calcination temperature.
Cross-sections of the plutonium oxalate particles calcined at different temperatures, however, revealed changes with the different calcination temperatures when examined in the TEM.
In the following sections, different aspects of the TEM analyses will be described showing how data was extracted from these samples.
Imaging and diffraction
The STEM images were obtained at low magnification from the uncalcined sample (see Figure 3A). Although, this material was the precipitated Pu(IV) oxalate, it was expected that the material had dried out in the vacuum of the electron microscope and become amorphous during the FIB sample preparation. Therefore, we did not expect that the Pu(IV) oxalate structure would be preserved but the overall morphology may have been unaltered. To retain the structure of these hydrated actinide oxalate phases, Cryogenic Electron Microscopy (CryoEM) is required. With CryoEM, it is possible to preserve the actinide and rare earth oxalate structures during imaging and diffraction analysis (Soltis et al., 2019; Buck et al., 2021). The low magnification STEM images of the calcined samples in Figure 3 showed the overall development of the microstructure during the heating process. The cross-section of Pu(IV) oxalate possessed a low surface area and there were no obvious micropores in the structure. At 300°C, a few micropores were present in the material. However, at calcination temperatures between 450°C and 650°C, the material started to transform into well separated strips that had high surface areas and larger pores. This change in the internal microstructure led to changes in the surface morphology through the formation of surface cracks that suggested an increase in the surface area of the particle (see Figures 2D, E). Finally, at 950°C, the structure appeared to be re-densifying and the internal surface area was smaller than that seen at the lower temperatures of 450°C and 650°C. Similar observations on the initial increase in surface area followed by a decrease above a calcination temperature of 400°C have been noted by others (Orr et al., 2015). The initially precipitated material expels gases during at the lower temperatures (250°C–450°C), resulting in an increase in surface area. However, as the temperature is increased further, grain growth reduces the internal surface area. The low magnification STEM images did not reveal the internal changes in the crystallinity of the materials. Electron diffraction (see Figure 4) did show increasing crystallinity with increasing calcination temperature. The diffraction d-spacings are reported in Table 1 and the derived unit cell parameter based on a cubic structure are reported in Table 2. After calcining at 300°C, the SAED pattern was showed some evidence of crystallinity with relatively diffuse rings. The pattern suggested a very small grain size. Between 450°C and 650°C, Bragg diffraction reflections were clearly appearing, and it seemed that most of the crystallization had occurred between these temperatures, as the patterns go from continuous rings to individual reflections. At a calcination temperature of 950°C calcination, we started to see texturing in the patterns and the indication of large grain formation.
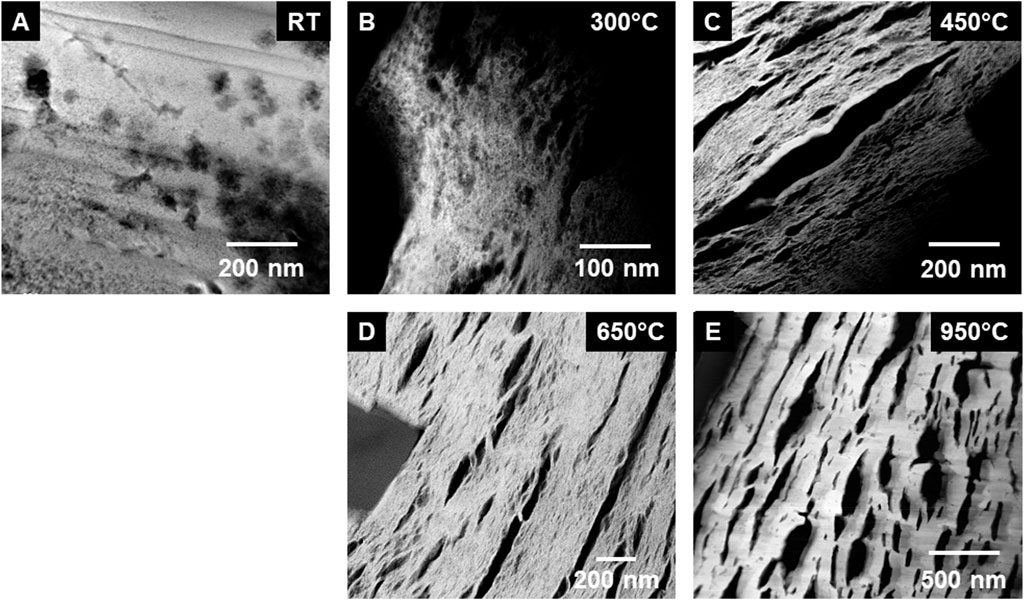
Figure 3. Series of low magnification STEM-HAADF images of the calcined Pu (IV) oxalate showing the internal morphology of the particles with temperature: (A) Precipitated Pu(IV) oxalate prepared by SEM-FIB, and STEM images from calcined samples at (B) 300°C, (C) 450°C, (D) 650°C, and (E) 950°C. The initial internal surface area at room temperature (RT) is low. Between 450°C and 650°C there is increased microporosity. With the courser grains at 950°C, the internal surface area appeared to be lower.
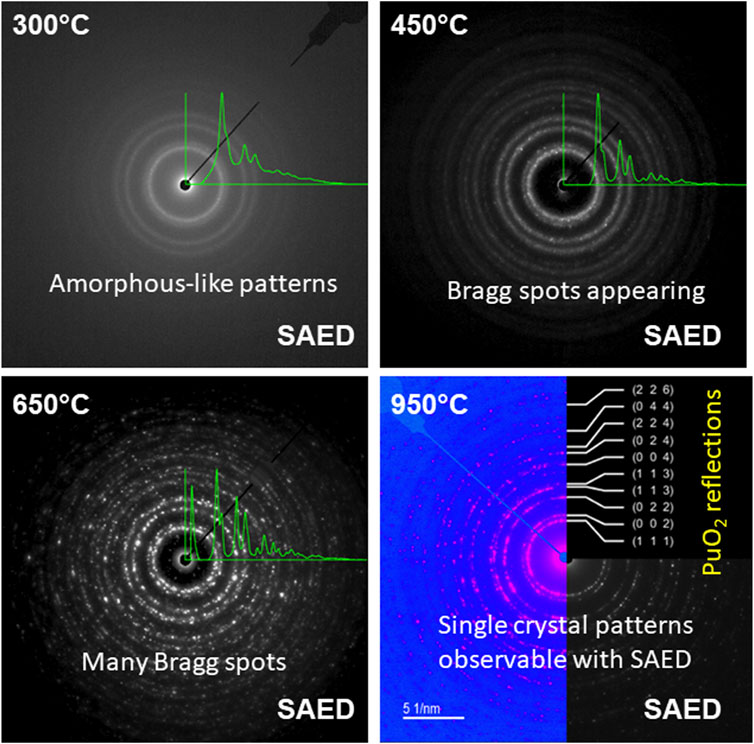
Figure 4. Series of ring diffraction patterns from the calcined specimens. A radial intensity average is shown superimposed on the diffraction patterns on all but the 950°C sample where the hkl reflections are indicated. The diffraction pattern at 950°C has been colorized to make the features more visible.
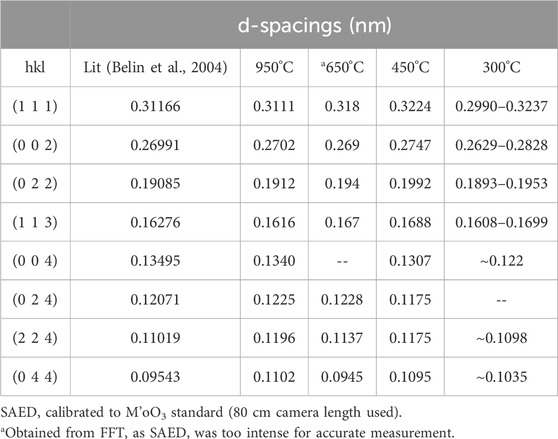
Table 1. Ring identification from the Pu(IV) oxalate calcined materials with temperature.
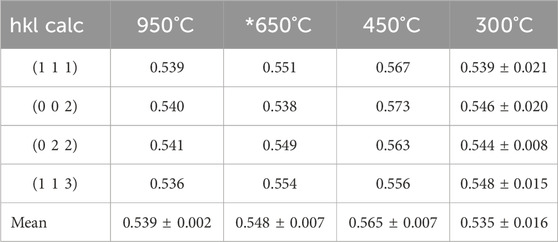
Table 2. Lattice Parameter (measured in nm) of PuO2 with temperature.
The lattice constant for high fired PuO2 reported in the literature from plutonium (IV) oxalate is a = 0. 5394 ± 0.004 nm (Martin et al., 2003; Belin et al., 2004; Scott et al., 2019).
The lattice parameter for a cubic system can be determined from the following:
The lattice parameters obtained at 950°C were close to the expected value for stoichiometric PuO2. We used a Fast Fourier Transform (FFT) to obtain a value from the 650°C calcined sample. The measurements obtained from the 450°C calcined sample were larger than expected. The reflections obtained from the 300°C calcined sample was broad and subsequently the SAED measurements were similarly broad.
As the temperature was increased during the calcination process, the material underwent macroscopic changes in porosity although the nature of the porosity appeared to be directional and may be related to the crystal morphology of the original precipitated Pu(IV) oxalate. The porosity would have been caused by the removal of gases (H2O, CO, CO2) during plutonium oxalate decomposition as described by Orr and co-workers (Orr et al., 2015) for plutonium oxalates. Further micropore formation may be occurring as the material recrystallized at the higher temperatures into a dense product.
Similar information to the low magnification STEM images was obtained from TEM imaging of the materials (see Figure 5). The material at calcined to 300°C, appeared to form columns of material but the micropore formation was limited (see Figure 5). At 450°C, the directionality of the material was apparent, and micropores were visible in the structure. There was also evidence of tiny crystals that could be seen as darker regions (i.e., grains near the Bragg condition) on the image (see Figure 5C). At 650°C, the material appeared to have undergone significant expansion with much larger micropores appearing. It was also at these temperatures that we see the structure becoming less dense and the overall surface area increasing but the grain size remained small. In Figure 5E, the sample calcined at 950°C is shown where the grains have coarsened leading to the formation of well-defined grain boundaries and triple points. Such information is interesting but without quantitative measurements, it does not allow direct comparisons with bulk analysis data, such as x-ray diffraction.
Figure 5. Low magnification TEM images of (A) precipitated Pu(IV) oxalate, and calcined at (B) 300°C, (C) 450°C, (D) 650°C, and (E) 950°C. The images show the initial formation of micropores during heating leading to a higher surface area and then the decrease in this surface area at the highest calcination temperature.
High Resolution Transmission Electron Microscopy (HRTEM) images were obtained to show lattice fringes from the calcined material at much higher fidelity. The presence of lattice fringes indicated crystallinity and by obtaining an FFT of the images, we were able to confirm the occurrence of an ordered structure. The HRTEM images in Figure 6, starting at 300°C, show the gradual increase in crystallinity with temperature. Despite the FFTs being obtained from a much smaller area than SAED, there is a good match between the FFTs in Figure 6 and the SAED patterns shown in Figure 4. The sample from the 300°C calcination did show evidence of crystallization. This was not perceptible in either the low magnification STEM or TEM images. At 450°C, definitive diffraction spots could be seen and in the 650°C sample, grains are visible and the FFT shows some texturing. In the 950°C sample, the FFT is a from a single crystal, and there were clear grain boundaries between grains.
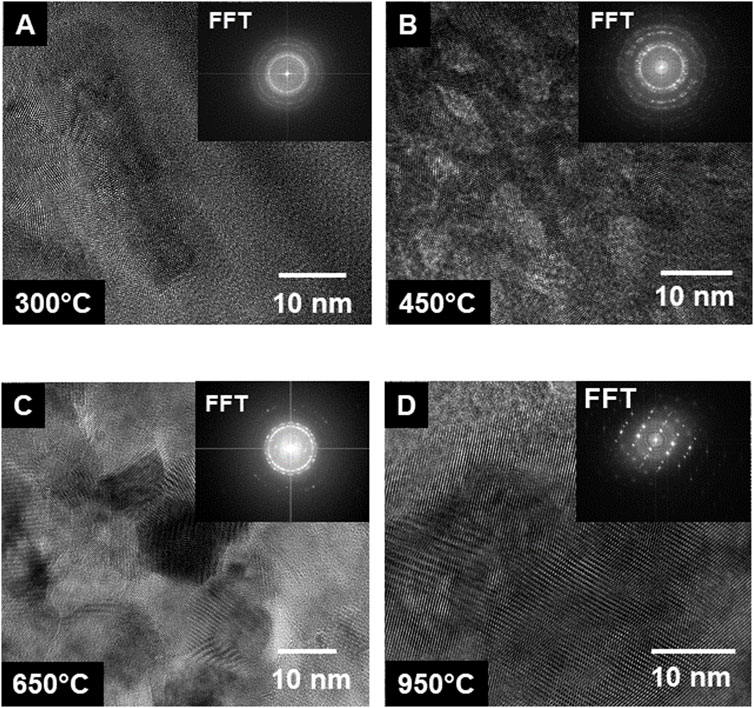
Figure 6. Series of high-resolution TEM images of the calcined Pu (IV) oxalate showing the growth of crystals with temperature: (A) 300°C, (B) 450°C, (C) 650°C, and (D) 950°C.
STEM-HAADF images in Figure 7 show the formation of triple point grain boundaries in the specimen calcined at 950°C. The atomic resolution images show the regular PuO2 structure projected along B[110]. The FFT measured spacings were 0.3113 nm, 0.271 nm, and 0.1932 which gave an average value for the unit cell parameter a = 0.543 ± 0.004 nm.
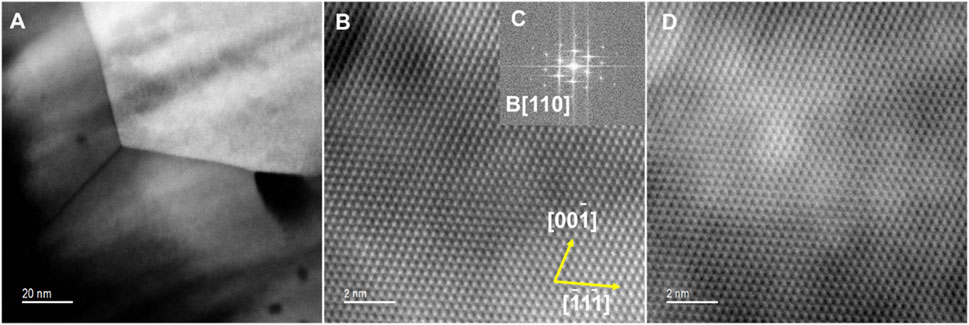
Figure 7. (A) HAADF image of Pu oxide from the 950°C experiment showing a triple point in the material. (B) HAADF atomic resolution image, (C) FFT along B[110], (D) BF image of the same region.
In this section, we showed that low magnification STEM and TEM, SAED, and HR-TEM and atomic resolution STEM revealed different aspects of the calcined materials. At 300°C, the material was partially amorphous. The material was also denser than at other high temperatures. Between 450°C and 650°C, grains start to be observed in the low magnification TEM imaging, and were <10–30 nm in diameter. Nevertheless, SAED and FFTs of the HRTEM images, indicated the formation of distinct crystals. Grain boundaries were also visible in the 650°C calcined sample. Note that the preparation of Pu fuels for the FFTF and EBRII reactors, calcination was never run beyond 480°C. This could be partially explained here where we observed significant crystallization and growth after 450°C that might reduce the accessibility of reactive gases to the particle surfaces. As the temperature was increased to 950°C, the grains were >100 nm in diameter, in agreement with the findings of Bonato and co-workers (Bonato et al., 2020). The change in surface area was not uniform during the calcination process. The initial surface area was low, but as the calcination temperature was between 450°C and 650°C, the structures opened and fragmented. It was only at 950°C that the internal surface area appeared to decrease as the grains ripened.
X-ray energy dispersive spectroscopy and electron energy-loss spectroscopy
STEM-EDS was used to look for any minor elements present in the calcined solids. Silicon was found and did exhibit some evidence of migration following calcination to the highest temperatures. The migration of minor elements within these solids may be an effective indicator of the processing conditions. However, in this study, significant aggregation of silicon was not observed until the highest calcination temperature. Figure 8 shows STEM-EDS maps of Si and Pu from the cross-sectioned samples that appeared to indicate the collection of silicon at the edges of the particles. The level of silicon was low, possibly <2-4wt%. The distribution of the Si changed with processing temperature. At 450°C, the Si was concentrated in nanometer precipitates but as the calcination temperature was raised, Si became re-distributed. The Si-K map in the 950°C specimen; however, does not coincide with the Pu or the HAADF bright contrast. The Si indeed is not visible in the HAADF image. The Si is clearly directional, lying along the elongated bands of PuO2. In the higher magnification image, the Si appears to be close to a grain boundary in the PuO2. The silicon was believed to have come from glassware during some of the operations in the process.
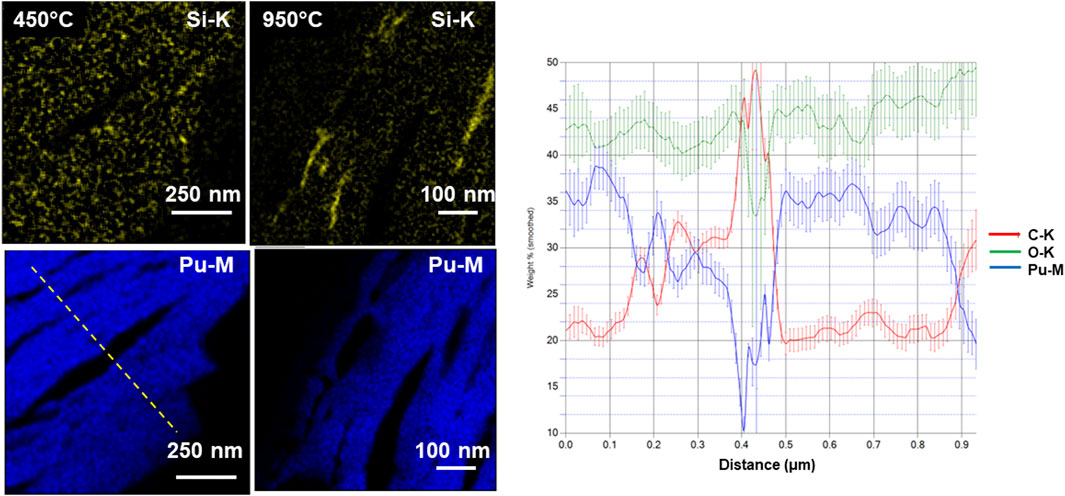
Figure 8. STEM-EDS silicon- and plutonium-maps from the calcined solids at 450°C and 950°C and adjacent line scan of Pu, O, and C content (as indicated on the map).
Although STEM-EDS can be used to detect oxygen and carbon (see the line scan in Figure 8), and these show some trends, it is not possible to extract quantitative information from these. In contrast, STEM-EELS can be quantitative. The behavior of carbon in the Pu-solids of great interest because, we had expected most of the carbon to be removed during the calcination process. In Figure 9, a series of STEM-EELS maps and HAADF images are shown. The maps were produced using the O-K, C-K, and the Pu-O4,5 edges. Carbon was ubiquitous in the specimens indicating that it was not completely removed from the Pu phase during the calcination process even at the highest temperatures. Carbon is deposited during the SEM-FIB preparation, but this is only present on the top edge of the specimen and not in the regions analyzed. Hence, any carbon observed during these analyses was derived from the specimen. Ziouane et al. (2016) observed the presence of graphite in calcined uranyl oxalates with Raman spectroscopy and suggested that the decomposition of carbon monoxide through the reaction:
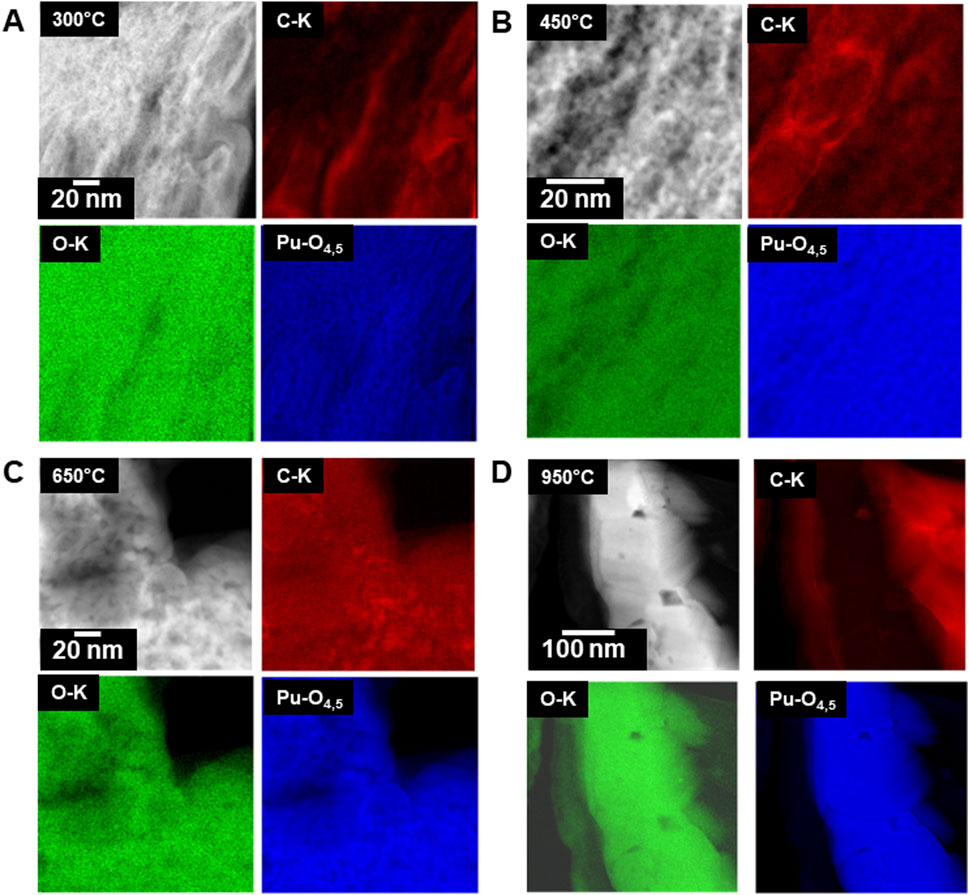
Figure 9. Series of high magnification STEM-EELS maps of the calcined Pu(IV) oxalate showing changes in carbon content and distribution with temperature, (A) 300°C, (B) 450°C, (C) 650°C, and (D) 950°C.
In the STEM-EELS maps from the 950°C sample, the Pu solid is consistent with PuO2 in agreement with the high-resolution imaging and diffraction results. However, the neighboring regions containing carbon do not contain oxygen, which indicates that solid carbon (graphite) has formed. At the lower calcination temperatures of 450°C and 650°C, there is some indication of C-rich region, but these are not as apparent as those in the 950°C calcined specimen.
In Figure 10, the ratio spectrum images show the change in carbon content with calcination temperature within the Pu-rich regions. At low temperature, carbon and oxygen are present together but as the calcination proceeds, at least within the Pu-bearing regions, there appears to be much less carbon. Nevertheless, carbon was still observed in the high temperature calcined samples but not associated with either oxygen or plutonium solid. Plutonium was clearly associated with oxygen in the high temperature solid, supporting the formation of pure PuO2. This suggests that graphite has formed at the high temperature.
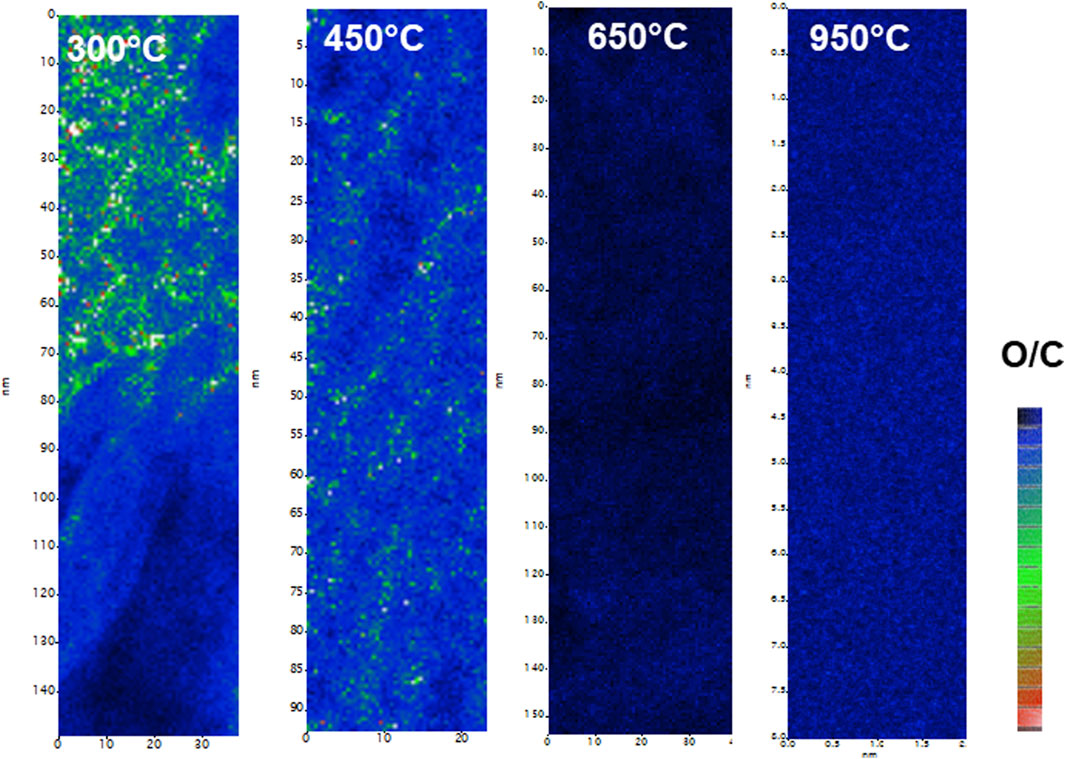
Figure 10. EELS oxygen/carbon mapping showing the loss of carbon in the calcined material from 300°C to 950°C in the PuO2.
4D-STEM analysis
The STEM and TEM images provided an overview of the condition of the samples calcined at the different temperatures. However, it was difficult to extract quantitative information out of this data. Bonato and co-workers (Bonato et al., 2020) used HR-TEM to derive grain sizes from calcined Pu materials and in this study, we also extracted similar information from the HR-TEM images (Table 3). Nevertheless, this can be an unsatisfactory approach because of the need to examine many images to obtain useful data. Wright et al., have calculated that to obtain a grain size distribution from 2D SEM data such as Electron Backscattered Diffraction analyses, upwards of 10,000 individual grains need to be indexed to provide data comparable with x-ray diffraction (Wright et al., 2007). This is not possible to do with TEM samples which might only contain a few hundred grains. Furthermore, all 2D datasets, including EBSD or 4D-STEM cannot be true representations of grain size distributions, as they cut at random through the material of interest and will always be biased towards smaller grains. Hence, estimates from TEM data sets can only be used as potential indicators. Supplementary Figure S3 shows the 2D grid real-space image and (B) and (C) are individual reciprocal space diffraction patterns that were generated by the probe at specific points in the image. The resulting datasets are termed 4D and can be extremely large. Each diffraction pattern was analyzed into sections and then combined in different ways to generate the grain image. This analysis provided information on the grain (or particle) diameter and perimeter of the PuO2 in the calcined material (see Figure 11 and Table 3).
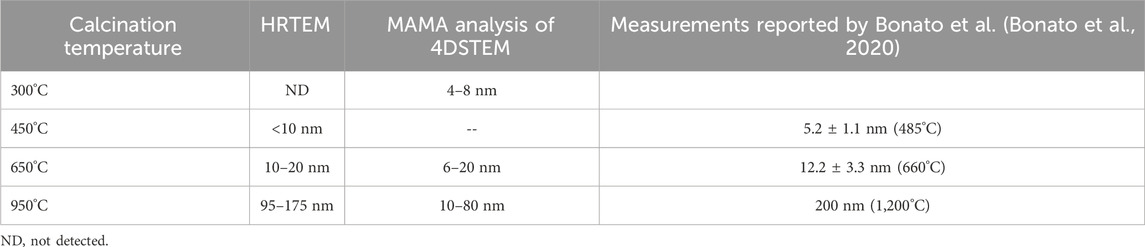
Table 3. PuO2 crystallite sizes for the calcined samples as determined by HRTEM and 4D-STEM methods.
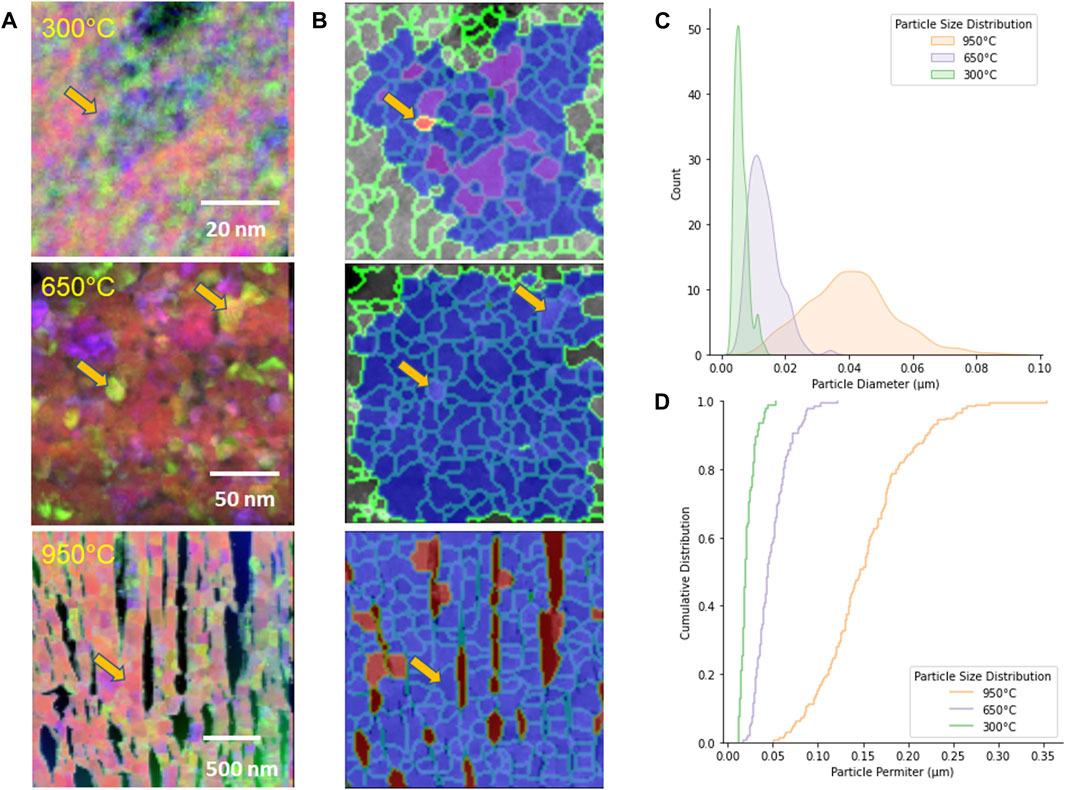
Figure 11. MAMA Analysis of the 4D-STEM data. (A) 4D-STEM images from, (B) MAMA image analysis, (C) particle size plots using the grain diameter as found with 4D-STEM, and (D) cumulative particle distribution plot of the grain boundaries.
The arrows on A and B figures represent the sample particle identified by the MAMA segmentation routine and in the corresponding 4D STEM image at the different calcination temperatures.
Application of the Kolmogorov-Smirnov (K-S) two sample test was applied to SNM particle size distributions by Olsen and co-workers (Olsen et al., 2017). These types of statistical tests can provide confidence on whether these microscopy-based tools can be used to conclusively connect a specific sample to a particular process. The KS Test is a non-parametric technique used to evaluate the degree to which data fit a given distribution or to contrast two cumulative distribution functions (CDFs). Its adaptability is increased by the fact that, because to its non-parametric character, it does not make any initial assumptions about the data that follow a particular distribution. In this case, they analyzed the morphology of U3O8 from SEM images using the MAMA analysis tool. The particle distributions for any specific feature, such as perimeter or area are first converted to a cumulative distribution and then two distributions can be compared. In this study, there was clearly a difference between the 950°C calcination experiment and the lower temperature calcinations. However, it was unclear if there was a statistically relevant difference between the 300°C and 650°C despite the plots appearing to show differences. The K-S two sample analysis for the CDF for the perimeter measurement provided a ‘K-S statistic’ value of 0.891 and the p-value was <<0.05. The null hypothesis for the p-value is that the two CDFs are drawn from the same distribution. The K-S statistic is defined as the maximum value of the difference between the two CDFs. For the ‘Equivalent Circular Diameter’ measurement, the ‘statistic’ value was 0.986 and the p-value was 0.0. Bear in mind that the maximum ‘K-S statistic’ value is 1.0, which indicates a good fit and gives increased confidence that we can use these microstructural characteristics as signatures. Visual inspection of Figure 12 shows how the particle or grain perimeter value was a less distinguishing marker than the particle or grain diameter. The K-S calculation was performed using the scipy.stats package in Python.
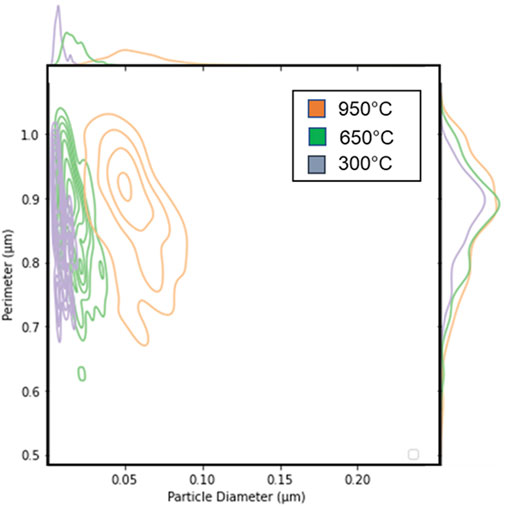
Figure 12. Plot showing that particle or grain size was more able to differentiate morphological signatures than grain perimeter length.
Bonato et al. (Bonato et al., 2020) made PuO2 particle size measurements using High Resolution TEM from calcined Pu(IV) oxalate at a range of conditions, including at 485°C, 660°C, and 1,200°C. Interestingly, the measurements reported in this study are in good agreement with these literature values. If the software routines were more streamlined, the 4D-STEM method could be a faster method for obtaining this type of information.
Conclusion
A unique aspect of the calcination process is the preservation of the macroscopic morphology from solution precipitation of Pu(IV) oxalate through the calcination process. This was illustrated with the SEM images that showed the formation of the Pu(IV) oxalate with a cuboid morphological and as the material was calcined, this morphology was preserved up to 950°C. There was a large volume reduction from the hydrated Pu(IV) oxalate to the oxide with the particles having approximately halved in diameter. Any gross morphological image analysis with SEM would seemingly yield much of the same information, as the aspect ratio, perimeter, and equivalent circular diameter would be similar for all these different calcined specimens. However, closer inspection of the surface revealed differences. As the material was calcined at increasingly higher temperatures, the surface changed. At 300°C, there were a few cracks, and these became more extensive at 450°C, and at 650°C where a flaky texture was observed. Finally, at 950°C, the material had large cracks running through it.
By cross sectioning the individual particles, however, a different picture of the changes that had occurred in the material with calcination temperature was revealed. The changes in the grain size, porosity, crystallinity were apparent. With the benefit of 4D-STEM, the nature of the grain structure could be quantified and with STEM-EELS, the changes in the O and C content could be investigated. The EELS analyses indicated the formation of graphite at 950°C separated from the PuO2. As calcination temperature increased from 300°C to 450 C, the structure opened with the release of gases. As the temperature reached 650°C–950°C, the grains by an order of magnitude. Grain boundaries and triple points were visible in the material.
Thermal decomposition of metal oxalate is highly dependent on the gas environment, the heating profile, and the morphology of the precursor solid. This study does not intend to answer these questions but to show a new method for analyzing the solids with STEM imaging and analysis, as well as 4D-STEM. There continues to be interest in connecting the morphology of actinide oxalate phases and examining the internal microstructure is yet another approach for developing insights into the connection between morphology and processing conditions (McDonald et al., 2023). With the TEM, we can gain information regarding the micropore structure, degree of crystallinity, and grain structure observable in the cross-sectional views, albeit with small samples.
Data availability statement
The original contributions presented in the study are included in the article/Supplementary Material, further inquiries can be directed to the corresponding author.
Author contributions
EB: Conceptualization, Investigation, Methodology, Writing–original draft, Writing–review and editing, Formal Analysis, Software. DR: Investigation, Methodology, Writing–review and editing. LS: Investigation, Writing–review and editing. AN: Investigation, Writing–review and editing. FH: Investigation, Methodology, Writing–review and editing. GH: Investigation, Methodology, Writing–review and editing. RC: Conceptualization, Methodology, Writing–review and editing. AC: Conceptualization, Project administration, Supervision, Writing–original draft.
Funding
The author(s) declare that financial support was received for the research, authorship, and/or publication of this article. This research was funded by the U.S. Department of Energy, National Nuclear Security Administration, Office of Defense Nuclear Nonproliferation Research and Development. STEM/TEM and SEM sample preparation and imaging were performed in the Radiological Microscopy Suite (RMS), located in the Radiochemical Processing Laboratory (RPL) at PNNL. PNNL is operated by Battelle for the Department of Energy under Contract No. DEAC05-76RLO 1830.
Conflict of interest
The authors declare that the research was conducted in the absence of any commercial or financial relationships that could be construed as a potential conflict of interest.
The author(s) declared that they were an editorial board member of Frontiers, at the time of submission. This had no impact on the peer review process and the final decision.
Publisher’s note
All claims expressed in this article are solely those of the authors and do not necessarily represent those of their affiliated organizations, or those of the publisher, the editors and the reviewers. Any product that may be evaluated in this article, or claim that may be made by its manufacturer, is not guaranteed or endorsed by the publisher.
Supplementary material
The Supplementary Material for this article can be found online at: https://www.frontiersin.org/articles/10.3389/fnuen.2024.1380137/full#supplementary-material
References
Ausdemore, M. A., McCombs, A., Ries, D., Zhang, A., Shuler, K., Tucker, J. D., et al. (2022). A probabilistic inverse prediction method for predicting plutonium processing conditions. Front. Nucl. Eng. 1. doi:10.3389/fnuen.2022.1083164
Belin, R. C., Valenza, P. J., Reynaud, M. A., and Raison, P. E. (2004). New hermetic sample holder for radioactive materials fitting to Siemens D5000 and Bruker D8 X-ray diffractometers: application to the Rietveld analysis of plutonium dioxide. J. Appl. Crystallogr. 37 (6), 1034–1037. doi:10.1107/s0021889804022885
Bonato, L., Virot, M., Dumas, T., Mesbah, A., Dalodière, E., Dieste Blanco, O., et al. (2020). Probing the local structure of nanoscale actinide oxides: a comparison between PuO2 and ThO2 nanoparticles rules out PuO2+x hypothesis. Nanoscale Adv. 2 (1), 214–224. doi:10.1039/c9na00662a
Bouëxière, D., Popa, K., Walter, O., and Cologna, M. (2019). Kinetic study on the grain growth of PuO2 nanocrystals. RSC Adv. 9 (12), 6542–6547. doi:10.1039/c8ra10430a
Buck, E., Hall, G., Kruska, K., and Tripathi, S. (2021). Cryo-TEM characterization of the early stages of the uranium oxalate growth evolution. Microsc. Microanal. 27 (S1), 1940–1941. doi:10.1017/s1431927621007042
Burr, T., Schwerdt, I., Sentz, K., McDonald, L., and Wilkerson, M. (2021). Overview of algorithms for using particle morphology in pre-detonation nuclear forensics. Algorithms 14 (12), 340. doi:10.3390/a14120340
Bustillo, K. C., Zeltmann, S. E., Chen, M., Donohue, J., Ciston, J., Ophus, C., et al. (2021). 4D-STEM of beam-sensitive materials. Accounts Chem. Res. 54 (11), 2543–2551. doi:10.1021/acs.accounts.1c00073
Christian, J. H., Foley, B. J., Ciprian, E., Darvin, J., Dick, D. D., Hixon, A. E., et al. (2023). Probing the thermal decomposition of plutonium (III) oxalate with IR and Raman spectroscopy, X-ray diffraction, and electron microscopy. J. Nucl. Mater. 584, 154596. doi:10.1016/j.jnucmat.2023.154596
Christian, J. H., Foley, B. J., Ciprian, E., Dick, D. D., Said, M., Darvin, J., et al. (2022). Raman and infrared spectra of plutonium (IV) oxalate and its thermal degradation products. J. Nucl. Mater. 562, 153574. doi:10.1016/j.jnucmat.2022.153574
Chung, B. W., Erler, R. G., and Teslich, N. E. (2016). Three-dimensional microstructural characterization of bulk plutonium and uranium metals using focused ion beam technique. J. Nucl. Mater. 473, 264–271. doi:10.1016/j.jnucmat.2016.01.041
Claparede, L., Clavier, N., Dacheux, N., Moisy, P., Podor, R., and Ravaux, J. (2011). Influence of crystallization state and microstructure on the chemical durability of cerium–neodymium mixed oxides. Inorg. Chem. 50 (18), 9059–9072. doi:10.1021/ic201269c
Corbey, J. F., Sweet, L. E., Sinkov, S. I., Reilly, D. D., Parker, C. M., Lonergan, J. M., et al. (2021). Quantitative microstructural characterization of plutonium oxalate auto-degradation and evidence for PuO2 nanocrystal formation. Eur. J. Inorg. Chem. 2021 (32), 3277–3291. doi:10.1002/ejic.202100511
Dollimore, D. (1987). The thermal decomposition of oxalates. A review. Thermochim. Acta 117, 331–363. doi:10.1016/0040-6031(87)88127-3
Facer, J. J. F., and Harmon, K. M. (1954). Precipitation of plutonium(IV) oxalate. doi:10.2172/4634035
Gaschen, B. K., Bloch, J. J., Porter, R., Ruggiero, C. E., Oyen, D. A., and Schaffer, K. M. (2016) MAMA user guide v2.0.1. Los Alamos, NM (United States): Los Alamos National Lab. LANL. Report No.: LA-UR-16-25116 United States 10.2172/1291192 LANL English.
Hainje, C. M., Nizinski, C. A., Jackson, S. W., Clark, R. A., Heller, F. D., Schwerdt, I. J., et al. (2023). Investigation of process history and underlying phenomena associated with the synthesis of plutonium oxides using Vector Quantizing Variational Autoencoder. Chemom. Intelligent Laboratory Syst. 240, 104909. doi:10.1016/j.chemolab.2023.104909
Hofer, F., Schmidt, F. P., Grogger, W., and Kothleitner, G. (2016). Fundamentals of electron energy-loss spectroscopy. IOP Conf. Ser. Mater. Sci. Eng. 109 (1), 012007. doi:10.1088/1757-899x/109/1/012007
Jones, A., Keatley, A. C., Goulermas, J. Y., Scott, T. B., Turner, P., Awbery, R., et al. (2018). Machine learning techniques to repurpose Uranium Ore Concentrate (UOC) industrial records and their application to nuclear forensic investigation. Appl. Geochem. 91, 221–227. doi:10.1016/j.apgeochem.2017.10.023
Keegan, E., Kristo, M. J., Colella, M., Robel, M., Williams, R., Lindvall, R., et al. (2014). Nuclear forensic analysis of an unknown uranium ore concentrate sample seized in a criminal investigation in Australia. Forensic Sci. Int. 240, 111–121. doi:10.1016/j.forsciint.2014.04.004
Klinger, M., and Jäger, A. (2015). Crystallographic Tool Box (CrysTBox): automated tools for transmission electron microscopists and crystallographers. J. Appl. Crystallogr. 48 (Pt 6), 2012–2018. doi:10.1107/s1600576715017252
LaCount, M. D., Meier, D. E., Ritzmann, A. M., Muller, S. E., Clark, R. A., Buck, E. C., et al. (2023). Ab initio modeling and thermodynamics of hydrated plutonium oxalates. J. Nucl. Mater. 583, 154504. doi:10.1016/j.jnucmat.2023.154504
Ly, C., Olsen, A. M., Schwerdt, I. J., Porter, R., Sentz, K., McDonald, L. W., et al. (2019). A new approach for quantifying morphological features of U3O8 for nuclear forensics using a deep learning model. J. Nucl. Mater. 517, 128–137. doi:10.1016/j.jnucmat.2019.01.042
Machuron-Mandard, X., and Madic, C. (1996). Plutonium dioxide particle properties as a function of calcination temperature. J. Alloys Compd. 235 (2), 216–224. doi:10.1016/0925-8388(95)02122-1
Martin, P., Grandjean, S., Ripert, M., Freyss, M., Blanc, P., and Petit, T. (2003). Oxidation of plutonium dioxide: an X-ray absorption spectroscopy study. J. Nucl. Mater. 320 (1), 138–141. doi:10.1016/s0022-3115(03)00180-6
Mayer, K., Wallenius, M., and Ray, I. (2005). Nuclear forensics-a methodology providing clues on the origin of illicitly trafficked nuclear materials. Analyst. 130 (4), 433–441. doi:10.1039/b412922a
McDonald, L. W., Sentz, K., Hagen, A., Chung, B. W., Nizinski, C. A., Schwerdt, I. J., et al. (2023). Review of multi-faceted morphologic signatures of actinide process materials for nuclear forensic science. J. Nucl. Mater. 588, 154779. doi:10.1016/j.jnucmat.2023.154779
Meadows, T., Kruska, K., Tripathi, S., Hall, G., Carter, J., McNamara, B., et al. (2020). Unveiling the early stages of the F-element oxalate growth evolution with cryo-TEM. Microsc. Microanal. 26, 642–644. doi:10.1017/s143192762001538x
Olsen, A. M., Richards, B., Schwerdt, I., Heffernan, S., Lusk, R., Smith, B., et al. (2017). Quantifying morphological features of α-U3O8 with image analysis for nuclear forensics. Anal. Chem. 89 (5), 3177–3183. doi:10.1021/acs.analchem.6b05020
Ophus, C. (2019). Four-dimensional scanning transmission electron microscopy (4D-STEM): from scanning nanodiffraction to ptychography and beyond. Microsc. Microanal. 25 (3), 563–582. doi:10.1017/s1431927619000497
Orr, R. M., Sims, H. E., and Taylor, R. J. (2015). A review of plutonium oxalate decomposition reactions and effects of decomposition temperature on the surface area of the plutonium dioxide product. J. Nucl. Mater. 465, 756–773. doi:10.1016/j.jnucmat.2015.06.058
Peruski, K. M., and Powell, B. A. (2020). Effect of calcination temperature on neptunium dioxide microstructure and dissolution. Environ. Sci. Nano. 7 (12), 3869–3876. doi:10.1039/d0en00689k
Runde, W., Brodnax, L. F., Goff, G., Bean, A. C., and Scott, B. L. (2009). Directed synthesis of crystalline plutonium(III) and (IV) oxalates: accessing redox-controlled separations in acidic solutions. Inorg. Chem. 48 (13), 5967–5972. doi:10.1021/ic900344u
Said, M., and Hixon, A. E. (2021). Microscopy and spectroscopy of plutonium dioxide aging under ambient and near-ambient conditions. J. Alloys Compd. 854, 156277. doi:10.1016/j.jallcom.2020.156277
Schwantes, J. M., Corbey, J. F., and Marsden, O. (2022). Exercise Celestial Skónis: Part 2 – emerging technologies and State of Practice of nuclear forensic analyses demonstrated during the 6th collaborative materials exercise of the nuclear forensics International Technical Working Group. Forensic Chem. 29, 100423. doi:10.1016/j.forc.2022.100423
Schwerdt, I. J., Olsen, A., Lusk, R., Heffernan, S., Klosterman, M., Collins, B., et al. (2018). Nuclear forensics investigation of morphological signatures in the thermal decomposition of uranyl peroxide. Talanta 176, 284–292. doi:10.1016/j.talanta.2017.08.020
Schwerdt Ian, J., Hawkins Casey, G., Taylor, B., Brenkmann, A., Martinson, S., and McDonald, IVLW (2019). Uranium oxide synthetic pathway discernment through thermal decomposition and morphological analysis. Radiochim. Acta2019 107, 193–205. doi:10.1515/ract-2018-3033
Scott, B. L., Pugmire, A. L., Stritzinger, J. T., Veirs, D. K., Wolfsberg, L. E., and Wilkerson, M. P. (2019). Relationships between experimental signatures and processing history for a variety of PuO2 materials. J. Nucl. Mater. 521, 155–160. doi:10.1016/j.jnucmat.2019.04.036
Soltis, J. A., McBriarty, M. E., Qafoku, O., Kerisit, S. N., Nakouzi, E., De Yoreo, J. J., et al. (2019). Can mineral growth by oriented attachment lead to incorporation of uranium(vi) into the structure of goethite? Environ. Sci. Nano 6 (10), 3000–3009. doi:10.1039/c9en00779b
South, C. J., and Roy, L. E. (2021). Insights into the thermal decomposition of plutonium(IV) oxalate – a DFT study of the intermediate structures. J. Nucl. Mater. 549, 152864. doi:10.1016/j.jnucmat.2021.152864
Tamasi, A. L., Cash, L. J., Mullen, W. T., Pugmire, A. L., Ross, A. R., Ruggiero, C. E., et al. (2017). Morphology of U3O8 materials following storage under controlled conditions of temperature and relative humidity. J. Radioanalytical Nucl. Chem. 311 (1), 35–42. doi:10.1007/s10967-016-4923-1
Thompson, N. B. A., Gilbert, M. R., and Hyatt, N. C. (2021). Nuclear forensic signatures of studtite and α-UO3 from a matrix of solution processing parameters. J. Nucl. Mater. 544, 152713. doi:10.1016/j.jnucmat.2020.152713
Tyrpekl, V., Beliš, M., Wangle, T., Vleugels, J., and Verwerft, M. (2017). Alterations of thorium oxalate morphology by changing elementary precipitation conditions. J. Nucl. Mater. 493, 255–263. doi:10.1016/j.jnucmat.2017.06.027
Vitart, A.-L., Haidon, B., Arab-Chapelet, B., Rivenet, M., Bisel, I., Pochon, P., et al. (2017). From Nd(III) and Pu(III) oxalates to oxides: influence of nitrilotris(methylenephosphonic acid) on chemical composition, structure, and morphology. Cryst. Growth and Des. 17 (9), 4715–4725. doi:10.1021/acs.cgd.7b00643
Wright, S. I., Nowell, M. M., and Bingert, J. F. (2007). A comparison of textures measured using X-ray and electron backscatter diffraction. Metallurgical Mater. Trans. A 38 (8), 1845–1855. doi:10.1007/s11661-007-9226-2
Keywords: plutonium, transmission electron microscopy, nuclear forensics, morphology, electron energy loss spectra (EELS)
Citation: Buck EC, Reilly DD, Sweet LE, Nicholas AD, Heller FD, Hall GB, Clark RA and Casella AJ (2024) Investigation of the thermal decomposition of Pu(IV) oxalate: a transmission electron microscopy study. Front. Nucl. Eng. 3:1380137. doi: 10.3389/fnuen.2024.1380137
Received: 01 February 2024; Accepted: 23 April 2024;
Published: 22 May 2024.
Edited by:
Thierry Wiss, Joint Research Centre, GermanyReviewed by:
Matthieu Virot, CEA Marcoule, FranceNicolas Clavier, UMR5257 Institut de Chimie Séparative de Marcoule (ICSM), France
Copyright © 2024 Buck, Reilly, Sweet, Nicholas, Heller, Hall, Clark and Casella. This is an open-access article distributed under the terms of the Creative Commons Attribution License (CC BY). The use, distribution or reproduction in other forums is permitted, provided the original author(s) and the copyright owner(s) are credited and that the original publication in this journal is cited, in accordance with accepted academic practice. No use, distribution or reproduction is permitted which does not comply with these terms.
*Correspondence: Edgar C. Buck, ZWRnYXIuYnVja0Bwbm5sLmdvdg==