 Levi Morin Larsen
 Kathryn Biegel2
 Nahuel Guaita
94% of researchers rate our articles as excellent or good
Learn more about the work of our research integrity team to safeguard the quality of each article we publish.
Find out more
ORIGINAL RESEARCH article
Front. Nucl. Eng. , 09 May 2024
Sec. Nuclear Reactor Design
Volume 3 - 2024 | https://doi.org/10.3389/fnuen.2024.1379414
This article is part of the Research Topic Advances in Small Modular Reactors View all 3 articles
The U.S. Inflation Reduction Act (IRA) of 2022 provides a wide array of tax credits and other incentives for low-carbon energy. The technology-neutral clean generation production tax credit (PTC) (Section 45Y of the U.S. Internal Revenue Code) and the technology-neutral investment tax credit (ITC) (Section 48E) lower the net cost of new electricity generation projects with zero or negative greenhouse gas emission rates. We evaluate the impact of the IRA legislation—specifically the PTC and ITC—on the cost-competitiveness of small modular reactors (SMRs). We use the Argonne Low-carbon Energy Analysis Framework (A-LEAF) model to calculate the capacity factor of an SMR with a range of hypothetical variable operating and maintenance (O&M) costs in the Electric Reliability Council of Texas (ERCOT) electricity market. We selected ERCOT for market modeling because of its competitive structure, available data, and extensive use in prior literature. We use a discounted cash flow model to calculate the SMR’s net present value based on the market prices and capacity factors from A-LEAF, hypothetical ranges of capital and variable O&M costs, and other input parameters, with or without the IRA tax credits. We determine the SMR owner’s optimal choice of PTC or ITC for the hypothetical ranges of capital and variable O&M costs. We also evaluate potential shifts in the SMR owner’s optimal choice of PTC or ITC based on historical patterns of nuclear capital cost overruns in the United States. We also assess the sensitivity of our results to longer PTC period and electricity prices from the New England market, which tend to be higher than electricity prices in ERCOT. We find that even with the IRA tax credits, only SMRs with low capital and variable O&M costs would be economically feasible in the low-price ERCOT market scenario modeled. A longer PTC period and higher-price market such as New England, however, would significantly expand the economic feasibility of SMRs in the United States.
Nuclear plays an important role in the U.S. energy portfolio. It produces nearly 20% of electricity in the United States, but recent deployments have been sparse (EIA, 2023a). Although many nuclear plants were built in the United States in the late 20th century, the propensity for significant project delays coupled with cost overruns made the technology less financially viable relative to alternatives. This issue has led to limited nuclear deployment in the 21st century with only two major projects being completed in the last 20 years: Watts Bar Unit two and Vogtle Units three and 4. The most recent deployment of Vogtle Units three and 4, with their respective cost overruns (Southern Company, 2023), have re-confirmed the persistence of this issue in the United States.
However, as the negative impacts of climate change have been more of a focus for both U.S. and global leaders, nuclear has gained attention as a potential source of carbon-free, large-scale, firm energy. Multiple U.S. administrations have made carbon emission targets, with the Biden administration most recently committing to “achieving a carbon pollution-free power sector by 2035 and net zero emissions economy-wide by no later than 2050” (White House, 2023). Targets such as these have renewed national interest in nuclear power and other clean energy sources. A striking example of this was the passage of the Inflation Reduction Act (IRA) in 2022, which provides unprecedented federal investment in clean energy (U.S. Congress, 2022). The legislation provides an investment tax credit (ITC) in Section 48E and a production tax credit (PTC) in Section 45Y for new electricity generation facilities with zero or negative greenhouse gas emission rates.
Global interest in nuclear is also growing. At the United Nations Climate Change Conference of the Parties in December 2023, the United States and 21 other countries announced a goal to triple nuclear capacity by 2050 (DOE, 2023). The renewed U.S. and global commitment to nuclear has led some nuclear developers to shift focus from gigawatt-scale designs to smaller, more modular designs, commonly known as small modular reactors (SMRs). These reactors have capacities up to 300 MW electric (MWe) per unit and can be factory-assembled and installed on-site (IAEA, 2023). These characteristics make SMRs less susceptible to the cost overrun problems that have plagued large nuclear construction projects in the United States and Europe.
In addition to reducing the risk of cost overruns, standardized SMR designs and mass manufacturing could lower the expected capital costs of SMRs and attract private investment (Lloyd et al., 2021). Modularization of design could decrease labor and construction time costs significantly. For instance, 80% of an SMR plant could be modularized and transported by road, compared to only 20% of large reactors. Furthermore, 60% of in situ work could be moved off-site (Lloyd, 2020). These potential advantages have motivated developers to begin licensing designs and developing SMRs for applications spanning grid electricity and industrial energy demand.
In this context it is important to highlight that several SMR designs are being developed in the United States. Three of the most prominent SMR developers in the United States are shown in Table 1. As of the publication of this paper, only NuScale’s 50 MWe reactor design has received Nuclear Regulatory Commission (NRC) certification, but TerraPower and X-energy are both in the certification process.

Table 1. Three of the most prominent SMR developers in the United States.
Despite this renewed interest in nuclear and the shift to SMR designs theoretically less susceptible to project cost and execution problems, questions remain whether SMRs will be economically viable. A particularly striking example of these concerns was seen with the cancellation of the Carbon Free Power Project demonstration of a first-of-a-kind (FOAK) SMR (NuScale Power, 2023). The project, which was slated to be built at Idaho National Laboratory (INL) and would provide power to the Utah Associated Municipal Power Systems, was a NuScale design. While the cancellation of this project was the result of myriad factors, economics was the most important. In congressional testimony, INL Director John Wagner stated, “The project did not end because of technical flaws. The NRC approved the NuScale design, which will likely be used to generate electricity in other countries, such as Romania. The Carbon Free Power Project was suspended because of economics. A lack of subscriptions was directly related to the cost issues surrounding deployment of first-of-its-kind technologies” (Wagner, 2023). It is common for FOAK projects to be costly, and often nascent technologies receive government subsidies to encourage first movers and advance market adoption. The Carbon Free Power Project was no exception. The project already anticipated receiving subsidies from the IRA when determining costs and failed to produce economically advantageous prices for its customers despite the subsidies (IEEFA, 2023). Given this, it becomes highly relevant to analyze the financial factors that affect the costs of SMRs.
This article provides a novel contribution to the literature on SMR economics by presenting a financial analysis of the IRA’s 45Y and 48E tax credits for eligible generation sources while also accounting for the impacts of market conditions. This is done by simulating a hypothetical SMR operator’s economic viability, including willingness to bid (and subsequently operate when prices permit) in a competitive market, for various possible levels of capital and operating costs. The market dynamics are simulated using Electric Reliability Council of Texas (ERCOT) data, which includes nuclear, solar, wind, gas, and coal generators in the bid stack. These revenue projections are fed into a discounted cash flow model that captures revenues, costs, construction time, construction spend curve, weighted average cost of capital (WACC), debt-to-equity investment splits, impacts of depreciation and interest expense, taxes, operational life, and debt and depreciation scheduling. These market simulations, in combination with detailed financial modeling, cost overrun risk, and sensitivity scenarios described below, make several novel contributions and provide additional insights beyond prior literature, such as Nuclear Innovation Alliance, (2023).
This article avoids making specific predictions about capital and operating costs for SMRs. Without actual data from real construction experience, particularly in the United States, making reliable predictions is inherently difficult. Instead, this article develops a panel analysis across a range of capital and operating cost estimates. Readers may wish to examine results which most closely match their own predictions about likely true cost figures, but the trends exhibited across this two-parameter matrix will likely be much more informative than evaluating individual point results in isolation. The results of this study not only produce a “feasibility region” within which SMR projects may be economically viable, but also describe how the boundaries of the feasibility region are blurred due to cost estimation uncertainty and construction risk.
Given the highly competitive nature of the ERCOT market and its low electricity prices, these results could be considered as lower bounds on economically feasible construction and O&M costs for SMRs. Markets with fewer low-cost suppliers and higher price tolerance will yield more profitable outcomes, as shown in the sensitivity results for the New England market, or for SMRs operating in remote locations or markets with less renewable energy.
The U.S. IRA of 2022 has provided a vast set of support mechanisms for diverse energy technologies. Two of these mechanisms could directly impact the economic prospects of advanced nuclear technologies: the Section 45Y Technology Neutral Clean Electricity PTC and the Section 48E Technology Neutral Clean Electricity ITC. The IRA specifies that these tax credits are available to electricity generation facilities with zero or negative greenhouse gas (GHG) emission rate and placed in service after 31 December 2024. The IRA specifies the final year of eligibility as the later of 2032 or the year in which U.S. GHG emissions decline to 25% of their level in 2022.
The U.S. Department of the Treasury, which has jurisdiction over tax credits, has not yet specified the eligible categories of electricity generation facilities for the Section 45Y PTC and Section 48E ITC based on GHG emission rates. This analysis assumes that new nuclear plants will be eligible, as nuclear developers and other organizations have also assumed (e.g., Nuclear Innovation Alliance, 2023). These tax credits would support the economic competitiveness of new nuclear plants relative to renewable generators that have received tax credits for decades (Bolinger, 2009; Lantz et al., 2014; Steinberg et al., 2023).
Specifically, the PTC gives an inflation-adjusted base rate of $5.5/MWh of clean electricity produced without labor requirements described below, or $27.5/MWh if labor requirements are met. The base rate can be augmented by 10% if the domestic content requirements are met, and by an additional 10% if the facility is built in an energy community, also described below. With the two bonuses, the maximum PTC would be $33/MWh with a duration of 10 years, beginning with the first year of an eligible electricity generation facility’s operation.
On the other side, the ITC has a base value of 6% of the investment cost of a clean electricity project without labor requirements, or 30% of the investment cost if labor requirements are met. That base rate can be augmented by 10% points if the domestic content requirements are met, and an additional 10% points if the facility is built in an energy community. This means that a maximum of 50% of the project’s investment costs can be recouped via the ITC when the project enters service if all base and bonus requirements are met.
Note that both tax credits have the potential bonus of labor requirements. This means that if a taxpayer wants to claim the labor bonus, newly proposed projects must show that labor wages during construction meet or surpass prevailing rates and that a minimum portion of the work is undertaken by individuals enrolled in registered apprentice programs. Given this, this requirement could raise the capital costs of facilities, for instance in the case that a facility is paying wages below prevailing wage thresholds in the market of interest (Steinberg et al., 2023). The present analysis assumes that all new projects would adhere to the labor requirement without causing impacts on project costs.
Additionally, the Energy Community Tax Credit Bonus provides a bonus of up to 10% (for PTC) or 10 percentage points (for ITC) for projects, facilities, and technologies located in energy communities defined as in the IRA (IWG, 2023):
• “Brownfield Site":
Defined in specific subparagraphs of the Comprehensive Environmental Response, Compensation, and Liability Act of 1980.
• “Metropolitan Statistical Area” or “Non-Metropolitan Statistical Area” Criteria:
Must have (or had at any time after 2009): 0.17% or greater direct employment or 25% or greater local tax revenues related to the extraction, processing, transport, or storage of coal, oil, or natural gas.
Unemployment rate at or above the national average unemployment rate for the previous year.
• Census Tract Criteria:
A census tract (or directly adjoining census tract) in which:
A coal mine has closed after 1999; or.
A coal-fired electric generating unit has been retired after 2009.
A map of the potential energy communities that could receive this bonus is shown in Figure 1.
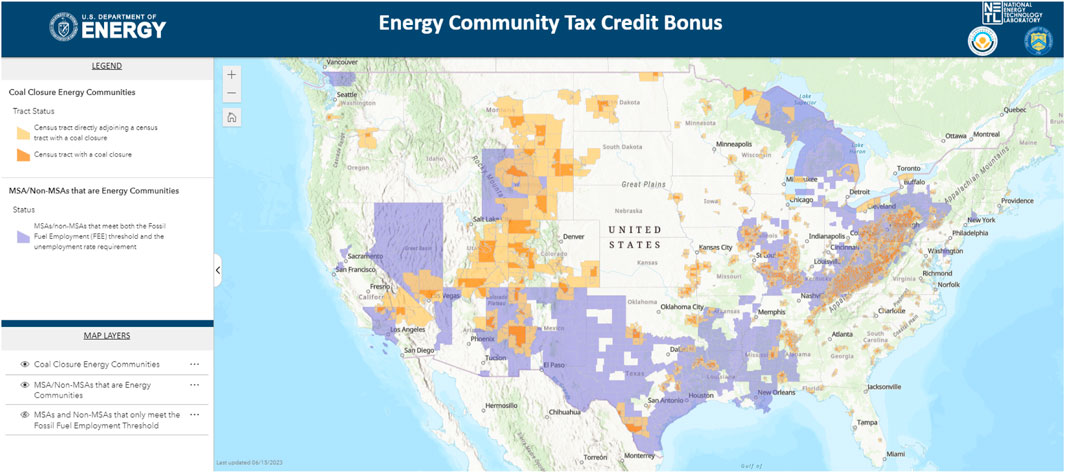
Figure 1. Energy communities for IRA tax credit bonus (Interagency Working Group, 2023).
New generation sources eligible for these IRA tax credits must choose either the PTC or ITC. This creates a tradeoff, because facilities should consider the ITC and PTC depending on their capital costs, capacity factor, and generation, all of which may be difficult to forecast. The owner of a generation source with high capital cost but low-capacity factor would prefer the ITC, because its value is high when the capital cost is high. By contrast, the owner of a generation source with a low capital cost and a high-capacity factor would prefer the PTC, because its value is high when annual generation is high. While in some renewable energy technologies the selection of PTC or ITC is relatively straightforward, nuclear plants have both high capital costs and high-capacity factor. The analysis presented in this article addresses the key tradeoff between the IRA tax credits for new nuclear plants.
Finally, IRA authorizes “applicable entities,” including tax-exempt organizations, State and local governments, Indian tribal governments, Alaska Native Corporations, the Tennessee Valley Authority, and rural electric cooperatives, to opt for an election treating a determined applicable tax credit, including Sections 45Y and 48E, as a payment against the tax imposed by subtitle A of the Internal Revenue Code for the corresponding taxable year (IRS, 2023). Even if some entities do not owe federal income tax, the tax credits can still be received through elective payment. Elective payment is an option that allows certain entities, including tax-exempt and governmental organizations, to benefit from clean energy tax credits even if they do not owe federal income tax. When this option is chosen, the tax credit amount is treated as a payment of tax, leading to a potential refund for any overpayment (IRS, 2023). Applicable entities eligible for elective pay include tax-exempt organizations, states, local governments, tribal governments, Alaska Native Corporations, Tennessee Valley Authority, rural electric cooperatives, U.S. territories, and various governmental agencies.
It is also vital to note that IRA tax credits do not change the “gross” (i.e., full) costs of SMR construction and operation. Instead, the tax credits are financial supports that lower the net costs (calculated after deducting any discounts, credits, or other modifications that may be relevant to the purchase of any good or service) to SMR developers or owners. Input-output models to forecast the economic impacts of SMR construction and operation over the rest of the economy, such as jobs, local and regional gross domestic product contributions and indirect effects on other industries or supply chains, depend on gross costs and thus are unaffected by IRA tax credits. For instance, when a company building an SMR buys materials and equipment, it pays the full costs. Later, when the SMR is operating, the company recovers a portion of the money spent as tax credits.
As of the time of writing, no SMRs have yet been built in the United States. Without concrete data from real construction experience, any modeling or assessment of SMR economics must rely on estimates, which are inherently uncertain. Some SMR developers have released cost estimates for their designs, and various prior studies have compiled this type of data (Vegel and Quinn, 2017; EIRP, 2021; Stewart and Shirvan, 2022; Asuega et al., 2023; Steigerwald et al., 2023). Furthermore, various meta studies on the cost ranges of SMRs have developed results on expected SMR costs with uncertainty measures (Petti et al., 2018; SMR Start, 2021; EIA, 2022; Stein et al., 2022; Abou Jaoude et al., 2023).
After surveying the literature, a very wide range of claimed or computed values was found for expected SMR capital costs. Estimates ranged as low as $1,995/kWe and as high as $29,624/kWe; however, the bulk of the data was less than $10,000/kWe. This latter range is adopted for the purposes of this study.
Operating and maintenance (O&M) data exhibited a similarly broad distribution. This analysis models a range of hypothetical variable O&M costs to evaluate the SMR’s capacity factor under market conditions. As described in the next subsection, the SMR generates electricity for sale into the competitive market when its variable O&M costs are lower than market prices, subject to refueling, forced outages, and any other operational constraints. Fixed O&M cost is held constant in our analysis at $122/kW-year (EIA, 2023b).
The main source of variable O&M cost estimates, including fuel costs, is the meta-analysis by Steigerwald et al. (2023). Current U.S. nuclear plants had average O&M costs–including fixed, variable, and fuel–of $24.05/MWh in 2022 (NEI, 2023). Although SMRs could use digital twins, offsite control, and other strategies also under consideration for microreactors and fission batteries (Bryan et al., 2023), O&M costs per kW could still be higher for SMRs than current large nuclear plants because of diseconomies of scale.
Table 2 provides summary statistics of these different cost categories, along with the selected ranges for modeling.
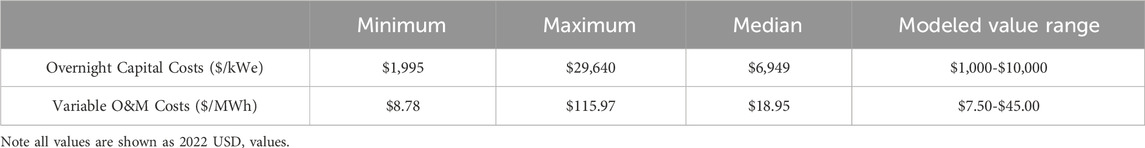
Table 2. Summary of data obtained from literature review on overnight capital costs and total O&M costs, and value ranges selected for modeling in this study.
Different “corners” of this two-way parameter range may be useful to represent different types of projects. High capital and variable O&M costs may be more representative of FOAK projects, which have not benefited from learning effects or mature supply chains. Low capital and variable O&M costs may be more representative of NOAK projects, in a hypothetical scenario where many identical units are built and learning effects significantly reduce both capital and operating costs. Individual points within this matrix may also correspond with estimates for specific designs produced by various sources.
To replicate an energy scenario for SMRs, it is important to introduce the market characterization in which the SMRs will be modelled. This study assumes that the prospective SMR unit under consideration will be built in a competitive wholesale electricity market region. A large proportion of electricity produced in the United States is traded in competitive wholesale markets. The economics of generation asset viability in rate-regulated markets, by contrast, are complex and involve many qualitative factors. In order to most clearly elucidate the effects of costs and cost uncertainty on economic viability for prospective investments in new nuclear, we chose to model two competitive wholesale markets: ERCOT and the Independent System Operator–New England market system (ISO-NE). The ISO-NE modeling was done in a more high-level analysis without A-LEAF, as explained in Section 3.2.
ERCOT accounts for some 85% of all electricity consumed within the state of Texas, and is notable for comprising its own interconnect, meaning that power imports and exports make up only a very small share of total electricity transacted in ERCOT. Furthermore, ERCOT takes a more pure-market approach to price formation and capacity assurance than any other competitive market in the United States. ERCOT remunerates generation and three ancillary services, but it has no forward capacity market for long-term security of supply, and no currently active state-wide energy incentives or policies.
In a competitive market, generation units offer their capacity into the market at a chosen price for a particular hour. The role of the market operator is to optimally match supply and demand, by choosing from among all the generation offers to satisfy the market’s electricity demand for that hour at the lowest possible price. All generators whose offers are accepted receive the price of the most expensive accepted offer (the “marginal generation unit”). A simplified chart showing the market settlement process for the supply and demand curves in an illustrative hour is shown in Figure 2.
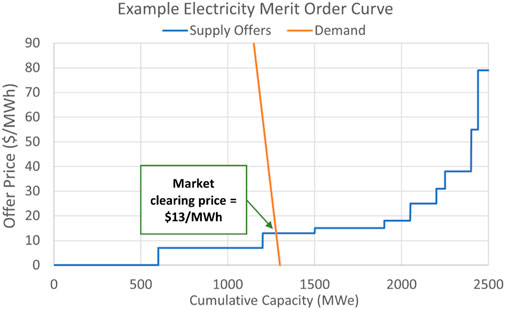
Figure 2. Example electricity merit order curve.
The supply curve, marked in blue, shows the cumulative generator capacity offers, rank-ordered from lowest to highest marginal costs. The demand curve, marked in orange, shows the amount of electricity which the market demands for this hour. Bilateral contracts, transmission congestion, and demand/availability mispredictions are not considered in this simple example. The point at which the supply and demand curves meet is the market settlement price, in this case $13/MWh. This process would repeat for each hour of the year, so each hour may have a unique solution depending on demand levels and the availability of renewables units (solar units normally offering at $0/MWh cannot generate at 12:00 AM, for example).
However, valid market “solutions” are also limited by the operational constraints of the units involved. The market operator cannot demand that a powered-down conventional nuclear power plant start up and ramp to a 100% power level immediately, even if doing so would be cost-optimal for the system, because that behavior is impossible for the unit to execute. Furthermore, the real electricity grid has a fixed pattern of transmission lines with limited capacity, causing locational variations in price outcomes as well. This combination of variables can make it very complex to forecast the full hourly results of a market like ERCOT, but several modeling tools exist to solve this problem.
The Argonne Low-carbon Energy Analysis Framework (A-LEAF) is an electricity market simulation framework, designed to model capacity expansion and hourly market operations at the U.S. national or regional scales. It optimally solves the least-cost electricity dispatch problem for each hour of the year, incorporating detailed user-specified assumptions about generation unit operational capabilities, costs, transmission networking, energy policies, and other system details.
A-LEAF does not make any assumptions about generator activity. It directly simulates both halves of the market settlement process for each sequential hour of the year: all available generators submit their generation offers, and the simulated central market operator determines the least-cost mix of generation which satisfies both demand and operational constraints for all hours. It does not rely on price duration curves, levelized cost of electricity (LCOE), or any other approximation method; all market processes are simulated “live.”
Second, A-LEAF outputs detailed information cataloguing offers and market results for all units for every hour of the year, including market settlement prices and amounts of electricity (and ancillary services) provided by each unit type for each hour. This data can be used to determine exactly how much electricity and ancillary service capacity each generation unit dispatched in the market, as well as the prices received for all generation, and therefore the total market revenues earned by each unit.
Detailed modeling of ISO-NE was not undertaken in this study. The additional complexities of this market, including significant power imports and exports and the forward capacity market, rendered a full ISO-NE model out of scope for the present work. Section 3.2 presents high-level analysis of SMR economics using average electricity market prices from ISO-NE. Detailed market operations modeling for ISO-NE would be an interesting avenue for future work.
The simulated annual revenue and cost values were input into a discounted cash flow (DCF) model to capture additional factors on project profitability. Using DCF modeling to understand project profitability adds value to the analysis by accounting for the time value of money associated with investments with long investment and operation. This method, which discounts future cash flows back to the same dollar year (hypothetically being year zero, when the project begins) allows one to stack project investments against revenues and compare them commensurably. This is necessary because $100 today is worth more than $100 next year because it can be invested and earn an interest rate on the investment. For example, $100 today could be invested, risk free, at a hypothetical rate of 5% and be worth $105 next year. Put differently, $100 a year from now is actually worth ∼$95 in today’s terms when accounting for the time value of money. This discounting of future cash flows is done using a discount factor, calculated as shown in Equation 1.
Equation 1. Discount factor calculation.
Where the discount factor,
Equation 2. Net present value calculation.
Where.
•
•
•
•
•
The discount rate for a project is firm-specific and a function of project risk and project financing. Typically, the discount rate used for a project is the weighted average cost of capital (WACC), which is calculated using the respective required returns for both debt and equity capital weighted by the percent total of that capital type, and accounting for tax impacts (EIA, 2023b).
With the value and basic methodology of DCF modeling established, it is now useful to dive deeper into what exactly is encapsulated in a cash flow calculation for a given time period (shown as
• Revenue
• Variable and fixed O&M
• Depreciation
• Interest expense
• Tax expense and tax credits
To convert net income to cash flow, one must add back in non-cash expenses such as depreciation, and subtract cash expenses associated with financing, such as debt principal payments. This produces the actual change in cash for the firm which is used to produce the cash returns and represents the value for
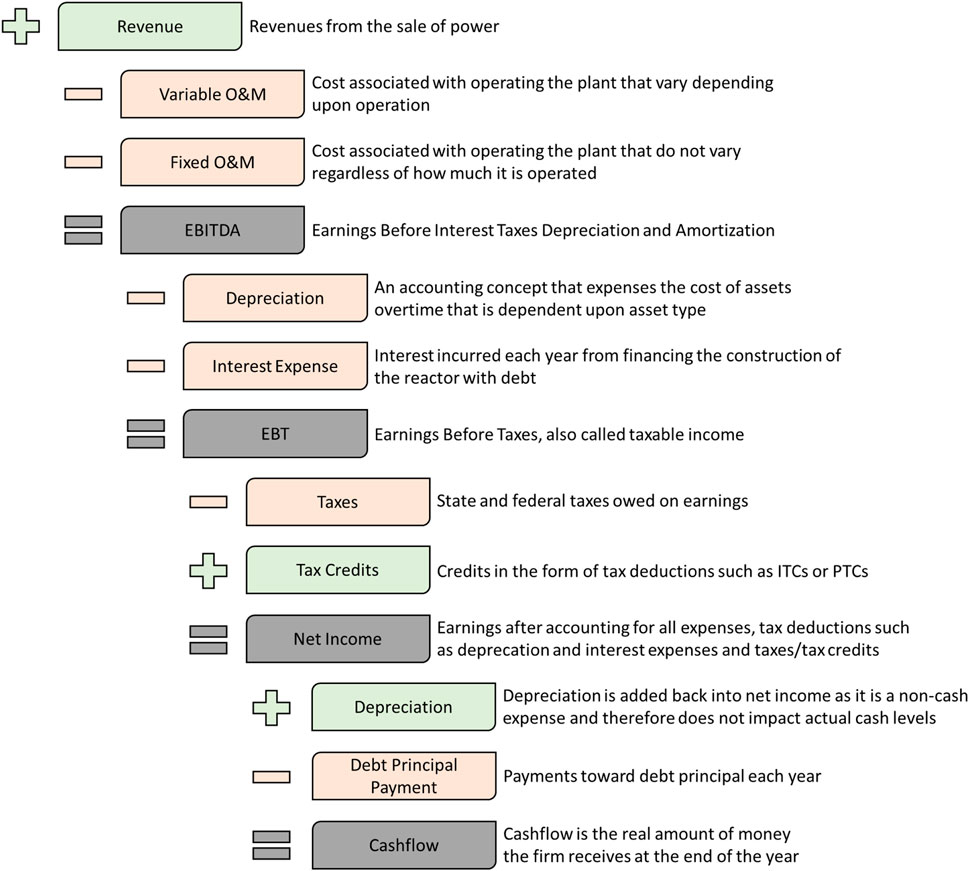
Figure 3. Cash flow account breakout and calculation.
Dollar values in this article are in 2022 USD. In the DCF model, real cash flows were used instead of nominal, so all values were adjusted by an assumed constant future inflation rate of 3% each year.
This section describes the parameters and modeling methods used to derive each of the accounts shown in Figure 3.
Four modeling cases were developed, as laid out in Table 3. Results for the two ISOs under consideration will be presented sequentially, in Sections 3.1 and 3.2, respectively.
Table 3. Modeling cases.
ERCOT is an energy-only market, with no capacity market. In recent years, ERCOT has tended to exhibit relatively low average prices (between $25/MWh and $47/MWh between 2014 and 2020), punctuated by years of high prices due to winter storms (causing average prices of $168/MWh and $75/MWh in 2021 and 2022, respectively). In the absence of winter storm conditions, the low-price ERCOT wholesale market is a challenging environment for new nuclear, where profits are low and there are no support mechanisms for capacity. The ERCOT market prices used in this analysis have an annual average of approximately $30/MWh.
ISO-NE, on the other hand, tends to exhibit higher market prices, and also has a capacity market and various state mechanisms for supporting zero-carbon energy. The average day-ahead market price in ISO-NE between 2018 and 2022 was $52/MWh, not including capacity market or other policy revenue (ISO New England, 2023).
Variable O&M cost inputs ranged from $7.50/MWh to $45.00/MWh in steps of $7.50/MWh according to the range described in section 2.1. In the DCF analysis, variable O&M and fuel costs are scaled by the unit’s total amount of electricity generated during the year. A-LEAF directly simulates the representative SMR’s generation activity across the entire year of operations, so the SMR’s total electricity generation in MWh is available as an output from A-LEAF.
In the ERCOT cases, revenues for the SMR unit were estimated using A-LEAF modeling. A single year, representative of 2022, was modeled for the ERCOT market. Table 4 shows the ERCOT results when the SMR does not receive a PTC (either in the no-policy case, or when the unit elects the ITC instead).
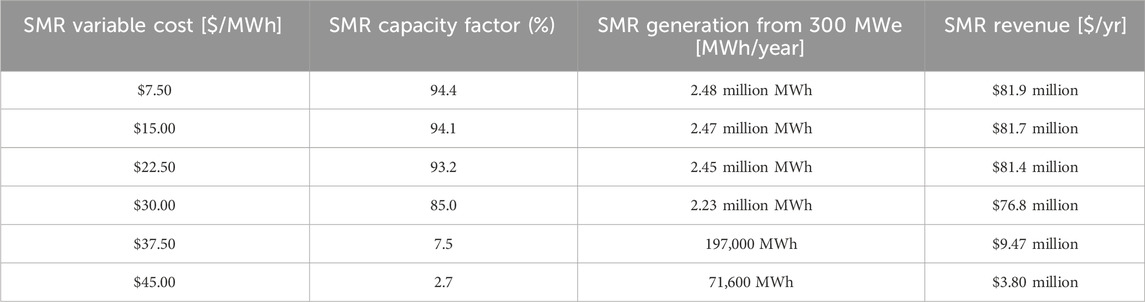
Table 4. SMR total generation and revenue results when the SMR does not receive the IRA PTC, from the six A-LEAF simulations in ERCOT at different variable costs.
As the SMR’s variable cost increases, the cost at which it bids into the market also increases. Because all dispatched units in a given hour receive the price set by the intersection of demand with the highest-marginal-cost generation offer, this increasing cost does not significantly affect how often the SMR is dispatched until its variable cost reaches $37.50/MWh. At this level, it is pushed out of the market during low-demand (i.e. low-price) hours. At a variable cost of $45/MWh, the SMR is forced into a peaking role: it generates only during high-demand, high-price, near-scarcity hours (mostly during the summer peak).
This “pricing-out” effect decreases the SMR’s total earned revenue, but not as significantly as might be expected at first glance. The first hours during which the unit will be curtailed are low-demand hours, when wind and solar generally meet a large portion of demand. The loss of these hours, when market prices are generally $30/MWh or less, is not too economically impactful. Compare this to the summer peak hours, when prices exceed $1,000/MWh for certain durations. Due to high demand in these hours, the SMR is still dispatched. This is the exact business model of many peaker units today: operate only when prices are at their highest, to capture the highest-value market opportunities.
Table 5 shows the ERCOT results when the SMR receives a PTC. With this production subsidy, the SMR bids into the competitive market at its variable costs minus the pre-tax value of the PTC, which is calculated by dividing the PTC value ($27.50/MWh before bonuses and inflation) by one minus the tax rate (Ho et al., 2021). By bidding into the competitive market at lower levels, the SMR is competitive even with $37.50/MWh or $45.00/MWh in variable O&M costs. It continues to supply electricity and make an operating profit even when market prices are below its variable O&M costs. The “pricing-out” effect occurs much less in the PTC modeling results than in the ITC results.
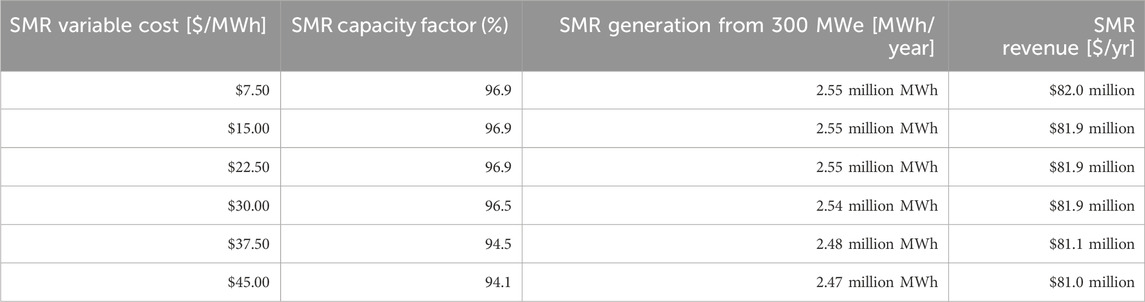
Table 5. SMR total generation and revenue results when the SMR receives the IRA PTC, from the six A-LEAF simulations in ERCOT at different variable costs.
For this study, parameters for a representative generic SMR were developed to represent general characteristics of current SMR design concepts without directly representing any particular technology or design. Data was taken from the National Renewable Energy Laboratory (NREL) Annual Technology Baseline (ATB), as well as the literature review conducted in section 2.1.
The representative SMR has a nameplate capacity of 300 MWe, and an assumed 80-year lifetime. The useful life assumption was chosen to represent current movement within the U.S. commercial reactor fleet to further extend licenses to 80 years. It is not guaranteed that new SMRs would be able to operate for this full time span, which depends on success in safe operations and regulatory factors. However, the discounting of cash flows means that the contribution of years beyond 60 to the economic assessment is quite small, so an alternate assumption of 60 years would have limited effect on the results.
For the ERCOT cases, the SMR’s capacity factor was not an assumption made by the modeling team. It can be computed arithmetically after-the-fact based on the A-LEAF modeling results, as shown in the preceding tables, but it is worth emphasizing that the SMR’s capacity factor is a completely endogenous, “live-modeled” result from the ERCOT A-LEAF market model.
For the ISO-NE case, a nuclear capacity factor of 93% was chosen, to reflect the average operational experience in the U.S. commercial nuclear fleet from 2018 to 2022.
The capital expenditures were depreciated using a modified accelerated cost recovery system (MACRS) 150% declining balance schedule as stipulated by the 2022 IRS asset depreciation guidelines (IRS, 2022). In this instance, the IRS recommends a MACRS schedule with a 15-year 150% declining balance method and a half year convention. This MACRS schedule fully depreciates the asset over 16 years in a nonlinear fashion, where the bulk of the depreciation is concentrated in the early years of the depreciation schedule after the start of operations. Technically, a firm could elect to use an alternative depreciation system method, where the plant is depreciated over 20 years according to a more linear scheme. However, the MACRS method yields larger tax deductions earlier on in the project when the values are discounted less, resulting in higher effective cash flows for the firm. A firm aiming to maximize cash flows would be expected to elect the more aggressive depreciation method, so the MACRS method was selected for this model.
In the interest of simplicity, a capitalization structure of 50% debt and 50% equity was assumed for this study. Different capitalization structures can be more optimal for different firms, as debt is less costly and can provide significant tax benefits, but imposes inflexible payment schedules on the firm. For example, a UK study published in 2008 found that four new nuclear plants were financed using 70% debt 30% equity splits (WNA, 2008).
The cost of accessing external financing is a critical factor for assessing major capital projects. This study used a WACC of 6.4%. This value was selected by considering the Annual Energy Outlook (AEO) modeling assumptions used by Energy Information Administration (EIA) in their 2023 AEO publication (EIA, 2023b). AEO uses a WACC of 6.4%. It is worth noting that the modeling performed by EIA assumes new construction financing is the same irrespective of generation type (renewable, fossil fuel, and nuclear power plants all have the same assumed WACC). It is also common for firms to use a hurdle rate, where an additional return is required above WACC to account for project-specific risk. Hurdle rates to incorporate this risk premium vary depending on the firm and project. Hurdle rates above the WACC value of 6.4% used in this analysis would lower the NPV results.
The project was assumed to be completed over a 6-year period with the total overnight capital cost distributed according to a triangular distribution across that time. The debt portion of this capital expenditure was assumed to accumulate interest at a 5% rate over those 6 years of project construction. It is possible that SMRs will be built in shorter timeframes so this assumption can be considered as conservative.
The assumed total federal and state tax rate was 25%. As both of the policies under consideration are tax credits, this study assumes that the SMR project is being considered by a relatively large firm with excess tax liability from its other operations. Therefore, receipt of tax credits in excess of the SMR project’s annual tax liability or instances of negative taxable income are assumed to be feasible—excess tax credits or negative taxable income are assumed to apply at full face value to the firm’s other tax liabilities because of the IRA elective pay provisions described above.
A summary of the modeling parameters and sources is shown in Table 61.

Table 6. Modeling parameters and sources.
The construction of any large, technologically complex project is liable to cost overruns and schedule delays. In particular, nuclear construction projects in the United States have a long history of cost overruns, from the 1950s through to the present day. Accounting for this overrun risk is crucial when characterizing the economic viability of these projects, as construction risk can be equally or more impactful than the base cost estimate in real deployment decisions. Much has changed in the U.S. nuclear industry since the boom years of the 1960s and 1970s, but construction experiences at V. C. Summer in South Carolina and Vogtle in Georgia, as well as the cancelled NuScale Carbon Free Power Project, show that cost escalation is still a major consideration today.
An Energy Information Administration report detailing initially forecasted versus actual construction cost results for U.S. commercial nuclear reactors completed before 1986 provides the total construction cost overrun data shown in Figure 4, denominated in units of real 1982 U.S. dollars (i.e., removing the effects of inflation).2 The values represent overruns on overnight capital costs, or total capital costs to build a reactor without accounting for interest expense. Additionally, these overrun estimates were produced by calculating the delta between the initial cost estimate for the reactor before construction began, and the realized cost at the end of the project construction.
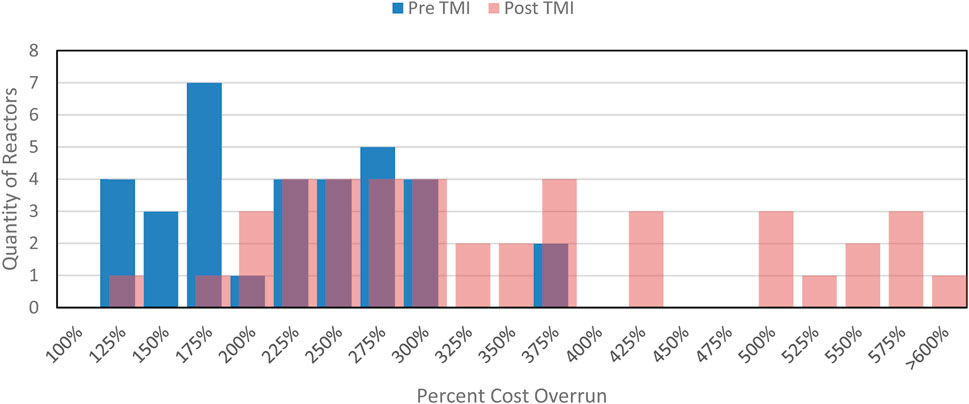
Figure 4. Construction cost overrun distributions for U.S. nuclear reactor units which finished construction pre-Three Mile Island (blue) and post-Three Mile Island (red). Underlying cost data are denominated in real 1982 dollars. Data taken from (EIA, 1986).
The Three Mile Island (TMI) incident looms large in the history of U.S. commercial nuclear reactor. TMI is often cited in nuclear discourse as the cause for nuclear energy’s costly reputation. However, this data shows a very different story: high cost overruns were already endemic to the industry prior to the TMI incident, a fact affirmed by sources from pre-1979 (Bupp and Derian, 1978) and immediately post-TMI (Komanoff, 1981). However, it is certainly clear even from visual inspection that TMI increased the severity of the cost escalation distribution. Some summary statistics for the above data are shown in Table 7. The median and average figures confirm what Figure 4 shows: the post-TMI distribution skews further to the right, and has a much longer right tail, compared to the pre-TMI data.
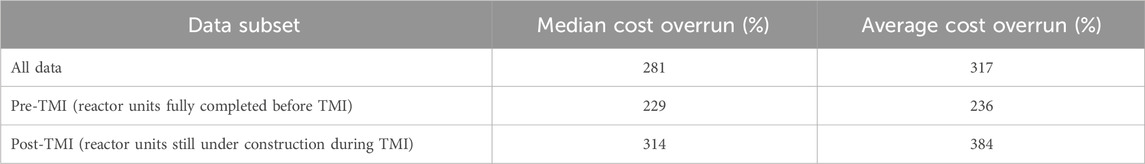
Table 7. Summary statistics for U.S. nuclear cost overruns pre- and post-TMI.
When considering future nuclear construction, it cannot be predicted in advance whether we live in a “pre-TMI-like” world or a “post-TMI-like” world in terms of cost overruns. Under ideal conditions with highly constructable designs and perfectly managed projects, neither of these worlds would be applicable. However, capital-intensive projects must be evaluated not for the ideal case, but for a range of plausible cases including median and worst-case scenarios.
In this study, economic results will be shown without any cost escalation, as well as for the separate pre-TMI and post-TMI cost overrun distributions. These three cases will demonstrate how the economic case for our generic SMR changes when different population distributions of cost overruns are presumed: zero cost overrun, pre-TMI-like cost overrun, and post-TMI-like cost overrun. The individual cases will develop insight into SMR economic viability at those particular distribution parameter assumptions, and collectively they will demonstrate how a reader could expect the results to change under their preferred assumptions about cost escalation risk.
To appropriately model the likelihood of overrun outcomes under these two sampled groups, it was necessary to choose and parameterize appropriate probability distributions for both the pre-TMI and post-TMI samples.
First, the general type of probability distribution was determined. Based on the EIA data, no commercial reactor in the U.S. was ever completed at or less than its initially estimated budget. Extant literature on complex megaprojects (Flyvbjerg, 2014) also confirms that large, technologically complex projects involving multiple major stakeholders are unlikely to ever meet their initial budgets for a variety of reasons. The EIA data also appears strongly single-tailed based on visual and statistical inspection. Therefore, a one-tailed distribution was determined to be most appropriate.
To choose and parameterize a specific one-tailed distribution, the @RISK software add-on for Excel was used. A suite of one-tailed distributions was automatically fit to the samples for the complete dataset as well as the pre-TMI and post-TMI data. @RISK provided full distribution parameterization as well as goodness-of-fit information for all distributions. Based on the Akaike Information Criterion, as well as domain knowledge, the lognormal distribution was chosen to represent all three data subsets.
Figure 5 shows the cumulative distribution function for the fitted lognormal distribution of each data subset. The x-axis shows the cost overrun multiplier (i.e. a multiplier of one means the project’s actual cost is the same as its initial estimated cost).
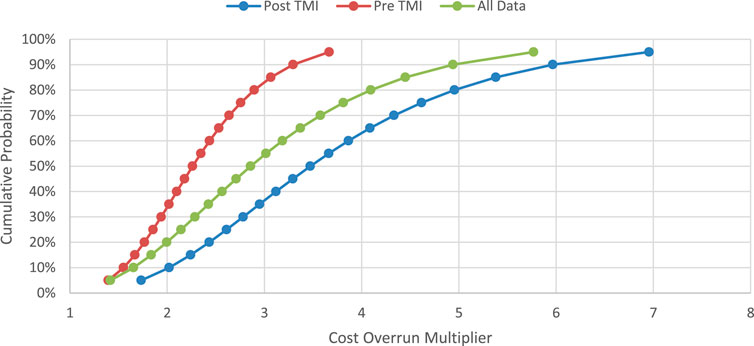
Figure 5. Cumulative distribution functions for historical cost overrun groupings. The x-axis shows the cost overrun multiplier, i.e. a multiplier of one indicates a final cost exactly equal to the initial estimated cost, and a multiplier of two indicates a final cost of double the initial estimated cost.
The longer upward skew of the post-TMI data compared to the pre-TMI data is clearly visible. As previously mentioned, the median pre-TMI overrun multiplier is 2.29, compared to the post-TMI median of 3.14, and the all-data median of 2.81.
As noted above, the owner of a new carbon-free generation source must choose either the PTC or ITC. Subsequently, the question becomes: which of the two will yield a higher return for the company? And how is this decision affected by uncertainties in construction cost?
To answer this, these three scenarios were modeled to compare the expected returns with the election of no tax credit, ITC, and PTC. The analysis was divided between a nominal case where the realized construction cost exactly matches the estimated construction cost, and an uncertainty case where construction cost overruns are modeled in more detail.
Without cost uncertainty in play, the results shown here demonstrate two distinct parametric regions:
1. The “feasible region,” marked in green, where expected NPV is greater than zero; and
2. The “infeasible region,” marked in red, where expected NPV is less than zero.
Generally, projects with characteristics similar to our example reactor, operating in markets similar to our modeled market, might expect to be economically viable if their capital and variable O&M costs place them in the blue feasibility region.
A side-by-side comparison of the three baseline policy scenarios, without construction cost uncertainty, is shown in Figure 6.
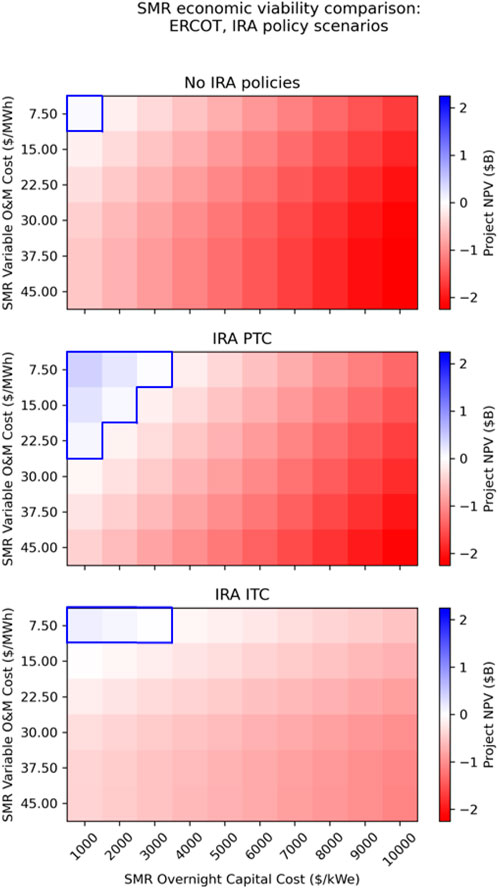
Figure 6. Comparison of SMR economic viability (NPV) in ERCOT under different policy scenarios: no policy, the IRA PTC, and the IRA ITC.
The low prevailing electricity prices in ERCOT make this market an extremely challenging environment for new nuclear power. With no policies in place, a new SMR appears economically viable if and only if its capital cost is around $1,000/kWe and its operating cost is around $7.50/MWh, the absolute lowest-cost pair of values considered in this study. Our finding that SMRs would need to have low capital and operating costs to achieve market competitiveness is consistent with prior literature, such as National Academies (2023). A NOAK SMR may potentially achieve such efficient construction and operation figures in the very long run, but this extremely low-cost regime is likely unachievable for most design concepts.
Electing the PTC expands the feasible region somewhat, allowing capital costs up to $3,000/kWe or operating costs up to $22.50/MWh (though not both at the same time). Electing the ITC allows capital costs up to $3,000/MWh, but operating costs must remain at a very low level, around $7.50/MWh to be viable.
In this extremely low-revenue market, the PTC’s mechanism to offset low revenues appears to be the more effective lever for increasing the viability of new nuclear generation. Although the IRA does not make ERCOT a hospitable place for FOAK nuclear deployments, election of the PTC may make it possible to site later, more cost-efficient plants in this region. As the IRA’s eligibility period sunsets in 2032, achieving NOAK in such a short time frame may be very challenging. However, similar to the federal renewable energy tax credits, it is possible that the IRA eligibility period may be extended past its original end date. In such an extended-IRA scenario, it is possible that the IRA may be sufficient to bring NOAK-like SMRs onto the grid in ERCOT.
Some other characteristics of these parameter spaces are also of interest. First, the “worst case” outcome in the PTC scenario is more severe than the “worst case” outcome in the ITC scenario: in the lower left corner of each panel, the negative NPV accruing to the ITC-electing unit is much less negative than that accruing to the no-policy or PTC units. This indicates that the ITC more effectively limits the financial downside risk of building a new SMR, as it directly offsets the up-front capital costs which are incurred up-front and are therefore most heavily weighted in the NPV calculation.
Second, the ITC feasible region is very “long” in the capital-cost axis and “short” in the operating-cost axis, whereas the PTC feasible region is comparatively longer in the operating-cost axis and shorter in the capital-cost axis. This is a straightforward result of the implementation mechanism of each tax credit: the PTC offsets operating cost, whereas the ITC offsets capital cost. This effect will be much more significant in the ISO-NE discussion, when higher market prices make numerous policy impacts more apparent.
Table 8 shows the regions over which each policy is most NPV-favorable.
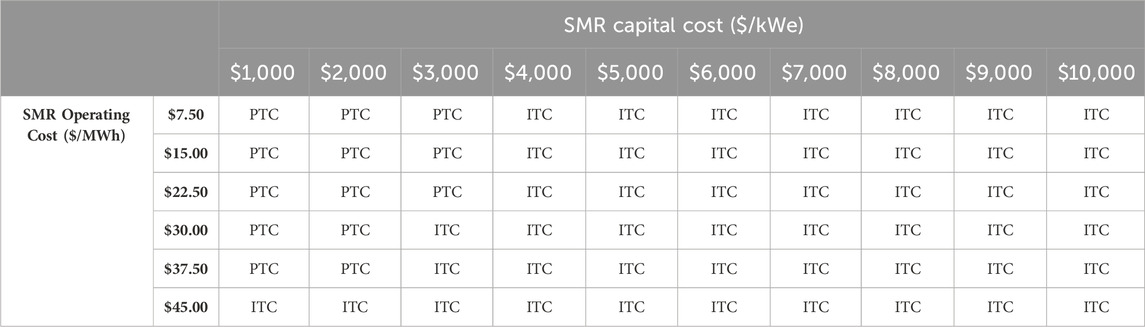
Table 8. Optimal IRA tax credit choice in ERCOT, across the capital and operating cost ranges, without capital cost escalation.
This result reinforces the previous point: the PTC is generally most optimal to offset higher variable O&M costs, whereas the ITC is generally most optimal to offset higher capital costs. The PTC is also broadly most optimal in the high-cost-efficiency upper-left corner of the parameter space.
In summary, for a market with low average prices like ERCOT, the PTC appears to be the more favorable policy mechanism for inducing new SMR capacity additions. However, low prevailing margins (in the absence of modeled severe weather events) indicate that deployable SMRs in ERCOT must still fall within a very small range of capital and operating costs.
The previous results assumed that the capital cost of the reactor came in exactly on budget, with financing costs included but without any cost escalation. As noted previously, significant capital cost escalation during construction was a universal phenomenon during the build-out of the U.S. commercial nuclear fleet, and continues to occur today on projects like the Vogtle expansion and the NuScale Carbon Free Power Project.
This section expands the discussion of the ERCOT SMR economic viability results by quantifying the impacts of capital cost escalation. The metric used for this purpose is the probability of a reversal in economic viability mid-project, as measured by a positive NPV being reduced to or below zero by cost escalation.
For example, in the ERCOT no-policy case, the only cost parameter pair which results in a positive NPV is the $1,000/kWe, $7.50/MWh capital-operating cost cell, as shown in Figure 6. The NPV of this singular viable project is estimated to be just $39M when capital cost escalation is considered. Therefore, using the pre-TMI and post-TMI construction cost escalation distributions, it is possible to estimate the probability of this project’s NPV being reduced below zero by cost escalation. This probability figure will be referred to as the “likelihood of economic reversal”. These results are shown in Table 9.
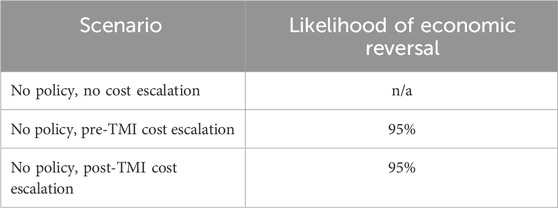
Table 9. Comparison of the likelihood of economic reversal under pre-TMI and post-TMI cost escalation, when no policy support is available for the SMR project.
In both cases, the likelihood of economic reversal is extremely high due to the very slim margins of the project: a positive NPV of only $39M, compared to a total overnight capital cost of $300M. This project would have to achieve construction efficiencies in the best 5% of all historical experience in order to still be providing positive value to the owner by the end of the project.
The no-policy case is the most highly constrained of all cases, with only one parameter pair which results in an economically viable project. The cost escalation question becomes more interesting when the IRA policies are made available to the unit, increasing the overall size of the feasible space (when cost escalation is not considered).
Figure 7, 8 show the likelihood of economic reversal for the SMR when the IRA PTC is elected, under the pre-TMI and post-TMI cost escalation distributions, respectively.
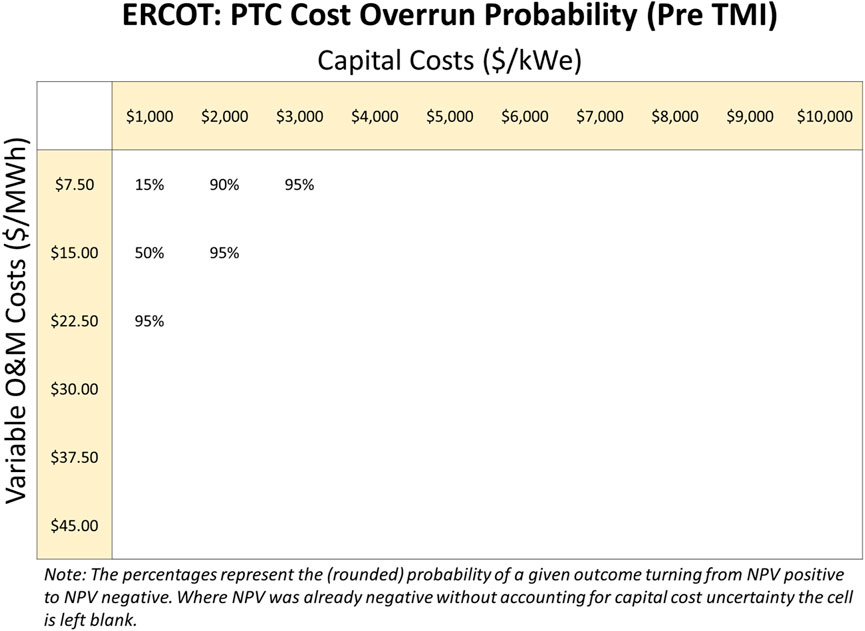
Figure 7. Likelihood of economic reversal in ERCOT under the PTC, with the pre-TMI (less severe) cost escalation distribution, for all cost parameter pairs which show positive NPV without cost escalation.
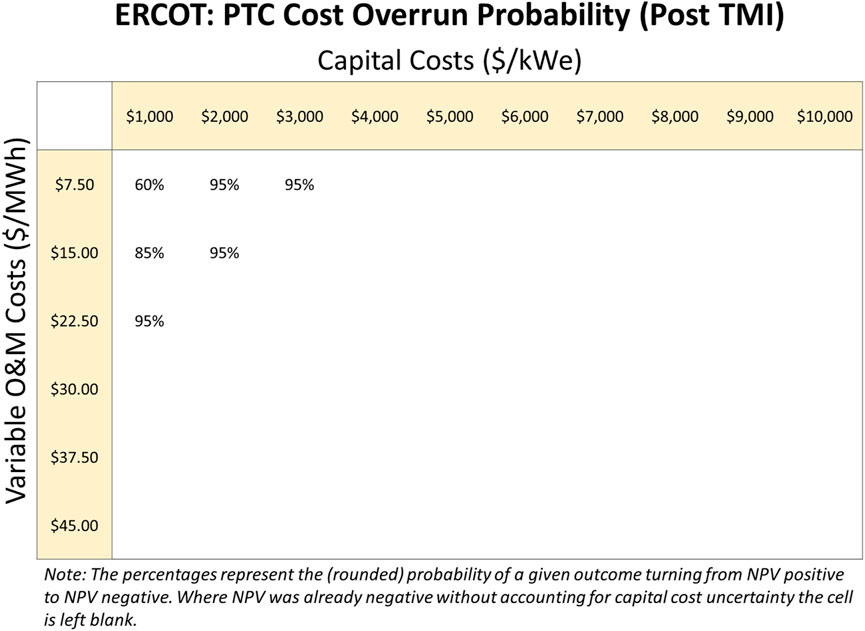
Figure 8. Likelihood of economic reversal in ERCOT under the PTC, with the post-TMI (more severe) cost escalation distribution for all cost parameter pairs which show positive NPV without cost escalation.
The neatly-defined feasibility frontier shown in Figure 6 becomes blurred when capital cost escalation is introduced. The lowest likelihood of economic reversal resides in the lowest-cost region of the parameter space, in the upper left hand corner of both figures.
By comparing the result in the $1,000/kWe, $7.50/MWh cell with the no-policy case, the risk-reduction properties of support policies can be plainly observed. Without any policy support, this SMR project has a 95% likelihood of reversing economic value for its owner by the end of construction. With the PTC in place, this likelihood of economic reversal is reduced to only 15% (pre-TMI distribution) or 60% (post-TMI distribution). A 60% chance that a project will provide net negative value to a firm is still not a favorable business case, but the intervention of the PTC has definitively reduced the risks involved in the project. If the owner believes that their experience with project development and their EPC partners’ expertise places them in the pre-TMI world, the project’s prospects look much more viable.
Under the PTC, the likelihood of economic reversal is more sensitive to increases in capital cost than increases in operating cost. This can be seen by comparing the minimum-cost upper-left cell to its immediate neighbors. Like the overall shapes of the feasibility regions themselves when capital cost escalation is not considered, this lopsided sensitivity is due to the PTC’s action pathway of directly subsidizing higher operating costs.
Overall, when capital cost escalation similar to the U.S. historical experience is considered, the PTC makes a helpful but not definitive contribution to project viability.
The results are similar for the ITC. Figure 9, 10 show the likelihood of economic reversal in ERCOT when the ITC is elected, for the pre-TMI and post-TMI distributions respectively.

Figure 9. Likelihood of economic reversal in ERCOT under the ITC, with the pre-TMI (less severe) cost escalation distribution for all cost parameter pairs which show positive NPV without cost escalation.
Figure 10. Likelihood of economic reversal in ERCOT under the ITC, with the post-TMI (more severe) cost escalation distribution for all cost parameter pairs which show positive NPV without cost escalation.
The overall feasibility region for the ITC is smaller than for the PTC, but similar patterns are observed. Project risk is materially reduced when compared to the no-policy case (15% and 60% likelihood of economic reversal, rather than 95%, for the lowest-possible-cost SMR). The relatively strong sensitivity to capital cost increases for the ITC case is due to the overall lower NPV values obtained under the ITC in ERCOT compared to the PTC. The solid-edged feasibility region estimated from the no-cost-escalation case becomes a strong gradient when cost escalation is applied, as the economic risk is shown to be very sensitive to increases in capital or operating cost.
Finally, the optimal selection matrix for an SMR in ERCOT under capital cost uncertainty is shown in Table 10 (pre-TMI) and Table 11 (post-TMI). In this scenario, the ITC or PTC is selected based on which policy results in the least risky project (i.e. the lowest likelihood of economic reversal).
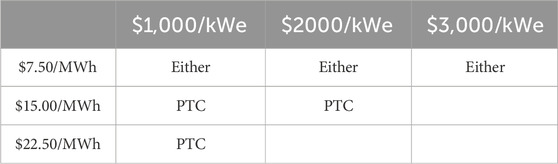
Table 10. Optimal policy selection matrix for ERCOT under capital cost uncertainty (pre-TMI). Empty cells have no viable projects at that cost point.
Table 11. Optimal policy selection matrix for ERCOT under capital cost uncertainty (post-TMI). Empty cells have no viable projects at that cost point.
In ERCOT, the PTC is broadly the best choice when cost escalation is considered. ERCOT’s generally low prices (aside from extreme weather events) mean that revenue remediation appears to be the more effective policy intervention under the assumptions and modeling methods employed in this study. However, the ITC is likely to be more effective in other scenarios, and its usefulness should not be discounted based on these results.
Introducing the risk of cost escalation into the model significantly alters the picture of SMR economic viability in ERCOT. Cost escalation creates a probability that a project will have been a net drain of economic value to the owner company. This probability, termed in this study the “likelihood of economic reversal”, has been computed for the ERCOT policy scenarios based on concrete historical experience of nuclear construction cost overruns in the U.S. The feasibility region observed in the nominal-cost case is no longer so clearly defined, with the gradient across this region demonstrating that projects nearer to its edges have significant chances of economic reversal during construction. The PTC is overall the more powerful buffer under the specific scenario shown here, although the ITC’s usefulness is likely to be more apparent in different scenarios.
Finally, one last sensitivity was assessed to determine how extending the PTC might impact NPV results. It should be noted that while current legislation limits the PTC to only 10 years, it is possible that the credit is extended even further, potentially to reflect the much longer lifetime of nuclear reactors than renewable facilities. Figure 11 highlights the results by showing both the 10-year PTC case alongside an unconstrained PTC period. As one might expect, receiving the PTC for a longer duration results even more favorable NPV outcomes. In this case the profitable cases are extended to even higher capital and O&M cost levels.
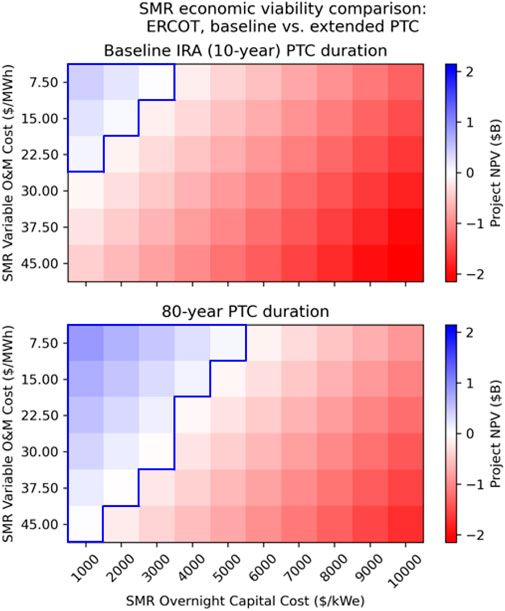
Figure 11. ERCOT NPV sensitivity between 10-year PTC and 80-year PTC duration.
In order to showcase the sensitivity of these NPV results on market conditions such as power price, additional high-level modeling was done using ISO-NE data. This modeling did not leverage A-LEAF to produce capacity and revenue values. Instead, a flat capacity factor on 93% and a historical average for power price was used. ISO-NE has had higher prevailing energy prices in recent years than ERCOT (between 2018 and 2022 the average was $52/MWh). The influence of higher revenues on the economic viability of a potential SMR unit can clearly be seen in Figure 12 where these higher prices are accounted for.
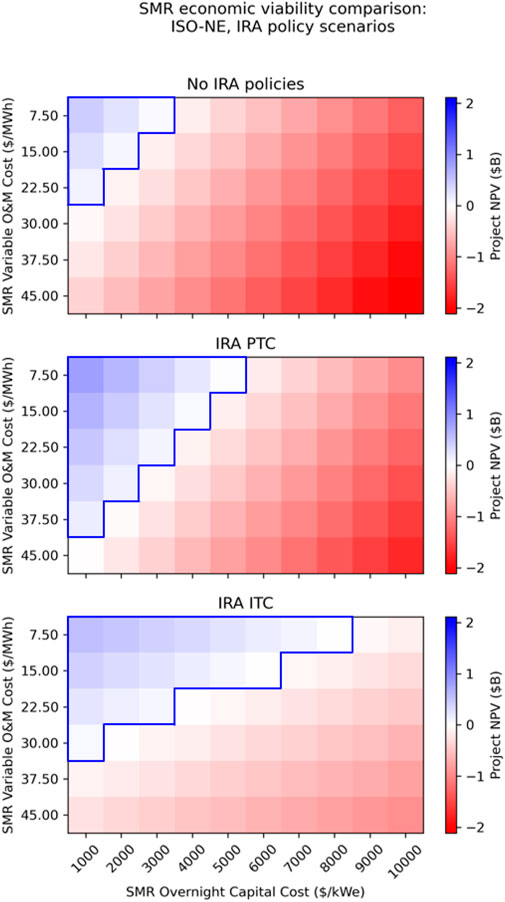
Figure 12. Comparison of SMR economic viability (NPV) in ISO-NE under different policy scenarios: no policy, the IRA PTC, and the IRA ITC.
When compared to the corresponding ERCOT results shown in Figure 6, it is clear that the economic case for a potential SMR in this higher-priced region appears much more favorable. Significantly higher capital and operating costs can be tolerated, due to these increased revenues.
The choice between the ITC and PTC also becomes substantially more interesting in this scenario. As noted previously, the shape of the ITC feasible region is very different to that of the PTC feasible region, due to the differing mechanics of the two policies. The ITC directly offsets higher construction costs, whereas the PTC directly offsets higher operating costs. Both policies have a beneficial impact on projects with higher costs in the “opposite” axis as well, but the most substantial difference is in the cost type they directly subsidize. The ITC allows the feasibility of SMR projects with very high capital costs, so long as operating costs remain low. Likewise, the PTC enables higher-O&M-cost SMR projects to go ahead, so long as capital costs are modest.
Table 12 shows the optimal tax credit election for the entire parameter space, using the modeling parameters for ISO-NE.
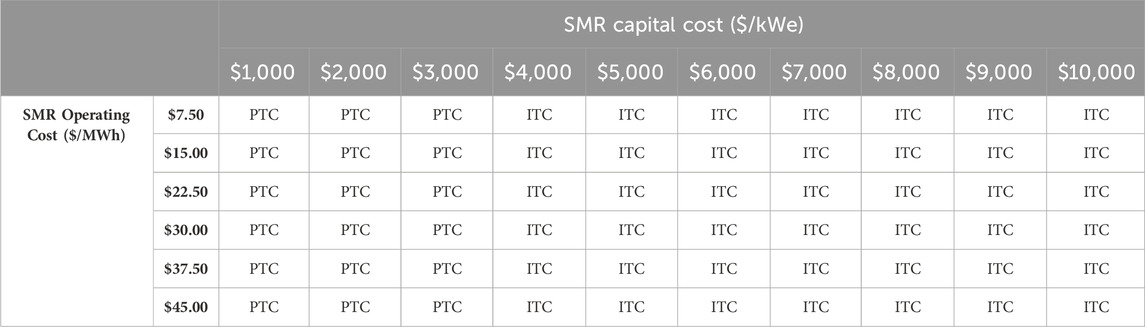
Table 12. Optimal tax credit election for ISO-NE.
These results have important practical implications. If project owners believe that the capital costs of SMRs will be high, then the ITC will be the optimal tax credit to elect, because it directly offsets said costs. If project owners choose a design concept with higher operating costs and lower capital costs (and good confidence in those lower capital costs), then the PTC is the more effective mechanism to choose. As in ERCOT, very cost-efficient SMRs inhabiting the upper left-hand corner of the cost space are better off choosing the PTC, whereas more FOAK-like, higher-capital-cost SMRs are better off choosing the ITC.
Again, a sensitivity on PTC duration was run on the ISO-NE case which resulted in similar outcomes as were observed in the ERCOT case. Figure 13 shows that unconstrained PTC period results in more NPV positive outcomes with higher capital and O&M cost levels.
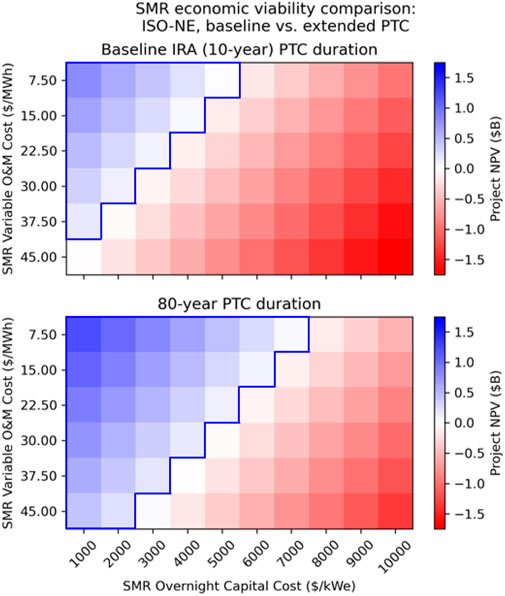
Figure 13. ISO-NE NPV sensitivity between 10-year PTC and 80-year PTC duration.
This analysis demonstrates the significant impacts of the U.S. IRA’s tax credits on SMR economics. It also demonstrates the tradeoffs between the PTC and ITC, which become more complex after accounting for cost uncertainties in nuclear projects. The analysis finds that in ERCOT, the PTC is preferred for SMR capital costs up to $3,000/kW and variable O&M costs up to $22.50/MWh. For capital costs above $3,000/kW, or variable O&M costs above $37.50/MWh at lower capital cost levels, the ITC is preferred. In ISO-NE, which was modeled without A-LEAF, the PTC is preferred for SMR capital costs up to $4,000/kW, and the ITC is preferred for higher capital costs.
Developers may anticipate using one of the tax credits based on cost and capacity factor forecasts, but developers may need to switch to the other tax credit as costs are incurred. In particular, a switch from anticipating using the PTC to actually using the ITC is likely if SMR projects experience cost overruns. The results suggest that SMR projects in the United States are most likely to use the ITC, which becomes more valuable–and more attractive relative to the PTC–with increasing capital costs.
The raw data supporting the conclusion of this article will be made available by the authors, without undue reservation.
LL: Formal Analysis, Funding acquisition, Methodology, Project administration, Validation, Visualization, Writing–original draft, Writing–review and editing, Conceptualization. KB: Formal Analysis, Methodology, Validation, Visualization, Writing–original draft, Writing–review and editing, Conceptualization. NG: Data curation, Writing–original draft, Writing–review and editing, Conceptualization, Methodology. AF: Methodology, Validation, Writing–review and editing, Conceptualization.
The author(s) declare financial support was received for the research, authorship, and/or publication of this article. Funding was provided by Idaho National Laboratory.
Authors LL, NG and AF are employees of the Idaho National Laboratory, managed by Battelle Energy Alliance LLC. Author KB is an employee of the Argonne National Laboratory.
All claims expressed in this article are solely those of the authors and do not necessarily represent those of their affiliated organizations, or those of the publisher, the editors and the reviewers. Any product that may be evaluated in this article, or claim that may be made by its manufacturer, is not guaranteed or endorsed by the publisher.
Neither the U.S. Government, nor any agency thereof, nor any of their employees makes any warranty, express or implied, or assumes any legal liability or responsibility for the accuracy, completeness, or usefulness of any information, apparatus, product, or process disclosed, or represents that its use would not infringe privately owned rights.
This work was supported by Idaho National Laboratory under Department of Energy Idaho Operations Office contract no. DE-AC07-05ID14517. The U.S. Government and the publisher, by accepting the article for publication, acknowledge that the U.S. Government retains a nonexclusive, paid-up, irrevocable, worldwide license to publish or reproduce the published form of this manuscript, or allow others to do so, for U.S. Government purposes.
A-LEAF, Argonne Low-carbon Energy Analysis Framework; DCF, Discounted cash flow; ERCOT, Electric Reliability Council of Texas; FOAK, First-of-a-kind; GHG, Greenhouse gas; IRA, Inflation Reduction Act; ISO-NE, Independent System Operator–New England; ITC, nvestment tax credit; MACRS, Modified Accelerated Cost Recovery System; MWe, Megawatts electric; NOAK, Nth-of-a-kind; NRC, Nuclear Regulatory Commission; O&M, Operating and maintenance; OCC, Overnight capital cost; PTC, Production tax credit; SMR, Small modular reactor; TMI, Three Mile Island; WACC, Weighted average cost of capital.
1As noted in Section 2.5, the WACC has a large impact on NPV results (higher WACC result in lower NPV). WACC varies firm to firm and depends on upon current macro-economic conditions. If the WACC we adjusted to be higher in this case the NPV results would become less positive.
2National Academies (2023) provides construction costs for more recent nuclear projects in the United States and the world. Figure 4 includes only nuclear projects in the United States before 1986 for geographic and methodological consistency.
Abou-Jaoude, A., Lin, L., Bolisetti, C., Worsham, E. K., Larsen, L. M., and Epiney, A. S. (2023). Literature review of advanced reactor cost estimates. INL/RPT-23-72972-Rev000. United States: Idaho National Laboratory. doi:10.2172/1986466
Asuega, A., Limb, B. J., and Quinn, J. C. (2023). Techno-economic analysis of advanced small modular nuclear reactors. Appl. Energy 334, 120669. doi:10.1016/j.apenergy.2023.120669
Bolinger, M. (2009). PTC, ITC, or cash grant? An analysis of the choice facing renewable power projects in the United States. NREL/TP-6A2-45359. Golden, CO (United States): National Renewable Energy Laboratory.
Bryan, H. C., Jesse, K. W., Miller, C. A., and Browning, J. M. (2023). Remote nuclear microreactors: a preliminary economic evaluation of digital twins and centralized offsite control. Front. Nucl. Eng. 2, 1293908. doi:10.3389/fnuen.2023.1293908
EIA (2022). Cost and performance characteristics of new generating technologies, annual energy Outlook 2022. Available at: https://www.eia.gov/outlooks/aeo/assumptions/pdf/table_8.2.pdf.
EIA (2023a). Electricity explained: electricity in the United States. Available at: https://www.eia.gov/energyexplained/electricity/electricity-in-the-us.php.
EIA (2023b). Assumptions to the annual energy Outlook 2023: electricity market module. U.S. Energy Information Administration EIA. Available at: https://www.eia.gov/outlooks/aeo/assumptions/pdf/EMM_Assumptions.pdf.
Energy Innovation Reform Project (EIRP) (2021). What will advanced nuclear power plants cost? Washington, DC, USA: Energy Innovation Reform Project.
Federal Register (2023). Section 6417 elective payment of applicable credits. Fed. Regist. 88, 40528–40558. Available at: https://www.federalregister.gov/documents/2023/06/21/2023-12798/section-6417-elective-payment-of-applicable-credits.
Flyvbjerg, B. (2014). What you should know about megaprojects and why: an overview. Proj. Manag. J. 45 (2), 6–19. doi:10.1002/pmj.21409
Ho, J., Becker, J., Brown, M., Brown, P., Chernyakhovskiy, I., Cohen, S., et al. (2021). Regional energy deployment system (ReEDS) model documentation: version 2020. Available at: https://www.nrel.gov/docs/fy21osti/78195.pdf.
IAEA (2023). International atomic energy agency (IAEA). Available at: https://www.iaea.org/newscenter/news/what-are-small-modular-reactors-smrs#:∼:text=Vargas%2FIAEA),of%20traditional%20nuclear%20power%20reactors.
Institute for Energy Economics and Financial Analysis (2023). Eye-popping new cost estimates released for NuScale small modular reactor. Available at: https://ieefa.org/resources/eye-popping-new-cost-estimates-released-nuscale-small-modular-reactor.
Interagency Working Group on Coal and Power Plant Communities and Economic Revitalization (2023). Energy community tax credit bonus. Available at: https://energycommunities.gov/energy-community-tax-credit-bonus/.
IRS (2023). Publication 5817: elective pay overview. Available at: https://www.irs.gov/pub/irs-pdf/p5817.pdf.
ISO New England (ISO-NE) (2023). 2022 annual markets report. Available at: https://www.iso-ne.com/static-assets/documents/2023/06/2022-annual-markets-report.pdf.
Komanoff, C. (1981). Power plant cost escalation: nuclear and coal capital costs, regulation, and economics. Available at: https://www.komanoff.net/nuclear_power/Power_Plant_Cost_Escalation.pdf.
Lantz, E., Steinberg, D., Mendelsohn, M., Zinaman, O., James, T., Porro, G., et al. (2014). Implications of a PTC extension on US wind deployment (No. NREL/TP-6A20-61663). Golden, CO United States: National Renewable Energy Lab.NREL.
Lloyd, C. A. (2020). Modular manufacture and construction of small nuclear power generation systems (doctoral thesis). Available at: https://www.repository.cam.ac.uk/handle/1810/299868 (Accessed September 15, 2023).
Lloyd, C. A., Roulstone, T., and Lyons, R. E. (2021). Transport, constructability, and economic advantages of SMR modularization. Prog. Nucl. Energy 134, 103672. doi:10.1016/j.pnucene.2021.103672
National Academies of Science, Medicine, and Engineering (National Academies) (2023). Laying the foundation for new and advanced nuclear reactors in the United States. Available at: https://www.nationalacademies.org/our-work/laying-the-foundation-for-new-and-advanced-nuclear-reactors-in-the-united-states.
Nuclear Energy Institute (2023). Nuclear costs in context. Available at: https://www.nei.org/resources/reports-briefs/nuclear-costs-in-context.
Nuclear Innovation Alliance (2023). Implications of inflation reduction Act tax credits for advanced nuclear energy. Available at: https://nuclearinnovationalliance.org/implications-inflation-reduction-act-tax-credits-advanced-nuclear-energy.
NuScale Power (2023). UAMPS and NuScale agree to terminate the carbon-free power project. Available at: https://www.nuscalepower.com/en/news/press-releases/2023/uamps-and-nuscale-power-agree-to-terminate-the-carbon-free-power-project.
Petti, D., Buongiorno, P. J., Corradini, M., and Parsons, J. (2018). The future of nuclear energy in a carbon-constrained world, 272. Massachusetts, USA: Massachusetts Institute of Technology Energy Initiative MITEI.
SMR Start (2021). SMR start economic analysis. Available at: http://smrstart.org/wp-content/uploads/2021/03/SMR-Start-Economic-Analysis-2021-APPROVED-2021-03-22.pdf.
Southern Company (2023). Vogtle cost monitor: 29th semi-annual report. Available at: https://psc.ga.gov/search/facts-document/?documentId=205576.
Steigerwald, B., Weibezahn, J., Slowik, M., and Von Hirschhausen, C. (2023). Uncertainties in estimating production costs of future nuclear technologies: a model-based analysis of small modular reactors. Energy 281, 128204. doi:10.1016/j.energy.2023.128204
Stein, A., Messinger, J., Wang, S., Lloyd, J., McBride, J., Franovich, R., et al. (2022). Advancing nuclear energy: evaluating deployment, investment, and impact in America’s clean energy future. Berkeley, CA, USA: The Breakthrough Institute.
Steinberg, D. C., Brown, M., Wiser, R., Donohoo-Vallett, P., Gagnon, P., Hamilton, A., et al. (2023). Evaluating impacts of the inflation reduction Act and bipartisan infrastructure law on the US power system (No. NREL/TP-6A20-85242). Golden, CO, United States: National Renewable Energy Laboratory NREL.
Stewart, W. R., and Shirvan, K. (2022). Capital cost estimation for advanced nuclear power plants. Renew. Sustain. Energy Rev. 155, 111880. doi:10.1016/j.rser.2021.111880
U.S. Congress (2022). H.R.5376 – inflation reduction Act of 2022. Available at: https://www.congress.gov/bill/117th-congress/house-bill/5376.
U.S. Department of Energy (DOE) (2023). At COP28, countries launch declaration to triple nuclear energy capacity by 2050, recognizing the key role of nuclear energy. Reach. Net. Zero. Available at: https://www.energy.gov/articles/cop28-countries-launch-declaration-triple-nuclear-energy-capacity-2050-recognizing-key.
U.S. Energy Information Administration (EIA) (1986). Analysis of nuclear power plant construction costs. U.S. Energy Information Administration EIA. doi:10.2172/6071600
U.S. Internal Revenue Service (IRS) (2022). How to depreciate property. Available at: https://www.irs.gov/publications/p946.
Vegel, B., and Quinn, J. C. (2017). Economic evaluation of small modular nuclear reactors and the complications of regulatory fee structures. Energy Policy 104, 395–403. doi:10.1016/j.enpol.2017.01.043
Wagner, J. C. (2023). Testimony before the United States senate committee on energy and natural resources. Available at: https://www.energy.senate.gov/services/files/E5C45853-1E1A-4973-BEDE-99D1DCB8CDC4.
White House (2023). Fact sheet: president biden to catalyze global climate action through the major economies forum on energy and climate. Available at: https://www.whitehouse.gov/briefing-room/statements-releases/2023/04/20/fact-sheet-president-biden-to-catalyze-global-climate-action-through-the-major-economies-forum-on-energy-and-climate.
World Nuclear Association (2008). The economics of nuclear power. Available at: https://www.world-nuclear.org/uploadedfiles/org/info/pdf/economicsnp.pdf.
Keywords: SMR, profitability, nuclear energy, cost overrun, Ira
Citation: Larsen LM, Biegel K, Guaita N and Foss A (2024) Effects of the U.S. inflation reduction act on SMR economics. Front. Nucl. Eng. 3:1379414. doi: 10.3389/fnuen.2024.1379414
Received: 31 January 2024; Accepted: 29 March 2024;
Published: 09 May 2024.
Edited by:
Amir Ali, Idaho State University, United StatesReviewed by:
Vivek P Utgikar, University of Idaho, United StatesCopyright © 2024 Larsen, Biegel, Guaita and Foss. This is an open-access article distributed under the terms of the Creative Commons Attribution License (CC BY). The use, distribution or reproduction in other forums is permitted, provided the original author(s) and the copyright owner(s) are credited and that the original publication in this journal is cited, in accordance with accepted academic practice. No use, distribution or reproduction is permitted which does not comply with these terms.
*Correspondence: Levi Morin Larsen, bGV2aS5sYXJzZW5AaW5sLmdvdg==
Disclaimer: All claims expressed in this article are solely those of the authors and do not necessarily represent those of their affiliated organizations, or those of the publisher, the editors and the reviewers. Any product that may be evaluated in this article or claim that may be made by its manufacturer is not guaranteed or endorsed by the publisher.
Research integrity at Frontiers
Learn more about the work of our research integrity team to safeguard the quality of each article we publish.