 Zonglan Wei
 Songwei Li
 Sijia Du
 Yazhe Lu
 Zhifang Qiu
94% of researchers rate our articles as excellent or good
Learn more about the work of our research integrity team to safeguard the quality of each article we publish.
Find out more
ORIGINAL RESEARCH article
Front. Nucl. Eng. , 16 February 2024
Sec. Nuclear Reactor Design
Volume 3 - 2024 | https://doi.org/10.3389/fnuen.2024.1359616
This article is part of the Research Topic Artificial Intelligence in Advanced Nuclear Reactor Design View all 6 articles
This study uses computational fluid dynamics (CFD) to investigate the three-dimensional flow field under normal operating conditions in the reactor pressure vessel (RPV) in the Hualong One nuclear power plants (NPPs). With a particular focus on the flowrate distribution at the core inlet, the numerical framework is validated against the integral hydraulic experiment in a 1:4-scaled RPV of CNP1000, the prototype of the Hualong One reactor. The simulation results of the normalized flowrate at the core inlet agree reasonably well with the measured data. Based on the experimental data, several methods of calibrating the CFD turbulence model coefficients are suggested by introducing the concepts of data assimilation and machine learning. The flow field in a realistic RPV for Hualong One is predicted using the validated numerical framework, showing that the flowrate distribution at the core inlet is nearly homogeneous and that the turbulent intensity is acceptably low for each fuel assembly. It can provide essential information for the reactor core thermal–hydraulic design and the fuel assembly mechanical assessment.
The reactor pressure vessel (RPV) is a key component of a nuclear power plant. Normally, the RPV consists of more than 1000 complex structural parts, including the internal components in the upper and lower plenum and the reactor core with fuel assemblies. Generally, the flow circulation in the RPV is established through the cold legs, downcomer (DC), lower plenum (LP), reactor core, upper plenum (UP), and, eventually, the hot legs. Due to the geometric complexity along the whole circulation path in the RPV and the high velocity of the coolant under normal operation conditions, the coolant flow is highly turbulent with three-dimensional irregularity, which can be characterized by unstable eddies in a broad range of spatial and temporal scales. Nevertheless, some special internal components in the lower plenum are designed to function as flow straighteners to ensure that the flowrate for each fuel assembly at the core inlet is approximately the same. This is because the homogeneous coolant flow distribution at the core inlet is a demanding feature for the reactor’s thermal–hydraulic and mechanical design. Therefore, a comprehensive understanding and accurate predictions of the three-dimensional flow field in the RPV are crucially important.
The Hualong One nuclear power plant (NPP), an internationally recognized type of third-generation NPP, was independently designed and developed by the Nuclear Power Institute of China (NPIC). At the beginning of the Hualong One research and development period, a prototype named CNP1000 was designed. Based on a 1:4-scaled experimental facility of the CNP1000 RPV, integral hydraulic experiments were conducted and the flowrate distribution at the core inlet was measured. The scaled vessel retains the major internal structures in the CNP 1000 RPV. The fuel assemblies in the reactor core are simplified with a bundle of aluminum tubes, the so-called “core simulator,” to attain appropriate hydraulic resistance that does not significantly influence the velocity field in the DC and LP of the vessel. The flowrate in the experimental circuit is determined according to the flow similarity criterion in order to obtain the normalized flowrate distribution at the core inlet under the normal operation conditions of the reactor. The present Hualong One RPV shares overall structural similarity with the CNP1000 RPV, while many local components, especially in the LP, have been optimized. No more integral hydraulic tests are being performed to investigate the flowrate distribution at the core inlet, but, with the aid of computational fluid dynamics (CFD), numerical simulations can be conducted to assess the three-dimensional flow field in the RPV. It has been demonstrated by academic research and industrial practice that, with the properly validated numerical framework, CFD can obtain relatively accurate key flow parameters compared to experimental measurement by consuming less time and resources (Ferziger and Peric, 2001).
Since the 1990s, CFD has become popular in nuclear engineering, and it is used for the quantitative assessment of the flow field in the fuel assembly, turbulent mixing in the LP and UP, pressurized thermal shock on structural components, and hydrogen distribution in the containment. Frepoli (1996) simulated the turbulent flow field in a simplified boiling water reactor using the code FLOW3D. Gango (1997) analyzed the boron dilution process in the LP of the Loviisa NPP, a VVER-440 type, using the code PHOENICS. The No. 43 OECD/CSNI international benchmark was established for numerical code verification based on the rapid boron-dilution transient tests performed by the University of Maryland (Gavrilas and Kiger, 2000). Ten participants from eight countries have submitted their results using various codes, including commercial codes like ANSYS CFX and ANSYS FLUENT and in-house codes like PLASHY and TRIO_U. Most of the numerical results could match the experimental data quite well, implying that CFD codes are capable of predicting the complex flow field in the reactor. In the framework of the FLOMIX-R project (Rohde et al., 2005), many essential nuclear reactor thermal hydraulic safety issues relevant to pressurized water reactor (PWR) NPPs have been systematically investigated by experimental testing and numerical simulations. The experimental facilities include the ROCOM facility, a scaled model of a German KONVOI-type PWR, the VATTENFALL facility, a scaled model of a Westinghouse three-loop PWR, and the EDO Gidropress facility, a scaled model of a VVER-1000 type PWR. There has been much research into the applicability of CFD methods for numerical simulations of the flow field in the reactor (Glover et al., 2007; Höhne et al., 2007; Rohde et al., 2007; Schaffrath et al., 2007). Bieder et al. (2007) predicted the turbulent mixing in the VVER-1000 RPV downcomer using the in-house code TRIO_U developed by CEA. Wei et al. (Zonglan et al., 2022) used OpenFOAM and the URANS methodology to investigate buoyancy-influenced flows in the RPV under main steam line break accident scenarios and showed that the anisotropic turbulent heat flux models can improve the accuracy of the temperature predictions. The outcomes of the numerical assessment studies have demonstrated that CFD is a reliable tool for the analysis of the flow field in the RPV under most conditions. Consequently, CFD is widely used in the design of third-generation NPPs such as AP1000, EPR, and Hualong One.
The present study discusses the numerical framework for the Hualong One RPV three-dimensional flow field simulation with a particular focus on the coolant flowrate distribution at the core inlet.
Based on the three-dimensional geometry of the realistic RPV, the fluid domain was generated after some necessary simplification of the RPV geometry. The sharp chamfers, assembly gaps, and surface holes were simplified because these structures were assumed to be irrelevant to the flow patterns, so ignoring them would significantly improve the quality of the spatial discretization of the fluid domain and the robustness of the simulations.
A particular kind of simplification was applied to the reactor core consisting of hundreds of fuel assemblies. The numerical expense would be extreme if all details in the reactor core were considered in the simulations. Considering that the main focus of the numerical study is the flowrate distribution at the core inlet and that the reactor core locates the concerned position downstream, the major role played by the reactor core in the flowrate distribution at the core inlet was the flow resistance boundary. Therefore, the reactor core could be simplified by a polygonal channel shaped by the core barrel with additional momentum source, matching the same pressure drop in the realistic core.
Eventually, the fluid domain was composed of the main structures of the RPV, including the cold legs, DC, LP with supporting components, lower core plate, and a simplified reactor core region.
The Reynolds-averaged Navier–Stokes (RANS) simulation method is the most popular approach for general CFD simulations for practical industrial turbulent flows. Simulations with RANS are normally fast and computationally inexpensive because only the averaged flow fields are computed by solving the Reynolds-averaged conservation equations, which bring closure to problems for modeling unknown terms such as Reynolds stress appearing in the Reynolds-averaged momentum equation. The Reynolds-averaged governing equations for incompressible flow can be written as Eqs 1, 2:
where
The assumptions for closure of the Reynolds stress
The fluid domain is discretized using tetrahedral cells. The spatial discretization schemes are second-order for the advective terms. The semi-implicit pressure-linked equations (SIMPLE) algorithm is employed together with the algebraic multi-grid method to solve the linear system of the discretized equations.
The fixed volumetric flow rates are imposed at the inlets of each loop, and the adequate length of the CLs ensures that the flow becomes fully turbulent before entering the DC. The no-slip boundary condition is imposed at all the walls for velocity, and the zero-gradient condition is applied for pressure. At the outlet of the core region, uniform fixed relative static pressure is applied, and the zero-gradient boundary condition is used for the other quantities. The directional loss model is particularly used to model the momentum loss in the reactor core region. A certain resistance loss corresponding to the pressure drop in the fuel assemblies is achieved in the streamwise direction in the core region with flow inhibited in the transverse directions, which is regarded as the equivalent resistance boundary downstream from the core inlet.
As the prototype of Hualong One, the CNP1000 RPV shares overall structural similarities with the Hualong One RPV. Based on the CNP1000 RPV, integral hydraulic experiments were conducted in the 1:4 scaled experimental facility (Figure 1). A total of 177 fuel assembly simulators were placed in sequence in the vessel so that the resistant characteristics of the reactor core could be reproduced. Each fuel assembly simulator was equipped with a flowmeter in the inlet section, thus reflecting the flow distribution at the core inlet according to the normalized flowrate measurement of all the fuel assembly simulators. The tests were performed at room temperature and atmospheric pressure. The Reynolds number in the core simulator was ensured at over 1.2 × 10⁵, and the total flowrate in the experimental circuit was determined according to the flow similarity criterion. The flowrate for each fuel assembly simulator was recorded by the embedded flowmeter, and the normalized flowrate is defined as Eq. 3:
where

FIGURE 1. Mock-up RPV of the CNP1000 experiment.
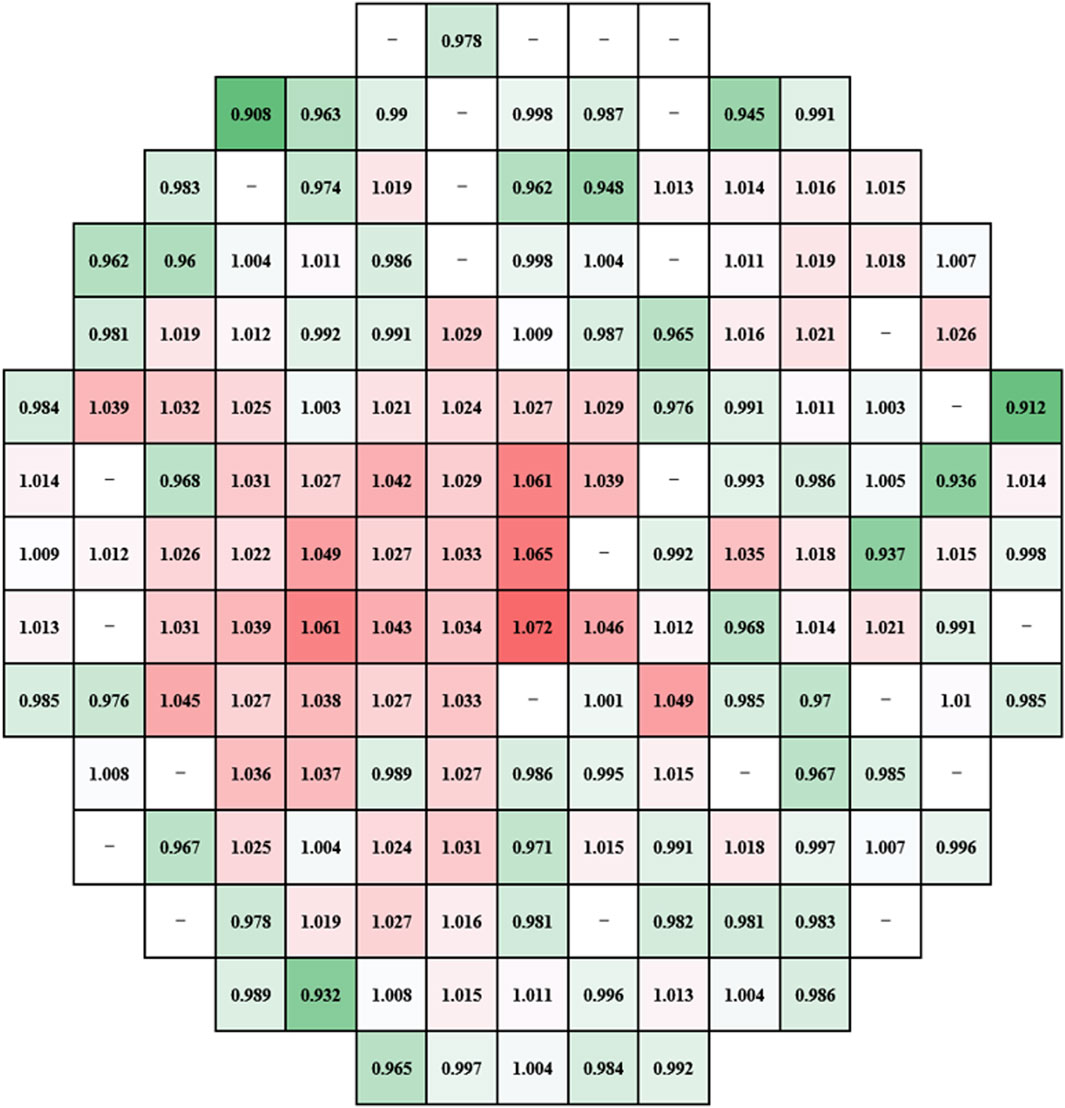
FIGURE 2. Experimental data on the normalized flowrate distribution at the core inlet.
Based on the geometrical simplification and numerical settings discussed in Section 2, the fluid domain for the CFD simulation of the CNP1000 experimental RPV was generated, partially shown in Figures 3 and 4; it is discretized by a fully tetrahedral mesh containing about 20 million cells. The fluid physical properties remain the same as those of the experimental fluid calculated according to the temperature (70 °C) and pressure (1 bar) based on the data from the International Association for the Properties of Water and Steam (IAPWS-97) (IAPWS, 2007).
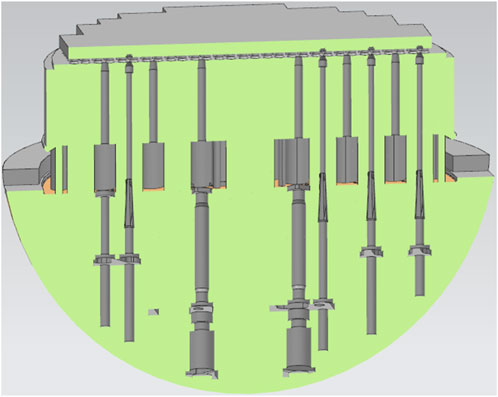
FIGURE 3. Representations of the fluid domain (lower plenum region) in the CNP1000 simulations.

FIGURE 4. Representations of the fluid domain (core region) in the CNP1000 simulations.
The distribution of the normalized flowrate at the core inlet obtained by the simulation is presented in Figure 5. Compared to the experimental results, the general trend of the flowrate distribution is captured well by the numerical simulation. Quantitatively, by defining the point-wise relative error of the flowrate distribution prediction as Eq. 4, the averaged relative error of all the available data was about 3.0%, with the maximal relative error 9.1% and the relative error standard deviation 2.1%. The current numerical framework can, to a certain degree, ensure the accuracy of CFD predictions for the three-dimensional flow field in the RPV and the flowrate distribution at the core inlet.
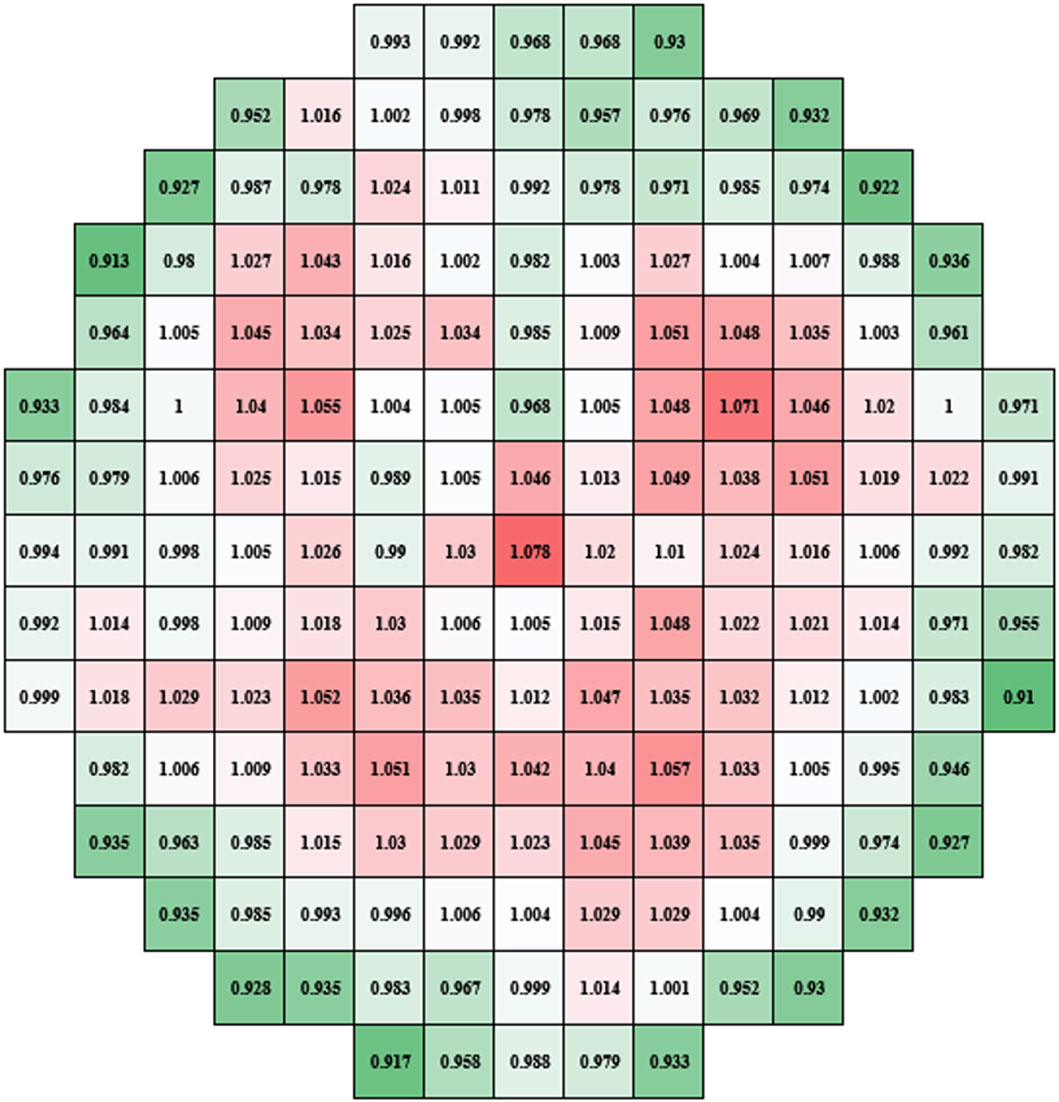
FIGURE 5. Distribution of the normalized flowrate at the core inlet of the CNP1000 simulation.
It is known that the flow patterns of the coolant vary in different regions in the RPV, so it is almost impossible to precisely predict the flow by the CFD simulation with any standard turbulence model. Since the target of the CFD simulation is to obtain the precise distribution of the normalized flowrate at the core inlet based on the experimental results, some methods of coupling with data-driven machine learning technology can be utilized to optimize the turbulent model coefficient and improve the accuracy of the flowrate distribution prediction. For instance, data assimilation (DA) is a useful tool for coupling experimental measurements and numerical simulation so that the uncertainty of CFD simulations can be reduced (Kato and Obayashi, 2012). The assimilation algorithms range from Bayesian inference, ensemble Karman filter (EnKF) to adjoint formulation. For the steady-state flow simulation in the present study, we suggest applying DA for turbulence model coefficient calibration according to the point-wise relative error of the flowrate distribution prediction. It is believed that, with such a physically informed machine learning method, the predictive results with the calibrated model should be consistent with the essential physics.
The present Hualong One RPV shares overall structural similarities with the CNP1000 RPV while many local components, especially in the LP, have been optimized. In order to obtain the flowrate distribution at the core inlet under normal operation conditions in the Hualong One reactor, the validated CFD method with the standard turbulence model in the previous section was applied.
Figure 6 shows the velocity vector profiles in the LP. It can be observed that the local components in the LP exert strong effects on the coolant mixing by creating small eddies when the coolant passes by. Through the lower core plate which acts as a flow straightener, the coolant enters the core with the velocity remaining mostly in a vertical direction.
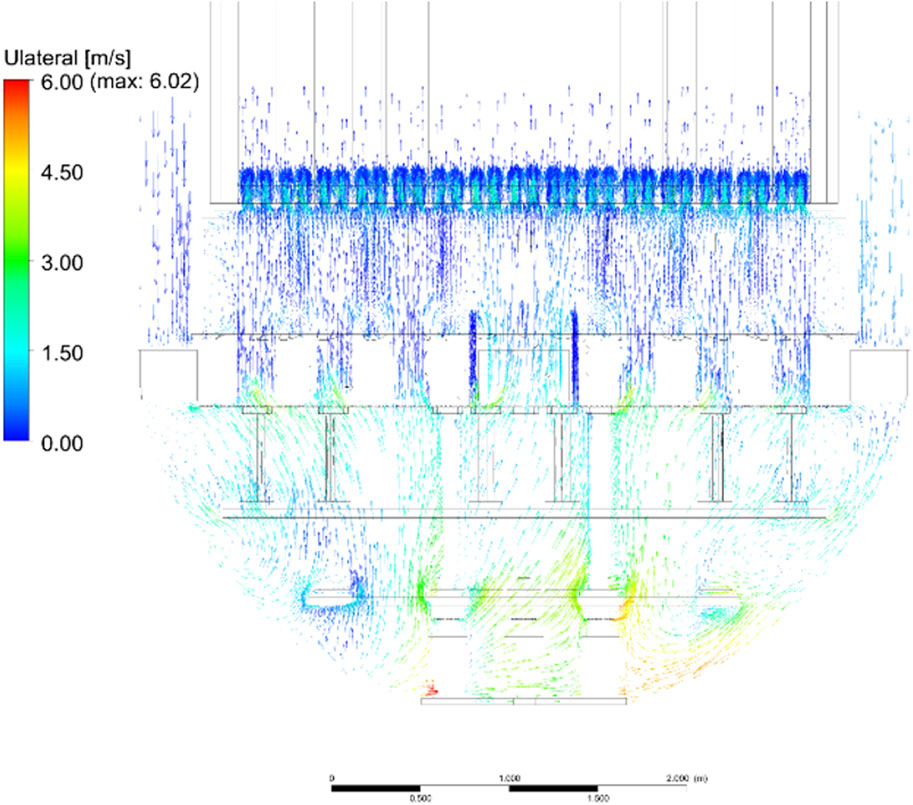
FIGURE 6. Profile of the velocity vectors in the lower plenum.
The normalized flowrate distribution predicted by the CFD simulation is shown in Figure 7. The distribution at the core inlet in Hualong One shows a shape similar to that in CNP1000. The distribution is also homogenous: the highest normalized flowrate (1.10) is at the center of the core inlet and the lowest normalized flowrate (0.90) is in the corner fuel assemblies. The average flowrate of the 5 × 5 assembly bundle in the middle region is about 1.04, and the maximal relative flowrate difference of the neighboring assemblies is lower than 5.5%.
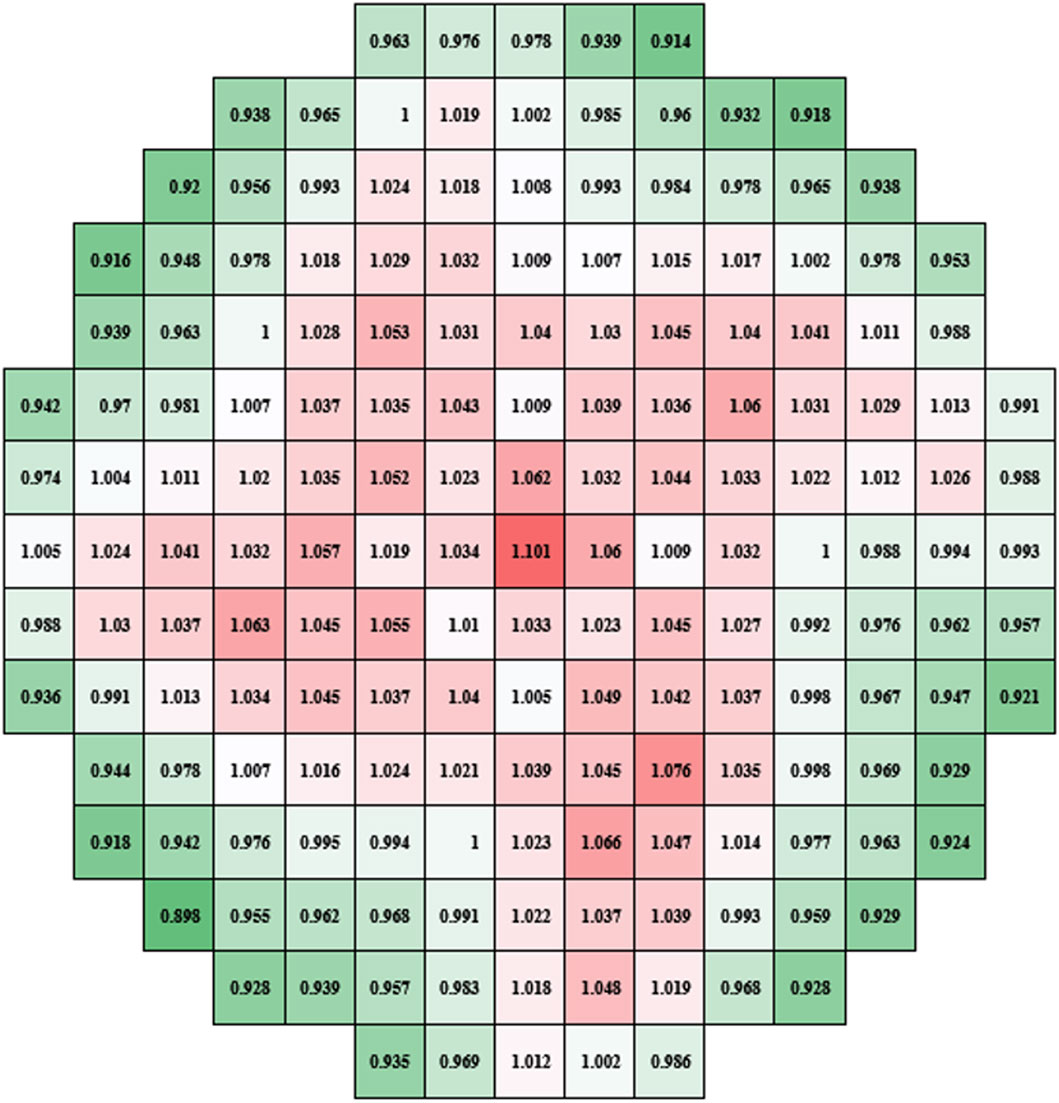
FIGURE 7. Distribution of the normalized flowrate at the core inlet of the Hualong One simulation.
More detailed information about the flow field in the RPV can be extracted from the numerical results. For instance, the average turbulent kinetic energy can be computed for each assembly, and the ratio between the average turbulent kinetic energy and the average velocity can be used to represent the turbulent intensity at the inlet of each fuel assembly. The definition of turbulent intensity is shown as Eq. 5:
where
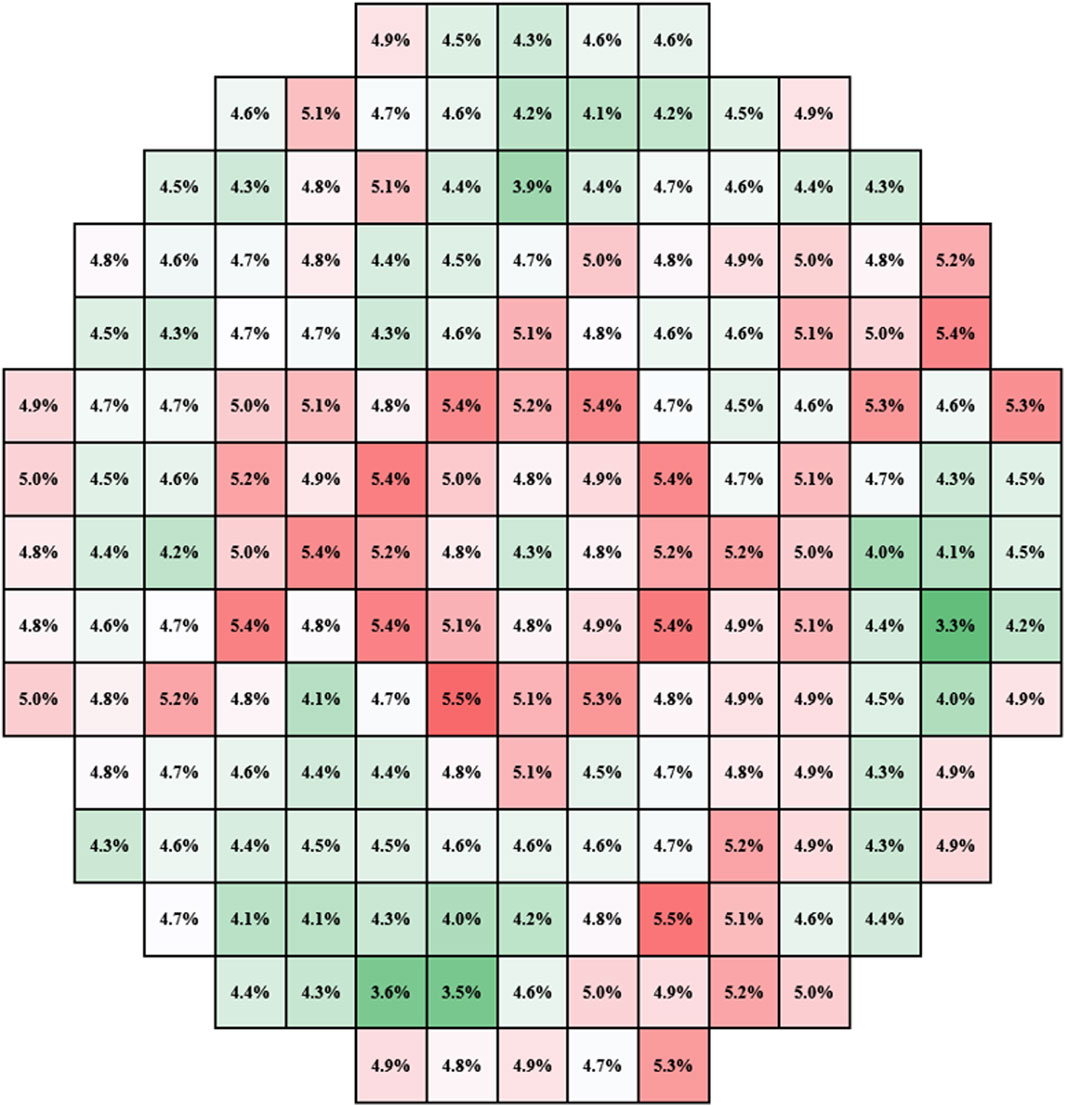
FIGURE 8. Distribution of the turbulent intensity at the core inlet of the Hualong One simulation.
The current study presents the CFD simulation result for a three-dimensional flow field in the Hualong One NPP RPV. The numerical framework is validated against the CNP1000 integral hydraulic experiments in a scaled test facility. The distribution of the normalized flowrate at the core inlet from the Hualong One simulation shows that, at the core inlet, the coolant flowrate is nearly homogenous and the turbulent intensity is acceptably low for each fuel assembly. This can provide essential information for the reactor core thermal–hydraulic design and fuel assembly mechanical assessment.
The raw data supporting the conclusion of this article will be made available by the authors, without undue reservation.
WZ: writing–original draft and writing–review and editing. LS: conceptualization, supervision, and writing–review and editing. DS: validation and writing–review and editing. YL: methodology, validation, and writing–original draft. QZ: methodology, software, and writing–review and editing.
The author(s) declare financial support was received for the research, authorship, and/or publication of this article. The authors gratefully acknowledge the support by the National Nature Science Foundation of China (grant numbers U2241278 and 12275261).
The authors declare that the research was conducted in the absence of any commercial or financial relationships that could be construed as a potential conflict of interest.
All claims expressed in this article are solely those of the authors and do not necessarily represent those of their affiliated organizations or those of the publisher, the editors, and the reviewers. Any product that may be evaluated in this article, or claim that may be made by its manufacturer, is not guaranteed or endorsed by the publisher.
Bieder, U., Fauchet, G., Bétin, S., Kolev, N., and Popov, D. (2007). Simulation of mixing effects in a VVER-1000 reactor. Nucl. Engeering Des. 237, 1718–1728. doi:10.1016/j.nucengdes.2007.02.015
Frepoli, C. (1996). Numerical simulation of the inlet plenum flow field for a LWR reactor pressure vessel. Appl. Math. Model. 253, 20. doi:10.1016/0307-904X(95)00153-B
Gango, P. (1997). Numerical boron mixing studies for Loviisa nuclear power plant. Nucl. Engeering Des. 177, 239–254. doi:10.1016/s0029-5493(97)00197-0
Gavrilas, M., and Kiger, K. (2000). OECD/CSNI ISP Nr. 43 rapid boron-dilution transient tests for code verification. Forschungszentrum Rossendorf, DE: NEA/CSNI/R, 22.
Glover, G. M. C., Höhne, T., Kliem, S., Rohde, U., Weiss, F. P., and Prasser, H. M. (2007). Hydrodynamic phenomena in the downcomer during flow rate transients in the primary circuit of a PWR. Nucl. Engeering Des. 237, 732–748. doi:10.1016/j.nucengdes.2006.08.010
Höhne, T., Kliem, S., Rohde, U., and Weiss, F.-P. (2007). Modeling of a buoyancy-driven flow experiment at the ROCOM test facility using the CFD-Code AFSYS CFX. Kernkraftwerke Deutschl. Betriebsergebnisse 52, 168–147.
Kato, H., and Obayashi, S. (2012). “Statistical approach for determining parameters of a turbulence model”. In Proceding of the 15tg International Conference on Information Fusion.
Launder, B. E., and Sharma, B. I. (1974). Application of the energy-dissipation model of turbulence to the calculation of flow near a spinning disc. Lett. Heat Mass Transf. 1 (2), 131–137. doi:10.1016/0735-1933(74)90024-4
Lien, F. S., Chen, W. L., and Leschziner, M. (1996). “Low-Reynolds-number eddy-viscosity modelling based on non-linear stress-strain/vorticity relations,” in Engineering turbulence modelling and experiments (Oxford: Elsevier), 91–100.
Menter, F. R., Kuntz, M., and Langtry, R. (2003). “Ten years of industrial experience with the SST turbulence model,” in 4th Internal Symposium: turbulence, heat and mass transfer.
Moukalled, F., Mangani, L., and Darwish, M. (2016). The finite volume method in computational fluid Dynamics. Springer.
IAPWS (2007). “Release on the IAPWS industrial formulation 1997 for the thermodynamic properties of water and steam,” in The international association for the properties of water and steam.
Rohde, U., Höhne, T., Kliem, S., Hemstrom, B., Scheuerer, M., Toppila, T., et al. (2007). Fluid mixing and flow distribution in a primary circuit of a nuclear pressurized water reactor—validation of CFD codes. Nucl. Engeering Des. 15. doi:10.1016/j.nucengdes.2007.03.015
Rohde, U., Kliem, S., Höhne, T., Karlsson, R., Hemström, B., Lillington, J., et al. (2005). Fluid mixing and flow distribution in the reactor circuit, measurement data base. Nucl. Engeering Des. 235, 421–443. doi:10.1016/j.nucengdes.2004.08.045
Schaffrath, A., Fischer, K.-C., Hahm, T., and Wussow, S. (2007). Validation of the CFD code fluent by post-test calculation of a density-driven ROCOM experiment. Nucl. Engeering Des. 29. doi:10.1016/j.nucengdes.2007.02.029
Keywords: computational fluid dynamics, reactor pressure vessel, flowrate distribution, data assimilation, turbulence model
Citation: Wei Z, Li S, Du S, Lu Y and Qiu Z (2024) Assessment of the three-dimensional flow field in the reactor pressure vessel in Hualong One nuclear power plants. Front. Nucl. Eng. 3:1359616. doi: 10.3389/fnuen.2024.1359616
Received: 21 December 2023; Accepted: 29 January 2024;
Published: 16 February 2024.
Edited by:
Songbai Cheng, Harbin Engineering University, ChinaCopyright © 2024 Wei, Li, Du, Lu and Qiu. This is an open-access article distributed under the terms of the Creative Commons Attribution License (CC BY). The use, distribution or reproduction in other forums is permitted, provided the original author(s) and the copyright owner(s) are credited and that the original publication in this journal is cited, in accordance with accepted academic practice. No use, distribution or reproduction is permitted which does not comply with these terms.
*Correspondence: Songwei Li, bHN3MDNAcXEuY29t
Disclaimer: All claims expressed in this article are solely those of the authors and do not necessarily represent those of their affiliated organizations, or those of the publisher, the editors and the reviewers. Any product that may be evaluated in this article or claim that may be made by its manufacturer is not guaranteed or endorsed by the publisher.
Research integrity at Frontiers
Learn more about the work of our research integrity team to safeguard the quality of each article we publish.