
95% of researchers rate our articles as excellent or good
Learn more about the work of our research integrity team to safeguard the quality of each article we publish.
Find out more
ORIGINAL RESEARCH article
Front. Nucl. Eng. , 30 November 2023
Sec. Nuclear Materials
Volume 2 - 2023 | https://doi.org/10.3389/fnuen.2023.1295995
This article is part of the Research Topic Applications of Spectroscopy and Chemometrics in Nuclear Materials Analysis View all 8 articles
 Steven H. Crouse1
 Stefani Kocevska1Sean Noble2Rupanjali Prasad1Anthony M. Howe2Dan P. Lambert2Ronald W. Rousseau1
 Martha A. Grover1*
On-line infrared absorbance spectroscopy enables rapid measurement of solution-phase molecular species. Many spectra-to-concentration models exist for spectral data, with some models able to handle overlapping spectral bands and nonlinearities. However, model accuracy is limited by the quality of training data used in model fitting. The process spectra of nuclear waste simulants at the Savannah River Site display incongruity between training and process spectra; the glycolate spectral signature in the training data does not match the glycolate signature in Savannah River National Laboratory process data. A novel blind source separation algorithm is proposed that preprocesses spectral data so that process spectra more closely resemble training spectra, thereby improving model quantification accuracy when unexpected sources of variation appear in process spectra. The novel blind source separation preprocessing algorithm is shown to improve nitrate quantification from an R2 of 0.934 to 0.988 and from 0.267 to 0.978 in two instances analyzing nuclear waste simulants from the Slurry Receipt Adjustment Tank and Slurry Mix Evaporator cycle at the Savannah River Site.
The Savannah River Site, located in Aiken, South Carolina, has been immobilizing nuclear waste since 1996. The site operates the Defense Waste Processing Facility (DWPF), which processes and vitrifies high-level radioactive waste into borosilicate glass (Lambert et al., 2016; 2021; Ray et al., 2018; Lambert and Howe, 2021; Woodham et al., 2021). Approximately 35 million gallons of high-level waste containing insoluble solids of long-lived radionuclides remain to be stabilized. As part of the DWPF, sludge waste from the tank farm and effluent from the Salt Waste Processing Facility undergo feed preparation in the Sludge Receipt and Adjustment Tank (SRAT). From the SRAT, the waste is added to the Slurry Mix Evaporator (SME). The SME represents the primary control point for DWPF processing for a variety of processing factors; it is the last processing point where chemical additions occur to alter batch composition and where batches can be evaluated without disrupting melter operation (Ray et al., 2018). Because of the feed preparation at the SRAT and the qualifying and regulatory measurements made at the SME, implementation of real-time sensors at these vessels could improve decision-making for waste processing.
During SRAT processing, nitric acid and glycolic acid are fed to the current waste batch in accordance with the nitric-glycolic acid flowsheet (Lambert et al., 2016; Woodham et al., 2021) to neutralize the alkaline sludge waste and reduce mercury (HgO → Hg0) for recovery. The system begins with a caustic solution phase (pH 13), which becomes acidic (pH 4) as nitric acid and glycolic acid are introduced. The next batch process occurs in the Slurry Mix Evaporator (SME), where water is evaporated to concentrate the waste, and frit (glass formers) is added to create the feed supplied to the melter. The species’ concentrations change during the process due to ongoing reactions, such as mercury reduction and nitrite conversion to nitrate (Woodham et al., 2021). The waste also has high solids content, which reaches 25 wt% in the SRAT and 50 wt% in the SME (reported as total solids at 110°C) (Woodham et al., 2021). Furthermore, during batch processing, the heels from previous batches are incorporated into successive batches, which results in deviations of batch compositions from feed streams.
In this work, chemical constituents are classified by whether they are quantified by the spectra-to-concentration model. Targets are quantified species, while non-targets are not quantified despite possibly existing in solution. Species may be labeled non-targets because they are: at insignificant concentrations, not relevant for processing, or difficult to quantify because of model and data mismatch. The presence of non-target species can disrupt the quantification of target species, particularly if non-target species are not considered during model fitting. To deal with overlapping non-target species, a blind source separation (BSS) algorithm is proposed. The first and second steps of the BSS algorithm use classical least squares (CLS) followed by principal component analysis (PCA) to identify spectral estimates from mixture spectra. The third and final step of the algorithm uses multivariate curve resolution—alternating least squares (MCR-ALS) to iterate the estimates from the first two steps and any available reference spectra into a bilinear mixture model that matches available process spectra. The proposed BSS algorithm improves the estimation of target species by removing non-target contributions from mixture spectra. In this work, the BSS algorithm removes non-targets given only reference spectra of the target species, nitrate and nitrite, and a poor reference spectrum (a reference spectrum that does not match the shape of the component’s spectrum at process conditions) of the most abundant non-target species, glycolate.
The proposed BSS algorithm improves upon similar algorithms by introducing the CLS and PCA steps to identify spectral estimates that are input into MCR-ALS. In the context of process monitoring, the proposed BSS algorithm may reduce the number and frequency of calibration experiments required for spectroscopic monitoring without compromising accuracy, since non-targets may be omitted from training data. In addition, BSS-preprocessing could facilitate real-time results in scenarios where decision-making is time-sensitive, but process spectra deviate from training data due to unforeseen process conditions, ordinarily requiring additional calibration experiments and corresponding process down-time.
In this paper, Attenuated total reflectance - Fourier transform infrared spectroscopy (ATR-FTIR) is used to analyze anions in the SRAT and SME processes. A novel BSS algorithm is developed to preprocess spectral data by removing the influence of non-target species. To test the proposed algorithm, partial least squares regression (PLSR) prediction accuracy is compared for BSS-preprocessed spectra and spectra with no BSS-preprocessing applied. Lastly, the utility of ATR-FTIR measurements for real-time monitoring is demonstrated in the context of nuclear waste slurries at the Savannah River Site by quantifying a continuous 65-h run of scaled-down SRAT and SME processes.
A simplified process flowsheet for the DWPF is shown in Figure 1. The physical and chemical composition of a representative sludge simulant (i.e., the SRAT feed) is shown in Table 1, while the composition of the final processing points (i.e., the SRAT and SME product slurries) are shown in Table 2. The SRAT feed undergoes chemical preparation (acid addition) in the SRAT before receiving glass frit additions and dewatering at the SME. Nitrate (N
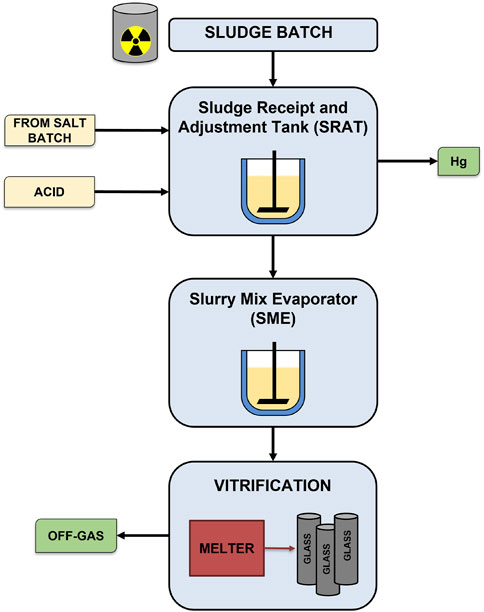
FIGURE 1. Simplified flowsheet for Defense Waste Processing Facility (DWPF) (Ray et al., 2018).
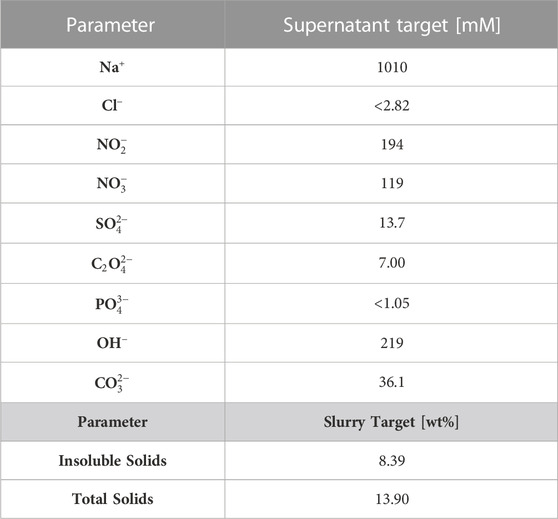
TABLE 1. Simulant SRAT feed composition (i.e., expected process input), corresponding to nonradioactive simulated Tank 40–8 measured by Woodham et al. (2021). The wt% total solids (TS) represents the solids that do not dissolve after heating to 110°C, while the wt% insoluble solids (IS) represents the difference between the measured total solids and dissolved solids.
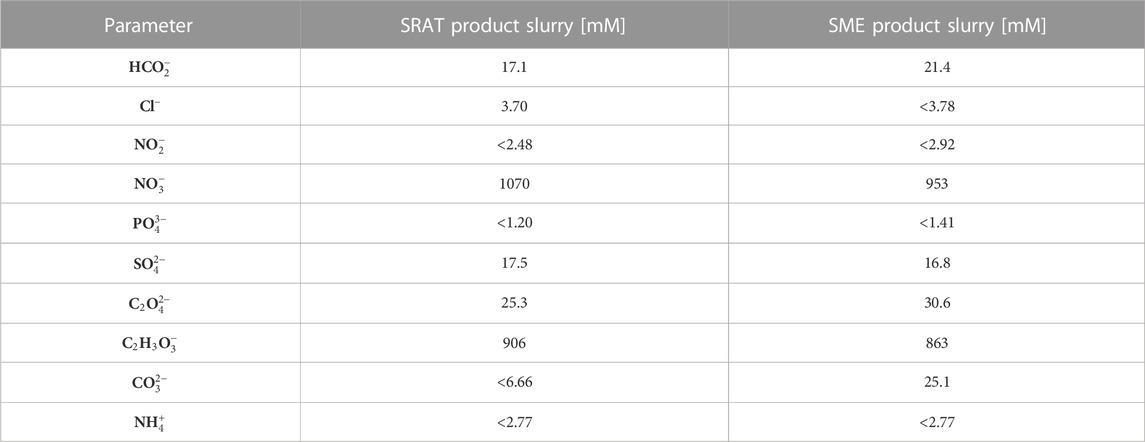
TABLE 2. Simulant SRAT product and SME product concentrations (i.e., expected midpoint and process output, respectively) corresponding to nonradiaoctive simulated Tank 40–8 SRAT/SME product slurries reported by Woodham et al. (2021).
Nonradioactive experiments mimicking the DWPF SRAT and SME cycles were performed in a 2-L Mettler Toledo Reaction Calorimeter (RC1) vessel equipped with temperature, pH, and ATR-FTIR probes. Due to the high solids content, the sludge waste was probed with in-situ ATR-FTIR spectroscopy, which was able to measure infrared-active molecules in the solution phase without interference from solid particles because of a shallow laser penetration depth of 2–3 μm (Cornel et al., 2008). ATR-FTIR measured concentrations were compared to IC measured concentrations collected by the Savannah River National Laboratory Process Science Analytical Laboratory. Before IC measurement, samples were caustic quenched by addition of 50% NaOH, which has been reported to increase the accuracy of ion measurements via IC (White et al., 2015). Samples were taken from the SRAT/SME cycles at different processing points in two separate experiments, referred to as Run 1 and Run 2. Run 1 process data correspond to five IC measurements from a SRAT/SME experiment (Supplementary Table S1) with corresponding ATR-FTIR spectra. Run 2 process data correspond to three IC measurements from a SRAT/SME experiment (Supplementary Table S2), also with corresponding ATR-FTIR data. Run 2 has an additional 3899 spectra (collected every minute over the course of 65 h) that do not have associated IC measurements; the spectra will be used to show real-time changes in the SRAT and SME processes. The RC1 vessel was used to collect spectral data for model training (eight experiments shown in Supplementary Table S3), which were designed to match reported anion concentrations in the SRAT/SME sludge simulant (Table 1) and SRAT/SME product (Table 2) for the most abundant anions: nitrate, nitrite, and glycolate. Training data were collected using sodium salts without controlling pH, so training data pHs are basic.
Blind source separation refers to techniques that infer original or source signals solely from measurements of signal mixtures (Naik and Wang, 2014). In the context of spectroscopy and this work, blind source separation can be used to estimate and remove the pure sources that make up a signal mixture, even when those sources are unknown. Blind source separation has been shown by Maggioni et al., 2019; Kocevska et al., 2021. to be effective in preprocessing spectra to remove non-target species from Raman and ATR-FTIR spectra in nuclear waste simulants. Kocevska’s BSS algorithm incorporated available process information by augmenting mixture data to include known reference spectra, thereby guiding the identification of sources by independent component analysis (ICA) and MCR-ALS. The proposed algorithm of this work, in contrast, does not require algorithmic identification of known sources; known species are constrained to match user-supplied references, while unknown species are found in a “blind” manner similar to Maggioni’s and Kocevska’s BSS algorithms. The new preprocessing structure allows for available reference spectra to be directly incorporated into a BSS algorithm without estimating them algorithmically. In Kocevska’s and Maggioni’s works, sources identified with ICA and MCR-ALS, even well-known species, are limited in quality by the accuracy of the BSS algorithm; found sources may not always match user-supplied references. A quantitative comparison of BSS methods can be found in Supplementary Figures S1, S2, and in Supplementary Table S4. The proposed algorithm gives the user control over which components are modified and subtracted by the blind source separation algorithm, while still identifying and subtracting unknown species that may arise in real-time due to changing process conditions. In the context of nuclear waste monitoring, such an algorithm could facilitate real-time spectral preprocessing that utilizes available references for target species, while allowing for continual removal of non-target species that may appear or change throughout processing.
The proposed algorithm uses a combined CLS and principal component analysis (PCA) step, rather than ICA as reported previously (Maggioni et al., 2019; Kocevska et al., 2021), to provide initial guesses for MCR-ALS with a nonnegativity constraint. Deviation from a linear combination of known sources (the error matrix from CLS fitting) is used to identify sources in the mixture spectra that do not correspond to known species. Applying PCA to the CLS error matrix to identify unknown sources from mixture spectra has been reported by Haaland and Melgaard, who referred to this technique as spectral residual augmented classical least squares (SRACLS) (Haaland and Melgaard, 2000; Haaland and Melgaard, 2002). Their method improved the prediction accuracy and robustness of CLS by identifying sources of variation not present in their training data. In this work, the residuals of the CLS model fit are analyzed by PCA and then supplied to MCR-ALS to provide a bilinear model for source subtraction. The methodological pipeline is shown in Figure 2.
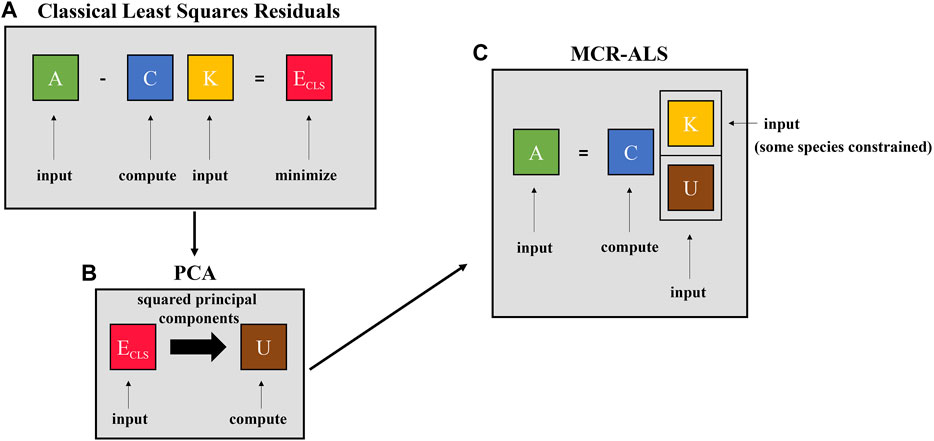
FIGURE 2. Methodological pipeline for the proposed BSS algorithm in three steps: (A) calculate residuals of classical least squares where mixture spectra (A) and reference spectra (K) are used to find the concentration matrix (C) that minimizes (in the least-squares sense) the residual matrix (ECLS), which provides an estimate of species that do not have known reference spectra, (B) perform principal component analysis on the residual matrix (ECLS) and extract the (elementwise) squared principal components (U), and (C) perform multivariate curve resolution - alternating least squares using known reference spectra (K) and estimates of unknown sources from principal component analysis (U) to identify a physically realistic mixture model that matches the mixture spectra. After the mixture model is identified, source subtraction can be done as is shown in Eq. 9.
As shown in Figure 2A, the first step of the BSS algorithm is the well-established CLS relationship (Eq. 1), which is used to model mixture spectra with all known reference spectra (targets and non-targets) so that any additional species present can be identified from CLS model error. Model error, in general, accounts for both measurement noise and model mis-match. In the application of spectroscopy, one cause of model mis-match is the presence of unknown species. Minimizing error, ECLS, in the least squares sense and solving for concentrations, C, is shown in Eq. 2 (Melgaard et al., 2002). The least-squares solution can be found by setting ECLS = 0 and solving for the concentration matrix, C. Model error can then be solved for in terms of target references, K, and process spectra, A, by rearranging Eq. 1 and inserting Eq. 2, yielding Eq. 3:
where A is an n × q matrix of mixture spectra, C is an n × p concentration matrix of pure components, K is an p × q matrix of pure component reference spectra of the target species, and ECLS is an n × q matrix representing noise and error that is not modeled with linear combinations of the known reference spectra. In this work, there are n experimental observations, q is the dimension of the spectra (reported wavenumbers), and p is the number of sources for which references exist.
The second step of the proposed BSS algorithm, shown in Figure 2B, applies PCA to the residuals from the error matrix of CLS fitting, ECLS. PCA reduces the dimensionality of data by projecting the data onto a space of reduced dimension while maximizing the variance in the projected data (Bishop, 2006; Brunton and Kutz, 2022). PCA assumes that the data have been mean-centered, meaning that the data have been mean-centered by subtracting the mean row,
where vi is the ith eigenvector (ith principal component) corresponding to λi, the ith eigenvalue. In the context of the present BSS algorithm, the largest r eigenvalues are retained in addition to the corresponding eigenvectors/principal components, where r is the number of expected sources beyond to the p known references. The principal components from PCA, rather than loadings as used by Haaland and Melgaard, are used in this work (Haaland and Melgaard, 2002). Principal components have unit scaling, whereas loadings do not, and so principal components were chosen as “standardized” initial guesses for the subsequent MCR-ALS algorithm. The principal components, once computed, are squared so that the spectra are nonnegative for MCR-ALS (step three). This process is shown in Eq. 6, where the elements of each principal component are squared (◦2 represents the elementwise square or Hadamard power of a matrix). This follows the methodology of Maggioni’s two-step BSS algorithm that squares independent components from ICA (which may also have negative components) before inputting into MCR-ALS, which has a nonnegativity constraint applied (Maggioni et al., 2019).
The third step of the BSS algorithm, shown in Figure 2C, uses the known references and estimated unknown sources from PCA as source estimates for MCR-ALS. MCR-ALS is a bilinear model that decomposes mixture spectra into a concentration matrix, C, and a reference spectra matrix, ST, as is shown in Eq. 7 (Tauler et al., 1993; Tauler, 1995; Jaumot et al., 2015). In Figure 2C, the reference spectra are divided into known references (K) and estimated references (U) that are the squared principal components from the PCA step.
For MCR-ALS, initial guesses can be supplied for either C or ST. In this work, reference spectra (ST) are supplied which MCR-ALS iterates to match the process spectra. MCR-ALS is calculated with a nonnegativity constraint in this work to eliminate negative or physically unrealistic spectra. The initial guess for spectra,
The MCR-ALS algorithm produces a model that is capable of decomposing the process spectra into estimated source spectra. Subsequently, the sources corresponding to non-targets are subtracted. In this work, glycolate is a non-target species and is subtracted, along with any other detected sources. Water, while not a target, is the solvent and not subtracted in this work since it does not contribute significant spectral variation between measurements. Eq. 9 shows the subtraction of non-target sources using the model produced by MCR-ALS.
After source subtraction, the resulting preprocessed data can be robust to infrared-active species outside of the training dataset and spectral changes that occur in complex mixtures. Process implementation of BSS preprocessing can enable more accurate quantification of target analytes. However, concurrently operating fault detection algorithms should, in general, utilize unaltered spectra, since the BSS preprocessing discussed in this work may mask equipment failures or significant spectral changes that may be valuable for detecting sensor or process faults.
PLSR with four latent variables is used to quantify all of the spectra in this work, and is performed after BSS-preprocessing described in Section 2.3. PLSR has been well-reported in its ability to quantify complex mixture spectra with overlapping spectral bands, particularly when monitoring nuclear waste solutions with vibrational spectroscopy. Recent work in the nuclear field has applied PLSR to: locally linear regimes using piecewise PLSR with absorbance spectroscopy (Lascola et al., 2017), multiple species in real Hanford waste using Raman spectroscopy (Tse et al., 2021), and sodium salt solutions with a limited training set using ATR-FTIR and Raman spectroscopy (Kocevska et al., 2021). Since concentration is restricted to nonnegative values, a nonnegativity constraint is applied to all PLSR results for physical accuracy. Prior to being input into PLSR models but following BSS-preprocessing from Section 2.3, all spectra are filtered with the Savitzky-Golay method utilizing seven filter points, a second order polynomial, and a first order derivative. Spectra and concentrations are standard scaled by mean-subtraction and scaling to unit variance immediately prior to PLSR quantification.
Python 3.9 was used for all computation and data analysis in this work, with the code and experimental dataset from this work published on GitHub. The scikit-learn implementations of PLSR, PCA, and FastICA were used, while SciPy was used for Savitzky-Golay Filtering. The NIST package, pyMCR, was used to perform MCR-ALS (Camp, 2019).
ATR-FTIR reference spectra of measurable solution analytes are shown in Section 3.1. The ATR-FTIR spectrum of glycolate
ATR-FTIR reference spectra were collected to determine spectral signatures of possible analytes in the SRAT and SME vessels. While nitrate and nitrite represent the target species for the slurry, the slurry may include additional anions at low concentrations (see Tables 1, 2). Reference data for all known IR-active species at approximate SRAT/SME concentrations are shown in Figure 3 with reference spectra concentrations listed in Table 3. The target species are highly IR-active, while some of the non-target species (such as oxalate and formate) have weak IR signals at process-relevant concentrations. Since the non-target species, excluding glycolate, are not present at high concentrations in the waste, it is possible that they do not significantly interfere with the signals of the targets. The peaks of non-target species (shown in Figure 3B) other than glycolate were not included as references in the BSS algorithm. Carbonate and sulfate are 2.58 and 2.70 times more concentrated in the references of Figure 3B than in the typical feed to the SRAT (Table 1). Carbonate, sulfate, and other non-targets were not reliably observed in the mixture spectra, and so the BSS algorithm is tasked with identifying these species if they are significantly present in the solution.
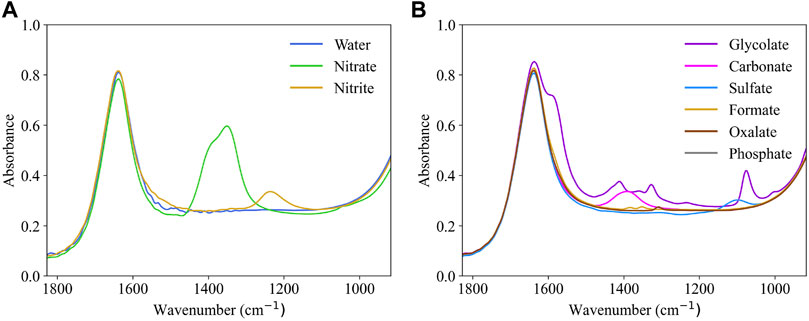
FIGURE 3. Reference spectra of aqueous (A) target anions (including water) and (B) non-target anions found in the DWPF waste during the SRAT and SME processes collected at 25°C. Corresponding concentrations are listed in Table 3.
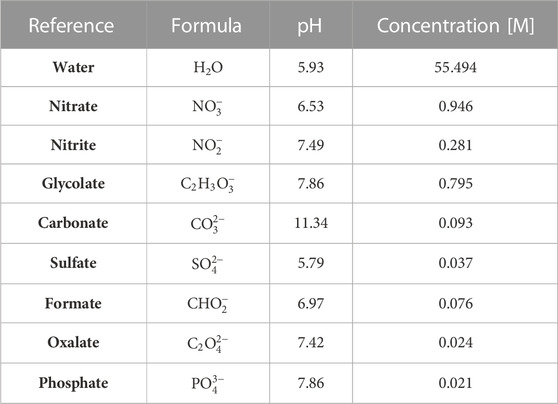
TABLE 3. Concentrations of reference spectra shown in Figure 3, representative of expected process concentrations from Tables 1, 2. Collected at 25°C and pH-calibrated at 22°C.
Processing variables can affect ATR-FTIR signals, which affects both interpretation and reliability of signal-to-composition models. Processing variables of interest for the SRAT/SME process include temperature and pH. Temperature starts at room temperature (approximately 25°C) but is near-boiling (approximately 93°C) for much of the process. Likewise, pH begins at 13 and drops to 4 through acid addition. In this section, variations in spectra with processing parameters will be discussed to determine what nonlinearities, if any, are present in the ATR-FTIR spectra of the SRAT and SME processes.
Low-temperature (25°C) and high-temperature (80°C–93°C) 1 M reference spectra of nitrate (N
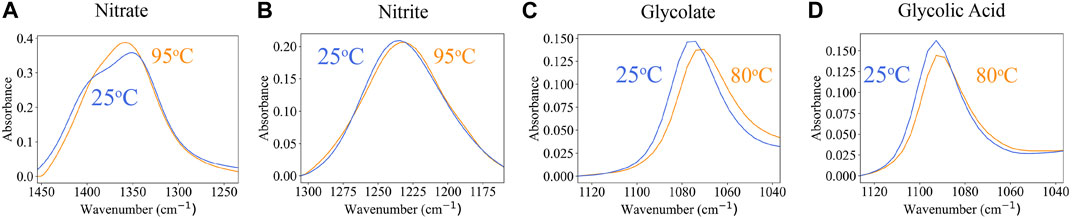
FIGURE 4. Comparison of 1 M ATR-FTIR absorbance spectra at low and high temperatures for (A) nitrate (N
The feed stream to the SRAT typically has a pH of 13, which decreases to a pH around 4 after the addition of both nitric acid and glycolic acid. This pH shift affects the speciation of weak acids, such as glycolic acid, in the solution phase. Glycolate begins SRAT processing in a deprotonated form, due to the high solution pH, and shifts to a protonated form as the solution pH decreases. Glycolate speciation, shown in Figures 5A, is calculated by using the pKa of glycolic acid and Eq. 10. Based on values available in the literature, a pKa value of 3.83 for glycolic acid at 25°C is used (Serjeant and Dempsey, 1979).
The ATR-FTIR spectra of glycolate, after the spectra of water have been subtracted, are shown as a function of pH in Figure 5B. As can be seen from the magnified region in Figure 5B, the glycolate peak matches the peak seen in the training data at high pH. As pH is lowered, another peak appears on the higher-wavenumber side of the high pH glycolate peak while the original peak decreases. The result is a 15 cm−1 shift in the 1078 cm−1 glycolate peak to 1093 cm−1. The acidic form of nitrite (N
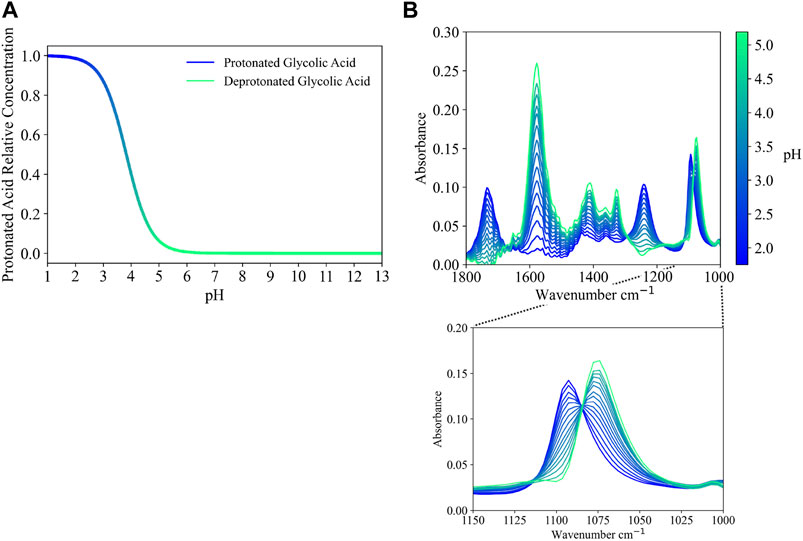
FIGURE 5. (A) Protonation of glycolic acid calculated as a function of pH using a pKa of 3.83 (Serjeant and Dempsey, 1979) and (B) reference spectra (water subtracted) for glycolate at 25°C as a function of pH.
Since the key measurements during DWPF processing occur at a constant temperature of 93°C, the training data for the system were collected at 93°C and are shown in Figure 6A. Approximate pH data are shown in Supplementary Tables S1–S3 in the Supplementary Information. The process data, shown in Figure 6B (Run 1) and 6c (Run 2), were sampled during runs of the SRAT/SME cycle. The spectra baseline and the shape of the glycolate
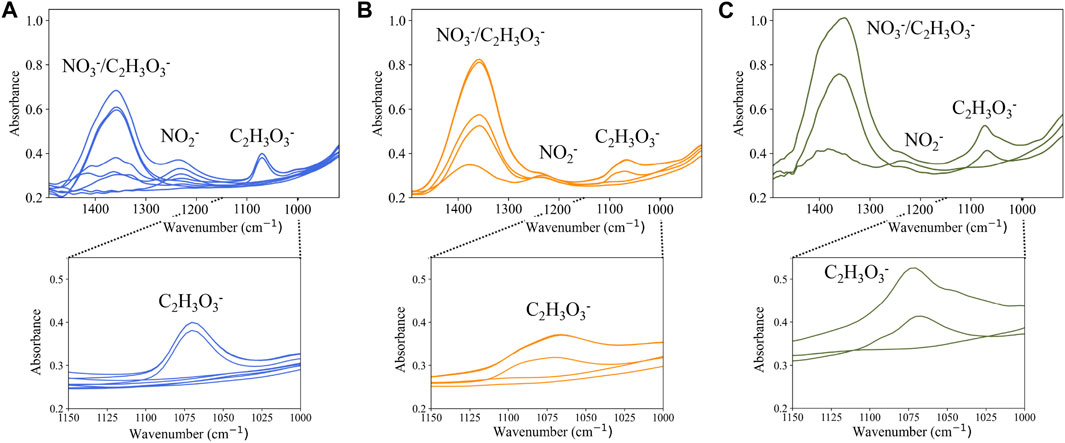
FIGURE 6. (A) PLSR model training data, (B) process data from Run 1 collected from five different conditions in the SRAT/SME process, and (C) process data from Run 2 from three different conditions in the SRAT/SME process. The magnified region (1000–1150 cm−1) highlights the glycolate
In this work, nitrate and nitrite are target species to be quantified. Therefore, it is the objective of the BSS algorithm to remove non-target species: known sources that deviate from training conditions (glycolate) and unknown sources with unknown spectra (potentially oxalate, carbonate, formate, phosphate, and sulfate). While the presence and approximate concentration ranges of non-target components may be known, much of their chemistry has not been fully elucidated in the complex mixtures present in the DWPF.
The BSS algorithm proposed in Section 2.3 was run separately on the process spectra from Run 1 (Figure 6B) and Run 2 (Figure 6C). The BSS algorithm was provided the target reference spectra (including water) from Figure 3A and an initial guess for glycolate from the high-pH reference in Figure 3B. The MCR-ALS step determined the number of additional sources, beyond glycolate, to be zero for Run 1 and one for Run 2.
Run 1 BSS source matching is shown in Figure 7A, where the BSS-determined glycolate source (pink) is compared to the high-pH glycolate reference (dashed black) and the mixture spectra (blue) of Run 1. BSS, particularly the MCR-ALS step, estimates the glycolate contribution to be broader than the supplied reference, as can be seen by the pink curve having greater peak width at the 1078 cm−1 peak than the dashed black curve. The MCR-ALS algorithm produces this “widened” glycolate source by altering the provided reference spectra of non-targets to match the calculated bilinear model (Eq. 7) with the experimental mixture spectra from Figure 7A (shown in blue). From Figure 7A, the BSS-determined source (pink) better matches the qualitative shape of the measured (blue) peak at 1078 cm−1 than the supplied high-pH glycolate reference (dashed black).
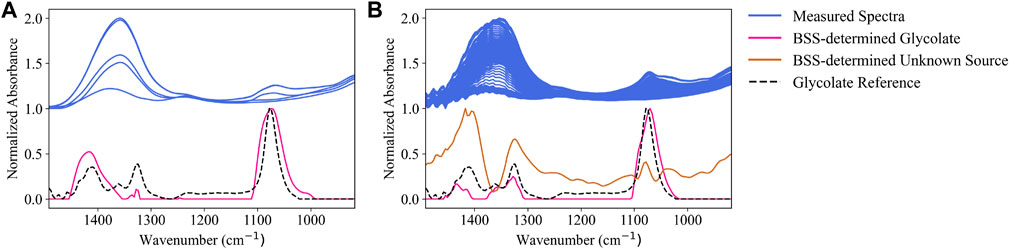
FIGURE 7. Comparisons between measured spectra (93°C), high-pH glycolate reference (25°C), BSS-estimated glycolate reference, and a calculated source from the BSS algorithm for (A) Run 1 and (B) Run 2.
Run 2 BSS source matching is shown in Figure 7B, where continuous run data (3902 spectra) of the SRAT and SME processes are analyzed. A source (brown) is identified in Figure 7B that does not match any user-input reference sources. The proposed source resembles a baseline shift, in addition to model mismatch in the region of glycolate (1078 cm−1) and nitrate, carbonate, and glycolate (1410 cm−1). The discovered peak centered on 1410 cm−1 may correspond to glycolate or carbonate, both of which have associated peaks in that location. The combined baseline and model mismatch may demonstrate a limitation of using PCA (or other latent variable methods) to identify sources; principal components may not be have a single physical interpretation and may instead be a combination of sources. During Run 2 (Figure 7B), the glycolate peak (pink) is again “widened” to match the appearance of glycolate in the mixture spectra (blue).
Figure 8A shows BSS-preprocessing and its removal of estimated glycolate contributions from process spectra of Run 1. Peaks are subtracted in the vicinity of 1078 cm−1 and 1450 cm−1. The parity plots comparing the concentration predictions for PLSR models using either original spectra or BSS preprocessed spectra are shown in Figure 8B. Quantifiable improvements are achieved with BSS preprocessing applied and are shown in Table 4. Nitrate quantification is improved from an R2 value of 0.934 to an R2 value of 0.988 with BSS preprocessing applied to the spectra. Nitrite quantification is also improved, but the quantification at process concentrations is limited for both original and preprocessed spectra. This error is likely due to low concentration of the nitrite anion in solution and corresponding low intensity of the nitrite peak in the FTIR spectrum. In Table 4, mean percent error is not quantified for nitrite since it has IC-measured concentrations of zero, which causes a division-by-zero error.
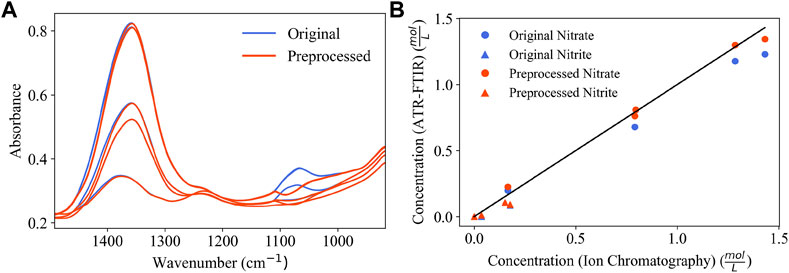
FIGURE 8. (A) Overlay of Run 1 spectra before and after BSS-preprocessing; (B) parity plot comparing Run 1 concentration predictions for a PLSR model (blue) and PLSR model with BSS-preprocessing applied (red).

TABLE 4. Table of error metrics corresponding to Figure 8B.
Applying blind source separation to the process data improves the quantification of nitrate and possibly nitrite while also providing visually interpretable results through peak subtraction. The peak that is removed at 1078 cm−1 corresponds to glycolate based on process knowledge and peak location. However, this glycolate peak has a different shape than the supplied glycolate reference and the spectra appearing in the training dataset. The BSS algorithm is able to improve the initial guess of the glycolate spectrum to better match the components observed in the mixture spectra, resulting in an accurate bilinear mixture model that allows glycolate contributions to be removed for improved model quantification.
Figure 9A shows BSS-preprocessing and its removal of estimated glycolate contributions from 3902 process spectra. The parity plots comparing the concentration predictions for PLSR models using both original spectra and BSS preprocessing are shown in Figure 9B. Quantifiable improvements are achieved with BSS preprocessing for nitrate quantification. The model error is shown in Table 5. Nitrate quantification is improved from an R2 value of 0.267 to an R2 value of 0.978 with BSS preprocessing applied to the spectra. Nitrite quantification is less accurate with an initial R2 of 0.722 which decreases to 0.703 with BSS-preprocessing. A limitation of nitrite quantification results for Run 2 are that only three timepoints have corresponding IC-reported concentration values, and two of the three timepoints report the nitrite IC concentration at zero (measured below 100 ppm). Therefore, there is a single measurement containing nitrite for quantification for Run 2. Nitrate, however, is present in significant amounts in all three timepoints in Figure 9B. Supplementary Table S5, Supplementary Figures S3, S4 in the Supplementary Information show a comparative study where the BSS algorithm is provided different combinations of low- and high-pH glycolate sources.
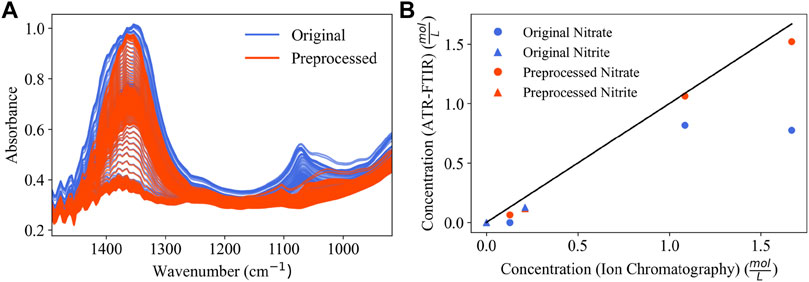
FIGURE 9. (A) Overlay of 3902 process spectra from Run 2 before and after BSS-preprocessing; (B) parity plot comparing Run 2 concentration predictions for a PLSR model (blue) and a PLSR model with BSS-preprocesssing applied (red).
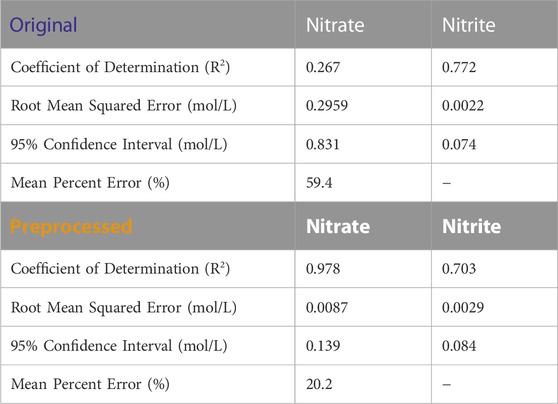
TABLE 5. Table of error metrics corresponding to Figure 9B.
ATR-FTIR has the capability for real-time measurements, whereas IC measurements often incur measurement delays. Figure 10, which reports concentrations at every timepoint for Run 2 along with the three timepoints with IC data, highlights the distinction between time resolution provided by ATR-FTIR and IC for a typical SRAT/SME cycle. Glycolate contributions have been removed using BSS preprocessing in Figure 10A, whereas no BSS preprocessing is applied in Figure 10B. In Figure 10A, only two species are quantified: nitrate and nitrite. However, these two species match the reported IC concentrations (denoted by the circles and triangles) more closely throughout processing than the equivalent quantification with no preprocessing in Figure 10B. Most notable is the difference in nitrate quantification, which is much improved when BSS-preprocessing is applied. The better agreement of BSS-preprocessed ATR-FTIR prediction with IC measurements in Figure 10A has the drawback of not quantifying glycolate, even if Figure 10B suggests that glycolate is quantified poorly given the available training data. In the case where it is desirable to improve quantification of nitrate and nitrite via BSS and additionally quantify glycolate, two separate models could be constructed for providing original glycolate estimates (still including any errors of the original spectra) while improving nitrate and nitrite estimates through source subtraction.
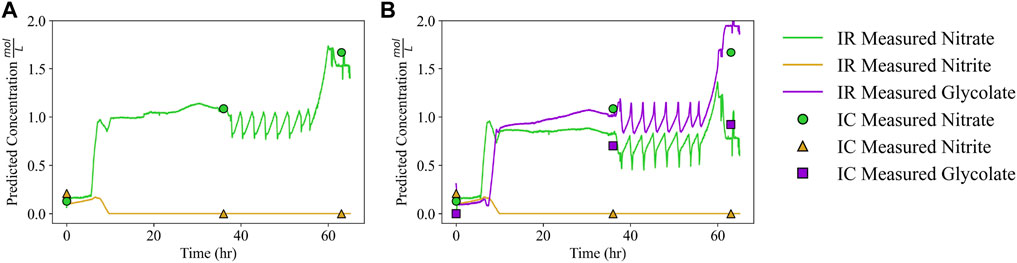
FIGURE 10. Continuous SRAT and SME data (Run 2) quantified using (A) BSS to remove glycolate contributions and a PLSR quantification model and (B) only a PLSR quantification model where glycolate is quantified and not removed.
Based on the results for quantifying nitrate and nitrite, ATR-FTIR is able to measure the concentration of target anions as they undergo additions and reactions in the SRAT/SME processes. Nitrate concentration, monitored via ATR-FTIR in Figure 10, sharply increases 8 h into Run 2. The measured nitrate increase corresponds to the addition of nitric acid in the SRAT, which indicates ATR-FTIR can verify nitric acid addition. Additionally the saw-tooth pattern appearing in Figure 10 around 40 h into the process corresponds to the repeated addition of water followed by a dewatering step. Dewatering is observed as an increase in concentration as the solvent evaporates, concentrating the remaining solution. In SRAT/SME processing, solution-phase concentration information during the dewatering step can be used to verify that the expected mass is evaporated. By measuring nitrate concentration, unexpected changes in heating efficiency, changes in specific heat of the feed stream, or clogs in the vapor outlet could be detected and undergo further troubleshooting. Similarly, the nitrite anion can be monitored to ensure that all nitrite is destroyed through acid addition, at least to the limit that is detectable with ATR-FTIR. In Figure 10B, qualitative information is provided for the glycolate anion despite quantitative inaccuracy. The glycolate concentration can be seen to sharply increase shortly after the nitrate concentration increases. This is from the glycolic acid addition, which follows the nitric acid addition and introduces glycolate to the SRAT. The acid additions also lower the solution pH to about 4, which will cause some glycolate to exist in its protonated form for the remaining duration of SRAT/SME processing.
The presence of nitrate, an abundant analyte that is active in the infrared spectrum, may allow for other nonvolatile and nonreactive solution species to be estimated with a mass-balance during the chemical additions, dewatering process, and up until the slurry is transported to the melter. As the final control point before the slurry is melted, close monitoring of the solution-phase in the SRAT and SME could accelerate and support decisions made by the DWPF Analytical Laboratory regarding waste batch approval (Ray et al., 2018).
This work serves as both a proof of concept on the use of ATR-FTIR spectroscopy for monitoring slurry samples at the Savannah River Site and an example of a novel blind source separation algorithm for improving quantification of complex mixture spectra. ATR-FTIR spectroscopy performs rapid process measurements compared to typical IC sample analysis, enabling real-time monitoring and decision-making. However, the complex chemistry and variable process parameters in vessels at the Savannah River Site necessitate ATR-FTIR spectra-to-composition models that are robust to changing chemical and process conditions. In this work, measured ATR-FTIR spectra were combined with a blind source separation algorithm to overcome limited training spectra that do not match process spectra. Specifically, the glycolate anion
The concentrations of target species, nitrate
The original contributions presented in the study are included in the article/Supplementary Material, further inquiries can be directed to the corresponding author.
SC: Conceptualization, Formal Analysis, Writing–original draft. SK: Conceptualization, Investigation, Writing–review and editing. SN: Investigation, Writing–review and editing. RP: Writing–review and editing. AH: Writing–review and editing, Investigation. DL: Writing–review and editing, Project administration, Resources. RR: Project administration, Resources, Writing–review and editing. MG: Project administration, Resources, Writing–review and editing.
The author(s) declare financial support was received for the research, authorship, and/or publication of this article. Support by the U.S. Department of Energy under Cooperative Agreement DE-FC01-06EW07053, entitled “The Consortium for Risk Evaluation with Stakeholder Participation III,” is gratefully acknowledged. This work was produced by Battelle Savannah River Alliance, LLC under Contract No. 89303321CEM000080 with the U.S. Department of Energy. Publisher acknowledges the U.S. Government license to provide public access under the DOE Public Access Plan (http://energy.gov/downloads/doe-public-access-plan). This material is based upon work supported under an Integrated University Program Graduate Fellowship.
The authors declare that the research was conducted in the absence of any commercial or financial relationships that could be construed as a potential conflict of interest.
All claims expressed in this article are solely those of the authors and do not necessarily represent those of their affiliated organizations, or those of the publisher, the editors and the reviewers. Any product that may be evaluated in this article, or claim that may be made by its manufacturer, is not guaranteed or endorsed by the publisher.
The Supplementary Material for this article can be found online at: https://www.frontiersin.org/articles/10.3389/fnuen.2023.1295995/full#supplementary-material
Brunton, S. L., and Kutz, N. J. (2022). Data-driven science and engineering. 2nd edn. Cambridge: Cambridge University Press.
Camp, C. H. (2019). PyMCR: a Python library for multivariate curve resolution analysis with alternating regression (MCR-AR). J. Res. Natl. Inst. Stand. Technol. 124 (124018), 1–10. doi:10.6028/jres.124.018
Cornel, J., Lindenberg, C., and Mazzotti, M. (2008). Quantitative application of in situ ATR-FTIR and Raman Spectroscopy in crystallization processes. Anal. Chem. 47, 4870–4882. doi:10.1021/ie800236v
das Graças Gomes, M., da, S. S., Borges, S., Lopes, L. G., and Franco, D. W. (1993). UV-visible spectrum of nitrous acid in solution: pKa determination and analytical applications. Anal. Chim. Acta 282, 81–85. doi:10.1016/0003-2670(93)80354-N
Haaland, D. M., and Melgaard, D. K. (2000). New prediction-augmented classical least-squares (PACLS) methods: application to unmodeled interferents. Appl. Spectrosc. 54, 1303–1312. doi:10.1366/0003702001951228
Haaland, D. M., and Melgaard, D. K. (2002). New augmented classical least squares methods for improved quantitative spectral analyses. Vib. Spectrosc. 29, 171–175. doi:10.1016/S0924-2031(01)00199-0
Jaumot, J., de Juan, A., and Tauler, R. (2015). MCR-ALS GUI 2.0: new features and applications. Chemom. Intelligent Laboratory Syst. 140, 1–12. doi:10.1016/j.chemolab.2014.10.003
Kocevska, S., Maggioni, G. M., Crouse, S. H., Prasad, R., Rousseau, R. W., and Grover, M. A. (2022). Effect of ion interactions on the Raman spectrum of NO3—: toward monitoring of low-activity nuclear waste at Hanford. Chem. Eng. Res. Des. 181, 173–194. doi:10.1016/j.cherd.2022.03.002
Kocevska, S., Maggioni, G. M., Rousseau, R. W., and Grover, M. A. (2021). Spectroscopic quantification of target species in a complex mixture using blind source separation and partial least-squares regression: a case study on Hanford waste. Industrial Eng. Chem. Res. 60, 9885–9896. doi:10.1021/acs.iecr.1c01387
Lambert, D. P., and Howe, A. M. (2021), May Aiken, SC, United States. Savannah River National Laboratory. Antifoam development for eliminating flammability hazards and decreasing cycle time in the Defense waste processing facility. Tech. Rep. doi:10.2172/1630277
Lambert, D. P., Nikolov, A. D., Wasan, D. T., Williams, M. S., Howe, A. M., and Woodham, W. H. (2021). A novel defoamer for processing nuclear waste: testing and performance. Environ. Prog. Sustain. Energy 40, 1–13. doi:10.1002/ep.13607
Lambert, D. P., Williams, M. S., Brandenburg, C. H., and Newell, J. D. (2016). Sludge batch 9 simulant runs using the nitric-glycolic acid flowsheet Technical Report. Aiken, SC, United States Savannah River National Laboratory. doi:10.2172/1335822
Lascola, R., O’Rourke, P. E., and Kyser, E. A. (2017). A piecewise local partial least squares (PLS) method for the quantitative analysis of plutonium nitrate solutions. Appl. Spectrosc. 71, 2579–2594. doi:10.1177/0003702817734000
Maggioni, G. M., Kocevska, S., Grover, M. A., and Rousseau, R. W. (2019). Analysis of multicomponent ionic mixtures using blind source separation: a processing case study. Industrial Eng. Chem. Res. 58, 22640–22651. doi:10.1021/acs.iecr.9b03214
Melgaard, D. K., Haaland, D. M., and Wehlburg, C. M. (2002). Concentration residual augmented classical least squares (CRACLS): a multivariate calibration method with advantages over partial least squares. Appl. Spectrosc. 56, 615–624. doi:10.1366/0003702021955178
Naik, G. R., and Wang, W. (2014). Blind source separation: advances in theory, algorithms and applications. Springer. doi:10.1007/978-3-642-55016-4
Ray, J., Culbertson, B., Marra, S., and Plodinec, M. (2018). DWPF glass product control Program. Technical Report.
Serjeant, E., and Dempsey, B. (1979). Ionisation constants of organic acids in aqueous solution. Oxford: Pergamon Press.
Tauler, R. (1995). Multivariate curve resolution applied to second order data. Chemom. Intelligent Laboratory Syst. 30, 133–146. doi:10.1016/0169-7439(95)00047-X
Tauler, R., Izquierdo-Ridorsa, A., and Casassas, E. (1993). Simultaneous analysis of several spectroscopic titrations with self-modelling curve resolution. Chemom. Intelligent Laboratory Syst. 18, 293–300. doi:10.1016/0169-7439(93)85006-3
Tse, P., Shafer, J., Bryan, S. A., and Lines, A. M. (2021). Quantification of Raman-interfering polyoxoanions for process analysis: comparison of different chemometric models and a demonstration on real Hanford waste. Environ. Sci. Technol. 55, 12943–12950. doi:10.1021/acs.est.1c02512
White, T. L., Lambert, D. P., Zamecnik, J. R., and Riley, W. T. (2015). Ion chromatography (IC) Analysis of Glycolate in simulated waste. Technical Report. Aiken: Savannah River National Laboratory.
Woodham, W. H., Howe, A. M., and Siegfried, M. J. (2021). Tech. Rep. September Aiken, SC, United States. Savannah River National Laboratory. Sludge batch 10 flowsheet testing with non-radioactive simulants. doi:10.2172/1821142
Keywords: ATR-FTIR, blind source separation, nuclear waste, chemometrics, Savannah River Site, glycolate, process monitoring, preprocessing
Citation: Crouse SH, Kocevska S, Noble S, Prasad R, Howe AM, Lambert DP, Rousseau RW and Grover MA (2023) Real-time infrared spectroscopy coupled with blind source separation for nuclear waste process monitoring. Front. Nucl. Eng. 2:1295995. doi: 10.3389/fnuen.2023.1295995
Received: 17 September 2023; Accepted: 13 November 2023;
Published: 30 November 2023.
Edited by:
Luke Sadergaski, Oak Ridge National Laboratory (DOE), United StatesReviewed by:
Shingo Tamaki, Osaka University, JapanCopyright © 2023 Crouse, Kocevska, Noble, Prasad, Howe, Lambert, Rousseau and Grover. This is an open-access article distributed under the terms of the Creative Commons Attribution License (CC BY). The use, distribution or reproduction in other forums is permitted, provided the original author(s) and the copyright owner(s) are credited and that the original publication in this journal is cited, in accordance with accepted academic practice. No use, distribution or reproduction is permitted which does not comply with these terms.
*Correspondence: Martha A. Grover, bWFydGhhLmdyb3ZlckBjaGJlLmdhdGVjaC5lZHU=
Disclaimer: All claims expressed in this article are solely those of the authors and do not necessarily represent those of their affiliated organizations, or those of the publisher, the editors and the reviewers. Any product that may be evaluated in this article or claim that may be made by its manufacturer is not guaranteed or endorsed by the publisher.
Research integrity at Frontiers
Learn more about the work of our research integrity team to safeguard the quality of each article we publish.