 Andrée De Backer1,2,3*
 Abdelkader Souidi4
 Etienne A. Hodille5Emmanuel Autissier6Cécile Genevois6Farah Haddad6
 Antonin Della Noce7Christophe Domain2,8
 Charlotte S. Becquart1,2Marie-France Barthe6
- 1Universite de Lille, CNRS, INRAE, Centrale Lille, UMR 8207—UMET, Lille, France
- 2EM2VM, Joint Laboratory Study and Modelling of the Microstructure for Ageing of Materials, Moret-sur-Loing, France
- 3Aix Marseille University, CNRS, PIIM, Marseille, France
- 4Universite Dr. Tahar Moulay de Saida, Faculte des Sciences, Departement de Physique, Saïda, Algeria
- 5CEA, IRFM, Saint Paul Lez Durance, France
- 6CNRS-CEMHTI, Orleans, France
- 7IGR, Unite INSERM 981, Villejuif, France
- 8EDF-R&D, Departement Materiaux et Mecanique des Composants, Moret-sur-Loing, France
In nuclear fusion (ITER and the future DEMO), those components that face the plasma are exposed to high temperature and irradiation which, in the long term, modifies their thermal and mechanical properties and tritium retention. Tungsten is a candidate material and is the subject of many studies of microstructure evolution under various irradiation and temperature conditions. One milestone is the characterization of its defect properties. We here readdress the diffusion of nanocavities on broad ranges of size and temperature and compare it with dissociation, a competing process during nanocavity growth. First, at the atomic scale, we used molecular dynamics to explore the variety of elementary events involved in the nanocavity diffusion. Second, an experimental study of ion-irradiated samples, annealed at different temperatures up to 1,773 K, revealed the creation and growth of nanocavities on transmission electron microscopy images. Third, we performed multi-objective optimization of the nanocavity diffusion input of our object kinetic Monte Carlo model to reproduce the experimental results. Finally, we applied a sensitivity analysis of the main inputs of our model developed for these particular conditions—the source term which combines two cascade databases and the impurities whose interaction with the defects is characterised with a supplemented database of density functional theory calculations. Three domains of nanocavity size were observed. The first is the small vacancy clusters, for which atomistic calculations are possible and dissociation is negligible. The second is the small nanocavities, for which we provide new diffusion data and where a competition with the dissociation can take place. The third domain is the large nanocavities, for which, in any case, the dissociation prevents their existence above 1,500 K in the absence of a stabilizing interface.
1 Introduction
Tungsten is a candidate material for plasma-facing components of fusion reactors because of its resistance to high temperature and its low sputtering property. Two concerns about it are the deterioration of its mechanical properties (the ductile-to-brittle transition temperature is reduced because of the irradiation) and tritium retention due to neutron and ion irradiation. The tritium solubility of perfect tungsten is low, but tritium retention is enlarged by tens of orders of magnitude in the presence of defects created by neutron or high energy particle irradiation. One additional issue is that, in a fusion reactor, the temperature and irradiation conditions experienced by the materials vary significantly—particularly plasma surface interactions, which induce large spatial and temporal temperature gradients.
For the design and safety of ITER and future DEMO power plants, it is necessary to develop numerical models of the evolution of the material microstructure under irradiation and large temperature variations. For this purpose, data on the properties of defects are required. The literature reports a very limited amount of data on the diffusion of vacancy defects and, in particular, on the diffusion properties of nanocavities. In the 1960s, the motion and coalescence of pores in metals were intensively studied in order to understand the microstructural damage in irradiated materials with and without the presence of helium (Nichols, 1969; Goodhew et al., 1981; Zell et al., 1994). The proposed diffusion mechanism is the creation and diffusion of defects at the inner surface of the nanocavity. Theoretical expressions were elaborated, but investigations were limited by the size resolution of the experimental techniques and computational capability. In 2017, Castin et al. (2017) characterized the diffusion properties of vacancy clusters using machine learning, with the drawback that the approach relied on the quality of empirical potentials. Mason et al. (2017) used density functional theory (DFT) to calculate the activation energies for the evolution of small vacancy clusters. They found that the tri-vacancy diffuses faster than the mono-vacancy in W and observed the diffusion of clusters up to 15VAC in atomic kinetic Monte Carlo simulations based on a new empirical potential developed for the study of surfaces and vacancy cluster properties. Perez et al. (2017) studied the diffusion of small vacancy-helium clusters with accelerated MD using a supercomputer. Jansson and Malerba (2013) and Pannier (2017) showed that the migration energy of clusters of similar size in iron can significantly differ depending on their symmetry.
This work relies on complementary approaches to observe, understand, and model the formation and growth of nanocavities due to their diffusion and dissociation. In the first section, we briefly revisit the elementary events observed at the atomistic level using molecular dynamics. In the second section, we summarize the experimental results detailed in Autissier et al. (2023) that characterise the growth of nanocavities in irradiated and annealed samples. The third section describes our object kinetic Monte Carlo (OKMC) model and four main inputs that have been improved since our previous paper (Becquart et al., 2010): the source term, the interactions of defects with impurities, and the diffusion and dissociation of the nanocavities. We emphasise the uncertainty estimation, providing upper and lower limits of the parameter sets. The method we used to obtain the diffusion coefficients of the nanocavities with multi-objective optimisation is detailed in De Backer et al. (2022) and De Backer et al. (2023). In the fourth section, we describe a sensitivity analysis based on systematically combining upper and lower parameter sets. We focus on the most sensible conditions: the impact of empirical potentials in the source term, and the competition between diffusion and dissociation of the nanocavities. Finally, we discuss the results and conclude. For the sake of readability, additional information is reported in the Supplementary Material in numerous places.
2 Diffusion of nanocavities at the atomistic level
In Nichols (1969), Goodhew et al. (1981), and Zell et al. (1994), the motion of a void starts with the creation of a pair of defects at the inner surface: an ad-atom and a surface vacancy. A small change of the centre of mass of the void is obtained by the net displacement of one atom from the leading surface to the trailing surface and/or one surface vacancy in the opposite sense. Two mechanisms can be considered: diffusion at the surface, or diffusion via the lattice if the defect dissociates before recombination. The flight of an ad-atom through the vacuum or vapour (in a bubble) phase is also possible. Theoretical expressions of the resulting nanocavity diffusion coefficient have been derived; these usually depend on assumptions about the shape of the cavity or the driving process. Mason et al. (2017) showed that small vacancy clusters diffuse by taking successively different configurations. The energy barriers associated with each transformation can be accurately calculated and will determine the diffusion coefficient of the whole cluster. However, this approach rapidly becomes impractical with the increasing number of configurations that must be considered for large clusters. In Castin et al. (2017) and Mason et al. (2017), the diffusion of small nanocavities was simulated using atomic kinetic Monte Carlo simulations where the energy barrier energy calculations rely on assumptions and on the quality of the empirical potential. In this work, we perform exploratory molecular dynamics (MD) simulations of the diffusion of nanocavities of various sizes.
2.1 The molecular dynamics setup
The simulations were performed using the code LAMMPS (Plimpton, 1995) in a cubic cell containing 16,000 W atoms of a bcc lattice. Using the empirical potential, Ms—specifically designed for vacancy type defects (Mason et al., 2017)—100 ns simulations at 2,000 K have been calculated. Frames have been saved every 10 ps and analysed (more technical aspects are given in Supplementary Section S1 of the Supplementary Material). Cavities with 12 same-size (110) surfaces were built, this orientation being the most stable for bcc W (Vitos et al., 1998; Byggmästar et al., 2019). We chose a rhombic dodecahedron (one solid of Catalan) in which the 12 surfaces have lozenge shapes of the same area (see Figure 1). Highly symmetric cavity clusters of 15VAC, 65VAC, 175VAC, and 369VAC are easily obtained with this method. In this paper, the description will be limited to 65VAC and 175VAC. The distance between the two opposite vertices is 1.2 nm for 65VAC and 1.9 nm for 175VAC. To remove the perfect crystal and visualise the atoms of the so-called inner surface, one uses the atom coordination (CN), with a cutoff of 3.9 Å. Figure 1A shows the inner surface atoms of 175VAC from the (100), (110), and (111) lines of sight. The coordination is indicated by the colour coding. The perfect surfaces are in blue (CN = 10), the edges are in green (CN = 12), and the vertices are in red (CN = 13). It can be seen that the 175VAC cluster has nine atoms on the surface, while the 65VAC cluster has only four, which will impact the probability of the elementary events and the variety of the configurations that can be observed in the simulations. The number of possible configurations would be even larger if we had started with less symmetrical clusters. An example of 88VAC is illustrated in Figure 1B, with surfaces of different sizes and vertices involving several atoms.
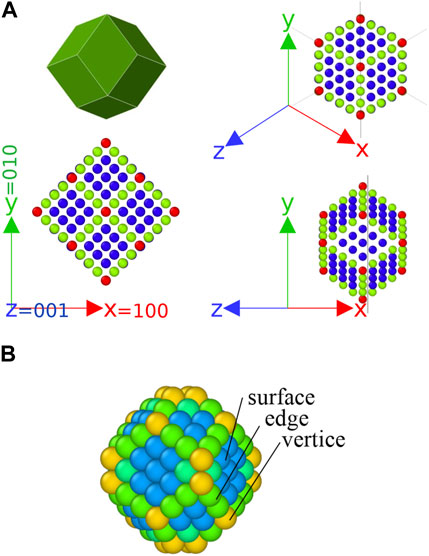
FIGURE 1. (A) Visualisation of the 175VAC nanocavity. Atoms at the inner surface are represented in a different line of sight with their coordination in colour coding. The surface atoms are represented in blue (CN = 10), the edges in green (CN = 12), and the vertices in red (CN = 13). Note a rhombic dodecahedron [14 vertices and 12 lozenge faces in the (110) direction]. (B) 3D visualisation of a less symmetrical nanocavity, one 88VAC.
2.2 Analysis of the simulations
The centre of the mass of the vacancy cluster as a function of time, dc(t), is plotted in insets in Figure 2A. The effective displacement is very small—0.1–0.4 nm—because of the average number of vacancies in the nanocavity. Its erratic behaviour is strengthened by some elementary processes. For example, for 65VAC at 85 ns, the rapid peak of dc(t) is due to the emission and recapture of one vacancy—that is, one surface vacancy becomes a free vacancy which rapidly diffuses in the lattice before being recaptured. Here, the periodic boundary conditions of the simulation lead to an artefact: the change of dc(t) is always temporary, and the free vacancy is always recaptured. Properly calculating the diffusion coefficients requires simulations to be run much longer at different temperatures and with various initial configurations. This is impractical, and we limit our investigations to detecting and counting elementary processes with a few initial configurations.
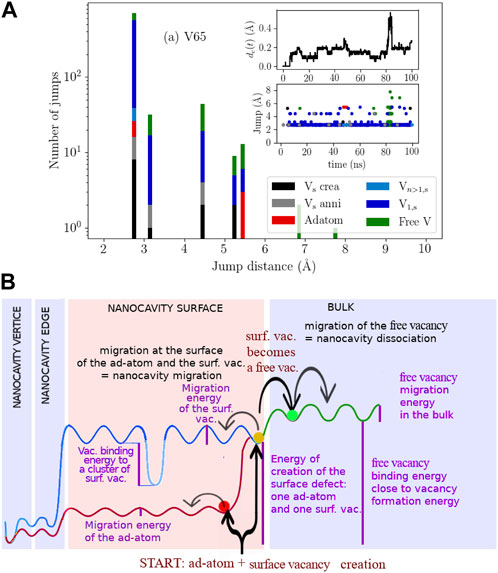
FIGURE 2. (A) Histogram of the number of detected events as a function of the jump distance in the 65VAC simulation; V1,s (blue) is for an isolated surface vacancy, and Vn > 1,s (light blue) is for a jump inside a cluster of surface vacancies. The insets show the evolution of the centre of mass of the vacancy cluster, dc(t), and the jump measured for each elementary event as a function of the detection time. (B) Energy barriers of the elementary processes, starting in the centre with the creation of a pair of defects: a surface vacancy and an ad-atom. On the left, the ad-atom and the surface vacancy diffuse at the surface until they are trapped at an edge—a vertex or a cluster of surface vacancies. On the right, the surface vacancy penetrates into the bulk, becoming a free vacancy. The dissociation, in competition with the diffusion, is when this free vacancy diffuses away.
The method of tracking a defect’s creation, motion, and annihilation is based on the detection of a modification between frame (n) and frame (n+1) (see details in Supplementary Section S1 of the Supplementary Material). A frequent sequence of events is observed: i) a pair of defects (an ad-atom and a surface vacancy) are created at the inner surface; ii) the ad-atom moves quickly and is trapped first on an edge, and then on a vertex; iii) the surface vacancy migrates until it is also trapped. The six different elementary events by order of increasing frequency are as follows: i) free vacancy jump; ii) single surface vacancy jump; iii) surface vacancy jump in a cluster of surface vacancies; iv) ad-atom jump; v) creation of a surface vacancy and ad-atom pair; vi) annihilation of a surface vacancy (reverse process of v).
One interesting and new process here is the formation of clusters of surface vacancies. The initially perfectly faceted cavity becomes less symmetrical. The creation of several ad-atom and surface vacancy pairs allows the formation of a new ledge which initiates a possible change of surface orientation.
The lengths of each vacancy or ad-atom jump have been measured. The histogram for the 65VAC is plotted and shown in Figure 2. The comparison with 175VAC is possible and shown in Supplementary Section S1.3 of the Supplementary Material. The main observations follow. First, the large majority of the jumps corresponds to the first nearest neighbours (NN) distance (
A simple sketch of the energy barriers for the surface defect creation and diffusion leading to the nanocavity diffusion is proposed in Figure 2B. What happens at the inner surface is shown on the left and what happens in the bulk lattice is on the right. The heights of the energy barriers are associated with the frequency of detection in the simulations, taking the bias of the frame frequency into account. It starts with the formation of the pair of defects: one surface vacancy and one ad-atom. The ad-atom and the surface vacancy diffuse independently at the surface until they are trapped or annihilated. The trapping centres are the edges, the vertices, but also clusters of surface vacancies which can appear on large nanocavities. The surface vacancy can also penetrate the bulk of the material, becoming a free vacancy. If it diffuses back to the nanocavity, then it is part of the diffusion process, but if it diffuses far away, then it is part of the nanocavity dissociation process. Thus, the diffusion and dissociation processes share some energy barriers.
3 Experimental observations of the nanocavity growth
Descriptions of the experimental setup, the main experimental results, and the elements of interpretation necessary to this work are explained in the following paragraphs. It is important to remember that irradiation creates interstitial and vacancy defects, which evolve and interact during irradiation and when the material temperature increases.
3.1 Experimental set-up
The experimental scheme is as follows: sample preparation, irradiation, and successive annealing at increasing temperatures. At each stage, the microstructure is characterised using a transmission electron microscope (TEM). Micrographs are recorded and analysed a posteriori.
The samples are first polished and annealed at 1,873 K to remove native defects. Zones as thin as 33 nm are obtained with a twin-jet electropolisher. Irradiations of 1.2 MeV W are realised in the JANNuS platform at a fluence of 1.8 ± 0.2 × 1012 cm−2 and a temperature of 773 K. The corresponding damage was evaluated with SRIM (Ziegler et al., 2010) in the Quick Kinchin-Pease mode (Stoller et al., 2013) using the displacement energy threshold of 55 eV (Autissier et al., 2023). The average damage dose is about 0.02 dpa. The maximum range of the W ions is located at a depth of 50 nm. This means that a large proportion of the ions passes through the thin parts of the lamella. The same samples are then successively annealed over 1 h at eight fixed temperatures between 873 and 1,773 K.
The TEM is a PHILIPS CM 20 device with a very good resolution of 0.14 nm. The bright field image is recorded in under- and over-focused beam conditions to allow the identification of nanocavities and the measurement of their size (diameter). The analysis of the images combines manual and automatic inspections that are briefly explained in Supplementary Section S2.2 of the Supplementary Material and detailed in Autissier et al. (2023). The images are also recorded with different operating diffraction vectors to identify dislocation loops.
Note that, in Section 5.2, we also consider one experimental result obtained in the same conditions as just described except for the irradiation temperature, which was 300 K instead of 773 K.
3.2 Experimental results
After irradiation, a large density of 1024-m−3 small nanocavities of around 1 nm diameter is apparent. Figure 3 shows bright-field TEM pictures in which nanocavities can be identified by spots whose contrast turns from black in over-focused to white in under-focused conditions. The size histogram is plotted further in the text and compared with the simulations in Figure 10A. The nanocavity sizes range from 0.8 to 2.2 nm—well above the visibility threshold of 0.5 nm. The opposite of the size histogram is obtained in samples irradiated at 300 K plotted in Figure 10B, which start at the visibility limit and decrease exponentially, suggesting that there are also invisible vacancy defects.
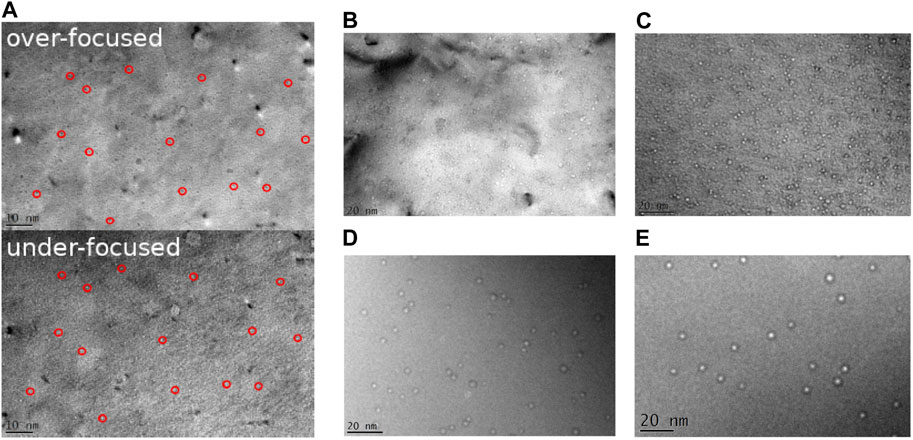
FIGURE 3. (A) Bright-field TEM micrographs in over- and under-focused beam conditions of irradiated samples. A high density of very small nanocavities appear as black (resp. white) spots in over-focused (resp. under-focused) conditions. Some are indicated with red circles. (B–E) Bright-field TEM micrographs in under-focused beam conditions of W samples irradiated by 1.2 MeV W ions and annealed up to (A) 1,173 K, (B) 1,373 K, (C) 1,573 K, and (D) 1,773 K. Nanocavities appear as white spots. They grow and become less numerous when the temperature increases.
During the succession of annealing steps at increasing temperatures, the growth of nanocavities is observed and illustrated by four TEM images taken at 1,173, 1,373, 1,573, and 1,773 K in Figure 3. The size histograms (see Supplementary Figure S12 of the Supplementary Material) exhibit a progressive shift and broadening up to 4 nm.
The nanocavity diffusion cannot be observed in situ, and it was not possible to mark the sample surface to localise the nanocavities. Explaining nanocavity growth requires consideration of two possible mechanisms: diffusion and dissociation. Throughout this work, both mechanisms are considered and the modelling results support the final interpretation. Supplementary Figure S2 of the Supplementary Material shows the total density and mean size of the nanocavities as a function of the annealing temperature. The tendency represented by lines adjusted, as described in De Backer et al. (2023), shows that the density decreases and size increases when the temperature increases. The number of experimental data/points is limited, and the saw-tooth variations are mainly due to the counting methods and the variation in the local transparency of the sample.
Figure 4 shows micrographs with interstitial defects—particularly of dislocation loops after irradiation and annealing at 973, 1,173, and 1,373 K. Some dislocation loops gathered in rafts (as in Hasanzadeh et al. (2018)). The total density of isolated dislocation loops is 4.1 ± 0.6 × 10²³ m−3, and their diameter is about 9 nm. Approximately 60% of loops have a 1/2a ⟨111⟩ Burgers vector, and the others are ⟨100⟩. The total density of the rafts is 0.3 ± 0.6 × 10²³ m−3, and 90% of loops are 1/2a⟨111⟩. The isolated dislocation loops and rafts become larger and longer (respectively) at 993 K, significantly fewer at 1,173 K, and extremely rare at 1,373 K.
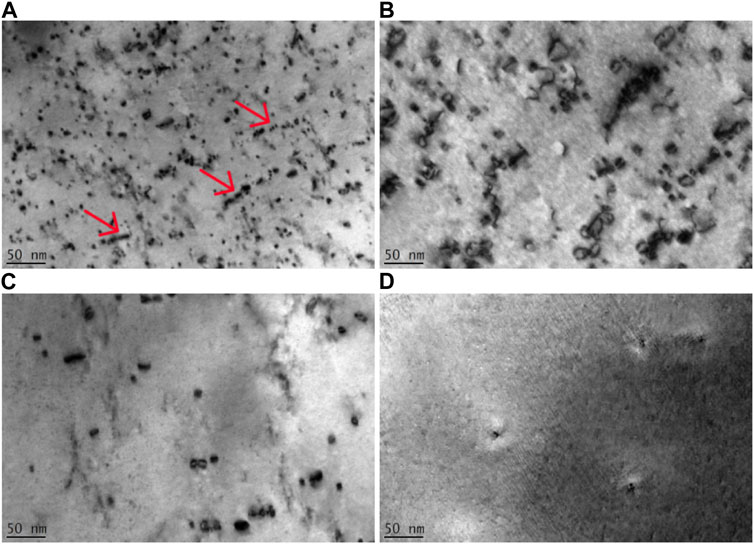
FIGURE 4. Bright-field TEM micrographs acquired with an operating diffraction vector g = ⟨110⟩; (A) after irradiation; (B–D) after annealing at 973, 1,173, and 1,373 K. After irradiation, isolated dislocation loops and loops gathered in rafts (pointed in red) are apparent. Loops become larger and longer at 993 K, significantly fewer at 1,173 K, and extremely rare at 1,373 K.
4 The OKMC model and its main inputs
Our model follows all the experimental steps and simulates the creation, diffusion, dissociation, and interaction of the defects. The core of our model is an object kinetic Monte Carlo (OKMC) simulation implemented in LAKIMOCA (Becquart and Domain, 2009). This approach and its limitations have been explained and reviewed in many papers, as recently in Becquart et al. (2019), Caturla (2019), and Malerba et al. (2021). SIA and vacancy defects of different sizes are objects in a simulation box. They are created by irradiation events described in the following paragraphs. They diffuse and dissociate (emit single defects) according to predefined probabilities which depend on temperature. When the distance between two objects is smaller than a capture distance, they interact—the defects of the complementary type annihilate, and defects of the same type form larger clusters/objects. For this work, the types of defects are limited to ⟨111⟩ SIA dislocation loops, which are very mobile and stable, and spherical vacancy clusters or nanocavities whose properties will be detailed in Section 4.3. To simulate a TEM sample, the simulation box is 33 nm long along the z direction, with absorbing surfaces, and approximately 500 nm long along the x and y directions, with periodic boundary conditions.
In this section, we describe four novelties in the main sub-models or inputs of our model compared to Becquart et al. (2010). Because we will conduct a sensitivity analysis, for each input, we will define two limit parameter sets, labelled up and low. In some cases, there is also an intermediate parameter set, ref. In what follows, the first described input is the source term, which simulates the primary damage created by high-energy ion irradiation. The second input is the interaction model between defects and impurities (necessary to trap SIA loops up to a high temperature as observed in the experiment). We then describe the diffusion of nanocavities, briefly explaining the results of the multi-objective optimisation detailed in De Backer et al. (2023). Finally, we address the nanocavity dissociation.
4.1 The source term or primary damage of high-energy implanted ions
A high-energy ion loses its kinetic energy in the material during nuclear collisions and via energy exchanges with electrons in less than a few picoseconds. The nuclear collision accelerates one atom of the lattice, which triggers cascades/sub-cascades of displacements that create a strongly damaged and heated region. The primary damage is the description of the crystal defects remaining after the cooling down and lattice recovery. As recommended in Nordlund et al. (2018) and Sublet et al. (2019), our approach goes beyond the simple dpa—the number of displacements per atom—and takes into account the formation of clusters of defects and their spatial distribution in the sub-cascades. Our method, illustrated in Figure 5, combines two approaches to simulate the total damage: the binary collision approximation (BCA) and molecular dynamics (MD).
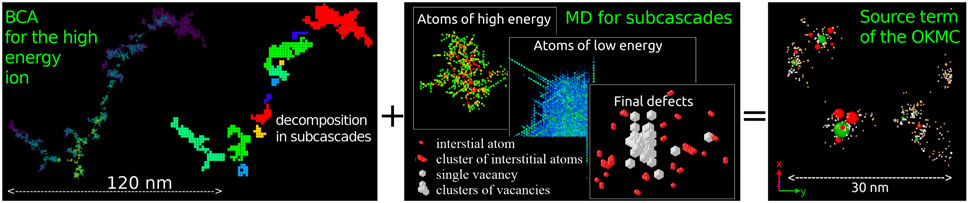
FIGURE 5. Illustration of defect creation modelling by high-energy ions. Left: 1.2-MeV W ion creates cascades/sub-cascades of various volumes simulated with BCA and stored in a first database of thousands of different ion trajectories. Middle: cascades of various energies (0.25–300 keV) are simulated with MD, and the final primary damage is stored in a second database. Right: in the OKMC model, one BCA cascade is picked at random for each irradiation event, and each sub-cascade is replaced by the primary damage of one MD cascade using a correspondence between the sub-cascade volume and the cascade energy. The SIA (resp. VAC) defects in red (resp. green) are larger than 0.5 nm and are considered to be visible by TEM. The smaller and invisible SIA (resp. VAC) defects are in yellow (resp. white).
4.1.1 Database of BCA cascades
The BCA is an approximation that permits the modelling, in reasonable CPU time, of the trajectory of one high-energy ion and the kinetic energy transferred to the atoms it encounters. In this approach, only the trajectories of the impinging particle and the collided atoms are simulated. The collective interactions and the crystal recovery are ignored. Each simulation is one random sampling of the possible trajectories, and statistics of several thousands of simulations are simple to acquire. In our approach, the detection of sub-cascades is obtained with the decomposition method described in De Backer et al. (2018). One example of a 1.2-MeV W ion is illustrated in Figure 5. On the left-hand side is the position of the collisions coloured as a function of time. Yellow indicates what happened at the beginning (before 0.05 ps), and purple, what happened at approximately 0.25 ps. This figure illustrates the deployment in space and time of the successive collisions. Next to the BCA trajectories is the decomposition in 10 sub-cascades represented by cubic cells of identical colour.
Statistics on 1.2 MeV ions indicate that they are stopped before 150 nm (indicating an agreement between SDTrimSP and SRIM). In a 33-nm-thick sample are 3.5 sub-cascades of various volumes, per ion. The histogram of sub-cascade volume follows a decreasing power law (De Backer et al., 2016).
A second series of BCA simulations with ions of smaller energies is necessary for establishing the correspondence between the sub-cascade/cascade volume and its energy—that is, the kinetic energy the atom responsible for the displacement cascade/sub-cascade has received (see section below). It is also necessary to estimate the amount of energy transferred to electrons, for which we used Lindhard’s formula (Lindhard et al., 1963).
4.1.2 Database of MD cascades
In MD, unlike BCA, all atoms are considered and many body interactions are taken into account through interatomic forces given by empirical potentials that are mostly functions of the interatomic distances. To create the cascade, kinetic energy is given to one atom. As illustrated in Figure 5 (centre), a cascade of collisions is obtained involving atoms of high kinetic energy and exhibiting a tree shape like that observed with the BCA. Linear collision sequences are also seen. At the maximum expansion of the cascade, atoms of low energy are involved in collective interactions. Finally, the defects remaining at the end of the cascade’s cooling (after close to a few ps) are visible if all the perfect lattice atoms are removed. They are vacancy defects (usually near the centre of the cascade) and interstitial defects (usually at the surface of the cascade), referred to as “primary damage”.
Using the code “DYMOKA” (Becquart et al., 1997), a database1 of thousands of cascades of energy ranging from 0.25 to 300 keV has been calculated at 100 K using several empirical potentials, as detailed in Supplementary Section S3.2 of the Supplementary Material. It is important to note that, in Becquart et al. (2021) and De Backer et al. (2021), we studied the effect of the empirical potentials on the primary damage of 50-keV cascades in W and 80-keV cascades in Fe. Based on that study, we selected three potentials for this work. Two came from that developed by Finnis and Sinclair (1984): one version modified by Mason et al. (2017) and labelled MNs, and one version modified by Juslin and Wirth (2013) and hardened by Björkas et al. (2009) labelled JW. The third potential is Marinica’s potential (Marinica et al., 2013), which is the hard version described in Sand et al. (2016) and labelled MSh. Quantiles of the vacancy defect in MD cascades performed with MSh, JW, and MNs are calculated to characterise the size distribution. Supplementary Table S1 gives 1% and 0.1%.
Analysis of the primary damage underlines the formation of self-interstitial atoms (SIAs) and vacancies, isolated or agglomerated—forming loops, clusters, or nanocavities.
Many statistical analyses can be performed as a function of the cascade energy. We will focus here on the mean number of defects per cascade and the defect clustering. The latter is illustrated by the mean frequency of defect clusters as a function of the cluster size (SIA and VAC). As expected, the total number of defects increases with the cascade energy. It is larger for MNs than for the other potentials. In addition, as expected after Becquart et al. (2019), the cluster frequency generally decreases as a function of the cluster size, following a power law, and dropping to zero at a maximum cluster size (see Supplementary Figure S4 of the Supplementary Material). Overall, the number of clusters increases with the cascade energy. The size of the largest cluster follows the same trends. For all energies, MNs creates more defects but smaller clusters than the other two potentials. Potential JW creates particularly large clusters, as already observed in the 50-keV cascades analysed in Becquart et al. (2021) and De Backer et al. (2021). To briefly summarize the cascade properties of interest, the MN potential creates more defects but less clustering than the JW potential. MSh causes more intermediate damage. The cascade energy range covers the energy of the sub-cascades created by 1.2-MeV W ions (see the green arrows in Supplementary Figure S3 of the Supplementary Material).
4.1.3 The OKMC source term
The primary damage created by one 1.2-MeV W ion—the source term of our model—is obtained by introducing the primary damage of one MD cascade in each of the BCA sub-cascades, as illustrated in Figure 5. In that figure, a distinction is made between SIA and VAC defects, and between defects that are invisible and visible with TEM (i.e., defects with a diameter smaller or larger than 0.5 nm). In Figure 5, several pockets of defects (sub-cascades) are evident with one visible vacancy cluster (shown in green) surrounded by a few large visible SIA clusters (shown in red) decorated by many defects smaller than the visibility threshold (shown in yellow for SIA and white for VAC).
On average, in the sample thickness, 700 VAC and 700 SIA defects are created per ion. Defect size distributions follow power laws as a result of the convolution of the defect production per sub-cascade and the histogram of sub-cascades created by the high-energy ion. We calculated defect size histograms for the three empirical potentials (Figure 6) and found that there are more than one nanocavity larger than 1 nm for each ion. These nanocavities are created without vacancies having to diffuse, the time scale of the cascade being too short. Thus, the total number of defects and the width of the distributions depend on the potential. In the following sections, the source term using JW will be labelled up, Mhs will be labelled ref, and MNs will be labelled low. More information can be found in Supplementary Section S3.2 of the Supplementary Material.
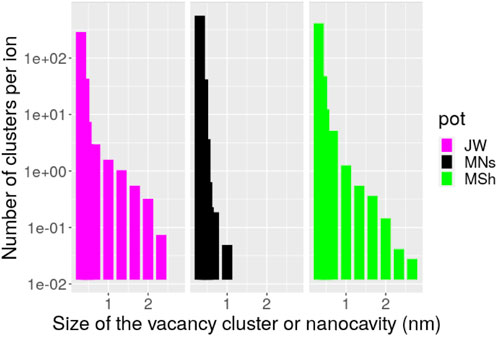
FIGURE 6. Size distributions of the vacancy defects created by 1.2 MeV W ions in a 33-nm-thin sample according to three different interatomic potentials.
4.2 Defect-impurity trapping
The modelling of the microstructure evolution of real material incurs an additional challenge due to the presence of impurities. Even in small quantities, they can impact the microstructure evolution by trapping defects and modifying their properties. Our model takes impurities into account by introducing immobile traps distributed homogeneously in the simulation box. These traps are characterized by their densities and their binding energies with each kind of defect. For this work, we supplement our database in Becquart et al. (2010) of binding energies of mono-vacancies, mono-SIAs, and small SIA loops containing up to 19 SIAs, with up to 30 different elements, which was calculated using density functional theory (DFT). The calculation setup is given in Supplementary Section S4.1 of the Supplementary Material. To facilitate the data analysis, we calculated the detrapping temperature
where
The migration energies of SIA clusters are generally much smaller than the mono-vacancy. The migration energies of the impurities have also been calculated (see Supplementary Table S2 of the Supplementary Material) and are generally larger than the migration energy of the mono-SIA and smaller or similar to the migration energy of the mono-vacancy.
As plotted in Supplementary Figure S6 of the Supplementary Material, the binding energies between impurities and a mono-SIA are up to 4.5–5 eV (for P, Ni, and Co), which correspond to de-trapping temperatures as high as 2,000 K. For interstitial solutes such as C, H, N, and O, the binding energy increases with the SIA defect size. On the other hand, substitutional solutes have a large binding energy, which decreases with the SIA defect size. We observed that the binding energy did not evolve much above 19 SIA. Solutes Zr, Hf, Nb, and Ta interact mildly whatever the size of the SIA defect. The binding energies of impurities with the mono-vacancy are generally smaller than those with the mono-SIA. They are up to 2–3 eV (for C, N and O), which corresponds to de-trapping temperatures close to 1,500 K.
According to the material provider, the main impurities of tungsten are H, Mo, C, O, and P, with concentrations ranging from 300 to 900 atomic ppm. Figure 7 illustrates the strength of the trapping of SIA defects and mono-VAC with graphs where the x-axis indicates the impurity concentration. Within this representation, elements situated on the top right are numerous and strong traps, and hence may be the most likely to modify the defects’ behaviour and the microstructure evolution. In Figure 7A, red points are used for mono-SIAs and are connected to magenta pentagons which represent SIA loops. The connecting line indicates the de-trapping temperature range for SIA defects. In Figure 7B, the green points are used for the mono-vacancies. De-trapping temperatures below the temperature at which the mono-vacancy starts diffusing possibly reflect the release of the impurity from the vacancy defect. Hence, no trapping of nanocavities is considered because our exploratory simulations (in Section 2) suggest that a single impurity cannot block the elementary events involved in the diffusion of nanocavities. Nevertheless, the question remains for the trapping of small vacancy clusters and in cases of many impurities covering an important proportion of the inner surface of the nanocavity.
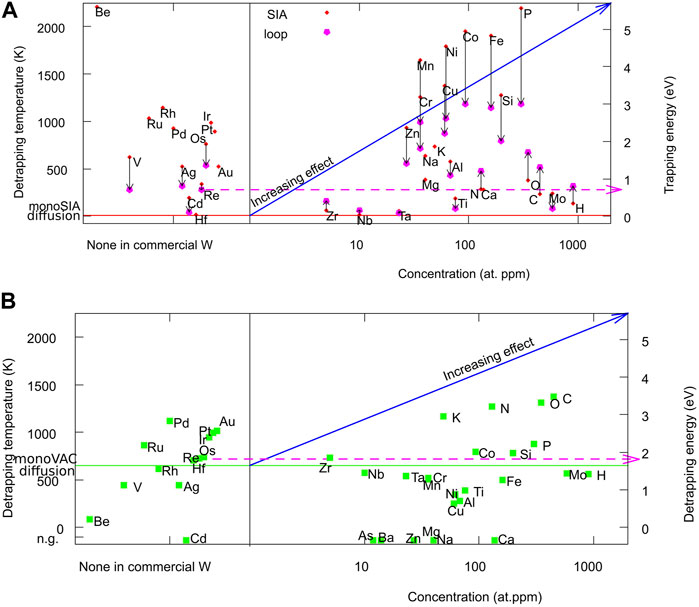
FIGURE 7. (A) Temperature range of the trapping of SIA and a 19-SIA loop by one impurity atom. The x-axis represents the impurity concentration in commercially pure W. (B) De-trapping temperature of the mono-vacancy defect. Dotted arrows indicate increased Re concentrations (by transmutation) when tungsten is exposed to neutrons during 2 years’ operation in the ITER according to Gilbert et al. (2017).
The analysis of Figure 7 shows that H probably has little effect on the trapping of either vacancies and SIAs, whereas P, Fe, and Co atoms strongly affect the trapping of SIA defects. For mono-vacancies, C, O, N, and K are the most important impurities. Dotted arrows indicate increased Re concentration under neutron irradiation (by transmutation), according to Gilbert et al. (2017). This element is not a strong trap, but its impact may be non-negligible with time due to the large concentration increase. Re is also an alloying element (Hwang et al., 2018). Interestingly, Re and Os are found to decorate nanocavities in Lloyd et al. (2019).
For the OKMC parameter set related to the trapping, the main unknown is now the densities of the traps. We cannot simply take the material provider concentrations because it is well known that they will be too large as impurities are rarely present as single atoms but in clusters. In our case, the trapping of the SIA defects is the most important as SIA loops are observed in our experiment, indicating that they have been trapped. Indeed, the velocity of loops in pure material is very high. We tried to adjust the trap densities to obtain good agreement with the experimental results. Unfortunately, we were not able to simultaneously obtain good agreement with both the experimental loop sizes and densities. In this work, the amount of information on the loops is very limited, which makes it difficult to further search for a satisfying answer on the trap densities. For the sensitivity analysis, we take as ref densities the provider concentration divided by 200. The up set then corresponds to four times the ref densities and the low set to no trap at all.
4.3 The diffusion of the nanocavities
In our OKMC, the diffusion of SIA and VAC defects is simulated by a succession of jumps which mainly differ by their jump probability: SIA defects are highly mobile and diffuse (in 1D), whereas VAC defects diffuse in 3D at high temperature. We focus here on the vacancy jump frequency, knowing that the diffusion coefficient can be obtained by the formula (Kong and Lewis, 2006):
where, in the case of bcc crystals,
The different simplification stages are as follows. First, the defects jump as a whole onto the first nearest neighbouring sites. Second, the jump length is the same for clusters of all sizes, but the jump probability depends on the defect size and follows an Arrhenius function:
where
Finally, n, the number of vacancies in the object, and s, the visible defect size (diameter), are related by the expression
The results of the multi-objective optimisation of the diffusion temperatures led to two diffusion parameter sets labelled up and low, as briefly explained in Supplementary Section S5 of the Supplementary Material and in detail in De Backer et al. (2022) and De Backer et al. (2023). The up (resp. low) set includes the values which optimised agreement with the observed density (resp. size) of nanocavities as a function of temperature. The fact that these two sets are different indicates the presence of a Pareto front—a domain of solutions where no improvement of any objective can be obtained without losing another objective. We consider that both up and low limit solutions (plotted in Figure 8) correspond to the uncertainties remaining after the optimisation process.
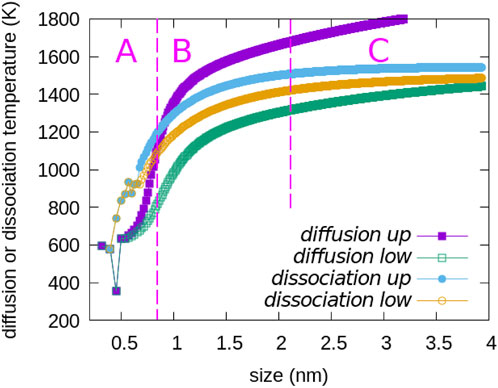
FIGURE 8. Up and low values of the diffusion temperatures, results of the multi-objective optimization, and up and low dissociation temperatures obtained by DFT as a function of the size of the nanocavities. A, B, and C ranges are described in the text.
4.4 Dissociation of nanocavities
The dissociation of the vacancy clusters or nanocavities is simulated by the emission of mono-vacancies from the vacancy defect. In order to determine the uncertainties of the parameters of Becquart et al. (2010), we calculated new formation energies of large size vacancy defects by DFT (see Supplementary Section S6 in the Supplementary Material). Two different capillarity laws representing the upper and lower limit values on the binding energies, labelled as up and low binding energies, have been adjusted. The dissociation temperature, defined as the temperature at which the emission rate is 1 per second, can then obtained from these binding energies. The results for the up and low dissociations are shown in Figure 8. The comparison between the up and low diffusion curves and the up and low dissociation curves shows three domains. A: the diffusion temperature is lower than the dissociation temperature, so diffusion is the dominant process. B: the dissociation temperature lies between the up and low diffusion temperature curves, so diffusion and dissociation are likely to be in competition. Reducing the difference between the up and low diffusion curves could clarify which process predominates. C: the dissociation temperatures become similar to the low diffusion temperatures. The dissociation can dominate or be part of the mechanisms of the nanocavity diffusion, as observed in Section 2. Dissociation alone prevents the existence of nanocavities larger than 2 nm at temperatures higher than 1,500 K. However, the presence of nanocavities in the experiment at higher temperature can be explained by the presence of stabilizing interfaces.
5 Sensitivity analysis of the model
The four principal inputs of our model have been described in the previous section: source term, defect trapping, vacancy defect diffusion, and vacancy defect dissociation. The list of parameter sets is recalled in Table 1. The up and low sets are our upper and lower limit estimates of the parameters. The ref sets are the parameters fixed for the multi-objective optimisation which give the up and down diffusion in De Backer et al. (2022) and De Backer et al. (2023). The possibility “no diffusion,” diff no, and a source term with only Frenkel pairs, ST fp, has been added. The main goal of this sensitivity analysis is to study how strongly the diffusion parameters obtained could be impacted by a change of the other model inputs. We thus perform the sensitivity analysis around both diffusion parameter sets, varying the other parameter sets.
TABLE 1. List of parameter sets for sensitivity analysis.
The constraint of the sensitivity analysis is the computing time of one simulation of a few hours. We then tried to limit the number of simulations while sufficiently exploring the high-dimension space of input parameters. To estimate the sensitivity, we were informed by the multi-objective function defined in De Backer et al. (2022) and De Backer et al. (2023). We therefore defined an objective function ranging from 0 to 1. When it is below 0.5, we considered the disagreement with the experimental data to be unacceptable. The sensitivity of our model is indicated by the difference of the objective function calculated in two input configurations: ref and modified.
The model returns a list of the SIA and VAC defect clusters present in the simulation box at the end of the irradiation and annealing stages. We then focus on the vacancy defects regarding multi-objective optimisation. The outputs will be the total nanocavity densities and mean sizes for each temperature; in this work, these depend on all the input parameters
where T is temperature taking one of the M possible values, OKMC is the simulated stochastic process, θdiff is the diffusion parameter set, and
for j = 1: M where
with S = 1 for density outputs and S = 3 for size outputs, indicating that a change in size is more meaningful than a change in density.
A total of 14 conditions, taking either the up or low diffusion and changing one of the ref parameters by one of its limits, have been simulated and analysed. The cases with significant sensitivity will be studied in the following subsections. The first will concern the dissociation parameters, and the second subsections, the source term. The effect of the trapping is not significant on the nanocavity, but it is necessary for the SIA loops. The results are given in Supplementary Section S7 of the Supplementary Material.
5.1 Sensitivity due to nanocavity dissociation
Figure 9A shows density and size as a function of temperature obtained with the 12 conditions taking either the up or the low diffusion parameter set and one of the three ref, up, or low dissociation parameter sets. Three cases with the diff no parameter set are also shown on these figures. Note that, on these figures, the optimum density and size are the likelihood curves. One sees that, in absence of diffusion when nanocavities can only dissociate, it is not possible to correctly reproduce the experimental densities and size at the end of the irradiation, while, during the annealing stages, only the size is correct above 1,100 K. This agrees with the domain B, where the dissociation starts to compete with the diffusion process. These new simulations confirm that, with the current data, we cannot determine which process dominates in domain B. Next, we see that dissociation has no effect with the low diffusion model, for which the diffusion coefficients become large at low temperature. On the contrary, there is a visible impact of dissociation with the up diffusion parameter set to the temperature range of domains B and C. This is because, in the case of diffusion low, the dissociation will never be effective because all nanocavities diffuse, interact, and disappear at lower temperatures than that necessary to observe dissociation. On the contrary, with the up diffusion parameter set, the disappearance of nanocavities by dissociation before they are set into motion disagrees with the observed densities.
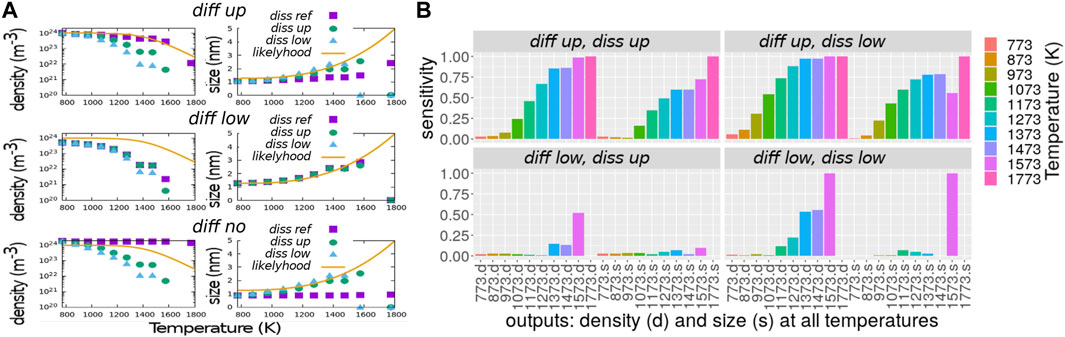
FIGURE 9. Effect of diffusion and dissociation parameter sets. (A) density and size of the nanocavities as a function of temperature for the nine cases obtained combining no, up, and low diffusion parameters and no, up, and low dissociation parameters. (B) Sensitivities calculated using Eq. 6 on the outputs of the six cases.
The sensitivities calculated with Eq. 6 are illustrated by bars on Figure 9B. The sensitivities above 0.5 correspond to the cases described in the previous paragraph. Our equation for the sensitivity is another way of determining the domains A, B, and C. The uncertainty on the dissociation, characterised by the difference between the up and low dissociation, leads to a shift of around 100 K of the limit between A and B.
5.2 Sensitivity due to the source term
The sensitivities obtained by varying the source term parameter sets underline a significant effect of ST low above 1,300 K with both up and low diffusion (see Supplementary Figure S11 of the Supplementary Material). This source term is the one obtained using the MD cascades simulated with the MNs potential. The reason of this sensibility is due to the fact that 99% of the defect clusters, with the MNs potential, are smaller than 4VAC (see 1% quantiles in Supplementary Table S1 of the Supplementary Material) for all energies. These are highly mobile defects. The first consequence is that this increases the amount of recombination with SIA defects during the irradiation, thus reducing the total number of remaining vacancies. The second consequence is that the nanocavities created are less numerous and smaller than the other source terms, so they cannot grow into large nanocavities during the annealing sequences.
Figure 10A shows the nanocavity size histograms at the end of the irradiation obtained with the different source terms (and the low diffusion parameter set). It is evident that MNs gives a symmetrical histogram shifted towards smaller nanocavities than the other source terms ST ref and ST up. The source term made of Frenkel pairs gives the most asymmetrical histogram. On these plots, the red curve represents the experimental results, and there is good agreement with the ref source term obtained using the MSh potential.
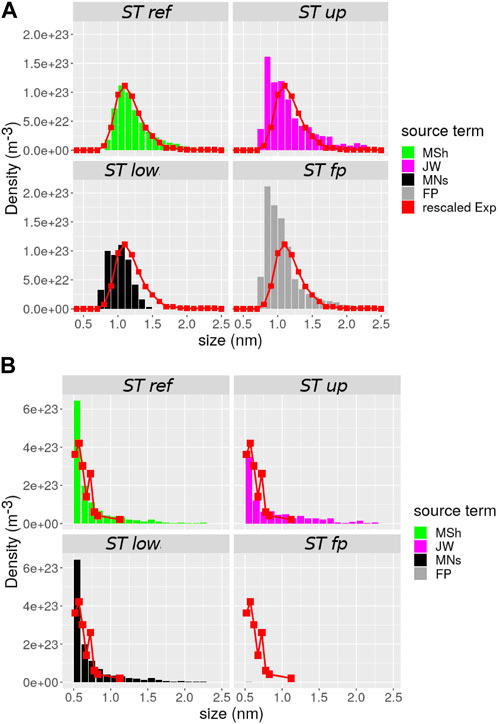
FIGURE 10. Nanocavity size histograms obtained with the different source term parameter sets at 773 K (A) and 300 K (B). The corresponding experimental results are in red and had to be rescaled.
To confirm the sensitivity of our model to the source term, irradiation at a lower temperature of 300 K was simulated and compared to the corresponding experimental results. The size histograms are plotted in Figure 10B. At this temperature, the vacancy defects do not diffuse, and visible nanocavities are created directly within the cascades. Consequently, the size histograms at the end of irradiation are similar to that of the source term (Figure 6). Most vacancy defects are smaller than 0.5 nm and cannot be seen under the microscope. Furthermore, comparing the visible nanocavities obtained with the different empirical potential and in experimental data cannot help demonstrate an effect of the empirical potential unlike that seen with irradiation at 773 K. However, with irradiation at 300 K, one sees that the fp source term gives a size histogram which strongly disagrees with the experimental observations as it does not include nanocavities in the source term.
6 Discussion
Exploration by MD of the elementary events involved in the diffusion of nanocavities highlights the role of creating the pair of surface defects, detrapping ad-atom from a nanocavity vertex, and forming a cluster of surface vacancies. The fast surface diffusion of the ad-atom compared to the vacancy agrees with the migration energies calculated by DFT on (110) surface (Hao et al., 2020). It can be explained by the smaller coordination number of the ad-atom compared to the surface vacancy, which has an impact on the strength of the binding of the defect with the surface along its migration path.
The main elements of discussion of the experimental results are in Autissier et al. (2023). We simply issue a reminder here that the saw-tooth variation in the experimental results is attributed to the use of manual and automatic counting, the variation of the sample transparency, and maybe of the sample composition. The characterisation of the dislocation loops requires more work because of the different orientations they can adopt, which requires many images and the absence of automatic counting. This will be achieved and included in the future model development. This should help build evidence of the role of impurities, for which many calculations have been made, because they are necessary to trap loops at high temperature. The current model does not reproduce the density and mean size of loops at the end of irradiation. However, our results agree with the experimental observation that the loops progressively disappear when temperature increases and are not visible above 1,200 K.
Our OKMC model has already shown its ability to reproduce and explain experimental results (De Backer et al., 2012). Its limitations are known and can save computing time. We neglect the long-range elastic interaction between defects (Mason et al., 2018; Mason et al., 2019) which causes the formation of rafts of dislocation loops or the trapping of loops in ultra-pure tungsten. Here, we consider the main source of trapping to be the impurities and we do not try to model the raft formation. Our method of modelling the primary damage created by high energy ions by combining the BCA and the MD databases does not account for the possible interaction between sub-cascades (De Backer et al., 2018). We observed that our model was able to correctly reproduce the experimentally observed size histogram at the end of the irradiation. However, the simulated density was, in that case, twice smaller than that observed. This can be explained by the fact that MD cascades calculated in the perfect bulk (i.e., our database of cascades) produce smaller defects than cascades calculated near the surface, as shown in Si (Tarus et al., 1998) and Fe (Aliaga et al., 2015).
Elements of the discussion of the multi-objective optimisation which leads to the up and low diffusion parameter sets are in De Backer et al. (2023). It is important to note that we cannot simultaneously reproduce the observed density and size of nanocavities, probably because there is, in the experiment, a source of vacancies not included in the model. We believe that these vacancies are created at the interface between the sample and the native oxide layer when it grows. The sample thickness is small (33 nm). These vacancies could diffuse in the bulk and be a non-negligible quantity as one atomic layer corresponds to 1% of the sample thickness. The growth of the oxide layer is well-known and complex, as explained in research analysing the corrosion mechanisms of zirconium alloys (Lin et al., 2020). Without data in W, this process would introduce many unknown parameters in the optimisation process, and it is thus outside of the scope of this work.
Finally, we consider that the up and low diffusion parameter sets are the upper and lower limits of the uncertainties on the diffusion results of the current experimental data and the model as it stands. Our results fill the gap between what is known regarding the diffusion of small vacancy clusters, the migration energy of which can be calculated, and the diffusion of large nanocavities for which the classical surface theory is valid. The analysis sensitivity indicates that our results could be different if the source term changes but not with a change of the trapping model. Interestingly, sensitivity associated with the nanocavity dissociation reveals three domains of size and temperature where the competition with diffusion is different. In A, the dominating mechanism is the diffusion of the small clusters. In B, the unknowns of the diffusion of the nanocavities are too large to give a definitive answer but they are likely in competition. In C, dissociation limits the possibility of finding large nanocavities at temperatures larger than 1,200 K without the presence of stabilising interfaces, impurities, or other extended defects.
7 Conclusion
We demonstrated that including the diffusion of nanocavities in our OKMC model is necessary for interpreting the growth of nanocavities observed experimentally in tungsten. A multi-objective optimisation gave the upper and lower limits of the diffusion temperature of nanocavities as a function of their size. This required two novelties: a model of the primary damage of high-energy ions beyond the typical dpa and new DFT data on the trapping of point defects by impurities. We have highlighted the variety of elementary events involved in the nanocavity diffusion, and a size threshold of between 1.2 nm (65VAC) and 1.9 nm (175VAC) where the cavity surface is large enough to trap surface vacancies and form a ledge. A sensitivity analysis reveals the importance of the empirical potential chosen to model MD cascades and the source term, and the domains of size (related to temperature) where there is competition with the nanocavity dissociation.
Data availability statement
The original contributions presented in the study are included in the article/Supplementary Material; further inquiries can be directed to the corresponding author.
Author contributions
Category 1, conception and design of the global study: AD, CB, CD, and M-FB; mathematical formulation: AD, ADN, CB, and CD; acquisition of experimental data: EA, CG, FH, and M-FB; acquisition of OKMC data: AD and AS; acquisition of MD data: EH; acquisition of the displacement cascade database and DFT data: CD and CB; analysis and interpretation of experimental data: EA, CG, FH, CD, CB, and M-FB; analysis and interpretation of simulation data: AD, AS, EH, ADN, CD, and CB; Category 2, drafting the manuscript: AD, AS, EH, CD, CB, and M-FB; critical revision of the manuscript for important intellectual content: AD, AS, EH, ADN, CD, CB, and M-FB. Category 3, funding acquisition: CB and M-FB. All authors contributed to the article and approved the submitted version.
Funding
This work was performed within the framework of the EUROfusion Consortium and has received funding from the Euratom research and training program 2014–2018 and 2019–2020 under grant agreement No. 633053. This work was also partly supported by the European project SOTERIA (661913) and contributed to the Joint Program on Nuclear Materials (JPNM) of the European Energy Research Alliance (EERA). The project leading to this publication received funding from the Excellence Initiative of Aix-Marseille University—A*MIDEX, a French Investissements d’Avenir program, as well as from the French National Research Agency (grant no. ANR-18-CE05-0012).
Acknowledgments
Centre de Calcul Intensif d’Aix-Marseille is acknowledged for granting access to its high-performance computing resources. The ICMN laboratory (Orléans, France) is acknowledged for access to the CM20 microscope. The authors thank OVITO developers as images and some analysis were performed with it (Stukowski, 2009).
Conflict of interest
The authors declare that the research was conducted in the absence of any commercial or financial relationships that could be construed as a potential conflict of interest.
Publisher’s note
All claims expressed in this article are solely those of the authors and do not necessarily represent those of their affiliated organizations, or those of the publisher, the editors, and the reviewers. Any product that may be evaluated in this article, or claim that may be made by its manufacturer, is not guaranteed or endorsed by the publisher.
Author disclaimer
The views and opinions expressed herein do not necessarily reflect those of the European Commission.
Supplementary material
The Supplementary Material for this article can be found online at: https://www.frontiersin.org/articles/10.3389/fnuen.2023.1240995/full#supplementary-material
Footnotes
1To be available at https://cascadesdb.iaea.org/
References
Aliaga, M. J., Schäublin, R., Löffler, J. F., and Caturla, M. J. (2015). Surface-induced vacancy loops and damage dispersion in irradiated Fe thin films. Acta Mater. 101, 22–30. doi:10.1016/j.actamat.2015.08.063
Autissier, E., Farah, F., Genevois Mazellier, C., Decamps, B., Schaublin, R., and Barthe, M.-F. (2023). Cavity evolution as a function of temperature in self irradiated tungsten.
Becquart, C. S., De Backer, A., and Domain, C. (2019). “Atomistic modeling of radiation damage in metallic alloys,” in Handbook of mechanics of materials. Editors S. Schmauder, C.-S. Chen, K. K. Chawla, N. Chawla, W. Chen, and Y. Kagawa (Singapore: Springer Singapore), 673–701.
Becquart, C. S., De Backer, A., Olsson, P., and Domain, C. (2021). Modelling the primary damage in fe and w: influence of the short range interactions on the cascade properties: part 1 – energy transfer. J. Nucl. Mater. 547, 152816. doi:10.1016/j.jnucmat.2021.152816
Becquart, C. S., Decker, K. M., Domain, C., Ruste, J., Souffez, Y., Turbatte, J. C., et al. (1997). Massively parallel molecular dynamics simulations with eam potentials. Radiat. Eff. Defects Solids 142, 9–21. doi:10.1080/10420159708211592
Becquart, C. S., and Domain, C. (2009). An object Kinetic Monte Carlo Simulation of the dynamics of helium and point defects in tungsten. J. Nucl. Mater. 385, 223–227. doi:10.1016/j.jnucmat.2008.11.027
Becquart, C. S., Domain, C., Sarkar, U., DeBacker, A., and Hou, M. (2010). Microstructural evolution of irradiated tungsten: ab initio parameterisation of an OKMC model. J. Nucl. Mater. 403, 75–88. doi:10.1016/j.jnucmat.2010.06.003
Björkas, C., Nordlund, K., and Dudarev, S. (2009). Modelling radiation effects using the ab-initio based tungsten and vanadium potentials. Nucl. Instrum. Methods Phys. Res. Sect. B Beam Interact. Mater. Atoms 267, 3204–3208. doi:10.1016/j.nimb.2009.06.123
Byggmästar, J., Hamedani, A., Nordlund, K., and Djurabekova, F. (2019). Machine-learning interatomic potential for radiation damage and defects in tungsten. Phys. Rev. B 100, 144105. doi:10.1103/physrevb.100.144105
Castin, N., Bakaev, A., Bonny, G., Sand, A. E., Malerba, L., and Terentyev, D. (2017). On the onset of void swelling in pure tungsten under neutron irradiation: an object kinetic Monte Carlo approach. J. Nucl. Mater. 493, 280–293. doi:10.1016/j.jnucmat.2017.06.008
Caturla, M. J. (2019). Object kinetic Monte Carlo methods applied to modeling radiation effects in materials. Comput. Mater. Sci. 156, 452–459. doi:10.1016/j.commatsci.2018.05.024
De Backer, A., Lhuillier, P. E., Becquart, C. S., and Barthe, M. F. (2012). Modelling of the implantation and the annealing stages of 800keV 3He implanted tungsten: formation of nanovoids in the near surface region. J. Nucl. Mater. 429, 78–91. doi:10.1016/j.jnucmat.2012.05.024
De Backer, A., Sand, A. E., Nordlund, K., Luneville, L., Simeone, D., and Dudarev, S. L. (2016). Subcascade formation and defect cluster size scaling in high-energy collision events in metals. EPL Europhys. Lett. 115, 26001. doi:10.1209/0295-5075/115/26001
De Backer, A., Domain, C., Becquart, C. S., Luneville, L., Simeone, D., Sand, A. E., et al. (2018). A model of defect cluster creation in fragmented cascades in metals based on morphological analysis. J. Phys. Condens. Matter 30, 405701. doi:10.1088/1361-648x/aadb4e
De Backer, A., Becquart, C. S., Olsson, P., and Domain, C. (2021). Modelling the primary damage in fe and w: influence of the short-range interactions on the cascade properties: part 2 – multivariate multiple linear regression analysis of displacement cascades. J. Nucl. Mater. 549, 152887. doi:10.1016/j.jnucmat.2021.152887
De Backer, A., Souidi, A., Hodille, E. A., Autissier, E., Genevois, C., Haddad, F., et al. (2022). Multiobjective optimization of the nanocavities diffusion in irradiated metals. Phys. Sci. Forum 5, 41. doi:10.3390/psf2022005041
De Backer, A., Souidi, A., Hodille, E. A., Autissier, E., Genevois, C., Haddad, F., et al. (2023). Multi-objective optimization of the nanocavity growth model in irradiated metals. Submitted.
Finnis, M. W., and Sinclair, J. E. (1984). A simple empirical n-body potential for transition metals. Philos. Mag. A 50, 45–55. doi:10.1080/01418618408244210
Gilbert, M. R., Sublet, J.-C., and Dudarev, S. L. (2017). Spatial heterogeneity of tungsten transmutation in a fusion device. Nucl. Fusion 57, 044002. doi:10.1088/1741-4326/aa5e2e
Goodhew, P. J., Tyler, S. K., and Kelly, A. (1981). Helium bubble behaviour in b. c. c. metals below 0.65Tm. Proc. R. Soc. Lond. A. Math. Phys. Sci. 377, 151–184. doi:10.1098/rspa.1981.0120
Hao, J., Jin, S., Lu, G.-H., and Xu, H. (2020). Migration energy barriers and diffusion anisotropy of point defects on tungsten surfaces. Comput. Mater. Sci. 184, 109893. doi:10.1016/j.commatsci.2020.109893
Hasanzadeh, S., Schäublin, R., Décamps, B., Rousson, V., Autissier, E., Barthe, M. F., et al. (2018). Three-dimensional scanning transmission electron microscopy of dislocation loops in tungsten. Micron 113, 24–33. doi:10.1016/j.micron.2018.05.010
Hwang, T., Hasegawa, A., Tomura, K., Ebisawa, N., Toyama, T., Nagai, Y., et al. (2018). Effect of neutron irradiation on rhenium cluster formation in tungsten and tungsten-rhenium alloys. J. Nucl. Mater. 507, 78–86. doi:10.1016/j.jnucmat.2018.04.031
Jansson, V., and Malerba, L. (2013). Simulation of the nanostructure evolution under irradiation in Fe–C alloys. J. Nucl. Mater. 443, 274–285. doi:10.1016/j.jnucmat.2013.07.046
Juslin, N., and Wirth, B. (2013). Interatomic potentials for simulation of he bubble formation in w. J. Nucl. Mater. 432, 61–66. doi:10.1016/j.jnucmat.2012.07.023
Kong, L. T., and Lewis, L. J. (2006). Transition state theory of the preexponential factors for self-diffusion on cu, ag, and ni surfaces. Phys. Rev. B 74, 073412. doi:10.1103/physrevb.74.073412
Lin, C., Ruan, H., and Shi, S.-Q. (2020). Mechanical–chemical coupling phase-field modeling for inhomogeneous oxidation of zirconium induced by stress–oxidation interaction. npj Mater Degrad. 4, 22. doi:10.1038/s41529-020-00125-6
Lindhard, J., Scharff, M., and Schioett, H. E. (1963). Range concepts and heavy ion ranges (notes on atomic collisions, ii). Kgl. Dan. Vidensk. Selsk. Mat. Fys. Medd. 33.
Lloyd, M. J., Abernethy, R. G., Gilbert, M. R., Griffiths, I., Bagot, P. A., Nguyen-Manh, D., et al. (2019). Decoration of voids with rhenium and osmium transmutation products in neutron irradiated single crystal tungsten. Scr. Mater. 173, 96–100. doi:10.1016/j.scriptamat.2019.07.036
Malerba, L., Anento, N., Balbuena, J., Becquart, C., Castin, N., Caturla, M., et al. (2021). Physical mechanisms and parameters for models of microstructure evolution under irradiation in fe alloys – part i: pure fe. Nucl. Mater. Energy 29, 101069. doi:10.1016/j.nme.2021.101069
Marinica, M.-C., Ventelon, L., Gilbert, M. R., Proville, L., Dudarev, S. L., Marian, J., et al. (2013). Interatomic potentials for modelling radiation defects and dislocations in tungsten. J. Phys. Condens. Matter 25, 395502. doi:10.1088/0953-8984/25/39/395502
Mason, D. R., Nguyen-Manh, D., and Becquart, C. S. (2017). An empirical potential for simulating vacancy clusters in tungsten. J. Phys. Condens. Matter 29, 505501. doi:10.1088/1361-648x/aa9776
Mason, D. R., Sand, A. E., and Dudarev, S. L. (2019). Atomistic-object kinetic Monte Carlo simulations of irradiation damage in tungsten. Model. Simul. Mater. Sci. Eng. 27, 055003. doi:10.1088/1361-651x/ab1a1e
Mason, D. R., Sand, A. E., Yi, X., and Dudarev, S. L. (2018). Direct observation of the spatial distribution of primary cascade damage in tungsten. Acta Mater. 144, 905–917. doi:10.1016/j.actamat.2017.10.031
Nichols, F. A. (1969). Kinetics of diffusional motion of pores in solids: a review. J. Nucl. Mater. 30, 143–165. doi:10.1016/0022-3115(69)90176-7
Nordlund, K., Zinkle, S. J., Sand, A. E., Granberg, F., Averback, R. S., Stoller, R., et al. (2018). Improving atomic displacement and replacement calculations with physically realistic damage models. Nat. Commun. 9, 1084. doi:10.1038/s41467-018-03415-5
Pannier, B. (2017). Towards the prediction of microstructure evolution under irradiation of model ferritic alloys with an hybrid AKMC-OKMC approach.
Perez, D., Sandoval, L., Blondel, S., Wirth, B. D., Uberuaga, B. P., and Voter, A. F. (2017). The mobility of small vacancy/helium complexes in tungsten and its impact on retention in fusion-relevant conditions. Sci. Rep. 7, 2522. doi:10.1038/s41598-017-02428-2
Plimpton, S. (1995). Fast parallel algorithms for short-range molecular dynamics. J. Comput. Phys. 117, 1–19. doi:10.1006/jcph.1995.1039
Sand, A. E., Dequeker, J., Becquart, C. S., Domain, C., and Nordlund, K. (2016). Non-equilibrium properties of interatomic potentials in cascade simulations in tungsten. J. Nucl. Mater. 470, 119–127. doi:10.1016/j.jnucmat.2015.12.012
Stoller, R. E., Toloczko, M. B., Was, G. S., Certain, A. G., Dwaraknath, S., and Garner, F. A. (2013). On the use of SRIM for computing radiation damage exposure. Nucl. Instrum. Methods Phys. Res. Sect. B Beam Interact. Mater. Atoms 310, 75–80. doi:10.1016/j.nimb.2013.05.008
Stukowski, A. (2009). Visualization and analysis of atomistic simulation data with OVITO–the Open Visualization Tool. Model. Simul. Mater. Sci. Eng. 18, 015012. doi:10.1088/0965-0393/18/1/015012
Sublet, J. C., Bondarenko, I. P., Bonny, G., Conlin, J. L., Gilbert, M. R., Greenwood, L. R., et al. (2019). Neutron-induced damage simulations: beyond defect production cross-section, displacement per atom and iron-based metrics. Eur. Phys. J. Plus 134, 350. doi:10.1140/epjp/i2019-12758-y
Tarus, J., Nordlund, K., Kuronen, A., and Keinonen, J. (1998). Effect of surface on defect creation by self-ion bombardment of si(001). Phys. Rev. B 58, 9907–9915. doi:10.1103/physrevb.58.9907
Vitos, L., Ruban, A. V., Skriver, H. L., and Kollár, J. (1998). The surface energy of metals. Surf. Sci. 411, 186–202. doi:10.1016/s0039-6028(98)00363-x
Zell, V., Trinkaus, H., and Schroeder, H. (1994). A simulation study of the migration and coalescence of gas bubbles in metals. J. Nucl. Mater. 212-215, 320–324. doi:10.1016/0022-3115(94)90079-5
Keywords: nanocavity diffusion, microstructure evolution, irradiation damage, OKMC, tungsten
Citation: De Backer A, Souidi A, Hodille EA, Autissier E, Genevois C, Haddad F, Della Noce A, Domain C, Becquart CS and Barthe M-F (2023) Readdressing nanocavity diffusion in tungsten. Front. Nucl. Eng. 2:1240995. doi: 10.3389/fnuen.2023.1240995
Received: 15 June 2023; Accepted: 02 October 2023;
Published: 30 October 2023.
Edited by:
Xiao-Ying Yu, Pacific Northwest National Laboratory (DOE), United StatesReviewed by:
Benjamin Lamm, Oak Ridge National Laboratory (DOE), United StatesYuri Osetsky, Oak Ridge National Laboratory (DOE), United States
Copyright © 2023 De Backer, Souidi, Hodille, Autissier, Genevois, Haddad, Della Noce, Domain, Becquart and Barthe. This is an open-access article distributed under the terms of the Creative Commons Attribution License (CC BY). The use, distribution or reproduction in other forums is permitted, provided the original author(s) and the copyright owner(s) are credited and that the original publication in this journal is cited, in accordance with accepted academic practice. No use, distribution or reproduction is permitted which does not comply with these terms.
*Correspondence: Andrée De Backer, YW5kcmVlLmRlYmFja2VyQGdtYWlsLmNvbQ==