- TU Bergakademie Freiberg, Institut für Anorganische Chemie, Freiberg, Germany
For geochemical calculations of solubility equilibria between Sorel phases, Mg(OH)2, and oceanic salt solutions, the polythermal THEREDA dataset (based on the HMW model at 25°C) was extended. With both models, H+ solution concentrations in equilibrium with Mg(OH)2(s) and the 3-1-8 Sorel phase at 25°C can be calculated in good agreement. In contrast, calculated OH− solution concentrations do not agree. Using the solubility constants (lg Ks) determined up to 60°C in Part I of this work, together with available solubility isotherms up to 120°C, temperature functions for the 3-1-8 phase (25°C–100°C), 2-1-4 phase (60°C–120°C), and 9-1-4 phase (100°C–120°C) were derived. In order to accurately model the OH− solution concentrations, it was necessary to implement the solution species Mg3(OH)42+ (∆RGm° temperature function) in addition to the MgOH+ already contained in the previous model. Finally, fitting Pitzer mixing coefficients for both species now allow the calculation of the solubility equilibria of Mg(OH)2(s) and the Sorel phases in agreement with the experimental data in the Mg-Cl-OH-H2O and Na-Mg-Cl-OH-H2O systems.
1 Introduction
Geochemical modeling is an integral tool in the safety assessment of radioactive waste repositories in deep geological formations. The long-term stability of geotechnical barriers and backfill materials must be confirmed under relevant geochemical conditions, such as a saline host rock in the presence of a complex salt solution. Sorel phases are the binder phases of MgO-based building material used for constructing geotechnical barriers (plugs and sealing systems) in the host of rock salt. With the experimentally determined solid–liquid equilibria of Sorel phases and Mg(OH)2(s) in Part I of this work (Pannach et al., 2023), including the data of Altmaier et al. (2003) and Pannach et al. (2017), the long-term stability of magnesia building material (Sorel phases) in contact with solutions in a saline environment (NaCl saturated with already-minor concentrations of MgCl2) has been proven. These data, together with those of Mg(OH)2(s), allow an extension of the geochemical dataset of Pitzer’s ion interaction model (Pitzer, 1991) to calculate the solubility equilibria of Sorel phases and Mg(OH)2(s) in solutions of the oceanic salt system. They also allow the calculation of the pHm values (-lg m (H+) = pHm) that evolve in the presence of Sorel phases or Mg(OH)2. The weakly alkaline milieu generated offers favorable geochemical conditions (e.g., by buffering the pH and limiting carbonate concentration) to minimize radionuclide transport processes via potential salt solutions.
The first Pitzer dataset was developed by Harvie et al. (1984) (HMW model) for modeling mineral solubilities in the complex system of Na-K-Mg-Ca-H-Cl-SO4-OH-HCO3-CO3-CO2-H2O at 25°C. The model contains ion interaction coefficients and standard Gibbs energies for aqueous solution species such as MgOH+ and for solid phases like Mg(OH)2 (brucite) and the 3-1-8 Sorel phase (3Mg(OH)2∙MgCl2∙8H2O = 2 Mg2Cl(OH)3∙4H2O, korshunovskite).
The HMW model valid for 25°C was used in 2006 as the basis for developing a polythermal THEREDA database of the system Na-K-Mg-Ca-H-Cl-SO4-CO3-OH-H2O for a temperature range of 0°C–100°C (for certain subsystems, the range is extended to 200°C or 250°C). The main objective of THEREDA was to provide a comprehensive and internally consistent thermodynamic reference database for the geochemical modeling of near- and far-field processes in radioactive waste repositories in rock formations currently under discussion in Germany. For the host rock salt, THEREDA is the only database in the world that provides a polythermal model that covers the entire system of oceanic salts, including acids and bases (Voigt et al., 2007; www.thereda.de).
2 Previous data and model situation
The THEREDA model contains some improvements for the oceanic system to the underlying HMW model at 25°C. Examples are: the correct chemical formula of kainite is used (4KCl·4MgSO4·11H2O instead of KCl·MgSO4·3H2O); the missing mineral goergeyite (K2SO4·5CaSO4·H2O) is included, which has a crystallization field at 298 K; the solubility of KCl is described more correctly; the water activity of gypsum/anhydrite transition at NaCl saturation is shifted to the more acceptable value of 0.84–0.85 (instead of 0.775 in the HMW model); two additional aqueous solution species (KMgSO4+ and KCaSO4+) have been implemented, which was necessary in order to describe solubilities at enhanced temperatures.
As the solubility of Mg(OH)2(s) in water is mMg(OH)2 < 2·10−5, experimental data such as activity and osmotic coefficients are not available to determine binary Pitzer coefficients. Since sufficient data from ternary systems containing magnesium and hydroxide were not available until 2017, no parameters could be derived from these systems either. The temperature-dependent parameters given in THEREDA had been derived from adjustments to the solubility data of the binary system Mg(OH)2-H2O. As per Harvie et al. (1984) for 25 °C, the solubility constant of Mg(OH)2(s) was adapted from the data of McGee and Hostetler (1977) (values up to 90°C) fitting the temperature function up to 250°C to the solubility data of the system Mg(OH)2-H2O (Travers, 1929; Lambert and Clever, 1992). Analogous to HMW, all binary interactions Mg2+-OH− were assigned to the complex species MgOH+. Its temperature function was adapted according to the stability constants published by Palmer and Wesolowski (1997). Due to the lack of data before 2017 for the system Mg(OH)2-MgCl2-H2O at higher temperatures, parameters and the solubility constant for the Sorel phase 3-1-8 could only be given for 25°C and were taken unchanged from Harvie et al. (1984).
In the comparing HMW and THEREDA, the deviation in the description of the solubility of Mg(OH)2 and the 3-1-8 phase at 25°C in the ternary Mg-Cl-OH-H2O system (Figure 1A) is mainly due to the deviating stability constant of the complex species MgOH+, which originates from the re-determination of Palmer and Wesolowski (1997). Figure 1A shows the newer solubility data from Pannach et al. (2017); as discussed there, the experimental data determined by Robinson and Waggaman (1909) are generally too low. The calculated isotherms with both HMW and THEREDA for the ternary system Mg-Cl-OH-H2O describe quite well the invariant point of Mg(OH)2 and the 3-1-8 phase at 1.75 mMgCl2 but not the experimentally determined OH− solution concentrations (Pannach et al., 2017) over the entire MgCl2 concentration range. The model values in the presence of Mg(OH)2(s) and the 3-1-8 phase up to 3.5 mMgCl2 are too low, and above are too high. This is because Harvie et al. (1984) is fitted to the solubility data of D'Ans et al. (1955) (open symbols in Figure 1). However, these data do not belong to the ternary system but to the NaCl-containing Na-Mg-Cl-OH-H2O due to the use of NaOH solution to precipitate the solids from the different MgCl2 solutions.
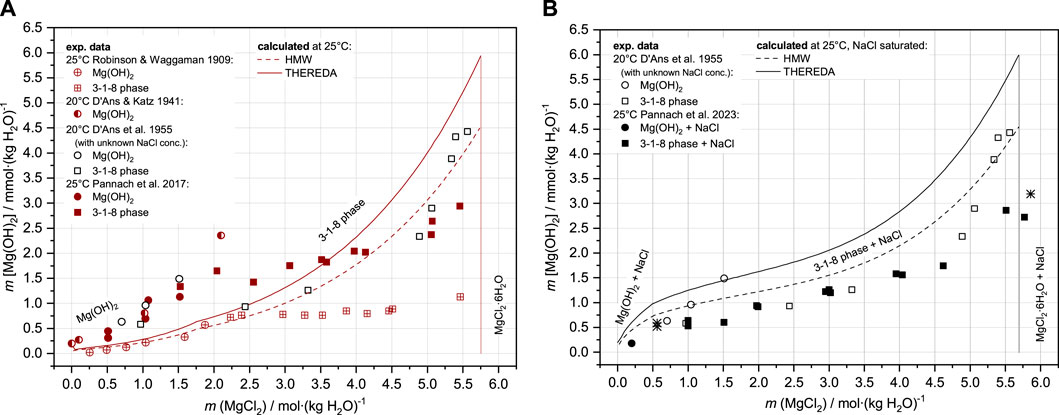
FIGURE 1. Solubility data for the Mg-Cl-OH-H2O system (A) and the Na-Mg-Cl-OH-H2O system (B) at 25 °C and the data from D’Ans et al. at 20 °C compared to the HMW and THEREDA models.
In NaCl-saturated MgCl2 solutions, the OH− concentrations (given as Mg(OH)2 molality in the diagrams, representative of half of the OH− solution concentration) are generally calculated too high, as can be seen in Figure 1B, in comparison with the experimental data from Part I of this work (Pannach et al., 2023) and the data of D’Ans et al. (1955) at unknown NaCl concentrations.
Contrary to OH−, the H+ concentrations (as -lg m (H+) = pHm) in equilibrium with Mg(OH)2(s) and 3-1-8 phase calculated by both models agree with the experimental data (Figure 2). The agreement between modeled and experimental results is clear in both logarithmic and non-logarithmic plots (the latter is not illustrated).
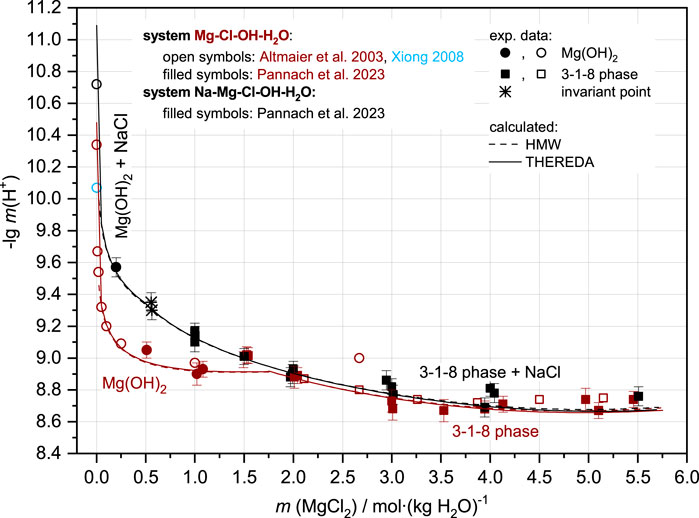
FIGURE 2. Comparison between H+ equilibrium concentrations as -lg m (H+) = pHm from experimental data and HMW and THEREDA models for the Mg-Cl-OH-H2O (brown symbols and line) and Na-Mg-Cl-OH-H2O systems at NaCl saturation (black symbols and line) at 25°C.
In summary, neither the HMW nor the THEREDA model sufficiently describes the OH− concentrations in equilibrium with Mg(OH)2(s) and the Sorel phase. Hence, with the new experimental data, with OH− equilibrium concentrations in the Mg-Cl-OH-H2O system up to 120°C (Pannach et al., 2017), in the Na-Mg-Cl-OH-H2O system up to 40°C, and the solubility constants of Sorel phases at 25°C, 40°C, and 60°C (Part I of this paper—Pannach et al., 2023), the model was adjusted and expanded; this included the Sorel phases 3-1-8, 9-1-4, and 2-1-4, and the metastable 5-1-8 phase.
3 Procedure for model adjustment
For fitting and extending the model, the solubility constants of the Sorel phases (Part I of this work) were first implemented in a test dataset. These KS values were further constrained within their given uncertainty range by fitting them to the experimentally available invariant points (IP) at the corresponding MgCl2 concentration (or the MgCl2 concentration range in which they are expected) in the Mg-Cl-OH-H2O (Pannach et al., 2017) and Na-Mg-Cl-OH-H2O systems (Part I of this work). At first, the lgKS of the 3-1-8 phase was constrained by the IP with Mg(OH)2(s), which is possible because the lgKS of Mg(OH)2(s) is fixed in the THEREDA dataset. Using the lgKS of the 3-1-8 phase thus fixed, lgKS of the 2-1-4 was then refined using their common IPs (3-1-8 + 2-1-4). At higher temperatures of 100°C and 120°C, where Mg(OH)2(s) borders the 9-1-4 phase, their IPs were used to determine the lgKS values of the 9-1-4 phase. At these two temperatures, IPs of the 9-1-4 and 2-1-4 phases were then used to determine the lgKS of the 2-1-4 phase at 100°C and 120°C. More precise KS and ∆RGm values were thus obtained with significantly smaller corresponding errors. A temperature function was then derived from the single ∆RGm° values of each Sorel phase and finally implemented in the THEREDA dataset (Section 4.1). The second step (Section 4.2) was to fit the Pitzer parameters in the presence of the fixed solubility constants, where it became apparent that an extension of the OH− speciation model was also necessary (Section 4.2.2). Only then was it possible to successfully fit Pitzer parameters to reproduce the OH− solution concentrations of both systems (Section 4.2.3).
All calculations were performed using the ChemSage (Eriksson and Hack, 1990) or ChemApp (Eriksson et al., 1997) codes. For adjustments, a specially written C-program was used, implemented in ChemApp, to calculate the smallest error sum of squares between the experimental and calculated values for up to three parameters to be changed, within the specified limits for all possible combinations. This was applied to determine the final Pitzer parameters, with subsequent fine-tuning performed on the optical trend of each isotherm.
4 THEREDA model adaption on Sorel phases
For the title system, the THEREDA model already contains molal standard Gibbs energies ∆RGm°, which correspond to the solubility constants Ks, (Eq. 1), as well as the Pitzer coefficients as summarized in Table 1.
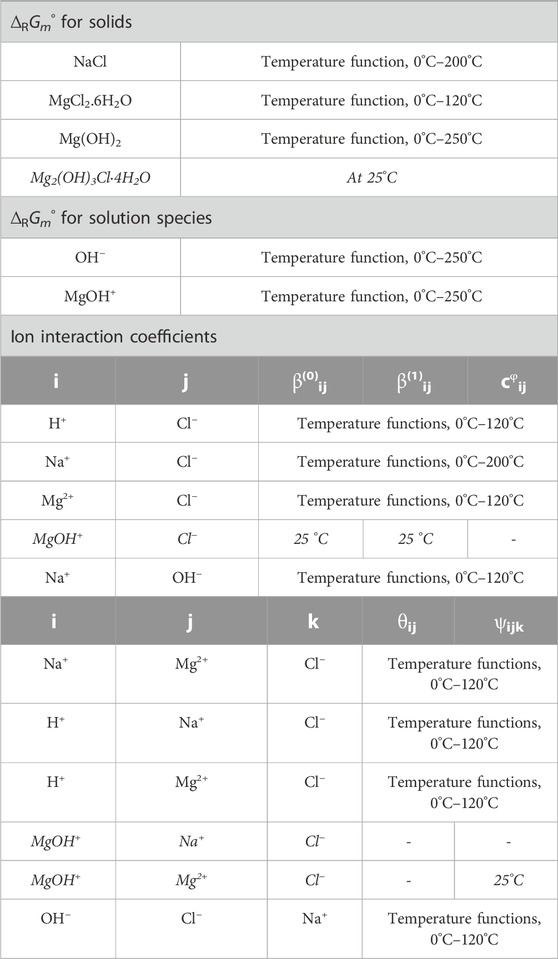
TABLE 1. Overview of solid phases, solution species, and ion interactions already provided in THEREDA for the title system by molal standard Gibbs energies of reaction (∆RGm°) and Pitzer coefficients. Note that, for all Primary Master species in THEREDA, ∆RH°i,T=T0, ∆RS°i,T=T0 = 0, and thus ∆RG°i,T=T0 = 0. Primary Master species of the title system are Na+, Mg2+, Cl−, H+, and H2O (all further species and solids are formed from them by corresponding formation reactions).
Where the data in Table 1 are written in non-italics, no changes were made for the extension of THEREDA by the Sorel phases, as subsystems such as NaCl-H2O, MgCl2-H2O, Mg(OH)2-H2O, NaOH-H2O, and NaCl-MgCl2-H2O were already described well by the model.
4.1 Solubility constants and T-functions for Sorel phases
Solubility constants for the Sorel phases at different temperatures are available from Part I of this work (Pannach et al., 2023) and are shown in Table 2. The values in bold are used for model parameterization.

TABLE 2. Solubility constants (lg KS) for the Sorel phases 3-1-8, 5-1-8 and 2-1-4 determined in Part I of this work (Pannach et al., 2023) compared to available data from the literature. The values in bold are used for model fitting. No data are available for the 9-1-4 phase.
4.1.1 Sorel phase 3-1-8
The standard Gibbs energy proposed by the HMW model (Harvie et al., 1984) and the corresponding solubility constant for the reaction:
is already contained in the THEREDA model and is within the error range, with the overall mean value lg KS,3-1-8,25°C = −26.1 ± 0.2 at 25°C given in Table 2. From this value, ∆RGm° = 149.0 ± 1.1 kJ mol-1 is calculated. To fix the value within the error range, the invariant point (IP) of Mg(OH)2(s) and 3-1-8 phase in the Na-Mg-Cl-OH-H2O system (at NaCl saturation) experimentally determined in Part I was used (none is available from the ternary Mg-Cl-OH-H2O system). To reproduce this IP at 0.56 ± 0.1 mMgCl2 by the model, ∆RGm°,25°C narrows to 148.7 ± 0.1 kJ mol-1, which corresponds to lg Ks = −26.046 ± 0.011 (Figure 3).
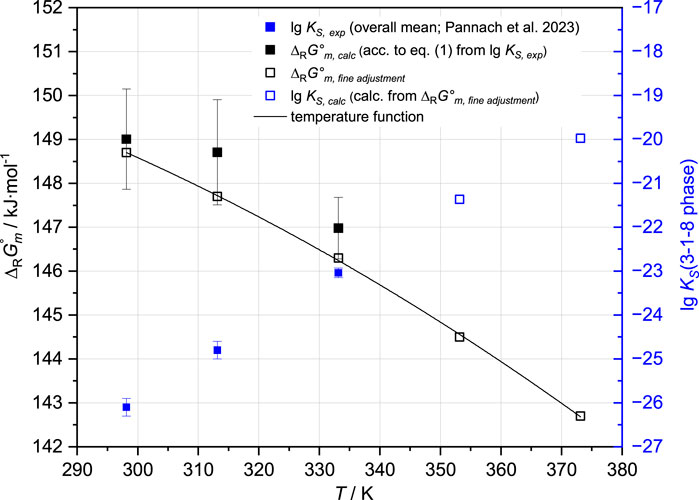
FIGURE 3. ∆RGm° function of the 3-1-8 phase resulting from the single isotherm values of the experimentally determined lg KS,3-1-8 at 25°C, 40°C, and 60°C, together with available solubility data, the positions of IP’s with this phase up to 100°C in the Mg-Cl-OH-H2O system, and at 25°C and 40°C in the Na-Mg-Cl-OH-H2O system (Pannach et al., 2017; Pannach et al., 2023).
No experimental IP of the Mg(OH)2(s) and 3-1-8 phase is available to refine the ∆RGm°,40°C (148.7 ± 1.2 kJ mol-1) calculated from the solubility constant at 40 °C (lg KS,3-1-8,40°C = −24.8 ± 0.2). However, according to the solubility data for Mg(OH)2 and the 3-1-8 phase, the IP is expected to be between 1.6 and 2.0–2.5 mMgCl2 in the Mg-Cl-OH-H2O system and between 1.0 and 1.5 mMgCl2 in the NaCl-saturated solutions (Na-Mg-Cl-OH-H2O system) at 40°C. To ensure that the model does not slip below 1.0 mMgCl2 at NaCl saturation and remains in the IP range for the Mg-Cl-OH-H2O system, ∆RGm°,40°C cannot exceed 147.7 kJ mol-1, which corresponds to the lower error limit resulting from KS,3-1-8,40°C (Figure 3).
At 60°C, only solubility data in the Mg-Cl-OH-H2O system are available to fix ∆RGm°,60°C calculated from the mean value of the solubility constant lg KS,3-1-8,60°C = −23.04 ± 0.11 (Table 2) resulting in 147.0 ± 0.7 kJ mol-1. The IP of Mg(OH)2(s) and the 3-1-8 phase is expected between 2.6 and 3.0 mMgCl2, which limits ∆RGm°,60°C to 146.3 ± 0.2 kJ mol-1.
At 80 °C, no solubility constant is available, so the IP of Mg(OH)2(s) and the 3-1-8 phase in the Mg-Cl-OH-H2O system is expected to be between 3.2 and 4.0. In addition, the experimentally determined IP of the 3-1-8 and 2-1-4 phases was found at 5.8 mMgCl2. This concentration should be reproduced by the model with ±0.1 mMgCl2 alongside the expected IP range of the Mg(OH)2(s) and 3-1-8 phase, constraining ∆RGm°,80°C to 144.5 ± 0.2 kJ mol-1 (re-calculating lg KS,3-1-8,80°C = −21.369 ± 0.011).
Using all the determined values for ∆RGm°,3-1-8 for the different temperatures (open squares in Figure 3), the THEREDA-conforming temperature function
was fitted and extrapolated to 100°C. According to the experimental data at 100°C, the 3-1-8 phase is replaced by the 9-1-4 phase (Pannach et al., 2017). In order to model the metastable range, the ∆RGm° obtained by extrapolation had to be slightly shifted to ∆RGm°,100°C = 142.8 kJ mol-1. The finally fitted ∆RGm°,3-1-8 (T) function (Table 3) calculates ∆RGm°,100°C = 142.59 kJ mol-1 and is shown in Figure 3 together with all single values at the different temperatures.
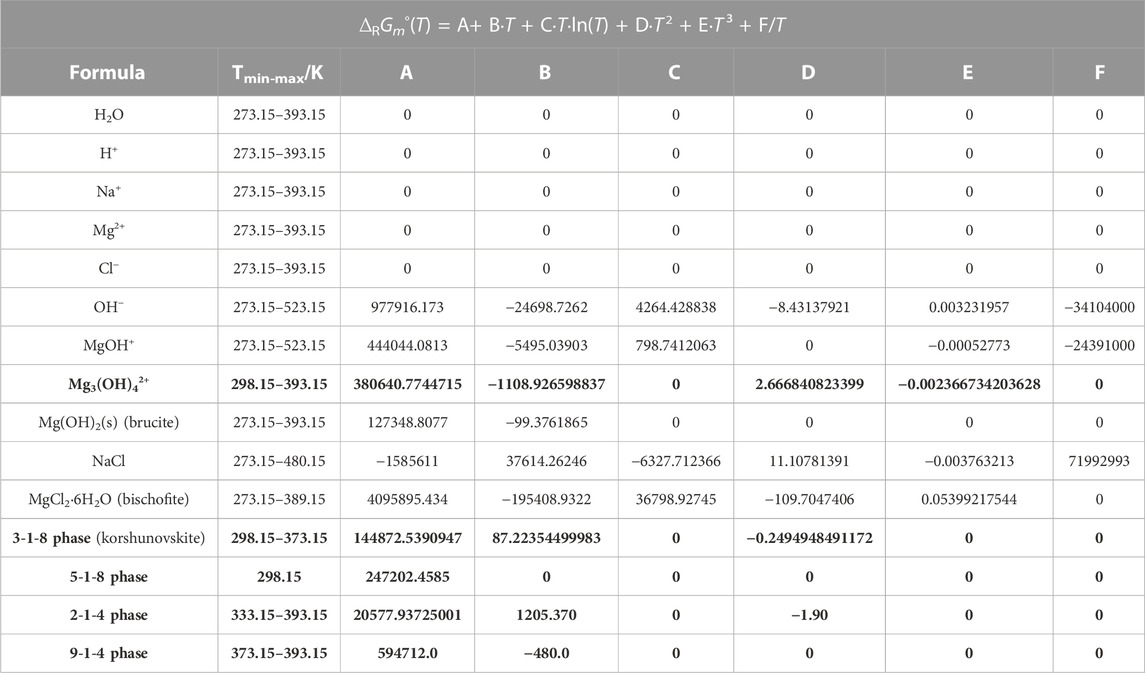
TABLE 3. Temperature coefficients for the standard Gibbs energy ∆RGm° for the formation of species or phases from ions and water for the title system Na-Mg-Cl-OH-H2O and subsystem in THEREDA. The new data from this work are highlighted in bold.
4.1.2 Sorel phase 2-1-4
The Sorel phase 2-1-4 is stable from 60 °C and was found in the Mg-Cl-OH-H2O system at higher MgCl2 solution concentrations during the investigations of Pannach et al. (2017). The solubility constant according to the formation reaction in Eq. 4 was determined in Part I of this work at 60 °C (Table 2).
Analogous to the evaluation of the ∆RGm° function of the 3-1-8 phase, further values of ∆RGm° for the 2-1-4 phase were derived from the available solubility data up to 120°C.
The solubility constant lg KS,2-1-4,60°C = −32.95 ± 0.20 (Table 2) corresponds to ∆RGm°,2-1-4,60°C = 210.2 ± 1.3 kJ mol-1. From the solubility data at 60°C, the IP of the 3-1-8 and 2-1-4 phases is expected to be slightly above 5.4 mMgCl2 (between 5.4 and 5.7 mMgCl2). To represent this by the model, the ∆RGm°,2-1-4,60°C needs to be constrained to 211.2 ± 0.1 kJ mol-1. From the solubility data at 80°C, the experimentally determined IP of the 3-1-8 and 2-1-4 phases in 5.8 mMgCl2 is available. For a model reproducing the IP with ±0.1 mMgCl2, ∆RGm°,2-1-4,80°C needs to be 209.5 ± 0.1 kJ mol-1.
At 100°C, in addition to the 2-1-4 phase, the 9-1-4 phase occurs as a stable Sorel phase in the Mg-Cl-OH-H2O system (Pannach et al., 2017). The estimation of the crossing point from the trend of the solubility data of the 9-1-4 and 2-1-4 phases at 100°C suggests the IP at 5.4 ± 0.2 mMgCl2. To represent it by the model, a value of ∆RGm°,2-1-4,100°C = 205.6 ± 0.1 kJ mol-1 needs to be applied.
At 120°C, the IP of the 9-1-4 and 2-1-4 phases was determined at 5.8 mMgCl2 (Pannach et al., 2017) and adjusts ∆RGm°,2-1-4,120°C = 200.86 ± 0.1 kJ mol-1.
Using all the values determined at different temperatures, a ∆RGm°,2-1-4 temperature function according to Eq. 3 was generated (Figure 4; Table 3).
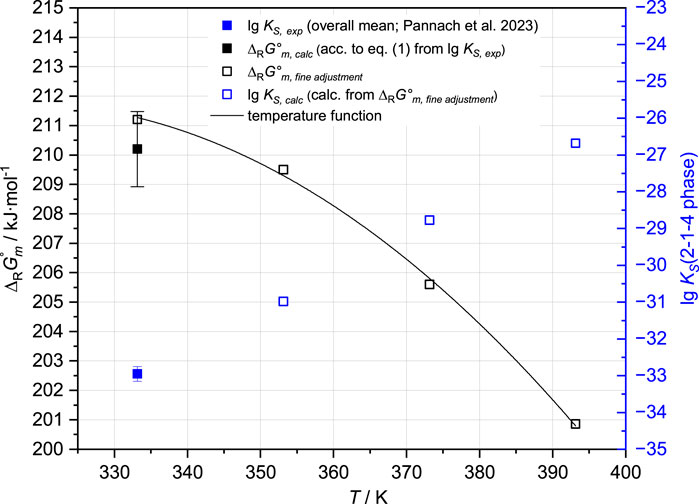
FIGURE 4. ∆RGm° values of the 2-1-4 phase, derived from lg KS,2-1-4,60°C at 60°C, and available solubility data at 60°C, 80°C, 100°C, and 120°C in the Mg-Cl-OH-H2O system (Pannach et al., 2017; Pannach et al., 2023).
4.1.3 Sorel phase 9-1-4
The 9-1-4 phase (9Mg(OH)2∙MgCl2∙4H2O = 2 Mg5Cl(OH)9∙2H2O) occurs above 80°C. Solubility data for the 9-1-4 phase are available at 100°C and 120°C, including IPs with Mg(OH)2(s) for both temperatures, as well as with the 2-1-4 phase at 120°C. However, unlike the 3-1-8 or 2-1-4 phases, there are no solubility constants available. For an initial estimation of lg KS,9-1-4 values, the IPs with Mg(OH)2(s) were used, as the 9-1-4 phase formation according to reaction (5) is in equilibrium with Mg(OH)2(s) at the same MgCl2 concentration (at 100°C: 4.04 mMgCl2 and 120°C: 4.00 mMgCl2 (Pannach et al., 2017)). The solubility constants were calculated according to Eq. 6 using the activity coefficients γi of Mg2+ and Cl− and the activities for water (aW), and H+ (aH+ = mH+ · γH+) calculated by THEREDA for these MgCl2 concentrations at 100°C and 120°C. This results in lg KS,9-1-4, 100°C = −58.2 and lg KS,9-1-4,120°C = −53.9, which correspond to ∆RGm°,9-1-4,100° = 415.5 kJ/mol and ∆RGm°,9-1-4,120° = 405.9 kJ/mol according to Eq. 1.
Both “initial values” were adjusted to the position of the IPs of Mg(OH)2(s) and the 9-1-4 phase in 4.0 molal MgCl2 solution at 100°C and 120°C respectively, and to the IP of 9-1-4 and 2-1-4 phase at 120°C in 5.8 mMgCl2 (Pannach et al., 2017). The final Gibbs energies are ∆RGm°,9-1-4,100°C = 415.60 kJ mol-1 and ∆RGm°,9-1-4,120°C = 406.00 kJ mol-1, respectively, and agree well with the previously calculated values. A linear temperature function was generated for the small temperature range of 100°C–120°C (Table 3).
4.1.4 Metastable Sorel phase 5-1-8
The 5-1-8 phase forms from OH− supersaturated MgCl2 or NaCl-MgCl2 solutions before the stable 3-1-8 phase crystallizes (Pannach et al., 2017; 2023). Within the time window of metastable existence, the lg KS,5-1-8 according to Eq. 7 could be determined at 25°C from pHm measurements in the Na-Mg-Cl-OH-H2O system by Xiong et al. (2010) and in the Mg-Cl-OH-H2O system in Part I of this work (Pannach et al., 2023). The mean values of both, which agree within the error range (see Table 2), were implemented in the THEREDA model as ∆RGm°,5-1-8,25°C calculated according to Eq. 1; (Table 3).
4.2 Adaptation of the model to reproduce the experimental OH− solution concentrations
As described in Chapter 2, the current model dataset (HMW as well as THEREDA) cannot reproduce the experimentally determined OH− solution concentrations in the presence of Mg(OH)2(s) or the Sorel phases (up to the order of 100% deviation) at 25°C, and also not at higher temperatures after implementation of the ∆RGm° temperature functions of the Sorel phases as observed in initial test calculations. All the calculated OH− solution concentrations were significantly too low.
However, the calculated H+ equilibrium concentrations are in excellent agreement with the experimental values, which are available up to 60°C for the Mg-Cl-OH-H2O system and at 25°C and 40°C for the Na-Mg-Cl-OH-H2O system, as shown in Figures 8, 9 respectively (see Section 5.1).
4.2.1 Attempts to adjust already existing Pitzer coefficients
To improve the model, attempts were made to adjust Pitzer coefficients that affect the OH− solution concentrations in MgCl2 and NaCl-MgCl2 solutions. According to the HMW model, THEREDA already contains the binary coefficients β(0) and β(1) between MgOH+ and Cl−, and the mixing coefficient ψ, between MgOH+, Mg2+, and Cl− at 25°C (Table 1). Only these act in the two systems Mg-Cl-OH-H2O and Na-Mg-Cl-OH-H2O and are not relevant for the well-described binary Mg(OH)2-H2O system; also there are no other complex Mg, Cl, and OH-containing systems for which experimental data are available, so adjustments were made. Based on the solubility data in the Mg-Cl-OH-H2O system at 25°C (Pannach et al., 2017), systematic fit tests were performed. Both β(0) alone and with β(1), as well as with and without ψMgOH+-Mg2+-Cl− (and also ψ alone), were fitted. Furthermore, the parameters CϕMgOH+-Cl− and ψMgOH+-OH−-Cl− not included in the dataset were also tested. However, no results could be obtained that sufficiently described the analyzed total OH− concentrations. When fitting the data at higher temperatures (available up to 120°C for the Mg-Cl-OH-H2O system), the deviation was even greater than at 25°C.
4.2.2 Further complex Mg-OH solution species
Since the modeling of OH− concentrations is not improved by Pitzer coefficients, it is assumed that, besides MgOH+, further Mg-OH species that influence OH− concentration must exist in the solution.
As known from other aqueous metal oxide or hydroxide salt systems, such as Be, Cu, Ni, and Zn (Feitknecht and Schindler, 1963; Mesmer and Baes, 1990; Plyasunova et al., 1997; 1998; Zhang and Muhammed, 2001), the existence of complex Mg-OH species containing more than one cation Mgx(OH)y(2x-y)+ has been already discussed (D’Ans and Katz, 1941; Ved et al., 1976; Mesmer and Baes, 1990). Stability constants (Lewis, 1963; Einaga, 1977) alongside MgOH+ (McGee and Hostetler, 1977; Palmer and Wesolowski, 1997) have also been proposed. Einaga (1977) derives the species Mg2(OH)22+ and Mg3(OH)42+ from emf measurements in nitrate solutions at 25°C with the stability constants log β = −22.0 and log β = −39.0, respectively. However, the determination of complex Mg-OH solution species lacks sufficient resolution to precisely determine the formulas, especially when more than one species coexists over a range of solution compositions. As Mg2+ is exclusively octahedrally coordinated by OH− (partly together with OH2) in these solids (Mg(OH)2, Sorel phases 3-1-8, 5-1-8, and 9-1-4 (De Wolf and Walter-Lévy, 1953; Sugimoto et al., 2007; Dinnebier et al., 2010)), multiple OH− coordinated Mg ions, in addition to MgOH+ = [Mg(H2O)5OH]+, could be expected to exist in appropriate equilibrium solutions.
Therefore, additional species were postulated based on the following considerations. In contrast to the solid structures with up to six OH− ions in the octahedral coordination sphere of Mg2+, the OH− concentration in the equilibrium solution is relatively very low compared to the Mg2+ (and Cl−) concentration. Thus, besides MgOH+, additional solution-Mg2+ should be only slightly more highly coordinated with OH−. Hence, species with a systematically increasing ratio of OH− to Mg2+ up to a maximum of two were taken into account—Mg3(OH)42+ (ratio = 1.33), Mg2(OH)3+ (ratio = 1.5), and Mg(OH)2±0 (ratio = 2)—and were tested for their effect. Estimated ∆RGm° values were used, in orientation to the value of MgOH+ and the stability constant for Mg3(OH)42+ given by Einaga (1977), to first see the general effects. Mg2(OH)22+ was not taken into account because the Mg:OH ratio is the same as in MgOH+ (tests have shown that the different charge does not have an effect). Calculations with the current THEREDA model show that MgOH+ determines the total OH− concentration, so the fraction of free OH− is negligible. Fitting studies with the additional three postulated species were performed both singularly and in combinations.
Finally, the fitting tests to the 25°C isotherm in the Mg-Cl-OH-H2O system (Pannach et al., 2017) showed that the total OH− concentrations can be reproduced when including additional Mg-OH species. It was found that the species Mg3(OH)42+ alone was sufficient. The other species, alone or in combination, worsened the agreement with experimental results. Therefore, the final fits to all isotherms in the system Mg-Cl-OH-H2O were performed with Mg3(OH)42+ additionally in the THEREDA dataset, turning off all ion interactions for MgOH+ (see Table 1). ∆RGm°,Mg3(OH)42+ (according to the formation reaction: 3Mg2+ + 4H2O ↔ Mg3(OH)42+ + 4H+) was adjusted so that the isothermal branch of Mg(OH)2(s) up to the invariant point with the 3-1-8 phase will be reproduced in agreement with the experimental data. With increasing MgCl2 concentration, the total OH− concentration in the presence of the 3-1-8 phase is calculated to be increasingly too high until MgCl2 saturation is reached. This overestimation was subsequently adjusted with the final Pitzer coefficients (Section 4.2.3). The resulting values of ∆RGm°, Mg3(OH)42+ for each temperature are shown in Figure 5, together with the fitted temperature function (Table 3).
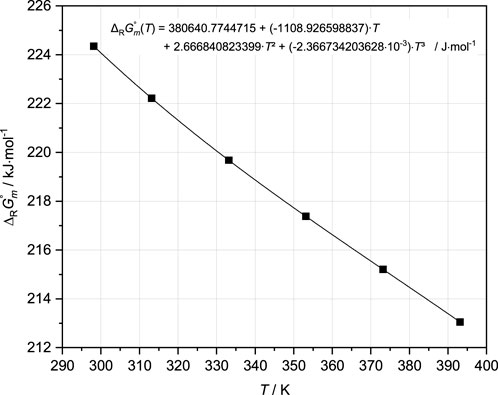
FIGURE 5. ∆RGm° values for the solution species Mg3(OH)42+ derived from adjustments to the solubility data available at different temperatures in the Mg-Cl-OH-H2O system, with the temperature function (black curve) fitted to these values (see also Table 3).
4.2.3 Final Pitzer coefficients
To remove the over-calculated total OH− concentrations following the IP of Mg(OH)2(s) and the 3-1-8 phase caused by the implementation of Mg3(OH)42+, ion interactions for that species were introduced. Fitting tests were carried out with binary as well as mixing Pitzer coefficients. Finally, the mixing parameter ψ Mg-Mg3(OH)4-Cl was adjusted together with ψ Mg-MgOH-Cl. The binary coefficients β(0) and β(1) between MgOH+ and Cl− previously included beside the mixing ψ Mg-MgOH-Cl proved unnecessary; they were removed from the dataset. The parameterization was again performed separately on each isotherm. The obtained values for ψ Mg-Mg3(OH)4-Cl and ψ Mg-MgOH-Cl are shown in Figures 6A, B. The THEREDA conformal temperature function (Eq. 8) was fitted to the systematic variation of the parameters with T obtained from the isothermal fits (Figure 6).
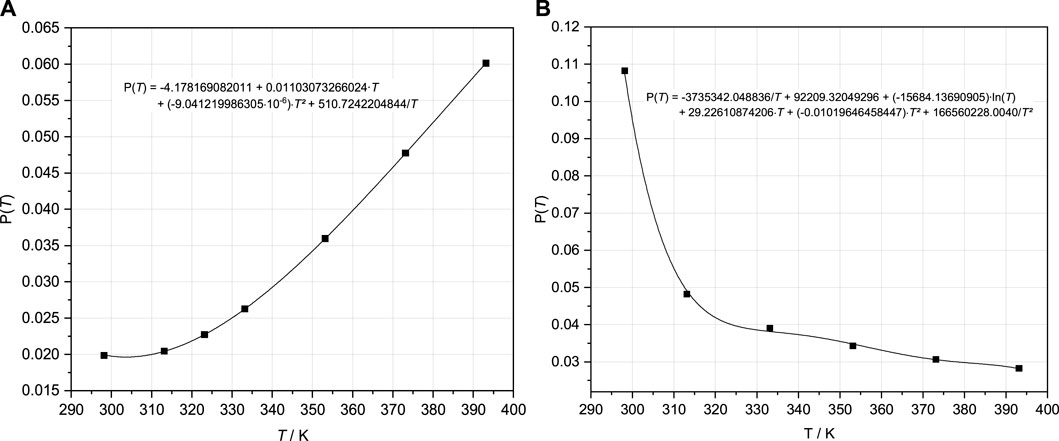
FIGURE 6. Pitzer coefficients ψ Mg-MgOH-Cl (A) and ψ Mg-Mg3(OH)4-Cl (B) resulting from fits to the isotherms in the Mg-Cl-OH-H2O system (Pannach et al., 2017) and fitted temperature functions (Eq. 8).
Due to the polynomial type of the function (Eq. 8), the course for ψ Mg-Mg3(OH)4-Cl with the strong decrease from the 25°C value to the only slightly decreasing values up to 120°C can only be adjusted with turning points (Figure 6B). However, this does not show any noticeable effects on the model results within the experimental data trend and reproduction (Section 4.2).
For the modeling of the two solubility isotherms in the system Na-Mg-Cl-OH-H2O at 25°C and 40°C, the implementation and adjustment of the mixing parameters ψ Na-MgOH-Cl and ψ Na-Mg3(OH)4-Cl were still necessary. The fitted values with linear progression over the two temperatures are shown in Figure 7.
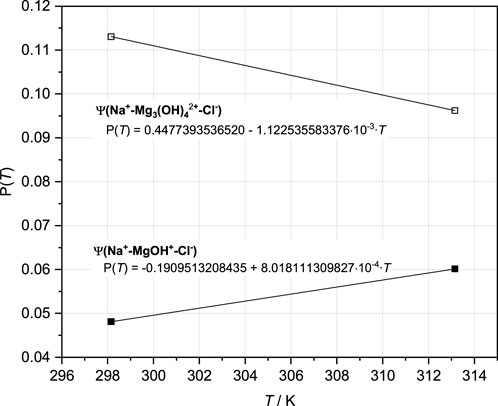
FIGURE 7. Pitzer coefficients ψ Na-MgOH-Cl and ψ Na-Mg3(OH)4-Cl resulting from adjustments to both the isotherms in the Na-Mg-Cl-OH-H2O system (Part I = Pannach et al., 2023) and fitted temperature functions (Eq. 7).
All Pitzer coefficients with their temperature functions are listed in Table 4.
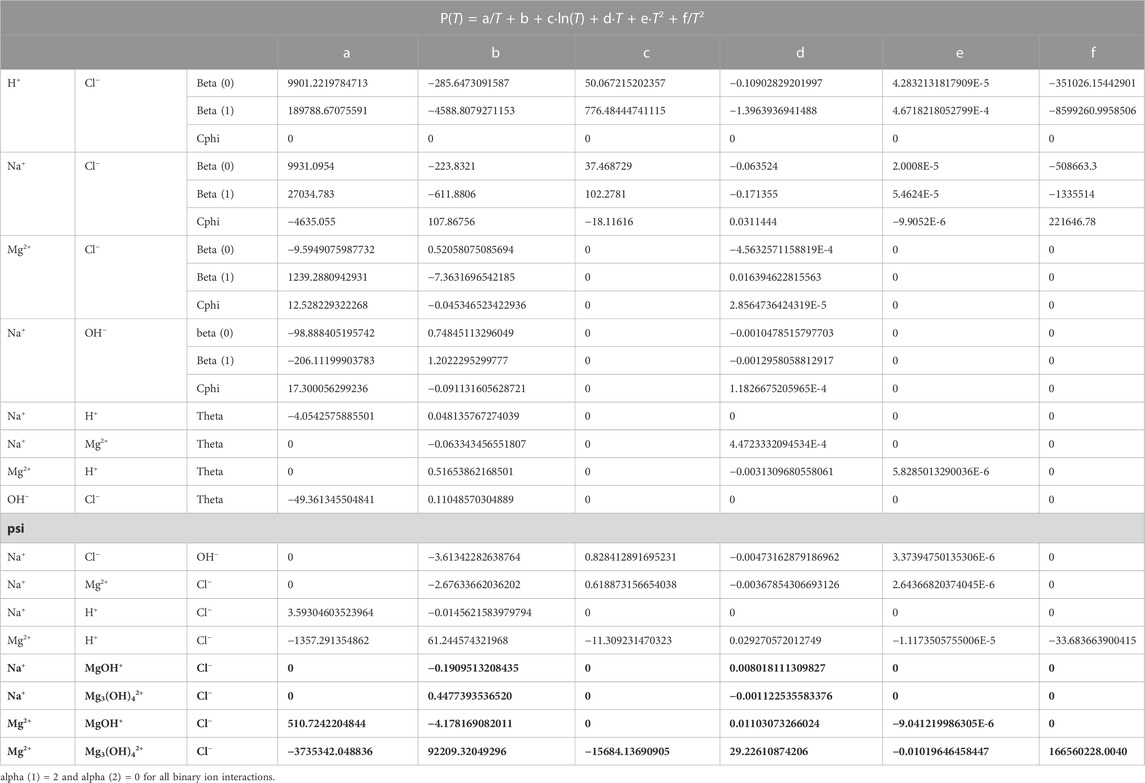
TABLE 4. Temperature coefficients of Pitzer parameters for the title system Na-Mg-Cl-OH-H2O and subsystem in THEREDA. The new data from this work are highlighted in bold.
5 Calculation results with the extended THEREDA model
5.1 Modeling of H+ equilibrium concentrations
With the addition of the ∆RGm° temperature functions for the Sorel phases 3-1-8, 2-1-4, and 9-1-4 and for the metastable 5-1-8 phase at 25°C to the THEREDA dataset, the H+ equilibrium concentrations can be calculated in good agreement with the experimental data. Figure 8 shows the comparison for the Mg-Cl-OH-H2O system and Figure 9 for the Na-Mg-Cl-OH-H2O system at NaCl saturation. Calculation results between and just outside the temperatures of the experimental data are still included, showing that the model reliably calculates the occurring solids depending on MgCl2 solution concentration and the pHm = -lg m (H+), evolving in their presence over the entire and somewhat extended temperature field.
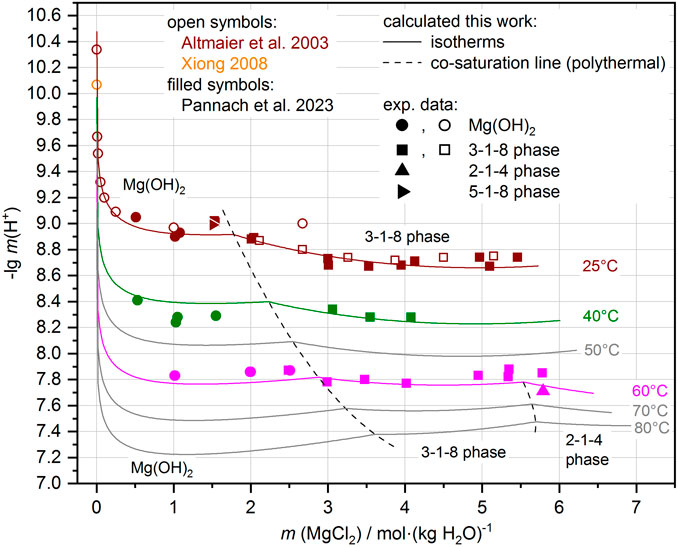
FIGURE 8. Comparison of experimental and calculated pHm = -lg m (H+) in the Mg-Cl-OH-H2O system. Experimental data available at 25°C, 40°C, and 60°C (see also Pannach et al., 2023). Away from these temperatures, the model shows systematic trends (gray lines calculations at 50°C, 70°C, and 80°C, and the dashed co-saturation lines of the Mg(OH)2(s) and 3-1-8 phase, and the 3-1-8 and 2-1-4 phases respectively) that follow the experimental data.
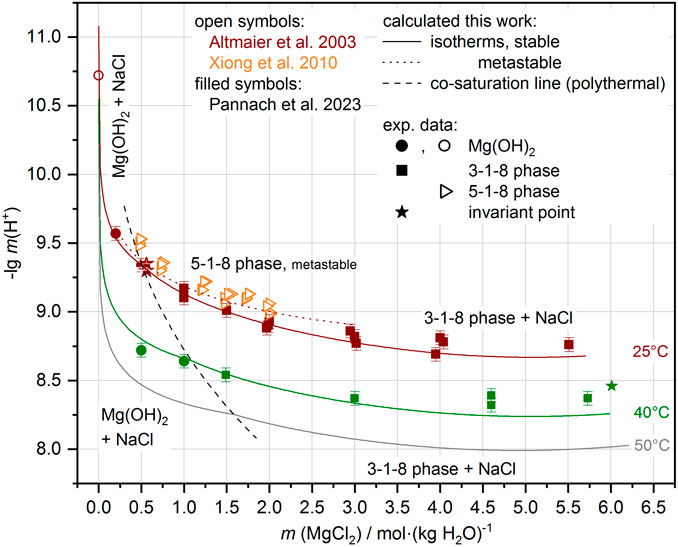
FIGURE 9. Comparison of experimental and calculated pHm in almost NaCl-saturated MgCl2 solutions (system Na-Mg-Cl-OH-H2O). Experimental data available at 25°C and 40°C (see also Pannach et al., 2023). Away from these temperatures, the model shows systematic trends (gray lines for 50 C and dashed co-saturation line of Mg(OH)2(s) and 3-1-8 phase) that follow the experimental data.
5.2 Modeling of OH− equilibrium concentrations
The implementation of a second Mg-OH solution species, Mg3(OH)42+, was the key to the accurate calculation of the OH− solution concentrations in equilibrium with Mg(OH)2(s) or the Sorel phases. Still requiring mixing Pitzer coefficients, ψ Mg-Mg3(OH)4-Cl and ψ Na-Mg3(OH)4-Cl, were introduced and fitted together with ψ Mg-MgOH-Cl or ψ Na-MgOH-Cl for final adjustment to the solubility isotherms in the Mg-Cl-OH-H2O (Nakayama, 1959; Nakayama, 1960; Pannach et al., 2017) and Na-Mg-Cl-OH-H2O systems (Part I of this work—Pannach et al., 2023), respectively.
Finally, the solubilities can be calculated in agreement with all experimental data. As Figure 10A shows for the Mg-Cl-OH-H2O system at 25°C, the total OH− concentration is mainly a result of the MgOH+ solution species over the entire concentration range but in addition from lesser proportions of Mg3(OH)42+ with the highest contribution at the MgCl2 concentration of the IP Mg(OH)2(s) and 3-1-8 phase. This now leads to a correct representation of the total OH− concentration. With increasing temperature, Mg3(OH)42+ becomes increasingly predominant over MgOH+, as shown in Figure 10B for the 60°C isotherms as an example in comparison to 25°C (Figure 10A). The contribution of free OH− in the order of 10−9 molal at 60°C (10−5 molal at 25°C) is insignificant: its proportion is unaffected by the implementation of the second Mg-OH species since it is calculated together with H+ from Kw (Eq. 9), which is already included in the model (Figure 11 shows Kw, H+, and OH− as a function of the MgCl2 solution concentration according to the HMW and THEREDA model at 25°C). This also justifies the already-correct calculation of the H+ solution concentrations in the presence of Mg(OH)2(s) or the Sorel phases with the previous model; it also confirms that the earlier poor model description of the total OH− solution concentrations is due to missing further Mg-OH speciation.
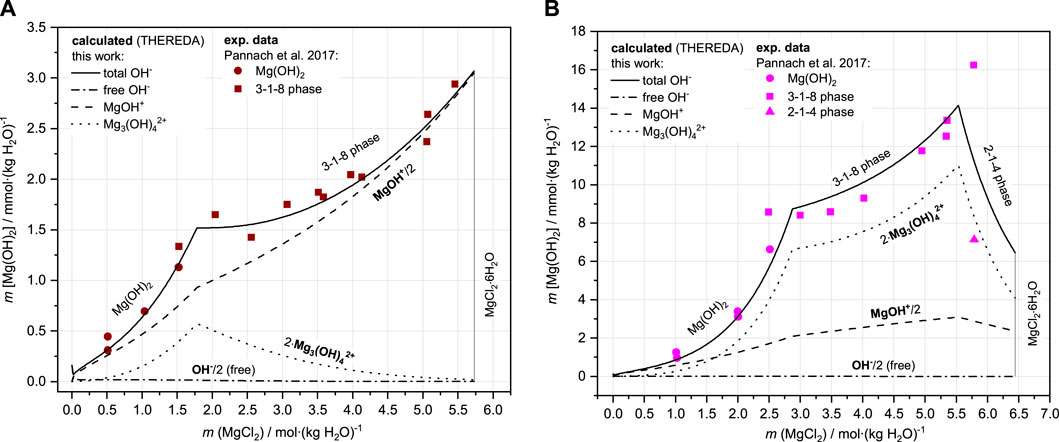
FIGURE 10. Comparison of experimental and calculated (with OH-species distribution) solubility data of Mg(OH)2(s) and 3-1-8 phase in the Mg-Cl-OH-H2O system at 25°C (A) and 60°C (B).
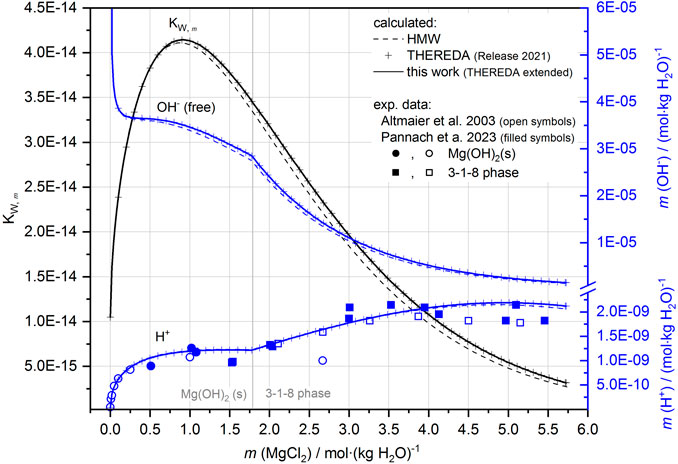
FIGURE 11. KW,m, H+ (comparison with experimental data, cf. Figure 8) and OH− as a function of the MgCl2 solution concentration (system Mg-Cl-OH-H2O) according to the HMW and THEREDA models at 25°C.
The calculation results for the Mg-Cl-OH-H2O system compared to all reliable experimental datasets are shown in Figure 12. Within their experimental scatter range, the calculated Mg(OH)2(s) isotherms overlie each other, with ranges extending toward higher MgCl2 concentrations up to the positions of the IPs with the Sorel phases. The subsequent isotherms for the 3-1-8 phase (stable phase up to 80°C) or the 9-1-4 phase (from 100 °C) effectively describe the course of the experimental values. For the 9-1-4 phase, the IPs with brucite and the isotherms at 100°C and 120°C are calculated nearly exactly in line with the experimental data. The calculated isotherm for the metastable 3-1-8 phase at 100°C is slightly below the experimental values but on trend; it is above the 9-1-4 phase 100°C isotherm.
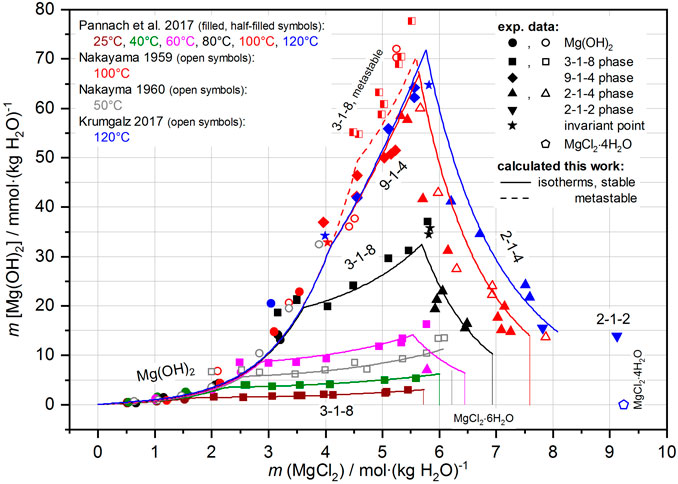
FIGURE 12. Solubility data of the Mg-Cl-OH-H2O system from 25°C to 120°C; comparison of the experimental data with the calculated isotherms.
The 2-1-4 phase, occurring above 60°C at high MgCl2 concentrations with its strongly decreasing solubility behavior up to the MgCl2 saturation concentrations, is calculated in conformity with the experimental (more scattering) values. The calculated isotherm, especially at 100°C, is shifted to slightly higher values compared with the trend of the experimental dataset. When using the isothermally determined ∆RGm° value of the 2-1-4 phase (see Section 4.1.2), a somewhat better agreement with the experimental data would result. However, since the temperature function does not reproduce the individually determined ∆RGm° value to 100% (∆RGm°,2-1-4,100°C = 205.6 kJ mol-1 is calculated by the temperature function with 205.8 kJ mol-1), the model result via temperature function deviates somewhat. Furthermore, with increasing temperature and MgCl2 concentration, the possible existence of further Mg-OH solution species must be assumed, also affecting solubility. However, without experimental evidence and data, the model cannot be further modified. With the present model (THEREDA extended), the solubility behavior of Mg(OH)2(s) and the Sorel phases can be described quite well up to 120°C. This is also true in the presence of NaCl saturation in the Na-Mg-Cl-OH-H2O system, as shown by the comparison of the experimental datasets at 25°C and 40°C and the calculated isotherms in Figure 13. The additional calculated isotherms for 50°C indicate a reasonable trend with the IP of the Mg(OH)2(s) and 3-1-8 phase in an approximately 1.6 molal solution of MgCl2 (at 25°C and 40°C in 0.5 and ca. 1 molal solution, respectively).
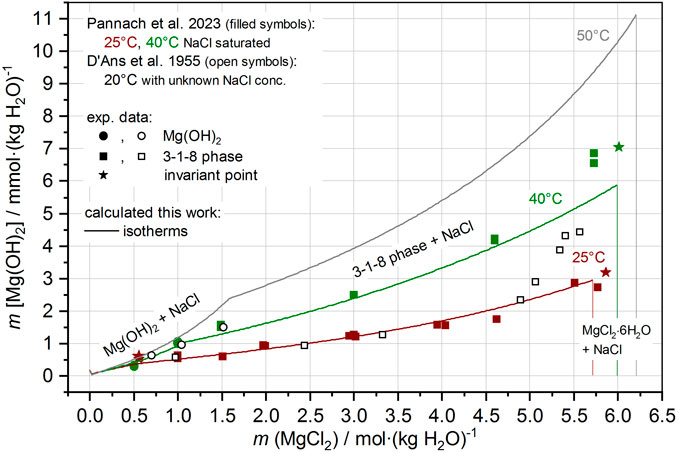
FIGURE 13. Solubility data of the Na-Mg-Cl-OH-H2O system with NaCl saturation at 20°C–50°C; comparison of the experimental data with the calculated isotherms.
The 2-1-2 phase, with only two solubility data points at 120°C in the Mg-Cl-OH-H2O system (Figure 12), was not included in the model.
6 Summary
With this work, the Pitzer model dataset of THEREDA was extended and adjusted for the calculation of the solubility equilibria of the Sorel phases and of Mg(OH)2(s) in salt solutions of the system Na-Mg-Cl-OH-H2O.
Previously, calculations were possible only with strong deviations from the now available experimental OH− solution concentrations of the 25°C isotherms of Mg(OH)2(s) as well as the Sorel phase 3-1-8, although the H+ concentrations could be calculated in agreement. The Pitzer dataset, corresponding to the HMW model and implemented in THEREDA, was valid only for 25°C; due to the lack of experimental data, no sufficient adjustments were possible.
With the data now available for the Mg-Cl-OH-H2O system up to 120°C and in NaCl-saturated solutions (Na-Mg-Cl-OH-H2O system) at 25°C and 40°C within Part I of this work, a new adjustment of the model and polytherm was possible. In addition to the implementation of the solubility constants for the Sorel phases as temperature functions of molal standard Gibbs energies of formation, a model extension for the OH− solution speciation (the implementation of Mg3(OH)42+ in addition to MgOH+ and OH−) was necessary to reproduce the experimentally determined OH− solution concentrations. Thus, the solubility equilibria of the Sorel phases and Mg(OH)2(s) can now be calculated in agreement with the experimental data.
THEREDA now provides a reliable database for the long-term safety assessment of geotechnical barriers made of Sorel cement/concrete for a repository in host rock salt. It also allows the calculation of the evolving pHm values (caused by the pH buffer material MgO which reacts to Sorel phases or Mg(OH)2 in the presence of salt solutions), which is particularly important for predictions regarding the retention capacity of radionuclides in the near field of a repository.
Data availability statement
The raw data supporting the conclusion of this article will be made available by the authors, without undue reservation.
Author contributions
DF: procedure for the extension of the Pitzer model dataset and writer of the paper. MP: calculation tests, adjustments, preparation of figures and tables, and co-writer. WV: Pitzer model expert, discussions and contributions to dataset development, and co-writer. All authors contributed to the article and approved the submitted version.
Funding
This research was supported by the Open Access Funding by the Publication Fund of the TU Bergakademie Freiberg.
Conflict of interest
The authors declare that the research was conducted in the absence of any commercial or financial relationships that could be construed as a potential conflict of interest.
Publisher’s note
All claims expressed in this article are solely those of the authors and do not necessarily represent those of their affiliated organizations, or those of the publisher, the editors, and the reviewers. Any product that may be evaluated in this article, or claim that may be made by its manufacturer, is not guaranteed or endorsed by the publisher.
References
Altmaier, M., Metz, V., Neck, V., Müller, R., and Fanghänel, T. (2003). Solid-liquid equilibria of Mg(OH)2(cr) and Mg2(OH)3Cl·4H2O(cr) in the system Mg-Na-H-OH-Cl-H2O at 25°C. Geochim. Cosmochim. Acta 67 (19), 3595–3601. doi:10.1016/s0016-7037(03)00165-0
D’Ans, J., and Katz, W. (1941). The solubility of magnesium hydroxide, the pH value and buffering in the system H2O-MgCl2-Mg(OH)2. Kali Steinsalz 35, 37–41.
De Wolf, P. M., and Walter-Lévy, L. (1953). The crystal structure of Mg2(OH)3(Cl, Br)·4H2O. Acta Cryst. 6, 40–44. doi:10.1107/s0365110x53000089
Dinnebier, R. E., Freyer, D., Bette, S., and Oestreich, M. (2010). 9Mg(OH)2·MgCl2·4H2O, a high temperature phase of the magnesia binder system. Inorg. Chem. 49, 9770–9776. doi:10.1021/ic1004566
Einaga, H. (1977). Hydrolysis of magnesium(II) in 1.0 mol dm-3 aqueous (Na,H)NO2 solution. J. Chem. Soc. Dalton Trans. Inorg. Chem. 9, 912–914. doi:10.1039/DT9770000912
Eriksson, G., and Hack, K. (1990). ChemSage - a computer program for the calculation of complex chemical equilibria. Metall. Trans. B21 (6), 1013–1023. doi:10.1007/bf02670272
Eriksson, G., Hack, K., and Petersen, S. (1997). “ChemApp - a programable thermodynamic calculation interface,” in Werstoffwoche ’96, Symposium 8: Simulation, Modellierung, Informationssysteme (Deutschland: DGM Informationsgesellschaft mbH).
Feitknecht, W., and Schindler, P. (1963). Solubility constants of metal oxides, metal hydroxides, and metal hydroxide salts in aqueous solution. Pure Appl. Chem. 6, 125–206. doi:10.1351/pac196306020125
Harvie, C. E., Møller, N., and Weare, J. H. (1984). The prediction of mineral solubilities in natural waters: na-K-Mg-Ca-H-Cl-SO4-OH-HCO3-CO3-CO2-H2O system to high ionic strengths at 25°C. Geochim. Cosmochim. Acta 48, 723–751. doi:10.1016/0016-7037(84)90098-x
Krumgalz, B. S. (2017). Temperature dependence of mineral solubility in water. Part I. Alkaline and alkaline earth chlorides. J. Phys. Chem. Ref. Data 46 (4). AIP Publishing. doi:10.1063/1.5006028
Lambert, I., and Clever, H. L. (1992). “Alkaline earth hydroxides in water and aqueous solutions,” in IUPAC solubility data series (Oxford, UK: Pergamon Press), 52.
Lewis, D., Lund, A., Vänngård, T., Håkansson, R., and Munch-Petersen, J. (1963). Studies on the hydrolysis of metal ions. 45. The hydrolysis of magnesium in chloride self-medium. Acta Chem. Scand. 17 (7), 1891–1901. doi:10.3891/acta.chem.scand.17-1891
McGee, K. A., and Hostetler, P. B. (1977). Activity-product constants of brucite from 10° to 90°C. J. Res. U.S. Geol. Surv. 5 (2), 227–233.
Mesmer, R. E., and Baes, C. F. (1990). Review of hydrolysis behavior of ions in aqueous solutions. Mat. Res. Soc. Symp. Proc. 180, 85–96. doi:10.1557/proc-180-85
Nakayama, M. (1959). A new basic triple salt containing magnesium hydroxide Part II. The quaternary system KCl-MgCl2-Mg(OH)2-H2O at 100°. Bull. Agr. Chem. Soc. Jpn. 23(1), 46–48. doi:10.1080/03758397.1959.10857524
Nakayama, M. (1960). A new basic triple salt containing magnesium hydroxide Part IV. The quinary system KCl-K2SO4-MgCl2-MgSO4-Mg(OH)2-H2O at 50°. Bull. Agr. Chem. Soc. Jpn. 24(4), 362–371. doi:10.1080/03758397.1960.10857688
Palmer, D. A., and Wesolowski, D. J. (1997). Potentiometric measurements of the first hydrolysis quotient of magnesium(II) to 250°C and 5 molal ionic strength (NaCl). J. Solut. Chem. 26 (2), 217–232. doi:10.1007/bf02767923
Pannach, M., Bette, S., and Freyer, D. (2017). Solubility equilibria in the system Mg(OH)2-MgCl2-H2O from 298 to 393 K. J. Chem. Eng. Data 62 (4), 1384–1396. doi:10.1021/acs.jced.6b00928
Pannach, M., Paschke, I., Metz, V., Altmaier, M., Voigt, W., and Freyer, D. (2023). Solid-liquid equilibria of Sorel phases and Mg(OH)2 in the system Na-Mg-Cl-OH-H2O. Part I: experimental determination of OH- and H+ equilibrium concentrations and solubility constants at 25°C, 40°C and 60°C. Front. Nuc. Eng. 2. doi:10.3389/fnuen.2023.1188789
Pitzer, K. S. (1991). Activity coefficients in electrolyte solutions. 2. Edition. Boca Raton: CRC Press.
Plyasunova, N. V., Wang, M., Zhang, Y., and Muhammed, M. (1997). Critical evaluation of thermodynamics of complex formation of metal ions in aqueous solutions II. Hydrolysis and hydroxo-complexes of Cu2+ at 298.15 K. Hydrometallurgy 45 (1-2), 37–51. doi:10.1016/s0304-386x(96)00073-4
Plyasunova, N. V., Zhang, Y., and Muhammed, M. (1998). Critical evaluation of thermodynamics of complex formation of metal ions in aqueous solutions. IV. Hydrolysis and hydroxo-complexes of Ni2+ at 298.15 K. Hydrometallurgy 48 (1), 43–63. doi:10.1016/s0304-386x(97)00070-4
Robinson, W. O., and Waggaman, W. H. (1909). Basic magnesium chlorides. J. Phys. Chem. 13, 673–678. doi:10.1021/j150108a002
Sugimoto, K., Dinnebier, R. E., and Schlecht, T. (2007). Structure determination of Mg3(OH)5Cl·4H2O (F5 phase) from laboratory powder diffraction data and its impact on the analysis of problematic magnesia floors. Acta Cryst. B 63, 805–811. doi:10.1107/S0108768107046654
THEREDA (2021). Thermodynamic reference database. Release (2021). Available at: www.thereda.de.
Travers, A. (1929). The solubility of magnesium hydroxide at elevated temperatures. C. R. Acad. Sci. 188, 499–501.
Ved, E. I., Zharov, E. F., and Hoang, V. P. (1976). Mechanism of magnesium oxychloride formation during the hardening of magnesia cements. Zh. Prikl. Khim. 49, 2154–2158.
Voigt, W., Brendler, V., Marsh, K., Rarey, R., Wanner, H., Gaune-Escard, M., et al. (2007). Quality assurance in thermodynamic databases for performance assessment studies in waste disposal. Pure Appl. Chem. 79 (5), 883–894. doi:10.1351/pac200779050883
Xiong, Y., Deng, H., Nemer, M., and Johnsen, S. (2010). Experimental determination of the solubility constant for magnesium chloride hydroxide hydrate (Mg3Cl(OH)5·4H2O, phase 5) at room temperature, and its importance to nuclear waste isolation in geological repositories in salt formations. Geochim. Cosmochim. Acta 74, 4605–4611. doi:10.1016/j.gca.2010.05.029
Xiong, Y. (2008). Thermodynamic properties of brucite determined by solubility studies and their significance to nuclear waste isolation. Aquat. Geochem. 14 (3), 223–238. doi:10.1007/s10498-008-9034-3
Keywords: Pitzer modeling, system Na-Mg-Cl-OH-H2O, system Mg-Cl-OH-H2O, magnesium chloride hydroxides, Sorel phases, Mg(OH)2
Citation: Freyer D, Pannach M and Voigt W (2023) Solid–liquid equilibria of Sorel phases and Mg(OH)2 in the system Na-Mg-Cl-OH-H2O. Part II: Pitzer modeling. Front. Nucl. Eng. 2:1236544. doi: 10.3389/fnuen.2023.1236544
Received: 07 June 2023; Accepted: 23 August 2023;
Published: 27 September 2023.
Edited by:
Taishi Kobayashi, Kyoto University, JapanReviewed by:
Jun-Yeop Lee, Pusan National University, Republic of KoreaArnault Lassin, Bureau de Recherches Géologiques et Minières, France
Copyright © 2023 Freyer, Pannach and Voigt. This is an open-access article distributed under the terms of the Creative Commons Attribution License (CC BY). The use, distribution or reproduction in other forums is permitted, provided the original author(s) and the copyright owner(s) are credited and that the original publication in this journal is cited, in accordance with accepted academic practice. No use, distribution or reproduction is permitted which does not comply with these terms.
*Correspondence: Daniela Freyer, ZGFuaWVsYS5mcmV5ZXJAY2hlbWllLnR1LWZyZWliZXJnLmRl
 Daniela Freyer
 Melanie Pannach
 Wolfgang Voigt