
94% of researchers rate our articles as excellent or good
Learn more about the work of our research integrity team to safeguard the quality of each article we publish.
Find out more
ORIGINAL RESEARCH article
Front. Nucl. Eng., 22 March 2023
Sec. Nuclear Materials
Volume 2 - 2023 | https://doi.org/10.3389/fnuen.2023.1127504
This article is part of the Research TopicPlutonium Legacy Storage and DegradationView all 6 articles
 Kevin Webb1Colin Gregson1
 Josh Holt1Bliss McLuckie1
 Robin Orr1Howard Sims1David Woodhead1Jeff Hobbs2
 Helen Steele2
 Fred Currell3,4
 Luke Jones3,4Simon Pimblott3,4,5
 Robin Taylor1*
Over 60 samples of plutonium dioxide (PuO2) powders of varying provenance have been exposed to humid atmospheres and the hydrogen (H2) generation rates measured by gas chromatography. The effects of relative humidity (RH), specific surface area (SSA), plutonium isotopic composition (absorbed dose), and overlying atmosphere have been investigated for ‘as received’ PuO2 powders from the United Kingdom’s Thorp and Magnox reprocessing plants, high surface area powder produced in the laboratory and Magnox PuO2 that was recalcined at 800, 900 or 950°C. Hydrogen generation was shown to be susceptible to subtle influences with the most consistent results observed at 95% RH. However, it was shown that the measured (net) hydrogen decreases with decreasing RH and with atmosphere in the order: Air > argon > nitrogen. There was no clear effect of SSA, apart from with the highest SSA samples (∼40 m2.g−1) but these powders also have very different morphology, porosity, and carbon content to the rest. The results presented substantially enhance the growing body of literature on the factors that determine hydrogen and gas generation from PuO2 that has significant implications for long term safe storage of plutonium globally.
Safe and secure interim storage and transport of nuclear materials is an essential requirement of the global nuclear industry. Of the range of nuclear materials to be managed, separated plutonium presents some specific challenges from both radiological safety and nuclear security perspectives (Haschke and Stakebake, 2006; Veirs, Joyce et al., 2019). In the United Kingdom, at the end of reprocessing operations there will be around 140 tonnes of separated plutonium in storage (Cadman and Goater, 2016). The majority of this is stored as plutonium dioxide (PuO2) powder in nested metal containers, where the outer can is sealed by welding, and originates from reprocessing either Magnox fuel or uranium oxide fuel in the Magnox and Thorp reprocessing plants at the Sellafield site (Nuttall and Robertson, 1987; Cook, Sims et al., 2013; Taylor, Hobbs et al., 2018). Some of these materials have already been stored for nearly 50 years and are likely to be stored for another few decades until a final disposition route is implemented (“Progress on approaches to the management of separated plutonium.” 2014, Hyatt, 2017). Plutonium dioxide is also stored in welded containers in the United States, Japan, France, and elsewhere. For example, the US-DOE standard ‘3013’ for plutonium storage stipulates conversion of materials to PuO2 by stabilisation at 950°C and then packaging in nested steel containers with the outer can welded (“Stabilization, packaging, and storage of plutonium-bearing materials.” 2012).
An important aspect of the storage safety case is to avoid conditions that may lead to pressurization of the container or package (Haschke and Martz, 2000; Duffey, Veirs et al., 2010; Cook, Sims et al., 2013, 2017). As PuO2 is well known to adsorb water from the atmosphere (Stakebake, 1973; Haschke and Ricketts, 1997; Paffett, Kelly et al., 2003; Farr, Schulze et al., 2004; Tegner, Molinari et al., 2017), one mechanism that must be considered is the formation of hydrogen (H2) from the radiolysis of adsorbed water (Sims, Webb et al., 2013). Operational experience at Sellafield indicates that this is very rare indeed and only observed under abnormal production conditions (or uncontrolled storage and packaging regimes) when moist air is allowed to contact the PuO2 before it is sealed into the can. However, under laboratory conditions hydrogen generation from radiolysis is measurable and hydrogen increases with time (Sims, Webb et al., 2013; Venault, Deroche et al., 2019); therefore, under normal conditions of storage, where minimal levels of hydrogen are found, there must be other effects occurring. These effects would include dominant reverse (recombination) reactions that establish a benign steady state or conversion of water to a form that does not readily produce hydrogen (Morales, 1998; Venault, Deroche et al., 2019). It is, therefore, of significant fundamental and practical interest to understand the factors that control the radiolysis of water and hydrogen generation on the PuO2 surface.
Previously, we reported some initial measurements of hydrogen generation from Magnox and Thorp PuO2 and PuO2 that had been used in loss on heating (LOH) analysis (i.e., after being heated to 950°C) (Sims, Webb et al., 2013). Linear rates of hydrogen evolution were observed with the second and third series of measurements on each sample showing good agreement, suggesting some ‘equilibration’ of the system was needed. Hydrogen production was expressed as radiation chemical yields, referred to as G-values, which present the effects of adsorbed radiation on a substance as the numbers of molecules generated per unit energy and allows comparison with bulk water systems. Section 3.3 provides the definition of G (H2) used and the method of calculation. G (H2) values were reported for samples under air atmospheres at constant relative humidity (RH) and when plotted against %RH. G (H2) values were reasonably consistent across the different types of PuO2; a sharp rise in G (H2) was found between 75% and 95% RH. Data were also plotted against monolayers (ML) of adsorbed water and compared with the available literature data to establish the trend. Finally, it was concluded that hydrogen generation was a radiolytic rather than thermal process (Haschke, 2000) and that within storage cans there must be a process that suppresses accumulation of hydrogen otherwise there would be eventual pressurisation of cans that is not observed for in specification material. Either a reverse reaction balances the production of hydrogen or water is converted to a form that does not undergo radiolysis and does not generate hydrogen.
Recently, a similar study has been published by a French group (Venault, Deroche et al., 2019) with some similar and some different results. Venault and co-workers observed an initial linear increase in hydrogen generation followed by the establishment of a steady state and modelled their data using zero order kinetics for generation (forward reaction) and a first order term for consumption (back reaction). Initial rates were found to be exponentially dependent on RH between 60% and 100% RH and also increased with increasing dose rates. The steady state hydrogen concentrations were less predictable but apparently also increased with RH, dose rate and specific surface area (SSA). One interesting observation was that two runs on the same sample at 60% RH showed a large accumulation of H2 initially that then suddenly and rapidly dropped off to a lower steady state value. After the sample had been aged for a year, however, this decrease occurred earlier, i.e., at a lower peak hydrogen concentration, compared to the run on the fresh sample. Interestingly, no steady state was observed when the same sample was aged for 3 years with an 80% RH atmosphere and the hydrogen accumulation then measured. Three cycles of thermal treatment in air annealed the sample and returned the hydrogen generation rate and steady state values to the same as for the fresh sample. Their conclusion is that hydrogen generation is influenced by sorbed water whereas the consumption (back reaction) is dependent on the surface conditions and is inhibited with ageing, possibly due to surface reduction by H2. They calculate how a reduction in the rate constant for the back-reaction will cause the hydrogen generation rate to become apparently linear without the establishment of a steady state, as reported in our previous work (Sims, Webb et al., 2013) and in most of the experiments herein.
The United States has run a materials surveillance programme for several years now that includes a rather large number of small scale tests of gas generation in sealed vessels containing PuO2, analogous to our experiments and those of Venault (Dunn, Chandler et al., 2010). Veirs (Veirs, Stroud et al., 2019) recently reported H2 generation rates from PuO2 powders calcined at temperatures between 400°C and 950°C and different specific activities. They found an initial increase in H2 partial pressure followed by a decrease and that there was a threshold rate of hydrogen generation below which oxygen was not observed. They concluded both hydrogen generation and consumption reactions were radiolytic and could be described by simple kinetic models but did not observe much dependence of G (H2) on water monolayer coverage, as proposed by Sims (Sims, Webb et al., 2013). They also found RH decreased during their tests in some cases to zero which could not be accounted for by the H2 produced.
A key difference between United States tests and those by the French group and ourselves is that the latter groups maintained constant RH during the tests. Furthermore, in our system, the sampling routine is different to United States and French methods which perturbs any approach to equilibrium gas concentrations in the sample vessel and may be a contributing cause of the observed differences.
It is apparent that a better fundamental understanding of the radiolysis of water on the PuO2 surface and associated reactions of water and gas in contact with PuO2 would add confidence to the safety case for long term plutonium storage but also that these processes are complex and susceptible to different influences. It is also clear from the literature that radiolysis of water on PuO2 differs from the process occurring on other metal oxides such as UO2, CeO2 and ZrO2 (Petrik, Alexandrov et al., 2001; LaVerne and Tandon, 2002; LaVerne and Tandon, 2003; Taylor, Hobbs et al., 2018) and thus experiments with so-called analogues are not particularly useful in this context. However, the available literature data with PuO2 are limited and difficult to compare. Therefore, in this regard, following on from our preliminary studies (Sims, Webb et al., 2013), we can now report the results from over 60 laboratory scale experiments measuring hydrogen generation from a range of PuO2 samples under differing conditions of surface area, relative humidity (RH) and atmosphere. The focus of this paper is the effect of RH and specific surface area (SSA). Of specific note is this paper reports data obtained under air, nitrogen (N2) and argon atmospheres to compare with previous data under air or argon (Sims, Webb et al., 2013; Venault, Deroche et al., 2019). Our studies primarily focus on representative materials from production plants that have been aged through storage in various conditions and thus complements the French study with fresh PuO2 samples manufactured under controlled conditions in the laboratory. This unique data set highlights the sensitivity of the radiolytic reactions to surface conditions. In some cases, at low RH, anomalously high amounts of hydrogen can be generated pointing to the need to now investigate the reactions that reduce net hydrogen in a sealed storage system.
Over a period of around 6 years (2012–2018), hydrogen generation was measured from over 60 PuO2 powder samples with different characteristics. To aid discussions, these experiments are sub-divided into a number of approximately annual campaigns as listed in Table 1. The results from the first series of experiments (Campaign 1 in air) have been previously reported (Sims, Webb et al., 2013). It is obvious that this paper now substantially extends the previously published data.
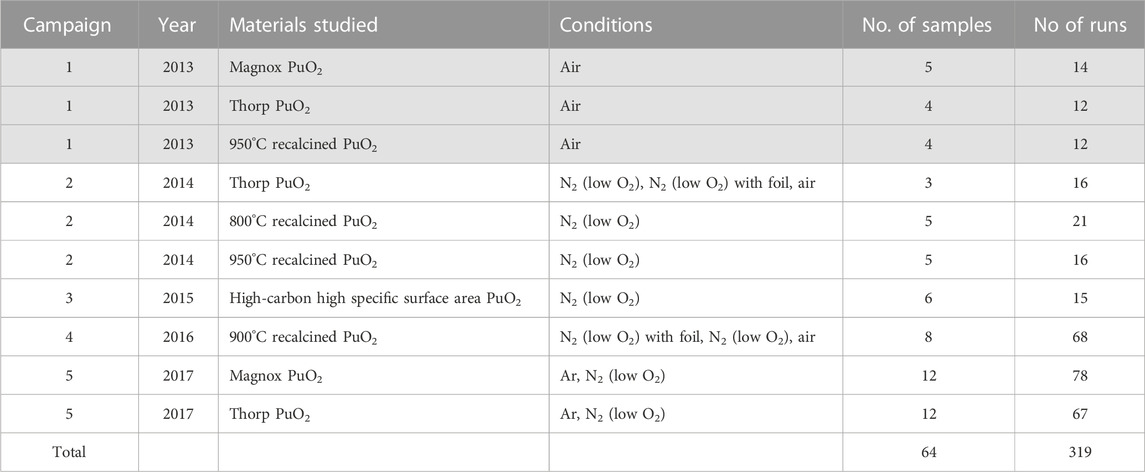
TABLE 1. Summary of experimental campaigns on radiolytic hydrogen production [greyed-out 2013 samples are those reported in (Sims, Webb et al., 2013)].
Table 2 summarises the PuO2 materials used and some key properties. Preparation methods for these materials were as follows:
• Thorp PuO2 and Magnox PuO2 powders were used ‘as received’ from the reprocessing plants without further treatment (Campaigns 1, 2, 5).
• Magnox derived PuO2 that had previously been used in water (physi-)adsorption experiments 1 was heated to 1) 800, 2) 900 and 3) 950 °C. Ramp rates were 20°C per minute with hold times at peak temperatures of 2–3 h. A dry nitrogen flow was passed over the sample throughout the heating. The apparatus was sealed at the end of the experiment and the final powders were weighed and transferred to aluminium screw top cans (Campaigns 2, 4).
• A high specific surface area PuO2 sample was prepared by precipitation of plutonium (IV) oxalate from a solution of plutonium nitrate (8.5 gPu.L−1) in 2 mol.L−1 nitric acid using 1 mol.L−1 oxalic acid in deionised water added slowly over a period of 10–60 min at a temperature of 50°C–55°C with stirring (direct strike precipitation mode). The volume of oxalic acid added was calculated to give a free oxalic acid concentration of 0.05–0.15 mol.L−1 in the final slurry. A further digestion time of 60 min was carried out also at 50°C–55°C prior to filtration. The slurry was then filtered (sub-micron filter, 0.02 µm), washed with 1.5 mol.L−1 nitric acid followed by deionised water, weighed and transferred to a storage container. After initially dehydrating the solid under nitrogen at 120°C–180°C for 30 min the oxalate was decomposed to plutonium dioxide on a hot-plate at 400°C–450°C in a nitrogen atmosphere (oxygen levels <1%). It is noted that this sample (for Campaign 3) had different flow properties to the as-received Magnox and Thorp powders.
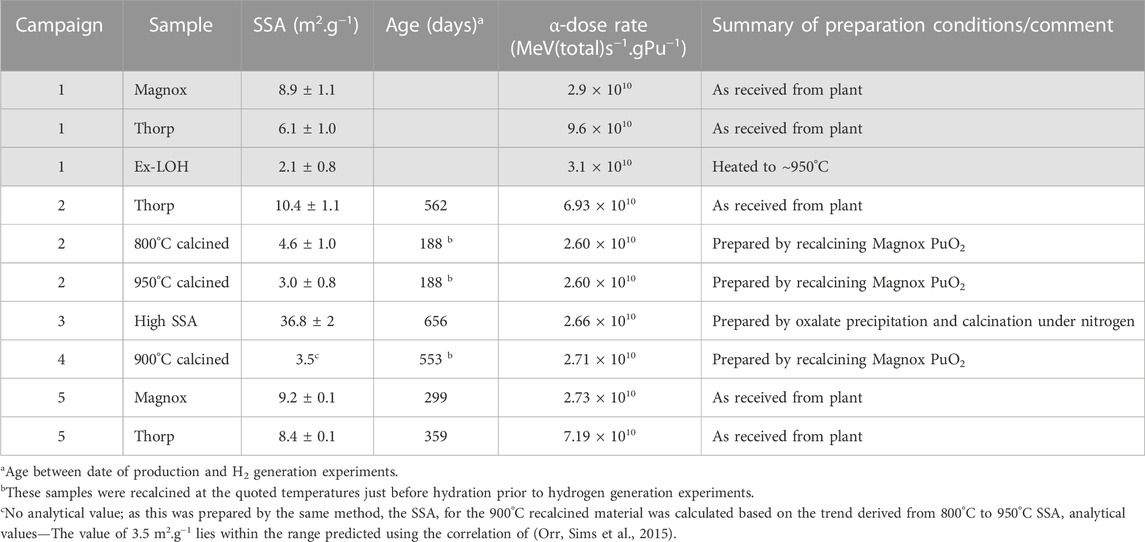
TABLE 2. Summary of PuO2 powders investigated (greyed-out Campaign 1 samples are those reported by Sims et al., (Sims, Webb et al., 2013)).
The samples were derived from several sources of material, covering a range of relevant isotopic compositions. See Supplementary Table S1 in the Supplementary Material for details of materials used in Campaigns 2-5 and Table 2 of reference (Sims, Webb et al., 2013) for the materials used in Campaign 1.
Loss on heating (LOH) measurements at 950°C were undertaken to determine the quantity of strongly bound water on materials prior to humidification. The mass losses measured were:
• 0.45 wt% (2.1 ML H2O2) for the Campaign 2 Thorp PuO2
• 0.07 wt% (0.7 ML H2O) for the Campaign 2, 800°C recalcined Magnox PuO2
• 1.41 wt% (1.8 ML H2O) for the Campaign 3 High SSA PuO2
• 0.20 wt% (1.0 ML H2O) for the Campaign 5 Magnox PuO2
• 0.25 wt% (1.4 ML H2O) for the Campaign 5 Thorp PuO2
The 950°C recalcined sample can be assumed to be 0 wt% LOH as this is the basis for the LOH measurement. It was thus concluded that there was up to 1 ML strongly bound (chemi-sorbed) H2O present on the recalcined materials and ∼2 ML chemi-sorbed H2O present on ‘as received’ materials prior to hydration. The high SSA PuO2 prepared in the Laboratory also had a high degree of residual carbon, measured to be ∼4,000 ppm.
We have previously published some characterisation data on related samples. Scanning electron microscope (SEM) images of Magnox, Thorp (Orr, Sims et al., 2015; Webb, Taylor et al., 2019) and recalcined (low SSA) (Sutherland-Harper, Pearce et al., 2018; Taylor, Hobbs et al., 2018) PuO2 samples have been reported showing some subtle differences. The main morphology is square platelets, as expected from oxalate derived powders, but some trapezoidal (truncated square pyramids/octahedrons) particles were also observed. The recalcined samples appeared to be grouped together in denser clusters of similar morphology. However, the high SSA powders were different, being agglomerates of amorphous forms with little evidence of square platelets and apparently high porosity (as expected from the SSA) (Sutherland-Harper, Pearce et al., 2018; Taylor, Hobbs et al., 2018). It has also been shown that crystallite size decreased and lattice parameter increased as Magnox PuO2 was re-heated in a furnace at temperatures of 100°C–950°C (materials were as received Magnox PuO2 similar to that used here (Sutherland-Harper, Pearce et al., 2018; Taylor, Hobbs et al., 2018) and early materials from the 1970s that were contained in non-welded packages and have substantial chloride contamination from polyvinyl chloride bag degradation (Sutherland-Harper, Livens et al., 2019)). Whilst lattice parameter decreased at temperatures above 300°C, crystallite size did not appear to increase until the original calcination temperatures of the materials were exceeded. These changes are expected as the aged/radiation damaged powders are annealed at high temperatures.
These studies used the same experimental procedures as described in our previous publication (Sims, Webb et al., 2013). Typically, 0.5–1 g samples of PuO2 powders were exposed to atmospheres of varying RH; these samples were weighed periodically to assess hydration levels. Samples were then transferred to ‘radiolysis vessels’ and sealed with periodic gas sampling for H2 analysis. The atmosphere inside the vessels was completely refreshed to remove any buildup of H2 between experimental runs. All experiments were undertaken at ambient temperature (ca.22°C). The specific surface area of the PuO2 samples were determined by BET analysis using nitrogen as the adsorbate gas at 77 K (data provided by Sellafield Ltd Analytical Services using Quality Assured Analytical Methods).
Powders were stored in a dry (<1% RH) argon or nitrogen (N2) atmosphere glove box for several days prior to being humidified. Once the samples had been weighed, they were transferred to controlled atmospheric vessels to equilibrate at different humid environments. For the initial humidification, solutions of differing sulphuric acid (H2SO4) concentrations were used to generate relative humidities between 7% and 95% RH. Samples were kept in these conditions for typically around 3 weeks with intermittent weighing of each sample. Some variability was seen in the uptake of water as measured by the mass gain in some cases but exemplar results are illustrated in Figure 1. The value of 0.21 mg.m−2 derived by Haschke and Ricketts (Haschke and Ricketts, 1997) for the mass of one monolayer of water per square metre was used to determine the number of monolayers adsorbed to each sample. The water adsorbed for each sample (in ML) are listed in Supplementary Table S2.
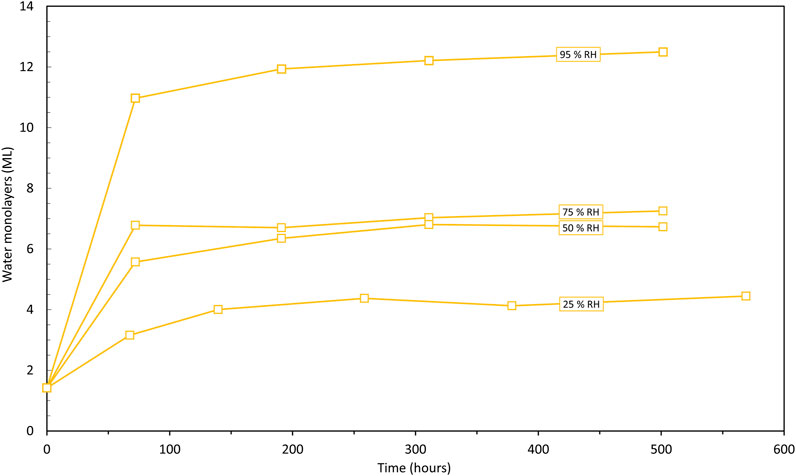
FIGURE 1. Calculated number of water monolayers (ML) on Thorp PuO2 as a function of time in the relative humidity range (25%–95%) (Note: Assumes 1.4 monolayers of H2O at the start of humidification in air).
Once the samples have reached equilibrium when the humidity conditions and weight remained constant, they were transferred to the ‘radiolysis vessels’. The radiolysis vessel has been described in detail in previous work (Sims, Webb et al., 2013) and simply comprises an inner vial containing the PuO2 and an outer quickfit test tube fitted with a quickfit valve. The set-up had been tested for leak tightness to hydrogen by filling an empty system with a 100 ppm hydrogen in argon standard and analyzing the hydrogen concentration after a few weeks standing to verify there was no change due to leaks. A schematic is shown in Supplementary Figure S1 of the Supplementary Material. The vessel was loaded with typically 0.75 mL of the appropriate acid solution to maintain the required humidity throughout the entire experiment. The vial of material was loaded into the vessel above the acid solution and remained out of contact to avoid cross contamination. The valve was then sealed for the duration of the experimental run. Transfer times from the humidity chamber to the radiolysis vessel were as short as possible to minimise any desorption of water.
Throughout the experimental run, the gas volume was sampled periodically using a gas tight syringe attached to the valve. The gas was analysed for H2 gas initially using an Agilent 3,000 A micro gas chromatograph (GC) up to 2016 and then subsequently an Agilent 490 Micro GC. In each case the GC used an argon carrier gas, molecular sieve 5 Å column, and thermal conductivity detector. The detection limit for hydrogen was ∼5 ppm. The gas sample volume was typically 10 mL from a total vessel volume of ∼54 mL. The radiolysis vessel was then backfilled with 8.5 mL of glove box atmosphere to maintain atmospheric pressure within the vessels. A ‘zero’ time sample was taken at the onset of each experimental run to determine the baseline level of H2 in each sample. The GC was calibrated with a certified 100 ppm H2 in argon gas standard prior to each sample set and on completion of the experiments. Typically each experimental run lasted approximately 4–5 weeks, with 6–8 gas samples being taken. Run durations were limited by the safety requirement to keep the hydrogen concentration in the vessel below 1%. At the end of a run, the valve was removed from the vessel and the sample allowed to vent to the glovebox atmosphere for a minimum of 30 min before being replaced and re-sealed; alternatively, the closed system was repeatedly evacuated with a hand pump and back-filled with atmosphere. The pool of acid in each vessel ensured the humidity remained the same for the subsequent experimental run.
In all cases the H2 concentrations were plotted as a function of time and, apart from a few exceptions, discussed in Section 4.2, linear graphs were obtained—this agreed with previous results (Sims, Webb et al., 2013). A typical graph of H2 production as a function of time is given in Supplementary Figure S2. G (H2) values (expressed as number of molecules of H2 per 100 eV energy deposited into the adsorbed water, i.e., molec.100 eV−1)3 were determined from the gradient of these plots. The gradient of each data series was used to calculate the production rate for each individual sample; corrected for surface area and total α) decay energy (in units of moles.cm−3(H2).gPu−1.MeV−1.m−2). For reference, Supplementary Table S2 lists all the samples and experimental runs with corresponding hydrogen generation rates and calculated G (H2) values.
Each sample was run a number of times under the initial conditions of a given %RH. However, conditions were varied in a significant proportion of samples in order to provide further insight into the effects of atmosphere and the underlying radiation chemistry. These variations were4:
i. Changing the humidity conditions.
a. For samples where the relative humidity was decreased, the samples were placed inside a desiccator with ∼5 g of CaSO4 and evacuated to 0.1 bar using a hand pump and left at these conditions for ∼96 h, at which point the sample was re-weighed and placed in a constant humidity chamber with a H2SO4 solution (e.g., 7% RH) until constant weight was achieved. At this point the samples were placed back into the respective radiolysis vessels with the acid solution also adjusted.
b. Where the relative humidity was increased, this was achieved simply by replacing the acid solution with a lower concentration of acid and then re-sealed.
c. For a number of runs towards the end of a series, the acid solution was just removed and the vessel reset.
To be able to make comparisons with other work investigating H2 production from adsorbed water radiolysis, it is important to calculate the fraction of decay energy into the adsorbed water. For the material utilized in this research an approximate approach to the dosimetry was adopted as the crystallite size within the powders was less than 0.05 µm and the mass fraction of water in the powder was small. This crystallite value is much smaller than the range of a 5.5 MeV 4He2+ in PuO2 (∼12.5 µm); therefore, the α-particle will traverse several particles of PuO2 and layers of water before coming to rest. Consequently, the distribution of water and oxide can be well approximated as uniform over the α-particle track length and the energy partitioned to the water evaluated as the ratio of the stopping power of the water and the oxide averaged over the track length. The stopping powers of water and PuO2 were calculated using SRIM. Using this approach it can be shown that on a mass basis, H2O is 3.64 times as efficient as PuO2 at stopping helium ions; therefore, the energy absorbed by water can be calculated by Eqs. 1, 2 where
The analysis of measurements of hydrogen yields from PuO2 samples has been divided into three groups:
I. Relatively high purity PuO2 from Thorp and Magnox reprocessing plants used ‘as received’ from the plants
II. Lower SSA samples produced from recalcination of Magnox PuO2 at 800°C, 900°C or 950°C
III. High SSA PuO2 produced in the laboratory via the oxalate route but with decomposition in an inert atmosphere leading to around 4,000 ppm carbon contamination
First, the observations from each of the sets of experiments are summarised before discussing the trends and uncertainties in the results. From these data the hydrogen yields have been calculated as both G (H2) in molec.100 eV−1 and also the hydrogen generation rate normalised to total dose and specific surface area in cm3.MeV−1.m−2. This latter measure of hydrogen yield is included because if water coverage is purely a function of relative humidity then it would be unaffected by uncertainties in the measured weight of adsorbed water. Both measures of hydrogen yield are discussed herein, and data are compiled in Supplementary Table S2.
An important feature of nearly all the measurements is the linear increase in hydrogen produced with time during the runs. Whilst the rates showed some variation on successive nominally identical runs, the production of hydrogen was linear with time during any individual run. Only tentative evidence for a decrease in the rate after a long period between sampling was seen in a very small number of cases (1%–2% of runs; data in Supplementary Table S2). The observations of linear hydrogen production rates differs from other measurements of hydrogen production during radiolysis of water adsorbed on PuO2 reported in the literature (Venault, Deroche et al., 2019), where hydrogen production rates over time tended towards zero for freshly prepared PuO2 samples indicating a steady state was established. This may be a result of the comparatively large gas volumes present in our experiments; the relatively large gas samples taken for analysis which reduces the effective concentration of hydrogen in the vessel each time a sample is taken, potentially perturbing the approach to equilibrium of a recombination reaction; or limiting the hydrogen to 1% which then minimizes the back reactions that are thought to be a first order reaction. Other disadvantages of the simple vessel and gas sampling arrangements used here are that it is difficult to rule out possible small leaks over long intervals between sampling and that, due to safety considerations, there may be insufficient experimental run time to observe the approach to steady state. However, it should be noted that (Venault, Deroche et al., 2019) found that with one sample aged for 3 years, rather than freshly prepared, no steady state was observed and the samples analysed in the present study may have been more similar to these aged samples.
In the discussion of results below, the starting point will be the most consistent data on the simplest samples; these are the data obtained for as received production samples with 95% RH. From here we will look at the trends with RH and SSA (via samples produced or re-calcined in the laboratory). Ultimately, samples that generated ‘anomalous’ quantities of hydrogen will be presented and assessed.
A very small number of samples exhibited an additional small peak or two peaks in the gas chromatograms (see Supplementary Figure S3). The appearance of an extra peak(s) seemed to be linked with anomalous H2 production (see Section 4.6) but not exclusively. Efforts to identify this peak(s) were not successful.
Before considering the results obtained under humid atmospheres, a few dry samples were analysed. As expected, H2 generation rates from these samples were very low (mainly less than 100 nmol (H2) over the course of a run), reflecting only the small levels of adsorbed water present on the surface. There may be some indication that these data tend towards a steady state, but production rates are all very small with levels close to detection limits on the GC. It was concluded that differences in rates between dry runs are unlikely to be significant and consequently, this contribution can be ignored when considering samples exposed to moist atmospheres. The inference is that H2 generation by radiolysis of the first chemi-sorbed water layer(s) is small, particularly when compared to higher layers of more weakly adsorbed water molecules.
Firstly, results from production (as-received) Magnox and Thorp PuO2 will be considered; these data arise from Campaigns 1, 2 and, particularly, 5.
Hydrogen evolution rates and G (H2) values for each sample are given in Supplementary Table S2. Firstly, consider the samples exposed to the highest levels of humidity (95% RH). Apart from the low rate with the first run on the single Thorp Campaign 2 sample, no significant differences in H2 generation rate were seen between duplicate runs in Ar or N2 for Magnox or Thorp PuO2. The next highest RH used was 75%. No significant differences in H2 generation rate were seen between duplicate runs in Ar or N2 for Magnox PuO2 samples and Thorp PuO2 samples in Ar. However, Thorp samples showed an increase in hydrogen generation between run 1 and run 2 in N2; a third run on one sample gave the same hydrogen generation rate as the second run. Some difference in the initial state is implied for the Thorp samples stored in N2 at 75% RH.
The behaviour at 50% RH is similar to 75% RH. That is, no significant differences in H2 generation rate were seen between duplicate runs in Ar or N2 for Magnox PuO2 samples and Thorp PuO2 samples in Ar. However, in N2 Thorp samples show a more complicated behaviour. The Campaign 2 sample gave low G (H2) values of ∼0.005 whilst in the first Campaign 5 sample all three runs showed a similar behaviour but appeared to reach a steady state. In the second sample, runs 2 and 3 in N2 give reproducible results but again there may be a levelling off of the H2 generation rate; run 1 gave a very low rate of measurable H2 and may have been leaking.
At 25% RH, the H2 generation results are yet more complicated. In N2 with both Magnox and Thorp PuO2, consecutive runs give increasing G (H2) values (except the fourth run for the Thorp sample). In Ar, both Magnox and Thorp PuO2 showed a larger change in H2 generation rate between runs 2 and 3. These increases are illustrated in Figure 2 for the Magnox samples in N2 and Ar.
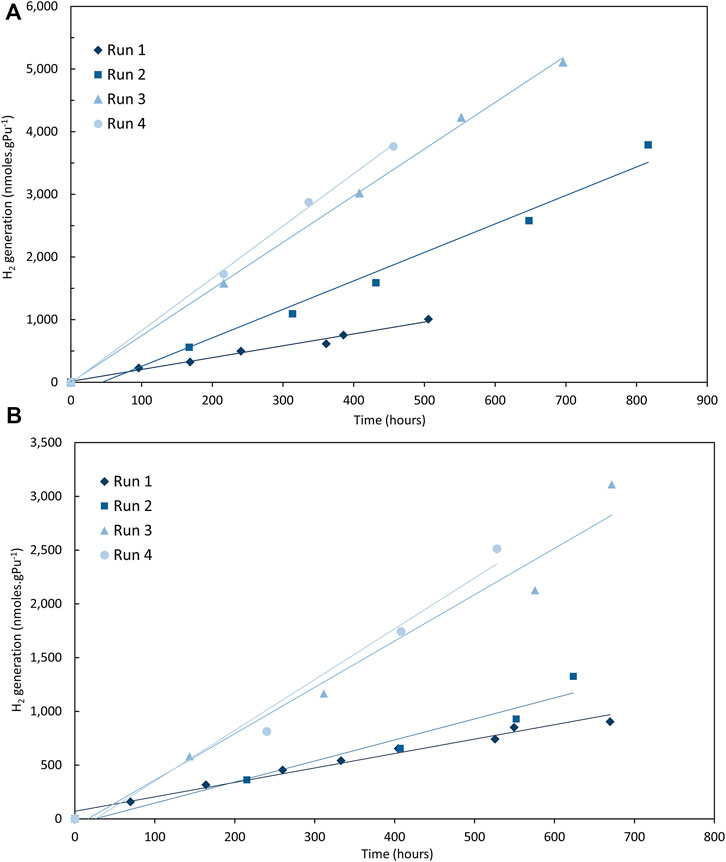
FIGURE 2. Hydrogen (H2) generation from Magnox PuO2 at 25% RH in (A) nitrogen (N2) and (B) argon (Campaign 5).
Basically, H2 generation rates decrease with decreasing RH, as expected from previous studies (Sims, Webb et al., 2013; Venault, Deroche et al., 2019)—this is shown in Figure 3 using the first runs from one sample at each RH for Magnox PuO2 in an Ar atmosphere (this avoids the complications illustrated in Figure 2). However, on closer examination, it appears that H2 generation rates are increasingly sensitive to conditions as RH decreases from 95% to 25%, particularly in the N2 atmosphere and possibly more so for Thorp samples compared to Magnox PuO2 samples. These new data can be compared to data obtained in air reported previously (Sims, Webb et al., 2013). A clear decrease in average G (H2) values with decreasing RH was reported for Magnox and Thorp PuO2 in air and this is illustrated in Figures 4, 5. This trend is also observed in argon and in nitrogen for the Magnox samples. However, the Thorp samples in nitrogen diverge from clear trends even at 75% RH. G (H2) values in nitrogen and argon are significantly lower than those measured in air in all cases. At 95% RH, the order of G (H2) is air >> argon > nitrogen although the differences between argon and nitrogen are quite small and potentially within uncertainty ranges.
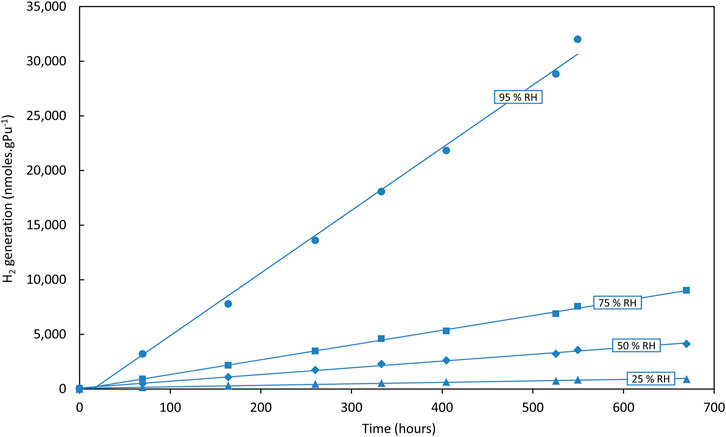
FIGURE 3. Hydrogen (H2) generation from Magnox PuO2 in argon at 25%–95% RH—First runs only.
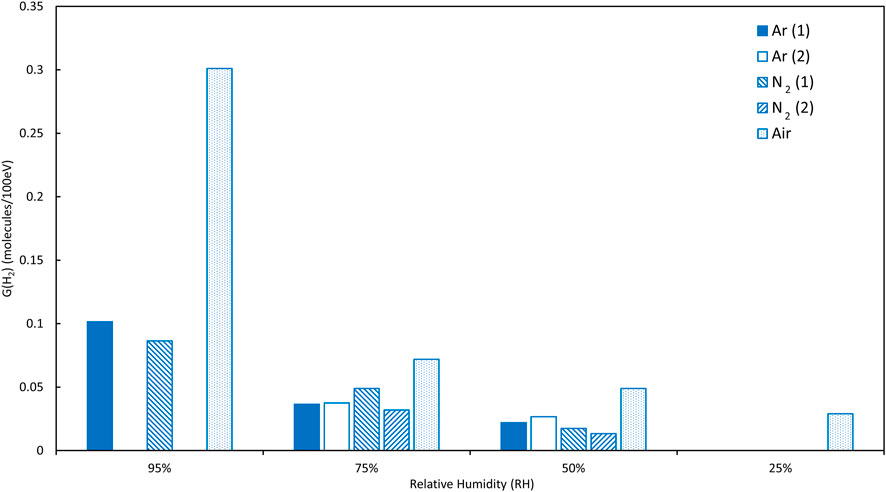
FIGURE 4. Magnox PuO2 samples, comparison of average G (H2) values for relative humidities of 25%–95% (gaps in data are where average values could not be calculated due to changing hydrogen generation rates, see text for details).
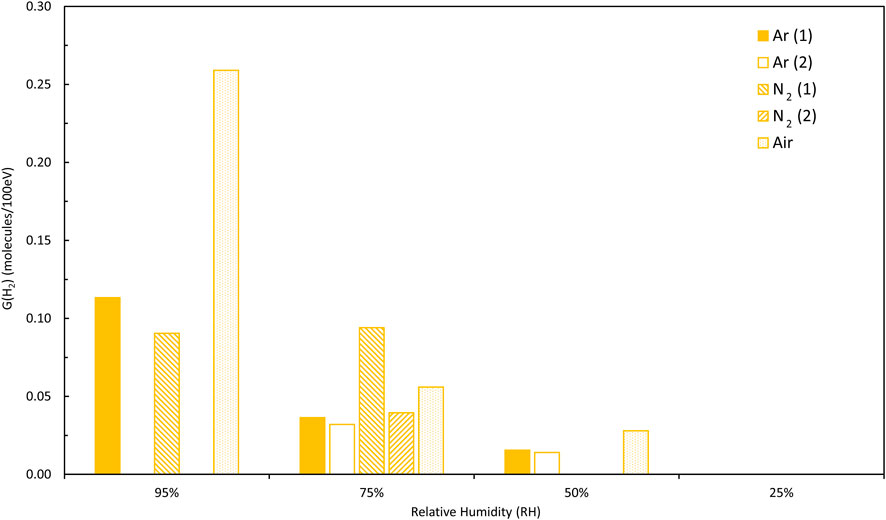
FIGURE 5. Thorp PuO2 samples, comparison of average G (H2) values for relative humidities of 25%–95% (gaps in data are where average values could not be calculated due to changing hydrogen generation rates, see text for details).
A number of Magnox PuO2 samples were recalcined at higher temperatures in our laboratory before using them in the H2 generation experiments. These recalcined materials with concomitant SSA reduction will now be considered; these data arise from Campaigns 2 and 4 and all experiments, discussed here, were under N2. Hydrogen evolution rates and G (H2) values are given in Supplementary Table S2.
At 95% RH good agreement between runs is observed for all samples but the average G (H2) changes between Campaign 2 (800, 950°C calcined) and the later Campaign 4 (900°C calcined) from ∼0.08 to ∼0.24; this is possibly due to ageing (see Table 2). At 75% RH, there is more variation. The first run on the 800 °C sample is low but the next three runs gave good agreement. The replicate 900°C samples showed some variation in the runs and also between the two samples whereas the 950°C runs showed good agreement, but the average G (H2) value was 0.014 compared to an average of ∼0.04 for all other runs with 800°C and 900°C samples.
However, interesting results were obtained at 50% and 25% RH (see Figure 6). In all cases hydrogen generation rates increased between runs; in a few samples they seemed to reach a constant value eventually and possibly the effects were reduced at the higher calcination temperatures (in the 50% RH series). Abnormally high G (H2) values were calculated for some runs, particularly for the 25% RH samples—this will be discussed later.
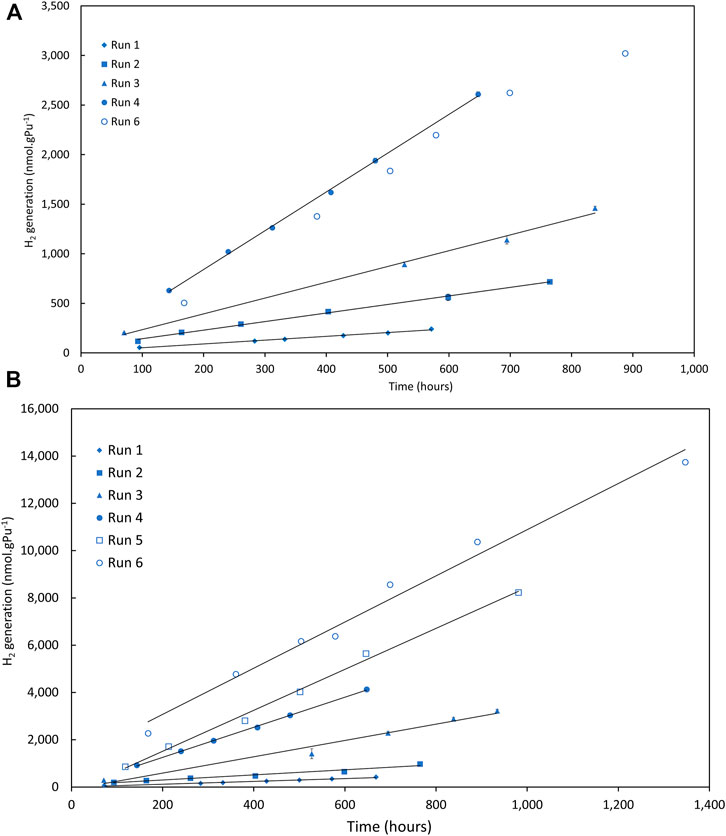
FIGURE 6. Hydrogen (H2) generation in (A) 25% RH and (B) 50% RH nitrogen atmospheres for Magnox PuO2 recalcined at 800°C (Campaign 2), run 5 omitted for clarity in (A). Error bars are typically within markers.
It appears that some aspect of the samples is changing with each run causing a variation in the calculated G (H2). As before, some samples eventually reach a consistent value between adjacent runs and it has been an assumption so far that this represents the nominal G (H2) value for that sample (noting that the measured hydrogen generation used to calculate G (H2) is a net value inclusive of both forward and back reactions). However, given the increasing generation of hydrogen to quite large values at low %RH, an alternative interpretation might be that it is the first run that is more representative, at least for RH <50%.
The H2 generation rate and G (H2) for run 1 of each sample as a function of %RH is shown in Figure 7, also compared to the Campaign 5 Magnox and Thorp samples and high SSA samples (see next section). The H2 generation rates for the recalcined samples are low, particularly at ≤75% RH and show a weaker trend with increasing RH than the as received Magnox and Thorp samples and High SSA samples. Conversion to G (H2) values gives a somewhat different picture due to normalization for the energy absorbed by the water (which in turn is a function of the mass of adsorbed water and specific alpha activity). Ignoring the High SSA samples (see Section 4.5), G (H2) values are low and between 25% and 75% RH the values are all rather similar with an average G (H2) in the range 0.03–0.04. For the 900°C and 950°C samples, a small decrease is seen between 25% and 50% RH indicative perhaps of an over-estimation at 25% RH due to the changing H2 generation rate (see Figure 6). The 900 °C samples, however, show a significantly higher G (H2) at 95% RH; this is a consequence of the relatively low water adsorption that was measured on these samples during the hydration stage. The cause for this difference is not clear but these samples were aged 365 days longer than the 800°C and 950°C samples. The average G (H2) for the 900°C samples in fact exceeds that measured for the ex-LOH sample in air (Campaign 1). The effect of SSA is only seen for the high SSA samples in Campaign 3; otherwise there is no clear relationship. Simplistically it might be expected that SSA would not be important in controlling the chemistry at a given water thickness, so G (H2) might not be strongly affected by SSA. Where this might not be true is that if the crystallite size changes with the SSA, then nanoparticle effects and energy transfer might be affected as the crystallites become very small. Surface recombination and porosity may also be factors. Indeed, it seems likely that other effects related to, inter alia, the surface condition or morphology or nitrogen chemistry are dominating. Further, it might have been expected that the initial recalcining would have annealed the surface. However, (Venault, Deroche et al., 2019) showed that it took three annealing cycles to return the H2 generation rate of an aged PuO2 sample to that of a fresh sample.
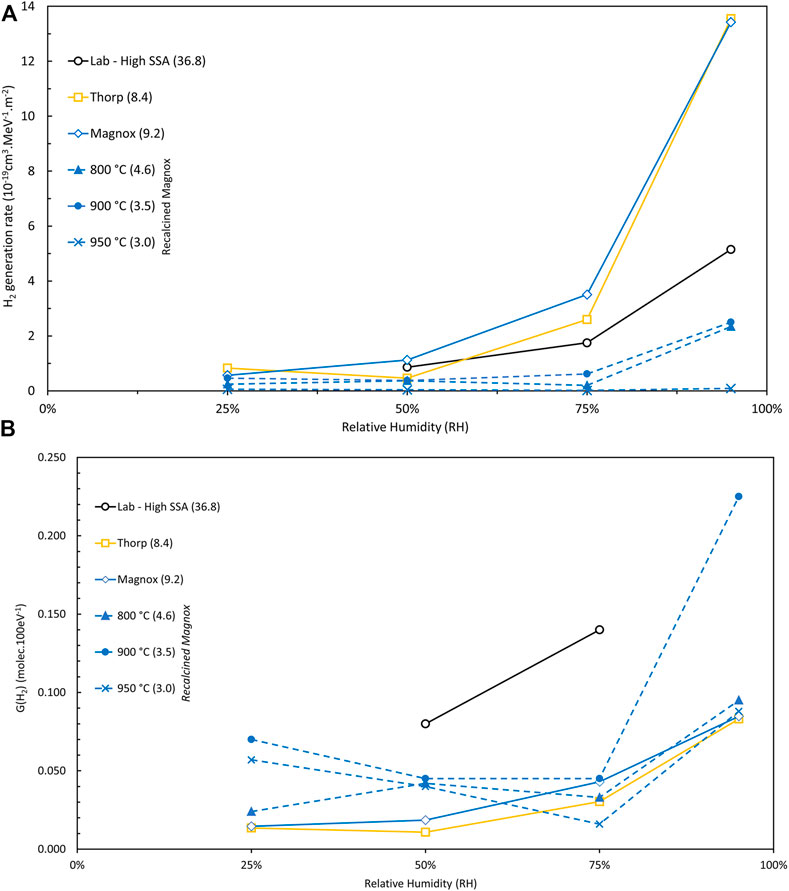
FIGURE 7. Graphs of (A) hydrogen (H2) generation rates (units of 10−19 cm3.MeV−1.m−2) and (B) G (H2) values obtained in run 1 vs. relative humidities (RH) for PuO2 samples of differing origin (see figure legend) and SSA (given in brackets in legend in units of m2.g−1). Data are averages of duplicate samples (where available) in N2 atmosphere.
Results from H2 measurements on samples of high SSA PuO2 in a N2 atmosphere, i.e., Campaign 3, that had been prepared in the laboratory rather than production materials are given in Table 3 as well as Supplementary Table S2. The results are compared to other Magnox and Thorp samples in Figure 7. Good agreement between duplicate runs and duplicate experiments was observed in all cases between 95% and 50% RH. H2 generation rates were high but decreased with decreasing RH, as expected. Absolute quantities of water adsorbed are high due to the high SSA (ca. 20 mg) but, in monolayers, water concentrations are in the range 3.3–4.2 ML for 50%–75% RH. Unfortunately, the water weight measurements were concluded to be unreliable for the 95% RH samples due to losses of water when weighing samples outside of the humidity chamber and so G (H2) values could not be calculated. G (H2) values for the 50% and 75% RH are substantially higher than production Magnox or Thorp samples in any atmosphere, even air. The morphology of our laboratory prepared high SSA PuO2 has been discussed previously and differs significantly from production PuO2 (Orr, Sims et al., 2015; Sutherland-Harper, Pearce et al., 2018; Taylor, Hobbs et al., 2018) being more amorphous and highly porous. It should also be noted that these samples also had high levels of carbon contamination due to being decomposed at a relatively low temperature in argon rather than air (Table 3).
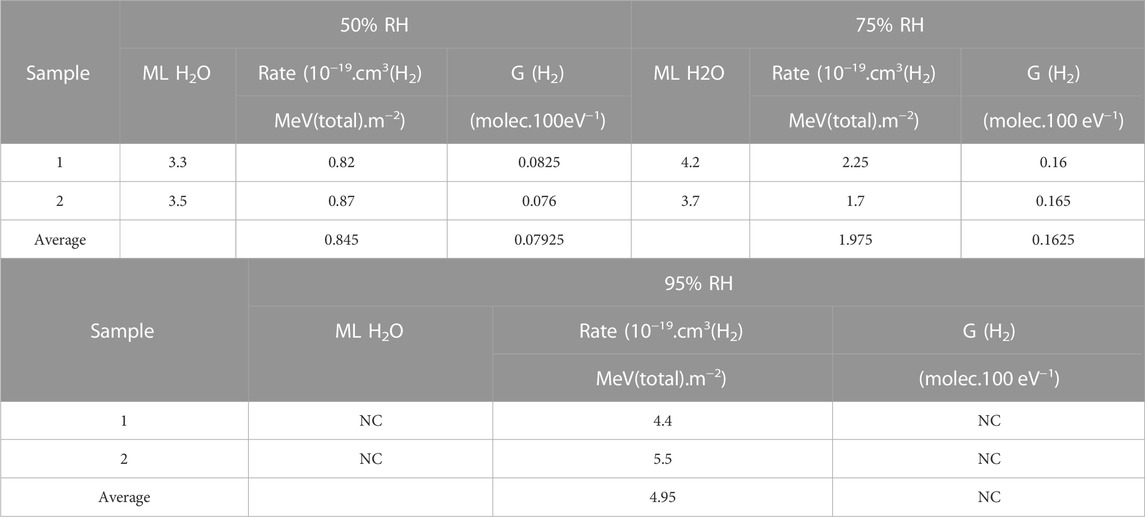
TABLE 3. Average hydrogen generation rates and G (H2) values for high SSA PuO2 samples exposed to 50, 75% and 95% RH atmospheres (NC, not calculated).
Sims et al. (Sims, Webb et al., 2013) demonstrated a relationship between G (H2) and the number of water monolayers adsorbed onto the PuO2 surface (see Section 4.7 below). It was shown that above ∼5 ML and G (H2) ∼0.5 the curve plateaus and below 2 ML H2O low G (H2) values less than ∼0.01 pertain. Similarly, the G (H2) value measured for a slurry of PuO2 powder in water, which might be considered a limiting value, was found to be in the range of approximately 0.5–0.6 (compared to aqueous plutonium solutions where G (H2) values of ca. 1 to 1.5 are reported depending on the solution (Gregson, Horne et al., 2018)). It is observed in the earlier sections that hydrogen generation in some samples increased on subsequent runs, particularly at low %RH, e.g., see Figures 2, 6, and it is evident that some of these experimental runs generated excessive (herein termed ‘anomalous’) quantities of hydrogen with G (H2) values even exceeding 0.5 in some cases (see Supplementary Table S2). This anomalous behaviour was observed with samples in the N2 and Ar atmosphere. The anomalous generation was most noticeable in the recalcined low SSA samples although G (H2) for the final runs on as received Magnox and Thorp samples in N2 at 25% RH are significantly higher than the averages for 50% and 75% RH. Key examples of how the hydrogen generation rate increases with subsequent runs to these anomalously high levels are illustrated in Figure 8 for six different materials in N2 at 25% RH. It appears that the second 900 °C sample is ‘lagging’ behind the first sample in generating the anomalous quantities of H2. It is interesting here that the trends for increasing H2 generation seem to follow decreasing SSA.
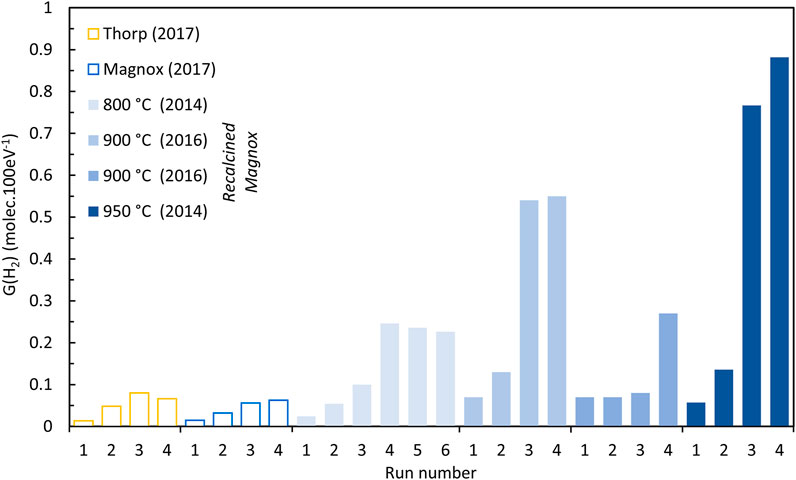
FIGURE 8. Magnox, Thorp and recalcined Magnox (800°C–950°C) PuO2 samples generating anomalous quantities of hydrogen at 25% RH (N2 atmosphere).
One explanation for this anomalous behaviour is contamination of the sample with water or an organic substance. This may be indicated by the presence of a small additional peak(s) in the gas chromatograms of most of the anomalous samples (Supplementary Figure S3). This peak(s) could not be positively identified but potential species separable by the 5 Å molecular sieve column used are NO, CH4 and CO. However, previous studies [18, 32] rigorously tested the methods used in these experiments and further system checks here found no evidence for sources of contamination. There was negligible hydrogen generated from the sulphuric acid in the vessel once the PuO2 was removed and no sulphate could be detected in the PuO2 after leaching. Two different methods were used for flushing and re-setting the vessels between runs including using a vacuum pump with the vessel lid kept in place which would prevent contamination of the vessel by the glove box operator. The method for flushing had no impact on the anomalous hydrogen generation observed. One pair of samples were switched to prove that the anomalous hydrogen generation was associated with the PuO2 sample, not the vessel. Leaking vessels would reduce the hydrogen generation rates and other random experimental errors would not be limited specifically to low %RH samples. In fact, the linear generation rates and reproducibility of the high %RH experiments indicates the reliability of the methods. Other factors are difficult to explain by contamination such as the increase of hydrogen seen at each re-start, rather than a constant high value; no anomalous hydrogen generation in the (few) dry samples analysed; organic contamination would likely yield even higher rates than those found here which seem to be bounded by water radiolysis. This anomalous production occurred in too many samples to neglect it as an aberration.
It is concluded that the anomalous H2 production represent real phenomena pertaining to the specific conditions present in these experiments, particularly those at low %RH and low SSA, that was unlikely to be due to contamination from organic or other interferences. The role of atmosphere seems important with nearly all events being seen with samples in a low oxygen-content nitrogen atmosphere; whether this is due to an enhanced production rate under these conditions or suppression of a back reaction is not known. Furthermore, the role of nitrogen radiation chemistry on the surface of PuO2 may be important.
Thus far we have only considered the effect of RH on hydrogen generation. However, as noted above, Sims et al. (Sims, Webb et al., 2013) demonstrated a relationship between G (H2) and the calculated monolayer water coverage of the PuO2 surface. Supplementary Table S2 includes the ML (H2O) determined for each sample based on the measured mass change during the hydration phase and the reported PuO2 SSA (Table 2). These data are illustrated in Figure 9 where it is seen that:
• There is good agreement between duplicate samples in Campaigns 3, four and 5 (within about half a monolayer which is consistent with the measurement errors) indicating the hydration set up treated samples consistently.
• Based on LOH analysis it is assumed that there are 2 ML of water chemisorbed on as received samples and 1 ML of water on samples that were recalcined in the laboratory shortly before hydration. This is consistent with other water adsorption studies we (Taylor, Hobbs et al., 2018) and others (Paffett, Kelly et al., 2003) have made.
• Across all the data, the trend is that ML (H2O) increase with increasing RH, as expected but there is a lot of variation in the data. The data for ex-LOH samples (Campaign 1) are used to exemplify this trend in Figure 9.
• The Magnox and Thorp samples from Campaigns 1, 2 and 5 all follow the expected trend, increasing with RH, and more sharply at 95% RH.
• There are only two values at 50% and 75% RH for the High SSA Campaign 3 samples but the average values seem in line with trends (3.4 and 4 ML H2O respectively).
• The recalcined materials, however, showed less expected behaviours with the samples at 800°C (Campaign 2) samples decreasing slightly between 25% and 75% whereas the 950°C samples had a distinct peak at 75% RH (see Figure 9). The 900°C Campaign 4 samples showed only a weak trend across the RH range with the average ML actually a little higher at 75% than 95% RH. Although note that for the lower SSA samples the uncertainties are quite large due to the very small weight changes involved.
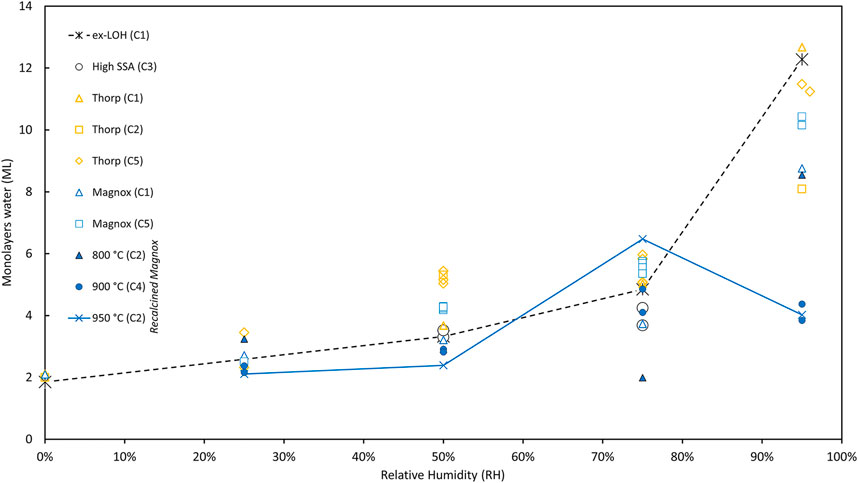
FIGURE 9. Water adsorption on PuO2 samples from Campaigns 1–5 (lines join samples of ex-LOH samples in Campaign 1 and 950°C samples from Campaign 2—See text for further details).
A modified version of the graph of G (H2) vs. RH, first reported in Sims et al. (Sims, Webb et al., 2013), is shown in Figure 10. The literature data (Duffey and Livingstone, 2002; Vladimirova, 2002; Viers, 2006) are given by open symbols and a polynomial fit is added to these data but only to illustrate the trend. (In this version, the literature data exclude some anomalously low G (H2) values from Veirs (Viers, 2006) and Duffey (Duffey and Livingstone, 2002) because the water in these vessels was not uniformly distributed and the water on the PuO2 was much less than originally assumed by Sims et al.). Our data from Campaigns 1 to 5 are now included, using G (H2) values calculated from the first runs only to avoid the complications of the ‘anomalous’ samples that showed increasing H2 generation with subsequent runs. Some observations are:
• The G (H2) values decrease sharply around 2 ML, indicating very low H2 generation from the chemi-sorbed layer.
• As reported previously (Sims, Webb et al., 2013) the Campaign 1 samples (in air) generally fit the literature trend.
• Most of the 900°C recalcined samples and High SSA samples fit the literature trend with G (H2) close to the apparent bounding values.
• The Campaign 2 and 5 data appear to generate lower amounts of H2 than expected above ∼4 ML of water.
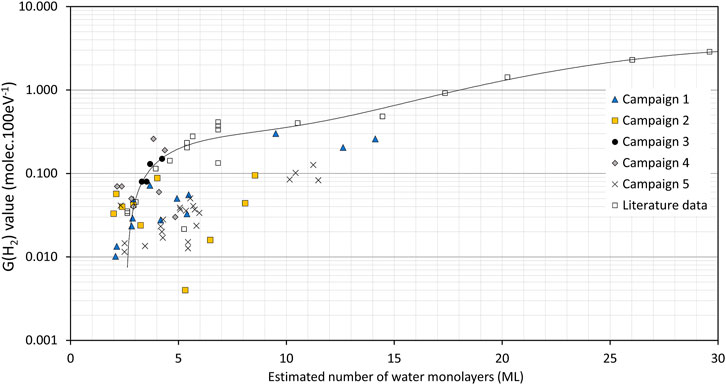
FIGURE 10. G (H2) values as a function of calculated ML (H2O) on PuO2 (open symbols = literature data, see Sims et al. (2013) for original references; closed symbols = Campaigns 1–5 with G (H2) calculated from the first experimental runs only, see Supplementary Table S2 for data). The line is a polynomial fit to the literature data only given as a guide to the general trend.
A substantial number of samples of PuO2 powder of varying properties and provenance have now been tested for hydrogen generation when placed under a range of humid atmospheres. Most of these samples arise from production PuO2 from reprocessing plants and so data are directly relevant to long term safe storage of nuclear materials. The hydrogen generation rates are clearly very susceptible to a range of factors making definitive conclusions difficult but important trends are clearly evident. In nearly all of the experiments here, linear generation rates were observed, in contrast to the work of Venault et al. (Venault, Deroche et al., 2019) where a steady state at very low hydrogen concentrations was observed for freshly prepared PuO2 but similar to aged samples that did not reach a steady state. Venault proposes this is due to some effect of ageing and surface alteration. Experiments performed on duplicate samples generally gave good agreement for hydrogen yields but large variations were seen between different samples and atmospheres at similar relative humidity. This implies that the variation is not caused by the precision or accuracy of measurements but is a consequence of sensitivity to variation in the surface chemistry of the samples that is difficult to control owing to effects of minor gas impurities and radiation chemistry effects. Hydrogen generation is, as expected, very low in dry samples suggesting radiolysis of chemi-sorbed water is a negligible contribution and rates increase with increasing RH as water ML on the surface increase; data at 95% RH are the most consistent and at this % RH for Magnox and Thorp production samples follow the trend: air >> Ar > N2. Hydrogen generation data from Thorp samples tend to show greater variability than Magnox samples as do data obtained under nitrogen compared with argon, especially as RH decreases—this implies effects of dose and atmosphere. However, particularly at low RH under argon or nitrogen, in some cases the rates are not reproducible but increase on each run leading to very high G (H2) values for PuO2. This ‘anomalous’ hydrogen production is difficult to understand but appears to be a real effect. Any effect of SSA is obscured by other factors except when the SSA is increased to nearly 40 m2.g−1 but these High SSA samples also differ in production route and morphology, porosity and carbon content.
Qualitatively, there are some useful touch-points with the studies of Venault (Venault, Deroche et al., 2019). Venault proposes that the forward reaction is a zero order radiolysis reaction dependent on surface adsorbed water whereas the back reaction observed for freshly prepared PuO2 samples is a first order chemical reaction that is affected by surface alteration. Our observations are broadly consistent with this concept. Hydrogen generation rates observed by Venault followed basic expected trends with RH, SSA and dose similar to our experiences but also showed a substantial variation with ageing, annealing and other conditions, as we do.
There is now a clear need to consider the effects of atmosphere in greater detail and evidence for a gas phase radiolysis contribution to the reactions that suppresses hydrogen generation; this will be the subject of future reports, as will the humidity dependence on H2 generation rate, shown in Figure 7.
The original contributions presented in the study are included in the article/Supplementary Materials, further inquiries can be directed to the corresponding author.
RO, HoS, and RT led the conception and design of the studies with additional contributions of SP, FC, and LJ. HeS and JeH organized the funding from Sellafield Ltd. RT led the writing of the manuscript with additional contributions of LJ, HoS, KW, HeS, and DW. KW led the experimental work supported by CG, JoH, BM, and LJ, with overall supervision of Orr. SP and FC supervised the post-doctoral studies of Jones and advised on the basic radiation science. RO, HoS, and KW analysed the data with support from RT and LJ. DW, JeH, and HS provided consultancy on plutonium storage with JeH and HS providing industrial perspectives. DW, HoS, KW, and RO checked the document and JoH, BM, and CG contributed to data checking. All authors contributed to manuscript revision, read, and approved the submitted version.
This study received funding from Sellafield Ltd, NNL and the Engineering and Physical Sciences Research Council. The funders were not involved in the study design, collection, analysis, interpretation of data, the writing of this article or the decision to submit it for publication. Sellafield Ltd are acknowledged for funding the majority of the studies described. Additional funding was provided by NNL’s core science theme ARIS (Advanced Recycle & Isotope Separations) and LJ was funded by the Engineering and Physical Sciences Research Council through the DISTINCTIVE project grant (EP/L014041/1) with additional support from the Dalton Cumbrian Facility.
Sellafield Ltd are acknowledged for provision of materials. The United Kingdom Nuclear Decommissioning Authority are thanked for supporting user access for LJ in NNL’s laboratories.
Authors JEH and HES were employed by Sellafield Ltd. Authors KW, CG, JOH, BM, RO, HOS, DW, and RT were employed by NNL.
The remaining authors declare that the research was conducted in the absence of any commercial or financial relationships that could be construed as a potential conflict of interest.
All claims expressed in this article are solely those of the authors and do not necessarily represent those of their affiliated organizations, or those of the publisher, the editors and the reviewers. Any product that may be evaluated in this article, or claim that may be made by its manufacturer, is not guaranteed or endorsed by the publisher.
The Supplementary Material for this article can be found online at: https://www.frontiersin.org/articles/10.3389/fnuen.2023.1127504/full#supplementary-material
1The water physi-sorption experiments involved a number of day-long heating and cooling cycles in which ∼10 g PuO2 is heated in a sealed vessel to ∼220°C in the presence of ∼100 mg H2O.
2Statistical ML of H2O calculated assuming a uniform coverage across the surface and without accounting for other adsorbed species.
31 molec.100eV = 0.10364 µmol.J−1.
4Also experiments were made with changing the head space atmosphere between runs on the same sample and/or capping samples with a barrier material to reduce the radiation dose to the headspace gas. These effects will be discussed in a future paper.
Cadman, L., and Goater, A. (2016). Managing the UK plutonium stockpile. London, Houses of Parliament, Parliamentary Office of Science and Technology. Postnote 531, 1–5.
Cook, P., Sims, H., and Woodhead, D. (2013). Safe and secure storage of plutonium dioxide in the United Kingdom. Actinide Res. Q. 2, 20–25.
Department of Energy, (2012). Stabilization, Packaging, and Storage of Plutonium-Bearing Materials. Washington, DC, USA: U.S. Department of Energy, 1–83. DOE-STD-3013-2012.
Duffey, J. M., and Livingstone, R. R. (2002). Gas Generation Testing of Plutonium Dioxide. Aiken, South Carolina: Westinghouse Savannah River Company. WSRC-MS-2002-00705.
Duffey, J. M., Veirs, D. K., and Berg, J. M., (2010). Livingston Pressure development in sealed containers with plutonium-bearing materials. J. Nucl. Mater. Manag. 38, 32–42.
Dunn, K. A., Chandler, G. T., Gardner, C. W., Louthan, M. R., McClard, J. W., Hackney, E. R., et al. (2010). Supporting safe storage of plutonium-bearing materials through science, engineering, and surveillance. J. Nucl. Mater. Manag. 38, 5–16.
Farr, J. D., Schulze, R. K., and Neu, M. P. (2004). Surface chemistry of Pu oxides. J. Nucl. Mater. 328, 124–136. doi:10.1016/j.jnucmat.2004.04.001
Gregson, C. R., Horne, G. P., Orr, R. M., Pimblott, S. M., Sims, H. E., Taylor, R. J., et al. (2018). Molecular hydrogen yields from the α-self-radiolysis of nitric acid solutions containing plutonium or americium. J. Phys. Chem. B 122, 2627–2634. doi:10.1021/acs.jpcb.7b12267
Haschke, J. M., Allen, T. H., and Morales, L. A. (2000). Reaction of plutonium dioxide with water: Formation and properties of PuO2+x. Science 287, 285–287. doi:10.1126/science.287.5451.285
Haschke, J. M., and Martz, J. C. (2000). Catalyzed corrosion of plutonium: Hazards and applications. Los Alamos Sci. 26, 266–267.
Haschke, J. M., and Ricketts, T. E. (1997). Adsorption of water on plutonium dioxide. J. Alloys Compd. 252, 148–156. doi:10.1016/s0925-8388(96)02627-8
Haschke, J. M., and Stakebake, J. L. (2006). “Handling, storage, and disposition of plutonium and uranium". The chemistry of the actinide and transactinide elements,” in The chemistry of the actinide and transactinide elements. Editors L. R. Morss, N. M. Edelstein, and J. Fuger (Dordrecht, NM, USA: Springer), 3199–3272.
Hyatt, N. C. (2017). Plutonium management policy in the United Kingdom: The need for a dual track strategy. Energy Policy 101, 303–309. doi:10.1016/j.enpol.2016.08.033
LaVerne, J. A., and Tandon, L. (2002). H2 production in the radiolysis of water on CeO2 and ZrO2. J. Phys. Chem. B 106, 380–386. doi:10.1021/jp013098s
LaVerne, J. A., and Tandon, L. (2003). H2 production in the radiolysis of water on UO2 and other oxides. J. Phys. Chem. B 107, 13623–13628. doi:10.1021/jp035381s
Morales, L. (1998). Preliminary report on the recombination rates of hydrogen and oxygen over pure and impure plutonium oxides. Dordrecht, NM, USA: Los Alamos National Laboratory, 1–37. LA-UR-98-5200.
Nuclear Decommissioning Authority (2014). Progress on approaches to the management of separated plutonium. Position Pap. Nucl. Decommissioning Auth., 1–18. Moor Row. SMS/TS/B1-PLUT/002/A.
Nuttall, P. A., and Robertson, R. I. (1987). Progessive development of PuO2 packages. Int. Conf. Nucl. Fuel Reprocess. Waste Manag. 2, 857–866. “RECOD 87”.
Orr, R. M., Sims, H. E., and Taylor, R. J. (2015). A review of plutonium oxalate decomposition reactions and effects of decomposition temperature on the surface area of the plutonium dioxide product. J. Nucl. Mater. 465, 756–773. doi:10.1016/j.jnucmat.2015.06.058
Paffett, M. T., Kelly, D., Joyce, S. A., Morris, J., and Veirs, K. (2003). A critical examination of the thermodynamics of water adsorption on actinide oxide surfaces. J. Nucl. Mater. 322, 45–56. doi:10.1016/s0022-3115(03)00315-5
Petrik, N. G., and Alexandrov, A. B., (2001). Interfacial energy transfer during gamma radiolysis of water on the surface of ZrO2 and some other oxides. J. Phys. Chem. B 105, 5935–5944. doi:10.1021/jp004440o
Seven days, (2017). Seven days, news in brief. Plutonium accident. Nature 546, 332. doi:10.1038/546332a
Sims, H. E., Webb, K. J., Brown, J., Morris, D., and Taylor, R. J. (2013). Hydrogen yields from water on the surface of plutonium dioxide. J. Nucl. Mater. 437, 359–364. doi:10.1016/j.jnucmat.2013.02.040
Stakebake, J. L. (1973). Thermal desorption study of the surface interactions between water and plutonium dioxide. J. Phys. Chem. 77, 581–586. doi:10.1021/j100624a003
Sutherland-Harper, S., Livens, F., Pearce, C., Hobbs, J., Orr, R., Taylor, R., et al. (2019). Interactions of HCl and H2O with the surface of PuO2. J. Nucl. Mater. 518, 256–264. doi:10.1016/j.jnucmat.2019.02.036
Sutherland-Harper, S., Pearce, C., Campbell, C., Carrott, M., Colledge, H., Gregson, C., et al. (2018). Characterisation and heat treatment of chloride-contaminated and humidified PuO2 samples. J. Nucl. Mater. 509, 654–666. doi:10.1016/j.jnucmat.2018.07.031
Taylor, R., Hobbs, J., Orr, R., and Steele, H. (2018). Characterisation of plutonium dioxide. Nucl. Future 14, 40–50.
Tegner, B. E., Molinari, M., Kerridge, A., Parker, S. C., and Kaltsoyannis, N. (2017). Water adsorption on AnO2 {111}, {110}, and {100} surfaces (an = U and Pu): A density functional theory + U study. J. Phys. Chem. C 121, 1675–1682. doi:10.1021/acs.jpcc.6b10986
Veirs, D. K., Joyce, S. A., Sims, H. E., Orr, R., Shaw, S., Smith, P. H., et al. (2019a). “Chapter 33: Plutonium packaging and storage plutonium handbook,” in Plutonium handbook. Editors D. L. Clark, D. A. Geeson, and J. Robert J. Hanrahan.U. S. A. La Grange Park (La Grange Park, IL, USA: American Nuclear Society), 2491–2581.
Veirs, D. K., Stroud, M. A., Narlesky, J. E., Berg, J. M., Romero, E. L., Rios, D., et al. (2019b). “Investigating the dependence of hydrogen and oxygen generation from high-purity plutonium oxides in sealed containers,” in Proceedings of the 19th International Symposium on the Packaging and Transportation of Radioactive Materials PATRAM 2019 (New Orleans, LA, USA, 1–10.
Venault, L., Deroche, A., Gaillard, J., Lemaire, O., Budanova, N., Vermeulen, J., et al. (2019). Dihydrogen H2 steady state in α-radiolysis of water adsorbed on PuO2 surface. Radiat. Phys. Chem. 162, 136–145. doi:10.1016/j.radphyschem.2018.09.022
Viers, K. (2006). Gas generation from water adsorbed onto pure plutonium dioxide powder. Mater. Res. Soc. Symposium 893, 0893–0803. doi:10.1557/PROC-0893-JJ07-03
Vladimirova, M. V. (2002). A mathematical model of radiolysis of water sorbed on PuO2. Radiochemistry 44, 501–507. doi:10.1023/a:1021143827755
Keywords: radiolysis, plutonium dioxide, hydrogen, storage, G-values
Citation: Webb K, Gregson C, Holt J, McLuckie B, Orr R, Sims H, Woodhead D, Hobbs J, Steele H, Currell F, Jones L, Pimblott S and Taylor R (2023) Effects of relative humidity, surface area and production route on hydrogen yields from water on the surface of plutonium dioxide. Front. Nucl. Eng. 2:1127504. doi: 10.3389/fnuen.2023.1127504
Received: 19 December 2022; Accepted: 22 February 2023;
Published: 22 March 2023.
Edited by:
Huifang Xu, University of Wisconsin-Madison, United StatesReviewed by:
Sarah Saslow, Pacific Northwest National Laboratory (DOE), United StatesCopyright © 2023 Webb, Gregson, Holt, McLuckie, Orr, Sims, Woodhead, Hobbs, Steele, Currell, Jones, Pimblott and Taylor. This is an open-access article distributed under the terms of the Creative Commons Attribution License (CC BY). The use, distribution or reproduction in other forums is permitted, provided the original author(s) and the copyright owner(s) are credited and that the original publication in this journal is cited, in accordance with accepted academic practice. No use, distribution or reproduction is permitted which does not comply with these terms.
*Correspondence: Robin Taylor, cm9iaW4uai50YXlsb3JAdWtubmwuY29t
Disclaimer: All claims expressed in this article are solely those of the authors and do not necessarily represent those of their affiliated organizations, or those of the publisher, the editors and the reviewers. Any product that may be evaluated in this article or claim that may be made by its manufacturer is not guaranteed or endorsed by the publisher.
Research integrity at Frontiers
Learn more about the work of our research integrity team to safeguard the quality of each article we publish.