
94% of researchers rate our articles as excellent or good
Learn more about the work of our research integrity team to safeguard the quality of each article we publish.
Find out more
ORIGINAL RESEARCH article
Front. Nucl. Eng., 01 March 2023
Sec. Radioactive Waste Management
Volume 2 - 2023 | https://doi.org/10.3389/fnuen.2023.1124856
This article is part of the Research TopicRadionuclides and Toxic Species Reactive Transport in Cement-Based Materials for Nuclear WasteView all 4 articles
 Sophie Dettmann1
 Nina M. Huittinen2
 Nicolas Jahn1Jerome Kretzschmar2
 Michael U. Kumke1*Tamara Kutyma3Janik Lohmann3
 Tobias Reich3*
 Katja Schmeide2*Salim Shams Aldin Azzam2Leon Spittler3
 Janina Stietz3
The retention of actinides in different oxidation states (An(X), X = III, IV, VI) by a calcium-silicate-hydrate (C-S-H) phase with a Ca/Si (C/S) ratio of 0.8 was investigated in the presence of gluconate (GLU). The actinides considered were Am(III), Th(IV), Pu(IV), and U(VI). Eu(III) was investigated as chemical analogue for Am(III) and Cm(III). In addition to the ternary systems An(X)/GLU/C-S-H, also binary systems An(X)/C-S-H, GLU/C-S-H, and An(X)/GLU were studied. Complementary analytical techniques were applied to address the different specific aspects of the binary and ternary systems. Time-resolved laser-induced luminescence spectroscopy (TRLFS) was applied in combination with parallel factor analysis (PARAFAC) to identify retained species and to monitor species-selective sorption kinetics. 13C and 29Si magic-angle-spinning (MAS) nuclear magnetic resonance (NMR) spectroscopy and X-ray photoelectron spectroscopy (XPS) were applied to determine the bulk structure and the composition of the C-S-H surface, respectively, in the absence and presence of GLU. The interaction of Th(IV) with GLU in different electrolytes was studied by capillary electrophoresis-inductively coupled plasma mass spectrometry (CE-ICP-MS). The influence of GLU on An(X) retention was investigated for a large concentration range up to 10−2 M. The results showed that GLU had little to no effect on the overall An(X) retention by C-S-H with C/S of 0.8, regardless of the oxidation state of the actinides. For Eu(III), the TRLFS investigations additionally implied the formation of a Eu(III)-bearing precipitate with dissolved constituents of the C-S-H phase, which becomes structurally altered by the presence of GLU. For U(VI) sorption on the C-S-H phase, only a small influence of GLU could be established in the luminescence spectroscopic investigations, and no precipitation of U(VI)-containing secondary phases could be identified.
Concepts of deep geological repositories for nuclear waste typically include the use of cementitious materials, for example, for construction, for backfill purposes, or for conditioning of the waste. Due to their high sorption affinity towards many radionuclides and the high pH of the cement pore water, cementitious materials can act as an efficient technical barrier for the retention of radionuclides in the repository (Tits and Wieland, 2018). Calcium-silicate-hydrates (C-S-H) are major constituents of hardened cement paste and have been shown to be the most important cement phases for the retention of tri-to hexavalent actinides (Atkins and Glasser, 1992; Pointeau et al., 2004; Stumpf et al., 2004; Gaona et al., 2011; Gaona et al., 2012; Tits et al., 2015; Häußler et al., 2018; Wolter et al., 2019b). C-S-H phases are nanocrystalline and their structure is dependent on the aging stage of the cement, as the pore water chemistry (e.g., Ca(II) concentration and pH) changes over time. In the first degradation stage (I) of cement, the pore water is rich in NaOH and KOH and has a high pH of ∼13.3 (Tits and Wieland, 2018). As the degradation progresses, portlandite is dissolved in a degradation stage II, leading to a pH of ∼12.5 in the pore water. In degradation stage III, leaching of the C-S-H phases occurs, during which the C/S ratio of the C-S-H decreases from approximately 1.7 to ∼0.7, while the pH of the pore water decreases to ∼10 (Tits and Wieland, 2018). The crystalline domains of the C-S-H phases have a tobermorite-like structure and consist of CaO sheets that are enclosed by silica tetrahedra and interlayers (Papatzani et al., 2015; Tits and Wieland, 2018). Immobilization of actinides can occur via sorption on the silanol groups at the surface of C-S-H phases, sorption into the interlayers, or via the incorporation into the CaO layers by exchange for Ca(II) ions (Pointeau et al., 2001; Tits et al., 2003; Tits et al., 2015; Wieland, 2014). Additionally, coprecipitation with ions from the pore water is possible, leading to the formation of new phases (Schlegel et al., 2004; Altmaier et al., 2005; Wieland et al., 2010).
Organic complexing agents that may be present in the radioactive waste include, e.g., cleaning agents, degradation products of cellulose materials, or additives of the cement. They may alter the retention of actinides by influencing complexation, by blocking sorption sites at the C-S-H surface, or by altering the structure and the chemical composition of the C-S-H phases (Dario et al., 2004; Gaona et al., 2008; Altmaier et al., 2021; Keith Roach and Shahkarami, 2021; Ochs et al., 2022). Gluconate (GLU) is widely used as a plasticizer in cement admixtures and it may also be present in the waste from the use in decontamination and cleaning agents (Taylor, 1997; Tits et al., 2005; Glaus et al., 2006; Keith Roach and Shahkarami, 2021). It can also be viewed as an analogue for the cellulose degradation product isosaccharinic acid (ISA), which is expected to be one of the most abundant complexing agents in a repository (Wieland, 2014). Owing to its carboxylic group as well as the hydroxyl groups, which can participate in complexation processes, GLU forms stable chelate complexes with a variety of radionuclides (Warwick et al., 2004; Tits et al., 2005; Gaona et al., 2008; Colàs et al., 2013; Adam et al., 2021). GLU also forms complexes with Ca(II) occurring in cementitious systems (Kutus et al., 2020). For tri- and tetravalent actinides, the formation of ternary complexes with Ca(II) was reported (Colàs et al., 2013; Böszörményi et al., 2020; Rojo et al., 2021). Sorption experiments and molecular dynamics (MD) simulations showed an increasing GLU sorption on C-S-H with increasing Ca(II) concentration, which was attributed to a mediating effect of Ca(II) at the interface (Androniuk et al., 2017). It was shown that GLU could reduce the retention of Eu(III) by hardened cement paste (HCP) with a pH of 12.5 at GLU concentrations as low as 1 × 10⁻⁶ M (Dario et al., 2004). Norden (1994) observed a reduction of Eu(III) retention by HCP (pH 12.5) at 3 × 10⁻⁵ M GLU. On calcite (pH 13.3), Eu(III) retention was reduced at 1 × 10⁻⁷ M GLU (Tits et al., 2005). In contrast, Tits et al. (1998) found no effect of GLU on the retention of Eu(III) and Th(IV) by C-S-H phases (pH 13.3) at [GLU] ≤ 1 × 10⁻⁴ M. In a recent study of the Pu-ISA-cement system by Tasi et al. (2021), a low uptake of Pu(IV) on cement at degradation stage II in the presence of ISA ([ISA]tot ≥ 3.2 × 10⁻⁵ M) was observed. However, to date, not much has been reported for the interactions between An(X), GLU, and cementitious materials at lower pH values expected in aged cement.
This study aims at extending the knowledge of the interactions between GLU, cement phases, and a number of actinides (An(X)) with different oxidation states (Am(III), Th(IV), Pu(IV), U(VI) as well as Eu(III) as a chemical analogue for Am(III) and Cm(III)) under conditions relevant for a nuclear waste repository. Here, C-S-H with a C/S ratio of 0.8 and a pH of ∼10 was chosen to represent aged cement of the degradation stage III.
The present study is a collaboration between three different institutions, covering both a broad spectrum of actinides in various oxidation states and a large variety of state-of-the-art analytical techniques. Therefore, experimental conditions of sorption experiments and the spectroscopic methods applied for sample characterization are not exactly identical for each actinide, but have been adapted with respect to the applied experimental technique. The retention of the An(X) was qualitatively and quantitatively studied in the absence and presence of GLU to elucidate the mechanisms by which GLU may influence the retention processes. Batch sorption experiments were performed to quantify the retention of the An(X) and GLU on a macroscopic scale. For the luminescent cations Eu(III) and U(VI), time-resolved laser-induced luminescence spectroscopy (TRLFS) was used to differentiate between different sorption complexes and to determine species-selective sorption kinetics. The uptake of Pu by C-S-H was probed by EXAFS spectroscopy. To analyze the complexation of Th(IV) and GLU in C-S-H pore water, capillary electrophoresis-inductively coupled plasma mass spectrometry (CE-ICP-MS) measurements were conducted. 13C and 29Si magic-angle-spinning (MAS) nuclear magnetic resonance (NMR) spectroscopy, X-ray photoelectron spectroscopy (XPS), and X-ray diffraction (XRD) were applied to characterize composition and structure of the C-S-H phases before and after the sorption experiments. In addition, also the binary systems An(X)/GLU, An(X)/C-S-H, and GLU/C-S-H were investigated as references to further analyze the interactions between the individual components. Finally, after sorption experiments, GLU concentrations in the remaining supernatants were determined by means of quantitative 1H NMR spectroscopy or liquid scintillation counting (LSC) from 14C-GLU spiked samples.
Amorphous C-S-H phases (C/S = 0.8) were prepared using the “direct reaction method” described by Atkins et al. (1992). In short, appropriate amounts of CaO and SiO2 were mixed with water or NaCl solution and shaken in an end-over-end rotator to allow the formation of the C-S-H phases. The S/L ratios, equilibration times, and materials used for the different experiments are summarized in Supplementary Table S1 (Supplementary Material). To avoid the formation of carbonates, the syntheses and retention experiments were performed in glove boxes under N2 or Ar atmosphere using deionized water (18.2 MΩcm; Millipore), which had been decarbonated by purging with Ar over night or boiling for at least 2 h, prior to use.
The C-S-H phases were prepared in 10 mL polycarbonate centrifuge tubes (Beckman Coulter, United States). The S/L ratio achieved in the samples was determined from the dry weight of the solids formed. After a two-week synthesis period, during which the centrifuge tubes were rotated in an end-over-end rotator (Stuart Rotator SB3, United Kingdom), aliquots of the respective GLU stock solutions were added. A non-radioactive GLU stock solution was prepared by weighing the appropriate amount of sodium gluconate (Sigma-Aldrich, United States) and dissolving it in deionized water at various concentrations for the batch sorption experiments. Additionally, a 14C-GLU tracer solution was added by diluting a stock solution of 3.7 MBq/mL 14C-GLU (Hartmann Analytic, Germany) in deionized water. The contact time of GLU with the C-S-H phases was 72 h.
A first batch sorption experiment was performed as a sorption isotherm of GLU (S/L = 5 g/L) over a concentration range of 1 × 10⁻⁹ to 1 × 10⁻¹ M. In the second experiment, the S/L ratio was varried (S/L = 0.5–50 g/L) at a constant initial GLU concentration of 1 × 10⁻² M. Finally, the samples were pre-centrifuged at 3,770 × g (SIGMA 3K30, SIGMA Laborzentrifugen, Germany) for 5 min and ultracentrifuged at 108,800 × g (Avanti J-30I, Beckman-Coulter, United States) for 1 h. The final pH of each suspension was determined using an inoLab pH/Cond 720 (WTW, Germany) pH-meter, which was connected to a BlueLine 16 pH electrode (Schott Instruments, Schott AG, Germany), with 3 M KCl (Mettler-Toledo AG, Switzerland) as filling solution. A three-point calibration was carried out using reference buffer solutions with the pH values 6.87 (SI Analytics, Germany), 4.01 and 9.18 (Merck, Germany). LSC (Hidex 300 SL, Hidex, Finland) was used to analyze the supernatants of the batch sorption samples containing 14C-GLU. To 10 mL LSC cocktail Ultima GoldTM XR (PerkinElmer LAS GmbH, Germany), 1-2 mL of the sample solutions was added. The samples were measured until a 2σ error of 2% was attained and with a resulting limit of detection (LOD) of 1 × 10⁻⁹ M for 14C.
XPS measurements were performed to determine the surface composition of the solids in presence and absence of GLU. After separation by ultracentrifugation, the C-S-H phases were dried under Ar atmosphere in a glove box at room temperature (RT) for at least 72 h. The sample powders were milled in an agate mortar and a small amount was pressed into an indium foil on a copper sample holder. The measurements were performed with a custom-built XPS system (SPECS GmbH, Germany) at RT and under a vacuum of 7 × 10⁻⁹ mbar. For photoelectron excitation, a non-monochromatic Mg Kα radiation (1,253.6 eV) from a high intensity double anode X-ray source (Al/Mg) XR-50 was used. Photoelectron detection was conducted with a constant analyzer pass energy of 13 eV using the PHOIBOS 100 hemispherical energy analyzer. The analysis of the spectra was carried out using CasaXPS (version 2.3.15). To calculate the corresponding atomic ratio
The Eu(III) samples were prepared in quartz tubes (Neubert-Glas GbR, Germany). For the retention experiments, different concentrations of EuCl3∙6H2O (Sigma-Aldrich, United States) and sodium gluconate (meets USP testing specifications, Sigma-Aldrich, United States) solutions were mixed at a neutral pH to form Eu(III)-GLU complexes. Afterwards, 1 mL of the mixtures was added to the C-S-H samples (after an initial formation time of 14 days) to yield a final S/L ratio of 33.3 g/L. The Eu(III) concentration in each sample was adjusted to 1 × 10⁻⁶ M or 5 × 10⁻⁵ M, along with eight different GLU concentrations between 5 × 10⁻⁶ M and 5 × 10⁻³ M. After preparation, the samples were equilibrated in an end-over-end rotator (REAX 20/4, Heidolph Instruments, Germany) for a contact time of 211 days. During that time, TRLFS measurements (cf. Section 2.2.2) at fixed time intervals were carried out to monitor the retention processes. Finally, six exemplary supernatants were subjected to GLU quantification by solution NMR spectroscopy (cf. Section 2.5).
As a reference experiment, 1 × 10⁻⁶ M Eu(III) was added at the very beginning of the C-S-H preparation process to foster the incorporation of Eu(III) into the C-S-H structure. After 14 days, GLU (5 × 10⁻⁶ M to 1 × 10⁻² M) was added and the samples were shaken for additional 4 weeks. Additional reference experiments were carried out in the C-S-H pore water. For this, the C-S-H phases were separated by filtration (Whatman 540, Cytiva, United States) after a formation time of 14 days. The liquid phase was mixed with stock solutions of GLU and Eu(III) to obtain samples with a Eu(III) concentration of 5 × 10⁻⁵ M and GLU concentrations between 2.5 × 10⁻⁶ M and 1 × 10⁻² M. The pH, which had decreased due to the presence of GLU, was adjusted to the intrinsic pH of the C-S-H pore water of 9.8 with approximately 3 µL of 7 M NaOH (Sigma-Aldrich, United States). The samples were equilibrated for 8 days before the measurements.
The Eu(III) samples were analyzed using TRLFS. The Eu(III) in the C-S-H samples was excited with a pulsed Nd:YAG laser (20 Hz, Quanta Ray, Spectra Physics, United States) combined with an OPO (GWU-Lasertechnik, Germany) set to 394 nm (using the 5L6←7F0 transition of Eu(III) for excitation). A spectrograph (Shamrock 303i, Andor Technology, Oxford Instruments, United Kingdom) equipped with a 600 lines/mm grating (blaze: 1,000 nm) and an ICCD camera (iStar DH720-18V-73, Andor Technology, Oxford Instruments, United Kingdom) were used to detect the emitted light in the spectral range of the 5D0→7F0 to 5D0→7F4 emission bands (574 nm ≤ λem ≤ 711 nm).
The pore water samples were measured with a Nd:YAG/OPO system operating at 10 Hz (Quanta Ray, Spectra Physics, Germany and GWU-Lasertechnik, Germany), a spectrograph (Kymera 328i, Andor Technology, Oxford Instruments, United Kingdom) with a 300 lines/mm grating (blaze: 760 nm) and an ICCD camera (iStar sCMOS, Andor Technology, Oxford Instruments, United Kingdom). Measurements of all samples were carried out using the box-car technique with an initial delay of 10 µs, a gate width of 1,000 µs and 100 different delays scaling with a linear increasing gate step. The C-S-H samples, equilibrated in an end-over-end shaker, rested for at least 60 min before measurements to allow the solid phase to settle. Both the solid and liquid phases were examined. The pore water samples were measured under constant stirring (PTFE stirring rods: Rotilabo, Carl Roth GmbH + Co. KG, Germany; stirring unit: CuV-O-Stir 333, HELLMA GmbH & Co. KG, Germany) to whirl up the precipitated solid into the light path. The limit of detection of the TRLFS setup used was approximately 5 × 10⁻⁸ M Eu(III).
The luminescence spectra were corrected for the spectral sensitivity of the grating and the ICCD camera. Parallel factor analysis (PARAFAC (Bro, 1997; Drobot et al., 2015) executed in Matlab 2019b (MATLAB, 2019, The MathWorks, Inc., Natick, MA, 2019.) with a monoexponential constraint in the time dimension and non-negativity in all other dimensions) was employed to deconvolute the time-resolved luminescence spectra at different GLU concentrations and contact times in order to obtain the emission spectrum, luminescence decay kinetics, and luminescence intensity of each Eu(III) species. From the deconvoluted spectra and the luminescence decay times, the Judd-Ofelt parameters and luminescence quantum yields of each species were determined. Assuming that all Eu(III) species are detectable and have similar extinction coefficients at 394 nm, the concentration ci of the different species can be calculated from the luminescence intensities Ii obtained by the PARAFAC analysis and the luminescence quantum yields Φi according to Eq. 2:
Since the Eu(III) luminescence is quenched in the presence of O-H oscillators due to a radiationless energy transfer to O-H vibrations, the number of water molecules n(H2O) in the first coordination sphere of the Eu(III) ions can be estimated from the luminescence decay time τ (Eq. 3), offering additional information about the coordination environment of the Eu(III) species (Marmodée et al., 2010):
For these experiments, the C-S-H phases were prepared as described in Supplementary Table S1 (Supplementary Material). Stock solutions of 241Am(III), 232Th(IV), and 239Pu(IV) were diluted to achieve the initial concentration of 1 × 10⁻⁸ M in the batch sorption experiments. A 232Th ICP-MS standard (SPS Science, Canada) was diluted in 2% HNO3. The 241Am(III) and 239Pu(IV) stock solutions were prepared as described elsewhere (Amayri et al., 2016) and subsequently diluted in 1 M HClO4. A Na-GLU solution was also added in the experiments with an initial concentration of 1 × 10⁻² M, where the order of reactant addition was varied: i) An(X) was equilibrated with the C-S-H phase for 72 h before the addition of GLU to the suspension and subsequent equilibration for another 72 h, referred to as (C-S-H + An(X)) + GLU in the following text, ii) GLU was equilibrated with the C-S-H phase for 72 h before the addition of An(X) to the suspension and subsequent equilibration for another 72 h, (C-S-H + GLU) + An(X), and iii) simultaneous addition of An(X) and GLU to the C-S-H suspension followed by equilibration for 72 h, (C-S-H + An(X) + GLU). The phase separation was performed as described in Section 2.1.1. For Am(III) and Th(IV), also the influence of time was investigated, and further separations took place after 59 and 71 days, respectively.
The analysis of 241Am(III), 232Th(IV) and 239Pu(IV) was performed with ICP-MS (Agilent 7900ce, Agilent Technologies, United States). For this, the samples were diluted in 2% HNO3. As an internal standard an aliquot of 193Ir in 2% HNO3 was added ([Ir] = 100 ppt). The LOD for ICP-MS measurements of 241Am(III), 232Th(IV), and 239Pu(IV) were 1 × 10⁻¹¹ M, 3 × 10⁻¹¹ M and 2 × 10⁻¹¹ M, respectively. The distribution coefficients Rd [L/kg] were determined by Eq. 4 using the sample volume V [L], the total mass of the solids m [kg], the initial concentration [An(X)]0, and the equilibrium concentration [An(X)]eq of the actinides.
One additional 239Pu batch sample was prepared for extended X-ray absorption fine structure (EXAFS) measurements using the same experimental procedure as described before with two exeptions: First, the total Pu concentration in the batch sample was increased to 5 × 10⁻⁶ M to make the detection of an EXAFS spectrum feasible. With a S/L ratio of 2.5 g/L, this resulted in a sample loading of 494 ppm Pu on C-S-H (C/S = 0.8). Second, to avoid the precipitation of Pu(IV) colloids at pH 10.6 at the C-S-H phase, the initial Pu oxidation state was +III. As the Pu L3-edge X-ray absorption near edge structure (XANES) spectrum showed, the initial Pu(III) was completely oxidized to Pu(IV). This also agrees with the redox conditions during the contact time of Pu in the C-S-H suspension with an Eh value of +29 mV (SHE). The Pu L3-edge EXAFS measurement was performed at the BM20 Rossendorf Beamline (ROBL) (Matz et al., 1999; Scheinost et al., 2021) at the European Synchrotron Radiation Facility (ESRF), Grenoble, France. Details of this measurement and the EXAFS data analysis are given in the Supplementary Material.
The complexation behavior of Th(IV) with GLU at pH 10 and the influence of Ca(II) were investigated by capillary electrophoresis (CE) coupled to ICP-MS. Four samples with 4 × 10⁻⁷ M Th(IV) were investigated at pH 10 and 0.1 M ionic strength. The pH and the ionic strength were adjusted using NaOH (VWR Chemicals, United States), HClO4 (VWR Chemicals, United States), and NaClO4 (Fluka Analytical, Germany), respectively. Solution 1 contained only Th(IV) and no GLU and no Ca(II). Solution 2 consisted of Th(IV) and 1 × 10⁻² M GLU. Sample 3 was prepared the same as sample 2 but in C-S-H pore water, i.e., with [Ca(II)] = 1.7 × 10⁻³ M (Häußler et al., 2018). To emphasize the influence of Ca(II) on the Th(IV)-GLU complexation, the Ca(II) concentration was increased. Therefore, solution 4 had the following composition: 4 × 10⁻⁷ M Th(IV), 1 × 10⁻² M GLU, and 1 × 10⁻² M Ca(II).
The experimental setup consisted of CE (Agilent 7,100, Agilent Technologies, United States) coupled to ICP-MS (Agilent 7900 ce, Agilent Technologies, United States) with a MiraMist CE nebulizer (Burgener Research, United Kingdom) leading into a Scott-type spray chamber (AHS Analysentechnik, Germany). The fused silica capillary (id. = 50 μm, Polymicro Technologies, LLC, United States) had length l of 50 cm. The applied voltage U was 10 kV. To each sample 2-bromopropane (Merck, Germany) was added as EOF marker. Measurements and data evaluation were performed as described by Willberger et al. (2019). The electrophoretic mobility µe was calculated according to Eq. 5 using the retention times of 232Th (tTh) and 79Br of the EOF marker (tEOF), respectively:
A C-S-H phase was prepared as described in Supplementary Table S1 (Supplementary Material) in a 50 mL centrifuge tube (polypropylene, Greiner bio-one, Austria) and equilibrated using an end-over-end rotator (Stuart Rotator SB3, United Kingdom). The final pH value was 10.9. For phase separation, the suspension was centrifuged at 6,800 × g for 30 min (mod. Avanti J-20 XP, Beckman Coulter, United States), and the solid phase isolated. The powder was left to dry to constant weight under N2 atmosphere at RT and stored inside the glove box. This U(VI)-free C-S-H phase was used together with the respective supernatant solution for U(VI) retention experiments in absence and presence of GLU. Using stock solutions of Unat (1 × 10⁻³ M UO2Cl2 in 5 × 10⁻³ M HCl) and GLU (1 M, sodium gluconate (Sigma-Aldrich, United States)), samples for solid-state NMR ([U(VI)] = 5 × 10⁻⁶ M, [GLU] = 1 × 10⁻² M, S/L = 10 g/L) and TRLFS ([U(VI)] = 5 × 10⁻⁷ M, [GLU] = 1 × 10⁻² M, S/L = 1 g/L) measurements were prepared. For this, the order of reactant additions was varied (cf. Table 1).
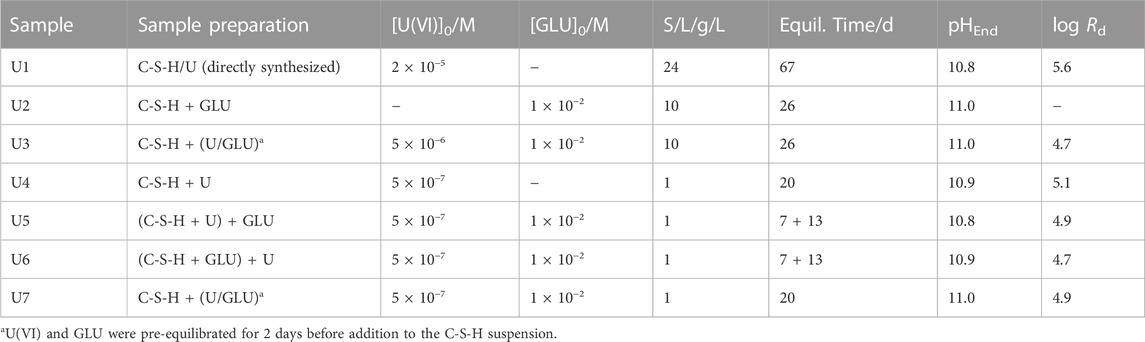
TABLE 1. Characterization of U(VI)- and/or GLU-containing C-S-H samples with C/S = 0.8 and distribution coefficients (Rd in L/kg) determined for U(VI) uptake.
A further C-S-H phase was prepared by using the same procedure as described above, however, immediately after mixing the reactants with deionized water, an aliquot of the U(VI) stock solution was added to the suspension. The initial U(VI) concentration was 2 × 10⁻⁵ M. During the equilibration time of 67 days, a U(VI)-doped C-S-H phase formed. The final pH value and U(VI) loading were 10.8 and 198 ppm, respectively. To study the influence of GLU on U(VI) leaching, aliquots of the GLU stock solution were added to the suspension of U(VI)-doped C-S-H (S/L = 10 g/L) to obtain 1 × 10⁻³ M or 1 × 10⁻² M GLU. The samples were equilibrated for 160 days.
After equilibrating the retention and leaching samples by shaking end-over-end, solid and liquid phases were separated by centrifugation, and aliquots were taken from the supernatant solutions for U(VI) concentration determination by ICP-MS (NexION 350X/Elan 9,000, PerkinElmer, United States) and for GLU quantification by solution NMR spectroscopy (cf. Section 2.5). Uranyl uptake by C-S-H is given in terms of a distribution ratio (Rd) according to Eq. 4.
For TRLFS measurements of U(VI)-containing C-S-H prepared in absence or presence of GLU, the samples were transferred as wet pastes into copper sample holders with sealable quartz glass lids and measured with a tunable diode pumped solid state (DPSS) laser (Ekspla, NT230, Lithuania) at 10 K. The emitted luminescence light was directed into a spectrograph (Shamrock 303i Andor Oxford Instruments, United Kingdom) equipped with a polychromator with 300, 600 and 1,200 lines/mm gratings, and the emission was monitored with an intensified CCD camera (Andor iStar, Oxford Instruments) 10 μs after the exciting laser pulse in a time window of 10 ms. The U(VI) associated with the C-S-H phase was excited at selected wavelengths (330–335 nm, 342 nm, 357 nm). Spectra were collected at varying delay times (up to 1,200 µs) between the laser pulse and camera gating to obtain luminescence decay kinetics and to extract pure component spectra of individual U(VI) species in the samples. More specifically, the decomposition of the spectra using the measured U(VI) emission data recorded at varying delay times was done with the Origin 2019b software (OriginLab Corporation, United States). The emission spectra recorded after long delay times were taken as pure components for U(VI) species with long luminescence lifetimes. The pure component spectrum was thereafter subtracted from the recorded emission data at shorter delays, yielding pure components of the U(VI) species with shorter luminescence lifetimes. Luminescence decay kinetics were obtained by integrating the collected emission spectra using MATLAB (R2019b) (Natick, Massachusetts: The MathWorks Inc., United States). Biexponential decay functions were thereafter fitted to the decay curves to obtain luminescence lifetimes of the present species in the samples.
29Si and 13C cross-polarization (CP) and 29Si single-pulse (SP) MAS NMR spectra were recorded on a Bruker AvanceTM 400 MHz WB spectrometer operating at a field strength of 9.4 T, with corresponding 13C, 29Si and 1H resonance frequencies of 100.7, 79.5 and 400.3 MHz, respectively, equipped with a CP/MAS DVT probe. Samples were packed in 7 mm zirconia rotors and spun at 5 kHz rotational frequency. 29Si CP spectra were acquired with 5 ms contact time, using a 80% ramp, by accumulating 2048 spectra recorded for 25 ms applying a relaxation delay of 3 s. 13C CP spectra were acquired with 1 ms contact time, using a 70% ramp, accumulating 16 k spectra recorded for 25 ms applying a relaxation delay of 3 s. 200 29Si SP spectra were accumulated by respectively applying 5.6 µs (30°) excitation pulse, 25 ms acquisition time, and a relaxation delay of 360 s allowing for quantitative measurements. Chemical shifts are reported in ppm relative to external tetramethylsilane (TMS).
X-ray diffractograms of a U(VI)-free and a U(VI)-containing C-S-H sample with C/S of 0.8 were collected with a MiniFlex 600 diffractometer (Rigaku, Japan) equipped with a Cu Kα X-ray source (40 keV/15 mA operation for X-ray generation) and the D/teX Ultra 1D silicon strip detector in the Bragg-Brentano θ–2θ geometry at a scanning speed of 2° per minute. The samples were mounted on a low-Si-background sample holder.
For the quantification of remaining GLU in supernatant solutions after retention experiments in the Eu(III) and U(VI) systems, 1 mL of the supernatant was lyophilized, re-dissolved in 750 µL D2O solution containing 1.492 mM of internal standard TMSP-d4 (sodium 3-(trimethylsilyl)-2,2,3,3-tetradeuteropropionate) and 1H NMR spectra were recorded. In order to achieve quantitative acquisition conditions, an excitation pulse of 2.67 µs (30°) and a relaxation delay of 60 s were used upon accumulation of 16–256 spectra, depending on [GLU], with an acquisition time of 3 s, recorded on an Agilent DD2-600 system operating at 14.1 T with a corresponding 1H resonance frequency of 599.82 MHz using a 5 mm oneNMR™ probe. The GLU concentration was determined according to Eq. 6:
where c, I, and N denote concentrations, 1H NMR signal integrals, and number of 1H nuclei contributing to the integrated signal(s), respectively, with NTMSP = 9 (integrated region ± 90 Hz of TMSP signal center), cTMSP = 1.492 mM, and accounting for strengthening upon re-dissolution in only 75% of the initial volume.
Initially, the binary GLU/C-S-H system was investigated in two types of batch sorption experiments. In the first experiment, shown in Figure 1A, the sorption isotherm of GLU on C-S-H phases was determined by varying the concentration over eight orders of magnitude ([GLU]0 = 1 × 10⁻⁹–1 × 10⁻¹ M; S/L = 5 g/L). A linear fit with a slope of one was used to determine the log Rd value of 0.31 ± 0.11 (Rd = 2.02 ± 1.3 L/kg), which is slightly lower compared to the value (Rd = 4.5 L/kg) from the study of Androniuk et al. (2017). In the second experiment, shown in Figure 1B, the S/L ratio was varied between 0.5 and 50 g/L at a constant GLU concentration of 1 × 10⁻² M. The Rd value calculated from the fit shown in Figure 1A was used to calculate [GLU]eq for different S/L ratios. As can be seen from Figure 1B, the measured and calculated equilibrium concentrations of GLU are consistent. Both the experimental and the calculated data show a slight decrease in concentration to a value [GLU]eq = 9 × 10⁻³ M at a S/L ratio of 50 g/L. The determined GLU concentration after 72 h of contact is consistent with the calculated concentration. The results of the two batch sorption experiments confirm the very low sorption of GLU on the C-S-H phase at the C/S ratio of 0.8 and no blocking of sorption sites by GLU on C-S-H can be assumed.
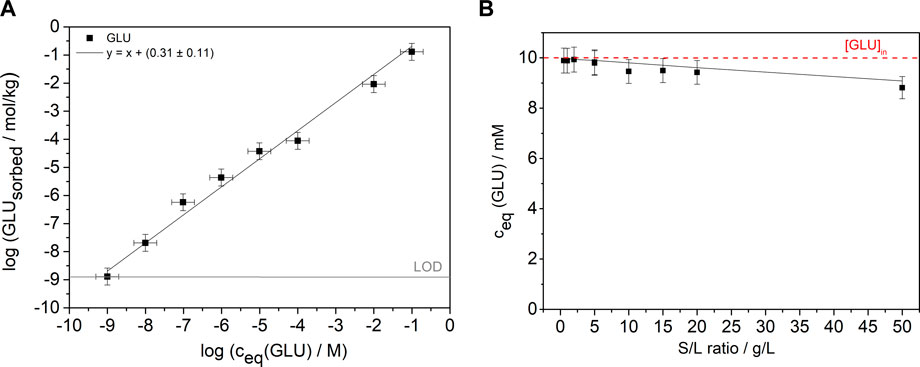
FIGURE 1. (A) Sorption isotherm with constant S/L ratio of 5 g/L and initial GLU concentrations from 1 × 10⁻⁹ M to 1 × 10⁻¹ M (pH 9.8) after a contact time of 72 h. The gray line shows the LOD. The black line is a linear fit with a slope of one to the data. (B) Batch sorption experiments at varying S/L ratios and constant GLU concentration (S/L = 0.5–50 g/L, [GLU]0 = 1 × 10⁻² M, pH 9.8) and a contact time of 72 h. The black line represents the calculated concentrations using the Rd value from the fit in (A) and the red line marks the initial concentration of 1 × 10⁻² M of GLU.
Furthermore, XPS measurements of C-S-H samples were performed for an analysis of the C-S-H surfaces in presence and absence of GLU. Both spectra of the C-S-H samples showed identical signals of calcium, oxygen, and silicon, but no C 1 s signal. Since there is no C 1 s signal in the spectrum of the sample with GLU, it can be assumed that a sorption of GLU on the C-S-H phase is unlikely under the experimental conditions. Thus, the results for the solid phases confirm the liquid phase results of the experiments given above. In addition, the C/S ratio at the surface of the C-S-H powders is lower than the C/S ratio of 0.8 in the bulk, as seen in Supplementary Table S2 (Supplementary Material). Häußler et al. (2018) had also observed a lower Ca(II) content at the surface than the C/S ratio used in the C-S-H synthesis.
An initial Eu(III) reference experiment using TRLFS was performed in an attempt to approximate a plausible endpoint for the retention of Eu(III) in C-S-H phases. Therefore, Eu(III) was already added in the very beginning of the C-S-H formation assuming that it will enter the interlayer and the CaO layer faster. In these experiments, using the PARAFAC algorithm for the evaluation of the TRLFS data, two different Eu(III) species could be identified after a contact time of one, two, and 6 weeks, respectively. Both were located in the solid phase. The Eu(III) concentration in the liquid phase was below the limit of detection in all samples, thus indicating a high degree of retention. The two species, whose luminescence spectra are shown in comparison to the raw data in Supplementary Figure S1 (Supplementary Material), had luminescence decay times of (520 ± 40) µs and (2,100 ± 200) µs, respectively. According to Eq. 3, the shorter decay time corresponds to a sorption complex with approximately one or two water molecules in the coordination sphere of Eu(III), which may indicate sorption of Eu(III) into the interlayer of the C-S-H structure. The decay time of the second species relates to an environment without water molecules in the first coordination sphere of Eu(III), which implies substitution for Ca(II) positions in the CaO layer of the C-S-H phases. Similar results have been reported in the literature (Pointeau et al., 2001; Tits et al., 2003; Mandaliev et al., 2011). However, a third species, possibly corresponding to a surface complex was observed by Pointeau et al. (2001) and Mandaliev et al. (2011), which occurred only when Eu(III) was added after the C-S-H formation or at higher Eu(III) loadings than in the present experiments, respectively.
The PARAFAC analysis suggests that after a contact time of 6 weeks approximately (90 ± 3) % of the Eu(III) ions were sorbed into the interlayers of the C-S-H phases, while (10 ± 3) % were incorporated into the CaO layers in all samples. The addition of GLU (5 × 10⁻⁶ M–5 × 10⁻³ M) after a contact time of 14 days had no effect on the Eu(III) speciation, implying that GLU did not cause the desorption of Eu(III), even at the highest GLU concentration of 1 × 10⁻² M.
In the reference experiments with aqueous phases previously equilibrated with C-S-H phases (referred to as pore water samples), a white precipitate was formed upon the addition of Eu(III) (5 × 10⁻⁵ M) in the absence and presence of GLU. Consequently, the Eu(III) concentration in the solution dropped below the limit of detection of the used TRLFS setup of approximately 5 × 10⁻⁸ M. Similar findings have also been reported by Schlegel et al. (2004), who observed the formation of a C-S-H-like precipitate upon the addition of Eu(III) (3.5 × 10⁻⁵ M) to pore water equilibrated previously with C-S-H phases with a C/S ratio of 1.3.
In the pore water precipitate, a total of four Eu(III) species were identified at different GLU concentrations. Their emission spectra and luminescence decay times obtained using PARAFAC are shown in Figure 2A. The shortest observed decay time of (64 ± 5) µs cannot be explained solely by quenching due to O-H oscillators in the coordination sphere, suggesting that this Eu(III) species may (additionally) have neighboring Eu(III) ions adding self-quenching through a Eu(III)-Eu(III) energy transfer (cross-relaxation) to the overall radiationless deactivation (Buijs et al., 1987). This would be in accordance with the findings by Schlegel et al. (2004), who observed a high Eu(III) content in their precipitate with a bulk composition of Si0.99Ca1.87Eu4.77O11∙48H2O and confirmed the presence of neighboring Eu(III) shells using Eu L3-edge EXAFS. The luminescence decay time of the second species ((240 ± 20) µs) may correspond to three or four water molecules in the coordination environment of Eu(III) or likewise to the presence of other Eu(III) ions. The other observed species with luminescence decay times of (800 ± 100) µs and (1,300 ± 100) µs are likely not surrounded by any neighboring Eu(III) ions or water molecules in the first coordination sphere.
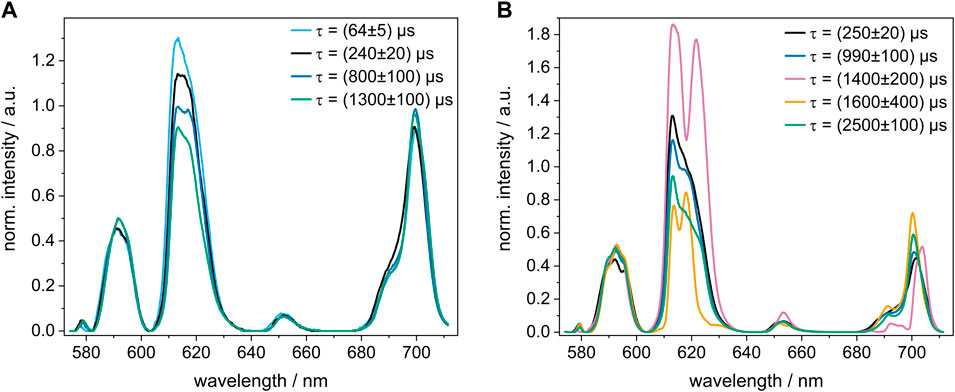
FIGURE 2. Normalized luminescence spectrum of each Eu(III) species with its respective decay time τ calculated with PARAFAC. (A) pore water samples and (B) C-S-H retention samples, in which Eu(III) and GLU were added 14 days after the preparation of the C-S-H phases. The Eu(III) concentration was 5 × 10⁻⁵ M in all samples and the GLU concentration was varied between 5 × 10⁻⁶ M and 5 × 10⁻³ M. Note that both sample sets were measured with different detection systems, as described in the experimental section.
The molar fractions of each Eu(III) species at varying GLU concentrations are shown in Figure 3A. It is notable that in the absence of GLU and at low GLU concentrations mainly the species with the shortest luminescence decay time ((64 ± 5) µs) was formed. However, at GLU concentrations above 1 × 10⁻⁴ M, additional species with higher decay times were present, which will be discussed in more detail in the following section. Nonetheless, the Eu(III) signal in the liquid phase remained below the limit of detection at all GLU concentrations, thus indicating that Eu(III) was effectively immobilized in the solid phase even in the presence of up to 1 × 10⁻² M GLU.
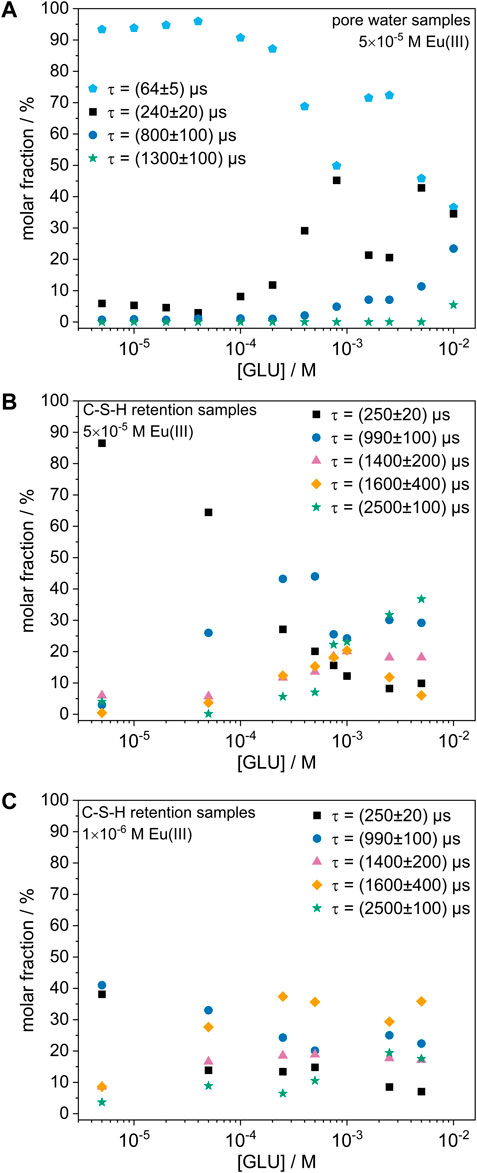
FIGURE 3. Molar fraction of each Eu(III) species as a function of the GLU concentration. (A) 5 × 10⁻⁵ M Eu(III) in C-S-H pore water, (B) 5 × 10⁻⁵ M Eu(III) in C-S-H retention samples, (C) 1 × 10⁻⁶ M Eu(III) in C-S-H retention samples.
In further reference experiments in which NaCl solution (1 × 10⁻² M) was used instead of C-S-H pore water, the precipitation of Eu(III) hydroxide (at low GLU concentrations) and the formation of soluble Eu(III)-GLU complexes (at [GLU] ≥ 2 × 10⁻⁴ M) were observed. The luminescence spectra and decay times of these species are different from the Eu(III) species in the pore water samples, thus corroborating the hypothesis that a coprecipitation of Eu(III) with the pore water constituents (i.e., Ca(II) and Si(IV)) occurred in the pore water experiments, where the Ca(II) and Si(IV) concentrations are expected to be 1.0 × 10⁻³ M and 1.3 × 10⁻³ M at C/S 0.8, respectively (Lothenbach and Nonat, 2015).
In the C-S-H retention experiments, Eu(III) and GLU were added to prepared C-S-H phases (time for formation: 14 days). The TRLFS measurements were carried out on the solid as well as on the supernatant solution. Over a contact time of 1–211 days, a total of five different Eu(III) species could be identified in the presence of GLU in the solid phases, while similarly to the reference experiments (cf. Section 3.2.1; Section 3.2.2) no Eu(III) signal was detectable in the liquid phase. Hence, high log Rd values above 4.5 were obtained, even at the highest GLU concentration of 1 × 10⁻² M. Luminescence spectra of the solid phases at different GLU concentrations are shown in Supplementary Figure S2 (Supplementary Material). Interestingly, the two species found in the reference experiments, in which Eu(III) was present during the C-S-H formation, were not found when Eu(III) was added later, therefore suggesting that the Eu(III) in these C-S-H retention samples might have been immobilized through a different mechanism than the sorption into the interlayers and incorporation into the C-S-H structure. In fact, three of the observed species have similar luminescence spectra and decay times as the species observed in the pore water samples (cf. Figures 2A, B), thus implying that Eu(III) added to the C-S-H phases after their formation appeared to be immobilized mainly by coprecipitation with the C-S-H pore water constituents rather than via sorption or incorporation into the C-S-H phases.
However, in the presence of C-S-H phases, a lower Eu(III) content and thus fewer neighboring Eu(III) ions may be expected for the formation of a precipitate compared to the pore water samples, as the C-S-H phase might act as a reservoir for the possible dissolution of additional Ca(II) and Si(IV) (as well as a potential competing phase for the sorption of Eu(III)). This idea is supported by the observation that the species with the lowest luminescence decay time and therefore lowest number in neighboring Eu(III) ions only occurred in the precipitate found in the pore water samples, but not in the precipitate formed when C-S-H phases were present. Moreover, the pore water samples generally showed a higher molar fraction of Eu(III) species that might experience cross relaxation due to neighboring Eu(III) ions than the C-S-H retention samples, as can be seen in Figures 3A, B. Furthermore, two additional Eu(III) species were observed in the C-S-H retention samples with GLU that neither appeared in the reference experiments in the C-S-H pore water nor when Eu(III) was present during the C-S-H phase formation. They might correspond to a different chemical composition of the precipitate due to the presence of GLU (and greater amounts of Ca(II) and Si(IV) compared to the pore water samples), however this cannot be verified based on the present information yet.
Supplementary Figure S3 (Supplementary Material) shows the obtained speciation for the C-S-H retention samples with 5 × 10⁻⁵ M Eu(III) and different GLU concentrations in dependence of the contact time. It can be seen that the changes with contact time were small and the equilibrium appeared to be reached after <14 days in all samples. However, large differences in speciation were obtained with increasing GLU concentration, indicating that, although GLU did not measurably increase the Eu(III) concentration in solution, it appeared to strongly influence the Eu(III) speciation in the solid phase. While in the absence of GLU mainly the species with a short luminescence decay time of (250 ± 20) µs was present, GLU appeared to promote the formation of species with higher luminescence decay times and thus likely smaller numbers in neighboring Eu(III) ions and/or O-H-oscillators in the coordination sphere of Eu(III). This trend was observed both in the pore water samples and the C-S-H retention samples, as shown in Figures 3A, B. In analogous experiments with nitrilotriacetic acid (NTA) instead of GLU (not shown here), a similar behavior and identical species were found, ruling out that those species could be attributed to “simple” Eu(III)-GLU complexes. Instead, GLU might alter the composition of the precipitate via complexation of Ca(II) ions, which might lead to a lower Ca(II) content in the precipitate and thus to changes in the Eu(III) coordination environment. This hypothesis is supported by the findings by Bouzouaid et al. (2022), who investigated the influence of GLU on the Ca(II) and Si(IV) concentration in C-S-H pore waters at different C/S ratios. Through wet chemistry experiments and theoretical modelling, they proposed that in the presence of 2 × 10⁻¹ M GLU, free H3SiO4− and CaGLU+ dominate the pore water speciation at a C/S ratio of 0.8, thus indicating that under these conditions the majority of dissolved Ca(II) ions is complexed by GLU (Bouzouaid et al., 2021; Bouzouaid et al., 2022). However, it must be noted that the GLU concentration in this calculation is 20 times larger than the highest concentration used here. Additionally, some of the species, whose formation seems to be promoted by GLU, also appeared in samples without GLU to a small extent. Thus, further analysis of the Ca(II) and Si(IV) concentration in the liquid phase and of the composition of the precipitate is necessary to fully understand the influence of GLU on the Eu(III) speciation.
To investigate whether these results are also representative for lower Eu(III) concentrations, similar C-S-H retention experiments were performed with a Eu(III) concentration of 1 × 10⁻⁶ M. The Eu(III) speciation for these samples at different GLU concentrations is shown in Figure 3C. Similarly to the experiments at higher Eu(III) concentration, no Eu(III) signal was measurable in the liquid phase at all GLU concentrations. Furthermore, the observed species were the same as at higher Eu(III) concentration, indicating that Eu(III) was immobilized by the same coprecipitation processes. However, a smaller molar fraction of species with short decay times was observed at lower Eu(III) concentration, which may support the cross-relaxation hypothesis, as a lower Eu(III) content in the precipitate and therefore less cross-relaxation is expected at lower Eu(III) concentration.
Analyses were complemented by GLU concentration determination in the supernatants after the full retention period (211 days) by quantitative 1H NMR spectroscopy (spectra not shown). A summary of the calculated figures is given in Supplementary Table S3 (Supplementary Material), revealing GLU quantities sorbed to the C-S-H phase comparable to those determined in the U(VI)/GLU/C-S-H experiments (cf. Section 3.4).
The influence of GLU ([GLU]0 = 1 × 10⁻² M) on the retention of Am(III), Th(IV), and Pu(IV) ([An(X)]0 = 1 × 10⁻⁸ M) by C-S-H phases (S/L = 5 g/L) was investigated as a function of addition order: i) (C-S-H + An(X)) + GLU, ii) (C-S-H + GLU) + An(X), and (iii) (C-S-H + An(X) + GLU). The calculated log Rd values are shown in Figure 4. For comparison, the log Rd values obtained in the binary An(X)/C-S-H systems without addition of GLU are added. The order of reactant addition, as well as the presence of GLU, had no influence on the retention of the An(X) by the C-S-H phase after a contact time of 72 h to 71 days. A quantitative uptake of An(X) on the C-S-H phase was observed. The log Rd values are in the range of 4.5–7 and are thus in the same order of magnitude as reported in the literature by Häußler et al. (2018) in the absence of GLU. In the binary system Th(IV)/C-S-H, the measured value log Rd = 3.8 was slightly lower.
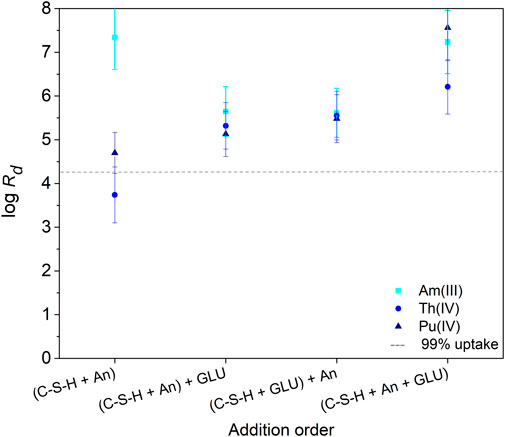
FIGURE 4. Distribution coefficients (Rd in L/kg) determined for Am(III), Th(IV) and Pu(IV) uptake at C-S-H in absence and presence of GLU ([An(X)]0 = 1 × 10⁻⁸ M, [GLU]0 = 1 × 10⁻² M, S/L = 5 g/L, pH 9.8) after a contact time of 72 h. The order of addition of An(X) and GLU to the C-S-H suspensions is indicated at the abscissa.
The near-neighbor environment of 5 × 10⁻⁶ M Pu interacting with C-S-H (C/S = 0.8) at pH 10.6 was probed by Pu L3-edge EXAFS spectroscopy. The experimental EXAFS data (Supplementary Figure S4; Supplementary Material) could be best modelled with four coordination shells, i.e., seven oxygen atoms at an average distance of 2.25 ± 0.02 Å, two silicon atoms at 3.15 ± 0.02 Å, five silicon atoms at 3.54 ± 0.02 Å, and six calcium atoms with an average Pu–Ca distance of 4.12 ± 0.02 Å. For experimental uncertainties of these values and Debye-Waller factors refer to Supplementary Table S4 (Supplementary Material). A Pu−Pu interaction could not be detected in the EXAFS signal, indicating the absence of Pu clusters at C-S-H. The measured average Pu−O distance is indicative of Pu(IV). The observed Si and Ca coordination numbers (Supplementary Table S4; Supplementary Material) agree favorable with the structural parameters obtained by DFT calculations (Chiorescu et al., 2022) for the incorporation of U(IV) in the CaO layer. For example, six U−Ca distances in the range of 3.7–4.2 Å have been obtained in the density functional calculation. As observed by EXAFS analysis, the tetravalent actinide incorporated in the CaO layer is surrounded by one Si atom at 3.2 Å and four Si atoms at a larger distance of 3.4–3.7 Å (Chiorescu et al., 2022).
The electrophoretic mobilities µe of the Th(IV) species measured by CE-ICP-MS are summarized in Supplementary Table S5 (Supplementary Material). In the solution where no Ca(II) and GLU were added, the electrophoretic mobility of Th(IV) was nearly zero (µe = (0.03 ± 0.03)×10–4 cm2/(Vs)). This indicates that the average effective charge of Th(IV) species in solution is zero. This is in good agreement with the expected predominant neutral Th(OH)4 complex at pH 10 (Rand et al., 2009). In presence of GLU, a negative mobility of −(2.72 ± 0.09)×10–4 cm2/(Vs) was measured for Th(IV). This change in mobility indicates that Th(IV) forms complexes with GLU leading to a negatively charged species, suggesting the formation of anionic complexes such as Th(OH)4(HGLU)− and Th(OH)4(HGLU)22− previously proposed by Colàs et al. (2013). For analog samples of Th(IV)-GLU with C-S-H pore water as electrolyte, a less negative mobility of −(2.02 ± 0.08)×10–4 cm2/(Vs) was measured. This slight decrease in the negative mobility compared to µe = −2.72 × 10⁻⁴ cm2/(Vs) could be attributed to the presence of Ca(II) ([Ca(II)] = 1.7 × 10⁻³ M) in the C-S-H pore water (Häußler et al., 2018), leading to the formation of quaternary complexes CaTh(OH)4(HGLU)+ (Colàs et al., 2013) and CaTh(OH)4(HGLU)2 (Gaona et al., 2008), respectively. To amplify the influence of Ca(II), its concentration in solution was increased ([Ca(II)] = 1 × 10⁻² M). The measured electrophoretic mobility was −(0.65 ± 0.04)×10–4 cm2/(Vs), indicating a less negative average charge of the Th(IV) species due to the influence of Ca(II) on the Th(IV)-OH-GLU system. The observed trend of the electrophoretic mobilities confirms that Ca(II) is associated to Th(IV)-OH-GLU complex species.
The characteristics of the different U(VI)- and/or GLU-containing C-S-H samples are listed in Table 1, highlighting the sequence of U(VI) and GLU additions to the C-S-H suspensions during the sorption experiments (samples U2–U7).
The X-ray diffractograms of the U(VI)-free C-S-H phase and of the directly synthesized U(VI)-containing C-S-H phase U1 (198 ppm U(VI)) are given in Supplementary Figure S5 (Supplementary Material). The diffractograms are characteristic for C-S-H phases, with U(VI) showing no effect on the C-S-H structure (long-range order).
The log Rd values determined for the U(VI) uptake in the absence of GLU amount to 5.6 and 5.1 for the directly synthesized sample U1 and the sorption sample U4, respectively. These values are well within the range of data reported in the literature (Pointeau et al., 2004; Tits et al., 2011). To study the influence of GLU on U(VI) retention by C-S-H, a leaching experiment was performed with the directly synthesized sample U1 by adding aliquots of the GLU stock solution to the suspension of U(VI)-doped C-S-H (S/L = 10 g/L) to adjust 1 × 10⁻³ M or 1 × 10⁻² M GLU. Less than 0.1% of the previously retained U(VI) is remobilized in the presence of GLU. Similar results were obtained by U(VI) sorption experiments. In the presence of 1 × 10⁻² M GLU, the log Rd only slightly decreases to 4.8 ± 0.1. Regarding the U(VI) uptake, no clear trend can be seen in the tests with different addition sequences of U(VI) and GLU. That means, the organic ligand GLU has only a very small influence on the U(VI) retention by C-S-H under these conditions. To identify U(VI) and GLU species on the solid phase and in the supernatant, the samples were studied by TRLFS and NMR, respectively.
29Si SP MAS NMR spectra in principle allow for discrimination and quantification of Si(OH)4 tetrahedra degree of condensation, denoted as Qn groups. In this notation, n refers to the number of O-Si bonds of a considered Si(IV) site, according to Si(OH)4−n(OSi)n with n = 1 through 4. Accordingly, the mean chain length (MCL) of the C-S-H dreierketten units can be determined. Upon increasing C/S the Q1:Q2 ratio also increases, according to a decreasing mean chain length. Varying C/S between 0.6 and 1.6 almost inverts the Q1:Q2 ratio from 0.09 to 7.33, associated with MCL of about 24 and 2.3, respectively (Roosz et al., 2018). Figure 5A shows 29Si SP MAS NMR spectra of the C-S-H phase with C/S = 0.8 (top) as well as of the same phase after the sorption experiments with 1 × 10⁻² M GLU (middle, U2) or 5 × 10⁻⁶ M U(VI) and 1 × 10⁻² M GLU, where U(VI) and GLU were pre-equilibrated before addition to the C-S-H suspension (bottom, U3). These spectra reveal two major results. First, the degree of silicate condensation is high. Based on the integral of the signals associated with Q1 and Q2 groups, respectively, their corresponding ratio is almost exactly 1:10. According to Richardson (2014), the MCL is about 20. Second, no notable spectral changes upon sorption of either GLU or U(VI)/GLU on the C-S-H phase can be detected. Hence, the short-range order of the C-S-H phase remains unaffected by U(VI) and/or GLU.
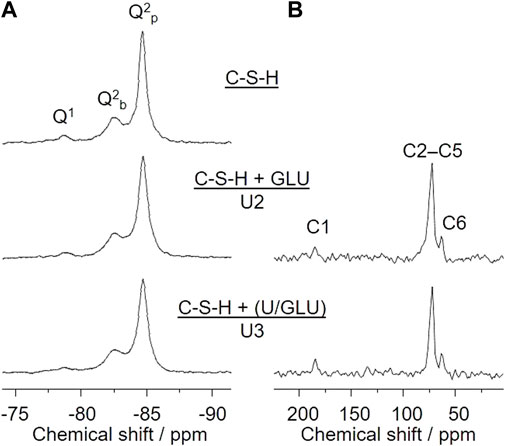
FIGURE 5. (A) 29Si SP MAS NMR and (B) 13C CP MAS NMR spectra of C-S-H as well as after sorption of GLU (U2) or sorption of U(VI)/GLU (U3) on C-S-H; ([U(VI)]0 = 5 × 10⁻⁶ M, [GLU]0 = 1 × 10⁻² M, S/L = 10 g/L).
In addition, 13C CP MAS NMR spectra of the GLU containing samples U2 and U3 (Figure 5B), i.e., C-S-H + GLU (top) and C-S-H + (U(VI)/GLU) (bottom), reveal the presence of GLU in the sorption samples. The quite low signal-to-noise ratio implies that only a fraction of the initial 1 × 10⁻² M GLU is associated with the C-S-H phase. This observation is in full agreement with the findings from both GLU sorption experiments (cf. Figure 1B) and GLU quantification in the remaining supernatants (Supplementary Figure S6; Supplementary Table S6; Supplementary Material), where the amount of sorbed GLU is determined to be about 10% or 14% of [GLU]0 in case of S/L = 1 g/L (U5–U7) or 10 g/L (U2, U3), respectively. The solid-state NMR signals of the CH(OH) carbons C2–C5 overlap as a broad signal centered at δC 72.3 ppm, whereas the signals of the carboxyl carbon C1 and of the CH2OH carbon C6 can be well resolved at δC 184.4 and 63.4 ppm, respectively. The carboxyl carbon’s observed chemical shift is remarkably downfield from that of both free GLU (δC 176.4 ppm) and the Ca(II)-GLU-complex (δC 179.6 ppm) determined in D2O solution (Tajmir-Riahi, 1990). We therefore conclude that GLU is exclusively associated with surface Ca(II), i.e., “cation bridging complexation” instead of, e.g., GLU being taken up into the C-S-H phase (interlayer) or being precipitated as a separate calcium gluconate phase. See also the discussion of GLU’s influence on relative concentrations of the different C-S-H-associated Eu(III) species, above.
The luminescence spectra of samples U1 and U4–U7 obtained at two different excitation wavelengths (335 and 342 nm) are shown in Supplementary Figure S7 (Supplementary Material). It is obvious that the luminescence spectra of these five U(VI)-loaded C-S-H samples are comparable to luminescence spectra measured for U(VI)-loaded C-S-H phases before (Philipp et al., 2022), and moreover, the spectra are very similar to each other and independent of the presence or absence of GLU. The luminescence spectra of samples U1 and U4 resemble one another at all collected excitation wavelengths. Samples U5 and U6 are comparable and have a slightly more intense shoulder at around 500 nm in comparison to U4. Sample U7 shows the strongest deviation from the samples U1 and U4. The overall intensity of the luminescence spectrum of sample U4 is much better than of the other sorption samples U5–U7, although an identical U(VI) concentration of 5 × 10⁻⁷ M was applied. Sample U7 has the poorest overall intensity. This points toward U(VI) luminescence quenching by GLU, since total U(VI) uptake is similar for all samples.
The luminescence decay kinetics obtained for the five U(VI)-loaded C-S-H samples (Figure 6A) can all be fitted biexponentially. The longer lifetime is very similar for all samples (U1, U4–U7) with an average value of τ2 = (387 ± 40) μs. The shorter lifetime is identical for samples U4 and U6 with τ1 = (143 ± 18) μs and slightly longer for samples U5 and U7 with τ1 = (176 ± 31) μs. These differences, however, are too small to clearly distinguish the components with shorter lifetimes.

FIGURE 6. (A) Luminescence decay kinetics obtained from U(VI)-loaded C-S-H phases U1 and U4–U7 at λex = 330 nm; (B) Emission spectra of extracted pure components from the decomposition of the measured U(VI) luminescence spectra obtained from U(VI)-loaded C-S-H phases.
Three pure components can be extracted from each measured spectrum. Two of them have almost identical lifetimes and are assigned to U(VI) sorption complexes on C-S-H surfaces. The third one has a clearly longer lifetime, and is assigned to U(VI) sorbed into the interlayer region of C-S-H. The spectra of the three extracted pure components are presented in Figure 6B as they were obtained. Similar U(VI) species were identified in previous studies of U(VI)-loaded C-S-H phases with varying C/S ratios (Tits et al., 2011; Tits et al., 2015; Wolter et al., 2019a).
The pure component spectra extracted from the measured data for sample U7 are slightly narrower than those from, e.g., sample U4, see Figure 7. This is indicative of a more ordered environment, either influenced by the crystallinity of the solid phase or a more rigid structure of the U(VI) sorption complexes. Otherwise, the spectra are identical. Thus, to allow for a comparison of the U(VI) speciation in the various samples, the same set of pure components (shown in Figure 6B) was used to deconvolute the measured luminescence spectra.
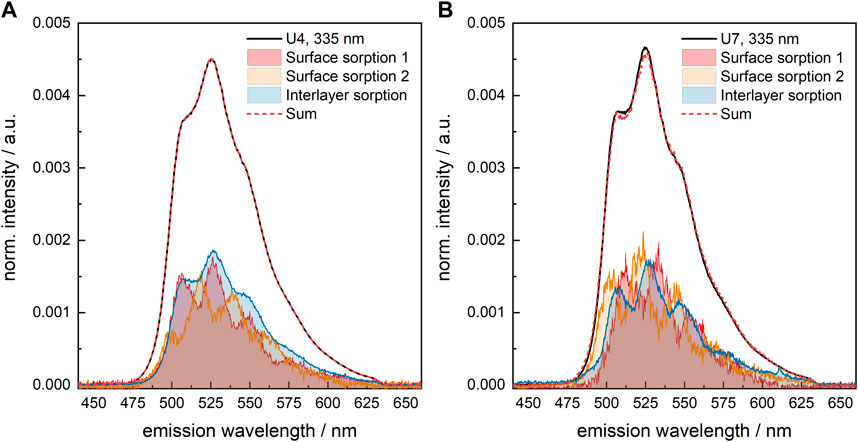
FIGURE 7. Results of spectral decomposition of the measured U(VI) luminescence spectra of U(VI)-loaded C-S-H phases (A) U4 (absence of GLU) and (B) U7 (presence of 1 × 10⁻² M GLU); λex = 335 nm.
The species distribution, determined for the various U(VI)-containing C-S-H samples by TRLFS, is summarized in Supplementary Table S7 (Supplementary Material). Despite the different U(VI) concentrations applied for preparation of these samples (2 × 10⁻⁵ M for U1 compared to 5 × 10⁻⁷ for U4–U7, corresponding to U(VI) loadings of about 198 and 119 ppm, respectively), precipitates are not detectable in any of these samples.
Moreover, despite the longer equilibration time for sample U1 (67 days compared to 20 days for samples U4–U7) and the different preparation procedure of U1, where U(VI) was already present at the beginning of C-S-H formation, the fraction of U(VI) sorbed into the interlayer is only slightly larger in the directly synthesized U(VI)-containing C-S-H sample than in the U(VI) sorption samples. This shows that both synthesis routes lead to the same U(VI) species in C-S-H. Generally, the results confirm that interlayer sorption contributes to a considerable extent to the U(VI) uptake by C-S-H as proposed by Harfouche et al. (2006) and Kremleva et al. (2020).
The effect of GLU on the fraction of the various species (surface sorption 1, surface sorption 2, sorption into the interlayer) in the differently prepared U(VI)-containing C-S-H samples is very small (Supplementary Table S7, Supplementary Material). Only when a pre-equilibrated U(VI)-GLU solution is added to the C-S-H phase, as is the case of U7, the fraction of U(VI) sorbed into the interlayer is somewhat lower, which benefits the surface sorption 1 species. Steric hindrance due to the organic ligand in the equatorial plane of UO22+ might be the cause for this.
The identity of the two different surface sorption species cannot be clarified by TRLFS. The aqueous speciation of U(VI) was calculated with the geochemical modelling software PHREEQC (Parkhurst and Appelo, 2013), based on thermodynamic data of the PSI/Nagra Chemical Thermodynamic Database 12/07 (Thoenen et al., 2014). The results for 5 × 10⁻⁷ M U(VI) (0.1 M NaCl, N2 atmosphere) showed that at pH ∼10.9, which is the equilibrium pH value of the C-S-H suspension in this study, the aqueous U(VI) speciation is dominated by UO2(OH)3− with increasing amounts of UO2(OH)42− only at increasing pH values (cf. Philipp et al. (2022)); Please note: Since ternary calcium uranyl hydroxo complexes are not yet part of current data bases (THEREDA, ThermoChimie, PSI/Nagra Chemical TDB, NEA-TDB, JAEA-TDB, JESS, Lawrence-Livermore-National-Lab (LLNL) TDB), the U(VI) speciation at hyperalkaline conditions cannot be calculated for Ca-containing background electrolytes.). For the retention of the negatively charged U(VI) and/or GLU species on the negatively charged C-S-H phase at hyperalkaline conditions, previous sorption experiments combined with spectroscopic studies as well as molecular dynamics (MD) simulations showed the effect of Ca(II) mediating between mineral surface and U(VI) as well as GLU species (Androniuk et al., 2017; Androniuk and Kalinichev, 2020; Philipp et al., 2022). For GLU sorption, this is corroborated by our 13C CP MAS NMR spectroscopic results. In addition, direct binding of U(VI) species to unoccupied deprotonated silanol groups is described in the literature by Harfouche et al. (2006) and Kremleva et al. (2020).
The influence of gluconate (GLU) on the retention of actinides in different oxidation states (An(X): Am(III), Th(IV), Pu(IV), U(VI), as well as Eu(III) as an analogue for Am(III) and Cm(III)) was examined in the context of a deep geological radioactive waste repository. A C-S-H phase with a C/S ratio of 0.8 was used, representing degraded cement in the alteration stage III. In addition, binary systems of GLU/C-S-H, An(X)/C-S-H, and An(X)/GLU were investigated.
Sorption of GLU on C-S-H was low and occurred only at the C-S-H surface, confirming previous results of the literature (Androniuk et al., 2017) and therefore, no blocking of sorption sites by GLU is expected at the cement degradation stage III. XRD and 29Si SP MAS NMR investigations showed that no alteration of the C-S-H short and long range orders, microcrystallinity, and degree of condensation occurs due to sorption of GLU, of An(X), or both. EXAFS measurements of a Pu(IV)/C-S-H sample showed that Pu(IV) can be immobilized by incorporation into the CaO layer. Accordingly, a high retention of all An(X) by the C-S-H phase was obtained with log Rd values between 4.5 < log Rd < 7, which remained unaffected by the presence of GLU and the order of addition of the reactants. Leaching experiments showed no remobilization of sorbed Eu(III) or U(VI) upon the addition of GLU, and no GLU complexes were found for the ternary Eu(III) or U(VI)/GLU/C-S-H systems. In case of Eu(III), a strong influence of GLU on the Eu(III) coordination environment in the precipitate was observed by TRLFS. It can be assumed that coprecipitation of Eu(III) with pore water constituents Ca(II) and Si(IV) occurred and that the effect of GLU on the Eu(III) speciation might be explained by the formation of Ca(II)-GLU complexes, leading to a change in the stoichiometry and structure of the formed coprecipitate. The influence of GLU on the proportion of the three U(VI) sorption complexes on C-S-H is small. The observed trend of the electrophoretic mobilities of Th(IV), determined with CE-ICP-MS measurements of the ternary system Th(IV)/GLU/C-S-H, indicates a complex formation of Th(IV)-GLU-OH. In the presence of Ca(II), formation of Ca-Th(IV)-GLU-OH is conceivable.
The small effect of GLU on the An(X) retention on C-S-H (C/S 0.8) observed in this study differs from the results reported in literature for higher pH values and Ca(II) concentrations (Norden, 1994; Dario et al., 2004; Tits et al., 2005; Tasi et al., 2021). This may indicate the importance of Ca(II) ions and the formation of heterobimetallic Ca(II)-An(X)-GLU complexes for the possible mobilization of An(X) by GLU. It emphasizes the necessity to investigate the effect of GLU further, also for other cement degradation stages, which are relevant to deep geological radioactive waste repositories.
The raw data supporting the conclusions of this article will be made available by the authors, without undue reservation.
All authors listed have made a substantial, direct, and intellectual contribution to the work and approved it for publication.
This work was partly funded by the European Union’s Horizon 2020 Research and Innovation Programme (CORI project, no. 847593), partly funded by the German Federal Ministry for Economic Affairs and Energy (BMWi) within the GRaZ II projects (nos. 02E11860A, 02E11860B, 02E11860F) and partly funded by the Deutsche Forschungsgemeinschaft (DFG, German Research Foundation, no. 491466077). SD and MUK are also thankful to the Christa-Paulus-Pinus-TH foundation for financial support.
The authors would like to thank Erica Brendler (TU Bergakademie Freiberg) for solid-state NMR measurements, Sabrina Beutner (HZDR), Samer Amayri (JGU Mainz) for ICP-MS measurements, and Jürgern Hübner (JGU Mainz) for XPS measurements. The EXAFS investigation was supported by Samer Amayri, Verena Häußler (JGU Mainz), and Damien Prieur (HZDR) and was performed at the BM20 Rossendorf Beamline (ROBL) at the European Synchrotron Radiation Facility (ESRF), Grenoble, France. Furthermore, Aerosil 300 was provided by Evonik Industries AG.
The authors declare that the research was conducted in the absence of any commercial or financial relationships that could be construed as a potential conflict of interest.
All claims expressed in this article are solely those of the authors and do not necessarily represent those of their affiliated organizations, or those of the publisher, the editors and the reviewers. Any product that may be evaluated in this article, or claim that may be made by its manufacturer, is not guaranteed or endorsed by the publisher.
The Supplementary Material for this article can be found online at: https://www.frontiersin.org/articles/10.3389/fnuen.2023.1124856/full#supplementary-material
Adam, N., Hinz, K., Gaona, X., Panak, P. J., and Altmaier, M. (2021). Impact of selected cement additives and model compounds on the solubility of Nd(III), Th(IV) and U(VI): Screening experiments in alkaline NaCl, MgCl2 and CaCl2 solutions at elevated ionic strength. Radiochim. Acta 109, 431–443. doi:10.1515/ract-2021-1010
Altmaier, M., Blin, V., García, D., Henocq, P., Missana, T., Ricard, D., et al. (2021). SOTA on cement-organic-radionuclide interactions. In final version as of 19.05.2021 of deliverable D3.1 of the HORIZON 2020 project EURAD. EC grant agreement no: 847593. Available at: https://www.ejp-eurad.eu/publications/eurad-deliverable-31-cori-sota-cement-organic-radionuclide-interactions-content-lilw.
Altmaier, M., Neck, V., Mueller, R., and Fanghaenel, T. (2005). “Solubility of U(VI) and formation of CaU2O7 ∙ 3H2O(cr) in alkaline CaCl2 solutions,” in MIGRATION 2005, 10 international conference on chemistry and migration behaviour of actinides and fission products in the geosphere (France), Washington, 20 - 25 September 2009 (MIGRATION).
Amayri, S., Fröhlich, D. R., Kaplan, U., Trautmann, N., and Reich, T. (2016). Distribution coefficients for the sorption of Th, U, Np, Pu, and Am on Opalinus Clay. Radiochim. Acta 104, 33–40. doi:10.1515/ract-2015-2409
Androniuk, I., and Kalinichev, A. G. (2020). Molecular dynamics simulation of the interaction of uranium (VI) with the C–S–H phase of cement in the presence of gluconate. Appl. Geochem. 113, 104496. doi:10.1016/J.APGEOCHEM.2019.104496
Androniuk, I., Landesman, C., Henocq, P., and Kalinichev, A. G. (2017). Adsorption of gluconate and uranyl on C-S-H phases: Combination of wet chemistry experiments and molecular dynamics simulations for the binary systems. Phys. Chem. Earth 99, 194–203. doi:10.1016/j.pce.2017.05.005
Atkins, M., and Glasser, F. P. (1992). Application of portland cement-based materials to radioactive waste immobilization. Waste Manag. 12, 105–131. doi:10.1016/0956-053X(92)90044-J
Atkins, M., Glasser, F. P., and Kindness, A. (1992). Cement hydrate phase: Solubility at 25°C. Cem. Concr. Res. 22, 241–246. doi:10.1016/0008-8846(92)90062-Z
Böszörményi, É., Lado, J., Dudás, C., Kutus, B., Szabados, M., Varga, G., et al. (2020). The structure and composition of solid complexes comprising of Nd(III), Ca(II) and D-gluconate isolated from solutions relevant to radioactive waste disposal. Pure Appl. Chem. 92, 1709–1715. doi:10.1515/pac-2019-1010
Bouzouaid, L., Lothenbach, B., Fernandez-Martinez, A., and Labbez, C. (2022). Gluconate and hexitols effects on C-S-H solubility. Cem. Concr. Res. 160, 106894. doi:10.1016/j.cemconres.2022.106894
Bouzouaid, L., Lothenbach, B., Fernandez-Martinez, A., and Labbez, C. (2021). Portlandite solubility and Ca2+ activity in presence of gluconate and hexitols. Cem. Concr. Res. 149, 106563. doi:10.1016/j.cemconres.2021.106563
Bro, R. (1997). Parafac: Tutorial & applications. Chemom. Intell. Lab. Syst. 38, 149–171. doi:10.1016/S0169-7439(97)00032-4
Buijs, M., Meyerink, A., and Blasse, G. (1987). Energy transfer between Eu3+ ions in a lattice with two different crystallographic sites: Y2O3:Eu3+, Gd2O3:Eu3+ and Eu2O3. J. Lumin. 37, 9–20. doi:10.1016/0022-2313(87)90177-3
Chiorescu, I., Kremleva, A., and Krüger, S. (2022). On the sorption mode of U(IV) at calcium silicate hydrate: A comparison of adsorption, absorption in the interlayer, and incorporation by means of density functional calculations. Minerals 12, 1541. doi:10.3390/min12121541
Colàs, E., Grivé, M., Rojo, I., and Duro, L. (2013). The effect of gluconate and EDTA on thorium solubility under simulated cement porewater conditions. J. Solut. Chem. 42, 1680–1690. doi:10.1007/s10953-013-0054-2
Dario, M., Molera, M., and Allard, B. (2004). Effect of organic ligands on the sorption of europium on TiO2 and cement at high pH. Stockholm: SKB. Technical Report TR-04-04. doi:10.1007/s10967-006-0455-4
Drobot, B., Steudtner, R., Raff, J., Geipel, G., Brendler, V., and Tsushima, S. (2015). Combining luminescence spectroscopy, parallel factor analysis and quantum chemistry to reveal metal speciation – A case study of uranyl(VI) hydrolysis. Chem. Sci. 6, 964–972. doi:10.1039/c4sc02022g
Gaona, X., Dähn, R., Tits, J., Scheinost, A. C., and Wieland, E. (2011). Uptake of Np(IV) by C–S–H phases and cement paste: An EXAFS study. Environ. Sci. Technol. 45, 8765–8771. doi:10.1021/es2012897
Gaona, X., Kulik, D. A., Macé, N., and Wieland, E. (2012). Aqueous–solid solution thermodynamic model of U(VI) uptake in C–S–H phases. Appl. Geochem. 27, 81–95. doi:10.1016/j.apgeochem.2011.09.005
Gaona, X., Montoya, V., Colàs, E., Grivé, M., and Duro, L. (2008). Review of the complexation of tetravalent actinides by ISA and gluconate under alkaline to hyperalkaline conditions. J. Contam. Hydrol. 102, 217–227. doi:10.1016/j.jconhyd.2008.09.017
Glaus, M. A., Laube, A., and Van Loon, L. R. (2006). Solid-liquid distribution of selected concrete admixtures in hardened cement pastes. Waste Manag. 26, 741–751. doi:10.1016/j.wasman.2006.01.019
Harfouche, M., Wieland, E., Dähn, R., Fujita, T., Tits, J., Kunz, D., et al. (2006). EXAFS study of U(VI) uptake by calcium silicate hydrates. J. Colloid Interface Sci. 303, 195–204. doi:10.1016/j.jcis.2006.07.019
Häußler, V., Amayri, S., Beck, A., Platte, T., Stern, T. A., Vitova, T., et al. (2018). Uptake of actinides by calcium silicate hydrate (C-S-H) phases. Appl. Geochem. 98, 426–434. doi:10.1016/j.apgeochem.2018.08.021
Keith Roach, M., and Shahkarami, P. (2021). Organic materials with the potential for complexation in SFR, the final repository for short-lived radioactive waste. Stockholm, Sweden: SKB. Report R-21-03.
Kremleva, A., Krüger, S., and Rösch, N. (2020). Uranyl(VI) sorption in calcium silicate hydrate phases. A quantum chemical study of tobermorite models. Appl. Geochem. 113, 104463. doi:10.1016/j.apgeochem.2019.104463
Kutus, B., Gaona, X., Pallagi, A., Pálinkó, I., Altmaier, M., and Sipos, P. (2020). Recent advances in the aqueous chemistry of the calcium(II)-gluconate system – equilibria, structure and composition of the complexes forming in neutral and in alkaline solutions. Coord. Chem. Rev. 417, 213337. doi:10.1016/j.ccr.2020.213337
Lothenbach, B., and Nonat, A. (2015). Calcium silicate hydrates: Solid and liquid phase composition. Cem. Concr. Res. 78, 57–70. doi:10.1016/j.cemconres.2015.03.019
Mandaliev, P. N., Stumpf, T., Tits, J., Dähn, R., Walther, C., and Wieland, E. (2011). Uptake of Eu(III) by 11 Å tobermorite and xonotlite: A TRLFS and EXAFS study. Geochim. Cosmochim. Acta 75, 2017–2029. doi:10.1016/j.gca.2010.10.028
Marmodée, B., Jahn, K., Ariese, F., Gooijer, C., and Kumke, M. U. (2010). Direct spectroscopic evidence of 8- and 9-fold coordinated europium(III) species in H2O and D2O. J. Phys. Chem. A 114, 13050–13054. doi:10.1021/jp1094036
Matz, W., Schell, N., Bernhard, G., Prokert, F., Reich, T., Claußner, J., et al. (1999). ROBL - a CRG beamline for radiochemistry and materials research at the ESRF. J. Synchrotron Radiat. 6, 1076–1085. doi:10.1107/S0909049599010663
Norden, M. (1994). The influence of cellulose and its degradation products on the adsorption of europium on cement (Sweden: University of Linköping). PhD thesis.
Ochs, M., Dolder, F., and Tachi, Y. (2022). Decrease of radionuclide sorption in hydrated cement systems by organic ligands: Comparative evaluation using experimental data and thermodynamic calculations for ISA/EDTA-actinide-cement systems. Appl. Geochem. 136, 105161. doi:10.1016/j.apgeochem.2021.105161
Papatzani, S., Paine, K., and Calabria-Holley, J. (2015). A comprehensive review of the models on the nanostructure of calcium silicate hydrates. Constr. Build. Mat. 74, 219–234. doi:10.1016/j.conbuildmat.2014.10.029
Parkhurst, L., and Appelo, C. (2013). Description of input and examples for PHREEQC version 3: A computer program for speciation, batch-reaction, one-dimensional transport, and inverse geochemical calculations Techniques and methods. Denver, USA. book 6, chap. A43. Available at: https://pubs.usgs.gov/tm/06/a43/.
Philipp, T., Huittinen, N., Shams Aldin Azzam, S., Stohr, R., Stietz, J., Reich, T., et al. (2022). Effect of Ca(II) on U(VI) and Np(VI) retention on Ca-bentonite and clay minerals at hyperalkaline conditions - new insights from batch sorption experiments and luminescence spectroscopy. Sci. Total Environ. 842, 156837. doi:10.1016/j.scitotenv.2022.156837
Pointeau, I., Landesman, C., Giffaut, E., and Reiller, P. (2004). Reproducibility of the uptake of U(VI) onto degraded cement pastes and calcium silicate hydrate phases. Radiochim. Acta 92, 645–650. doi:10.1524/ract.92.9.645.55008
Pointeau, I., Piriou, B., Fedoroff, M., Barthes, M. G., Marmier, N., and Fromage, F. (2001). Sorption mechanisms of Eu3+ on CSH phases of hydrated cements. J. Colloid Interface Sci. 236, 252–259. doi:10.1006/jcis.2000.7411
Rand, M., Fuger, J., Grenthe, I., Neck, V., and Rai, D. (2009). Chemical thermodynamics 11: Chemical thermodynamics of thorium. Amsterdam, The Netherlands: NEA North Holland Elsevier Science Publishers B. V.
Richardson, I. G. (2014). Model structures for C-(A)-S-H(I). Acta Crystallogr. Sect. B 70, 903–923. doi:10.1107/S2052520614021982
Rojo, H., Gaona, X., Rabung, T., Polly, R., García-Gutiérrez, M., Missana, T., et al. (2021). Complexation of Nd(III)/Cm(III) with gluconate in alkaline NaCl and CaCl2 solutions: Solubility, TRLFS and DFT studies. Appl. Geochem. 126, 104864. doi:10.1016/j.apgeochem.2020.104864
Roosz, C., Vieillard, P., Blanc, P., Gaboreau, S., Gailhanou, H., Braithwaite, D., et al. (2018). Thermodynamic properties of C-S-H, C-A-S-H and M-S-H phases: Results from direct measurements and predictive modelling. Appl. Geochem. 92, 140–156. doi:10.1016/j.apgeochem.2018.03.004
Scheinost, A. C., Claussner, J., Exner, J., Feig, M., Findeisen, S., Hennig, C., et al. (2021). ROBL-II at ESRF: A synchrotron toolbox for actinide research. J. Synchrotron Radiat. 28, 333–349. doi:10.1107/S1600577520014265
Schlegel, M. L., Pointeau, I., Coreau, N., and Reiller, P. E. (2004). Mechanism of europium retention by calcium silicate hydrates: An EXAFS study. Environ. Sci. Technol. 38, 4423–4431. doi:10.1021/es0498989
Stumpf, T., Tits, J., Walther, C., Wieland, E., and Fanghänel, T. (2004). Uptake of trivalent actinides (curium(III)) by hardened cement paste: A time-resolved laser fluorescence spectroscopy study. J. Colloid Interface Sci. 276, 118–124. doi:10.1016/j.jcis.2004.03.014
Tajmir-Riahi, H. A. (1990). Carbohydrate complexes with alkaline Earth metal ions. Interaction of D-glucono-1,5-lactone with the Mg(II), Ca(II), Sr(II), and Ba(II) cations in the crystalline solid and aqueous Solution. J. Inorg. Biochem. 39, 33–41. doi:10.1016/0162-0134(90)80013-N
Tasi, A., Gaona, X., Rabung, T., Fellhauer, D., Rothe, J., Dardenne, K., et al. (2021). Plutonium retention in the isosaccharinate – cement system. Appl. Geochem. 126, 104862. doi:10.1016/j.apgeochem.2020.104862
Thoenen, T., Hummel, W., Berner, U., and Curti, E. (2014). The PSI/nagra chemical thermodynamic Database 12/07. PSI report 14-04. Switzerland: Villigen.
Tits, J., Bradbury, M. H., Wieland, E., and Mantovani, M. (1998). The uptake of Cs, Sr, Ni, Eu and Th by CSH phases under high pH cement pore water conditions. Switzerland: Villigen. PSI Internal Report TM-44-98-01.
Tits, J., Geipel, G., Macé, N., Eilzer, M., and Wieland, E. (2011). Determination of uranium(VI) sorbed species in calcium silicate hydrate phases: A laser-induced luminescence spectroscopy and batch sorption study. J. Colloid Interface Sci. 359, 248–256. doi:10.1016/j.jcis.2011.03.046
Tits, J., Stumpf, T., Rabung, T., Wieland, E., and Fanghänel, T. (2003). Uptake of Cm(III) and Eu(III) by calcium silicate hydrates: A solution chemistry and time-resolved laser fluorescence spectroscopy study. Environ. Sci. Technol. 37, 3568–3573. doi:10.1021/es030020b
Tits, J., Walther, C., Stumpf, T., Macé, N., and Wieland, E. (2015). A luminescence line-narrowing spectroscopic study of the uranium(VI) interaction with cementitious materials and titanium dioxide. Dalt. Trans. 44, 966–976. doi:10.1039/C4DT02172J
Tits, J., and Wieland, E. (2018). Actinide sorption by cementitious materials, 18-02. Switzerland: Villigen. PSI Report.
Tits, J., Wieland, E., and Bradbury, M. H. (2005). The effect of isosaccharinic acid and gluconic acid on the retention of Eu(III), Am(III) and Th(IV) by calcite. Appl. Geochem. 20, 2082–2096. doi:10.1016/j.apgeochem.2005.07.004
Warwick, P., Evans, N., Hall, T., and Vines, S. (2004). Stability constants of uranium(IV)-α-isosaccharinic acid and gluconic acid complexes. Radiochim. Acta 92, 897–902. doi:10.1524/ract.92.12.897.55106
Wieland, E., Macé, N., Dähn, R., Kunz, D., and Tits, J. (2010). Macro- and micro-scale studies on U(VI) immobilization in hardened cement paste. J. Radioanal. Nucl. Chem. 286, 793–800. doi:10.1007/s10967-010-0742-y
Wieland, E. (2014). Sorption data base for the cementitious near field of L/ILW and ILW repositories for provisional safety analyses for SGT-E2. PSI technical report 14-08. Switzerland: Villigen.
Willberger, C., Amayri, S., Häußler, V., Scholze, R., and Reich, T. (2019). Investigation of the electrophoretic mobility of the actinides Th, U, Np, Pu, and Am in different oxidation states. Anal. Chem. 91, 11537–11543. doi:10.1021/acs.analchem.9b00997
Wolter, J.-M., Schmeide, K., Weiss, S., Bok, F., Brendler, V., and Stumpf, T. (2019a). Stability of U(VI) doped calcium silicate hydrate gel in repository-relevant brines studied by leaching experiments and spectroscopy. Chemosphere 218, 241–251. doi:10.1016/j.chemosphere.2018.11.074
Keywords: actinide, organic ligand, sorption, cementitious material, concrete, luminescence
Citation: Dettmann S, Huittinen NM, Jahn N, Kretzschmar J, Kumke MU, Kutyma T, Lohmann J, Reich T, Schmeide K, Shams Aldin Azzam S, Spittler L and Stietz J (2023) Influence of gluconate on the retention of Eu(III), Am(III), Th(IV), Pu(IV), and U(VI) by C-S-H (C/S = 0.8). Front. Nucl. Eng. 2:1124856. doi: 10.3389/fnuen.2023.1124856
Received: 15 December 2022; Accepted: 10 February 2023;
Published: 01 March 2023.
Edited by:
Pierre Henocq, Agence Nationale Pour la Gestion des Déchets Radioactifs, FranceReviewed by:
Mavrik Zavarin, Lawrence Livermore National Laboratory (DOE), United StatesCopyright © 2023 Dettmann, Huittinen, Jahn, Kretzschmar, Kumke, Kutyma, Lohmann, Reich, Schmeide, Shams Aldin Azzam, Spittler and Stietz. This is an open-access article distributed under the terms of the Creative Commons Attribution License (CC BY). The use, distribution or reproduction in other forums is permitted, provided the original author(s) and the copyright owner(s) are credited and that the original publication in this journal is cited, in accordance with accepted academic practice. No use, distribution or reproduction is permitted which does not comply with these terms.
*Correspondence: Michael U. Kumke, a3Vta2VAdW5pLXBvdHNkYW0uZGU=; Tobias Reich, dHJlaWNoQHVuaS1tYWluei5kZQ==; Katja Schmeide, ay5zY2htZWlkZUBoemRyLmRl
Disclaimer: All claims expressed in this article are solely those of the authors and do not necessarily represent those of their affiliated organizations, or those of the publisher, the editors and the reviewers. Any product that may be evaluated in this article or claim that may be made by its manufacturer is not guaranteed or endorsed by the publisher.
Research integrity at Frontiers
Learn more about the work of our research integrity team to safeguard the quality of each article we publish.