
94% of researchers rate our articles as excellent or good
Learn more about the work of our research integrity team to safeguard the quality of each article we publish.
Find out more
METHODS article
Front. Nucl. Eng., 09 January 2023
Sec. Nuclear Materials
Volume 1 - 2022 | https://doi.org/10.3389/fnuen.2022.1054288
This article is part of the Research TopicAdvancements in Nuclear and Irradiation ExperimentsView all 6 articles
 Peter Doyle1*
 Caleb Massey1Dylan Richardson1Ian Greenquist1Rachel Seibert1Grant Helmreich1
 Tash Ulrich1
 Ryan Gallagher1Kara Godsey1
 Randall Fielding2
 Andrew T. Nelson1
 Jason Harp1
Metallic U alloys have high U density and thermal conductivity and thus have been explored since the beginning of nuclear power research. Alloys of U with modest amounts of Mo, such as U-10 wt % Mo (U-10Mo), are of particular interest because the γ-U crystal structure in this alloying addition shows prolonged stability in reactor service. Historically, radiation data on U-10Mo fuels were collected in Na fast reactors or lower temperature research reactor conditions, but little is known about irradiation behavior, particularly swelling and creep, at irradiation temperatures between 250 and 500°C. This work discusses the methodology and pre-irradiation characterization results from a U-Mo irradiation campaign performed in the High Flux Isotope Reactor at Oak Ridge National Laboratory. U-10Mo and U-17Mo samples irradiations are being completed at temperatures ranging from 250 to 500°C to three targeted fission densities between 2 × 10²⁰ and 1.5 × 10²¹ fissions per cubic centimeter. Swelling measurement of the specimen sizes studied here required development and assessment of new methods for volume determination before and after irradiation. Laser profilometry and X-ray computation tomography (XCT) were used to provide preirradiation characterization of samples to determine the error and applicability of each to determine swelling following irradiation. These outcomes are contextualized through use of BISON simulations performed to assess the predicted expansion of U-Mo fuels subjected to the irradiation conditions of this work. Use of existing BISON fuel performance models predicted a maximum of 7% swelling under the irradiation conditions of this study. Pre-irradiation characterization revealed the as-cast U-Mo fuel samples were uniformly large-grained fully cubic U crystals with small U-C/N bearing precipitates and pores distributed throughout. Samples were found to contain a bulk porosity between .4 and 3% because of the casting process. Local porosity in areas far from large, interconnected pores was found by Slice-and-View to be under .2%. Nanometer-sized precipitates rich in C and N were identified in all samples, likely because of impurities during the fabrication process. Dendritic bands were also observed throughout the samples. These bands were characterized by variable Mo content that deviated from the overall Mo content by 2–3 wt %. No other microstructural features were correlated to these bands. Mechanical properties were found to be slightly strengthened compared to literature reports of bulk U-Mo fuels due to the nano-scale precipitates throughout the sample.
Stabilized cubic γ-U alloys have been of interest as nuclear fuels since the early days of nuclear energy, and several different elements can be used as γ-stabilizers (Mueller et al., 1962; Bleiberg et al., 2019; Hofman et al., 1998). Although some gamma phase stability can be achieved with low concentrations of Mo, 10 wt % Mo additions notably improve stability of the meta-stable γ-U phase that may remain stable under irradiation due to the stabilizing effect of ballistic mixing (Dwight, 1960; Rest et al., 2006; MEYER et al., 2014; Newell et al., 2020; Lu et al., 2021). Irradiation testing has been performed on U-10Mo and U-7Mo alloys for research reactor applications under 250°C (Waldron et al., 1958; Dwight, 1960; May 1962; Leenaers et al., 2004; Rest et al., 2006; Creasy, 2012; Smirnova et al., 2015; Newell et al., 2017; Kautz et al., 2021; Gates et al., 2019) and for higher temperature fast reactors (Walters et al., 1984; Kittel et al., 1993; Harp et al., 2018) above 500°C. Irradiation testing in the low and high temperature regimes showed initial linear swelling followed by breakaway fission gas-induced swelling, coincident with grain recrystallization above a fission density of 2–7 × 1021 cm−3. Breakaway swelling has been observed to result in several 10 s of percent increases in volume (Rest et al., 2006; MEYER et al., 2014). However, data relating to swelling and microstructure due to irradiation in midrange temperatures (250–500°C) are lacking.
Recently, Oak Ridge National Laboratory (ORNL) developed a MiniFuel irradiation capsule to facilitate rapid irradiation testing at approximately isothermal and nearly constant fission rate conditions in any given the fuel specimen under irradiation (Petrie et al., 2022). This affords significant benefits by enabling separate effects testing in nuclear fuels and has the ability to improve understanding the isothermal radiation effects of materials in which radiation effects knowledge is limited and enables faster design iteration. Simulation tools, such as BISON, maximize the value of separate effects tests by allowing iterative model improvements and pre-test predictions of behavior. Similar tools to MiniFuel, such as FAST, BUSTER, and SETH, have been developed at Idaho National Laboratory over the last few years (Bess et al., 2019; Beausoleil et al., 2020; Terrani et al., 2020). In the present work, the MiniFuel irradiation capability was leveraged to study the effects of temperature on the swelling behavior of two U-Mo alloys with increasing burnup.
However, the small sample sizes in a MiniFuel irradiation campaign lead to their own challenges. In particular, swelling measurements are more difficult on small samples because the measurement uncertainty becomes large compared to the measurement itself. The actual amount of gas released from MiniFuel samples is also less than for large samples by virtue of their size, requiring high release sensitivity.
This paper presents the preirradiation characterization on U-10Mo and U-17Mo samples, including simulation of expected irradiation behavior. The accelerated fission rate MiniFuel irradiation platform produces non-traditional irradiation conditions, challenging irradiation design and development of post irradiation examination methods (PIE). Isothermal response of fuel samples as function of burnup provides new opportunities in separate effects testing and benchmarking fuel performance models, but successful interpretation requires knowledge of the limitations and uncertainties of new characterization methods or adaptation of conventional methods to new specimen geometries and smaller volumes. The primary objectives of the irradiation campaign were to (Mueller et al., 1962) determine the swelling rates and temperature dependence of swelling across the temperature range of 250–500°C and (Bleiberg, Eichenberg, Fillnow, Jones) evaluate changes in microstructure across the same range with particular attention to any γ-U degradation. The resulting data will be used to improve U-Mo irradiation models within the 250–500°C temperature range of interest in this work.
Two batches each of two different U-Mo sample concentrations, 10 and 17 wt % Mo, were fabricated at Idaho National Laboratory (INL). Samples were created by mixing depleted and highly enriched U and arc-melting Mo chips from a 99.95% pure, .25 mm-thick foil from Alfa Aesar. Typical U total feedstock metal impurity was under 500 wppm. Each sample was arc-melted three times to ensure uniformity and then cast into 5 mm diameter rods, which were lathe-machined to a 3 mm diameter. Melting was completed with a Cu-cooled hearth and split block for the rod formation. Each rod was then cut into .7–.9 mm disks vis electro-discharge machining. All U feedstocks were enriched with 1.22–1.24% 235U. The two U-10Mo batches, U -10Mo 2002 and U-10Mo 2003, contained 9.99 wt % total Mo. The two U-17Mo batches, U-17Mo 2004 and U-17Mo 2005, contained 16.8 wt % total Mo. Finally, samples were transported to ORNL for characterization and assembly of the irradiation test.
Three sets of U-Mo samples are being irradiated in the High Flux Isotope Reactor (HFIR) using the MiniFuel irradiation tool developed in (Petrie et al., 2019). Figure 1 shows a schematic of the HFIR core and MiniFuel Assembly. HFIR contains a variety of target loading positions that can be used to achieve a variety of goals, depending on required flux, specimen size, neutron energy, and so on. The MiniFuel system was designed for insertion into the Inner Small Vertical Experimental Facility (VXF) target position, which is indicated with an arrow and label at the top of the HFIR schematic in Figure 1 and has an approximate thermal neutron flux of about 5 × 1014 cm−2 s−1 (Petrie et al., 2019). In this work, three of the nine available target positions in the MiniFuel were loaded with three different target assemblies, each of which contained six U-Mo disks in separate capsules, as shown in Figure 1. Specific positions of each were chosen to achieve the desired irradiation conditions provided in Table 1. The intended doses were achieved by removing each target assembly after the appropriate number of HFIR cycles.
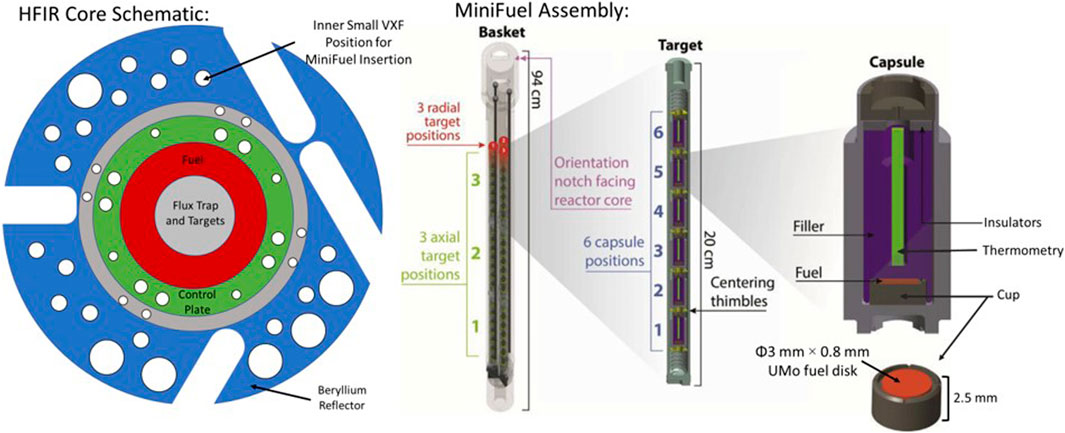
FIGURE 1. Schematic of HFIR core and MiniFuel assembly relevant to this U-Mo irradiation. The MiniFuel assembly was inserted in the Inner Small VXF target position, as indicated. Adapted with permission from Petrie et al. (Petrie et al., 2019).
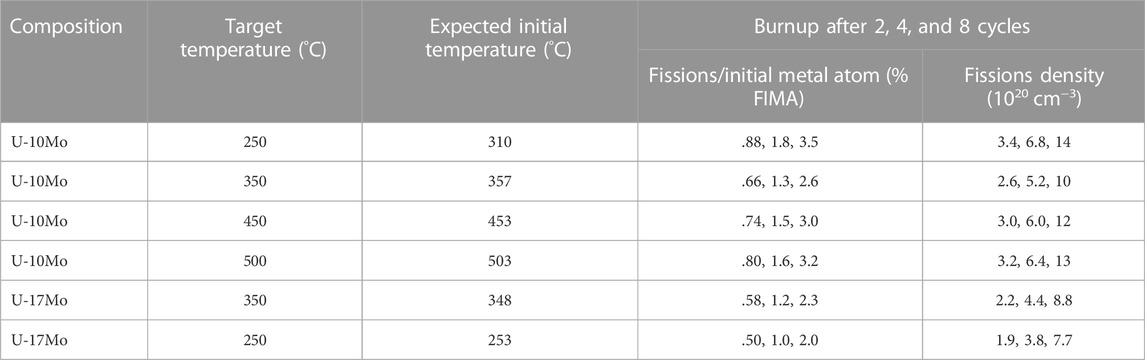
TABLE 1. HFIR MiniFuel irradiation conditions.
Each target contained six U-Mo capsules. Each capsule, per Figure 1, was loaded with the fuel disk specimen seated in a pure Mo disk holder, with approximately 400 µm of free space between the top of the holder and fuel disk (the exact amount depended on the exact height on each holder). Above this, a SiC rod was inserted for PIE thermometry. Following irradiation, the SiC rods will be evaluated by dilatometry in order to infer the irradiation temperatures (Field et al., 2019). The SiC thermometer was further surrounded by a Mo tube, which acted as a filler between the cup and the surrounding capsule housing and held the SiC rod in place. As the final step in capsule assembly, capsules were evacuated and refilled with ultra-high purity He to atmospheric pressure before the capsule was welded shut.
Three different burnups were selected at nominal fission densities of 3, 6, and 12 × 1020 cm−3. In HFIR, these burnups can be achieved after two, four, and eight HFIR cycles, after which the corresponding target assembly will be unloaded from the reactor. A total of 18 samples were irradiated. The choice of 235U enrichment near 1% enables near-uniform burnup and fuel temperature over time in the MiniFuel irradiation assembly within HFIR. This was achieved by the 235U driving fission early in the fuel life and gradually being replaced by 239Pu, which dominates fission after several cycles (Petrie et al., 2019). While enrichments under 1% 235U initially were found by Petrie et al. to burn slowly in the first few cycles of the irradiation, until sufficient 239Pu had built up to achieve an even burn rate, initial enrichment above 1% 235U was reported to result in initially rapid burnup until a lower steady state burn was achieved. In the present U-Mo irradiation, as-irradiated MNCP calculations from the low burnup samples (nominally .8% FIMA and fission density of 3 × 1020 cm−3) are shown in Supplementary Figure S1 and reveal about 5–10% variation in the average fission rate over the 52-day irradiation, consistent with the intent of uniform fission rate in the present irradiation work.
Target temperatures were established to cover the range of interest from 250–500°C. As shown in Table 1, most samples were expected to meet the target temperatures within a few degrees, based on MCNP simulations. The 250°C U-10Mo irradiation is expected to have an initial irradiation temperature 60°C higher than the target due to the amount of U loading, which elevated the initial fission heating at beginning of irradiation above the steady state fission heating. The 250°C U-17Mo samples have a lower loading due to higher Mo content, which enables them to approximately achieve the low 250°C temperature. However, the higher Mo content does reduce the burn up accumulation rate compared to the U-10Mo samples but also leads to the U-17Mo sample being predicted to have lower overall burn up than the corresponding U-10Mo samples.
Characterization tools leveraged for this work measure dimensions, obtain x-ray diffraction patterns, perform microscopy, collect nanomechanical data, and collect gas release data. The following is a list of the tools used in this work and planned for the additional outlined work.
• Mettler Toledo XP504 balance to measure mass
• Mitotuyi CD-6″ PMX Digital Caliper to measure initial sample diameter
• Starrett Digital Indicator F2720-0 to measure sample thickness
• Keyence VR-5000 Wide-Area 3D Measurement System for 3D sample profile
• Customized laser profiling tool to determine postirradiation sample size
• Customized gas collection apparatus
• Xradia MicroXCT-400 for x-ray computed tomography (XCT) measurements
• The BISON Simulation package from 7 May 2021 (Git commit e70e8dd770467202109454f8cb1458cf27b60308) to estimate swelling and fission gas release (FGR)
• Bruker D2-Phaser second Generation x-ray diffraction system
• NanoMechanics Inc. InSEM nanoindentation system with an Inforce 1,000 actuator
• TESCAN MIRA3 scanning electron microscope (SEM) with an Oxford Ultim Max energy dispersive spectrometer (EDS)
• Thermo Fisher Scios 2 DualBeam SEM/focused ion beam (FIB) for imaging, liftout creation, and Slice-and-View; electron backscatter diffraction (EBSD) was conducted using an EDAX Velocity system
• FEI Talos F200X S/TEM for transmission electron microscopy (TEM)
As-received samples were measured using calipers, the Keyence system, and the laser profilometry system and were then weighed. Crystal structure was determined using XRD. Samples were prepared for XRD by adding a 640 d-Si powder standard traceable to the National Institute of Standards and Technology to the top of each sample to enable sample height correction. Kapton tape was added to the sample surface to control contamination. Scans were collected from 20° to 120° 2θ with a step size of .002° 2θ and a dwell time of .2 s per step. The program GSAS-II was used to evaluate the spectra via standard Reitveld refinement (McCusker et al., 1999). Reference crystal structures were sourced from the Inorganic Crystal Structure Database numbers 653371 (γ-U) (Besson et al., 1965), 236070 (γ-U) (Chakraborty et al., 2015), 236071 (U2Mo) (Chakraborty et al., 2015), and 43419 (α-U) (Mueller et al., 1962).
Microstructure was evaluated with 20 keV imaging using backscatter electron (BSE) and secondary electron (SE) detectors, and EDS surface mapping was used to determine chemical composition. EBSD was performed to determine grain structure using a 30 keV beam. After collection, data were analyzed via the EDAX Orientation Imaging Microscopy software (version 8.1.0). Cleaning was accomplished by removing pixels with a <.1 confidence index followed by grain dilation. Per ASTM E2627 (ASTME, 2019), grain dilation was limited to <10% of indexed points.
FIB liftouts were taken by depositing a Pt cap on the target surface, cutting a FIB trench at 30 keV and 15 nA, followed by cleaning and undercutting at 3–7 nA. Liftouts were loaded on Cu grids and thinned at 30 keV from 1 to .3 nA with final thinning at 16 and 8 keV and cleaning at 5 and 2 keV. Subsequent TEM was performed with bright field (BF), dark field (DF), and high angle annular DF (HAADF) imaging, along with TEM-EDS on select areas.
Slice-and-View was performed using the ThermoScientific Auto Slice and View 4 (version 4.1.1.1582). A 2 μm Pt cap was deposited on the target area. A 30 × 20 µm trench was cut in front of the area, and a 7–10 µm trench was cut into one side of the sample. To avoid shadowing effects, a larger 50 × 30 µm trench was cut on the other side of the target area in the direction of the SE detector. The target area skirt was cleaned at 30 keV and 7–3 nA. Final cleaning was performed at .3 nA on the cut surface. Slices were conducted at 30 keV and .3 nA in a 25 nm section across the target area. After each slice, a high-contrast SE image was taken.
After slicing, the images were tilt-corrected and segmented using a customized MATLAB script similar to scripts used in another work (McKinney et al., 2020). One region of interest in the center of the sample was selected, and cropped data were filtered to reduce noise and improve contrast. First, each image was adjusted based on the local average brightness with the image stack. Second, a Wiener filter was applied for noise reduction followed by a Local Laplacian filter, which removed low-magnitude edges and image sharpening with unsharp masking. After filtering, defects were segmented based on user-selected values. All defects smaller than 27 pixels were eliminated, and the remaining defects were modified by morphological closing to minimize segmentation-induced errors, such as small gaps and holes. Finally, the identified defects were manually reviewed and classified as pores, precipitates, or misidentified regions, and full geometric details of the defects were exported to evaluate the local density of precipitates and pores.
Nanoindentation was performed via the InSEM indentation system by using a Berkovich diamond tip that had a 65.3° angle. Samples were mounted to a standard SEM stub using Ag paste (Ted Pella #16062) to secure the sample to the stub. The paste was applied to the sides of the sample to ensure metal-to-metal contact between the sample and stub. A SiO2 standard was indented 20 times at an indent depth of up to 1 µm to calibrate the tip area and frame stiffness using a maximum load of 500 mN and a strain rate of .2/s. U-Mo samples were also indented 20 times with the same parameters as the standard tests, choosing areas that were free from bulk porosity. Indentations were spaced at least 10 times the indentation depth apart to avoid the strain field of previous indents. Data were analyzed using the InView analysis software with a Poisson ratio of .33 (Waldron et al., 1958; Newell et al., 2017; Hu and Beeler, 2021).
Thermomechanical fuel performance simulations of the U-10Mo disks were performed using the fuel performance code BISON (Williamson et al., 2021). BISON is maintained at INL and is under development at a wide variety of US institutions (Williamson et al., 2021). BISON is most often used to model UO2 fuels in light-water reactors but includes capabilities to model a wide array of fuel forms and reactor types, including U-Zr-based fuels for sodium-cooled fast reactors (Greenquist et al., 2021a; Greenquist and Powers, 2021) and tristructural isotropic fuels (Schappel et al., 2020). BISON’s open architecture enables it to model a wide array of materials, conditions, and geometries, including MiniFuel disks (Cheniour et al., 2022).
BISON solves a series of differential equations that govern temperature and strain. These are coupled to a variety of nuclear fuel-specific models for physical behaviors and materials properties (Williamson et al., 2021). Accurate predictions rely on accurate material-specific models and parameters. In some cases, these materials-specific inputs are constants that can be easily inserted into existing models. In other cases, a new model must be implemented for each material. Several such U-10Mo-specific models were needed for this work, including equations for thermal conductivity and specific heat, models for thermal expansion, fission gas production and swelling, solid fission product swelling, FGR, and creep. The necessary equations for thermal conductivity and specific heat were already included in BISON, along with a creep model. Models for U-10Mo fission gas production, swelling, release, and solid fission product swelling were not included in BISON. These models needed to be added to BISON before the MiniFuel disks could be modeled.
The coefficient of thermal expansion for U-10Mo is a linear function of temperature based on a correlation by Rest et al. (Rest et al., 2006):
where is the coefficient of thermal expansion (K−1), and
This correlation is valid in the temperature range of 298–873 K.
Empirical correlations for solid and gaseous fission product swelling in monolithic fuel were also developed in Rest et al. (Rest et al., 2006). Solid fission product swelling follows the linear function
where
where
Constant mechanical values were inserted into existing BISON solid mechanics models, including the Young’s modulus (84 GPa) (Rest et al., 2006) and Poisson ratio (.35) (Ozaltun et al., 2011). Although the Young’s modulus used for BISON simulations is several gigapascals lower than measured for the actual preirradiated fuel (Section 4.1.3), the variation is not expected to change the results because of the mathematics relevant to the present simulations. No FGR model for U-10Mo was found in the literature or among existing BISON models. Therefore, a U-Zr model was used as an approximation (Greenquist et al., 2021a).
The disks were represented with an axisymmetric 2D-RZ mesh. This mesh was much more computationally efficient than a full 3D mesh and was not expected to affect accuracy because no azimuthal variations were expected. Additionally, no mechanical or chemical interactions were assumed to be with the sample holders or other materials. Per Figure 1 and Section 2.2, no mechanical interactions are expected between the fuel and any component of the capsule, except for the fuel holder, on which the fuel rests without pressure. If swelling exceeds ∼50% for any of the samples, some mechanical interactions are possible. However, swelling of that magnitude is not expected, per Section 4.4.2. The mesh had 40 radial elements and 20 axial elements. The number of elements was selected based on a mesh refinement study (Greenquist et al., 2021b).
The governing variables for the BISON simulation included temperature, axial displacement, and radial displacement. The boundary conditions included a zero-flux temperature condition at the axial line of symmetry and set temperatures at the outer surfaces of the disks. The axial displacements were set to 0 at the disk bottom, and the radial displacements were set to 0 at the axial line of symmetry. The initial conditions were a constant temperature of 295 K and had 0 displacements. The stress-free temperature,
The surface temperatures were determined from the expected average temperatures and fission rates as determined by MCNP, by running test simulations in the design space and developing a bilinear correlation between surface temperature, fission rate, and the average temperature. Coolant was not explicitly modeled, but surface temperatures were iteratively set until the MCNP-calculated average fuel temperatures were achieved by the simulation. The correlation is:
where
Fission gas release (FGR) is critically important in assessing fuel performance. During irradiation, all released gases are captured within the MiniFuel capsule itself, which was welded shut prior to reactor insertion. Therefore, the FGR of a MiniFuel sample is evaluated by measuring the 85Kr fission gas present in the free gas volume of the capsule by puncture of the capsule into a closed gas collection system followed by He flushing. The method for puncturing all MiniFuel subcapsules and determining the fission gas released was documented elsewhere (Raftery et al., 2018) and a schematic of the gas puncture system is shown in Supplementary Figure S2. The system was designed specifically to puncture MiniFuel capsules and carry the released fission gas to cold traps for collection and subsequent detection. The puncture system comprises a unit located inside the hot cells and a unit located outside the hot cells. The fuel subcapsule is punctured in the hot cell using the puncture unit (Supplemental Figure S2), which is the only part of the setup located inside the hot cell during the experiment. The out-of-cell components include a series of control valves, a digital pressure transducer, cold traps, an expansion chamber, a sample bottle, a vacuum pump, and a gas supply to control the pressure in the system. Various configurations of this system are used to calculate system volume, capsule plenum volume, and capsule pressure, as well as to collect fission gases from the capsule.
The FGR of all MiniFuel samples will be evaluated by measuring the fission gas present in the free gas volume of each capsule. The fission gases from a subcapsule will be collected via a He sweep gas, which will be flowed through a liquid N-cooled charcoal trap system. Typically, two traps in series are used during this process: the first upstream trap serves as the main fission gas trap, and the second serves as the backup trap so that any breakthrough or leakage through the first trap is noticed and captured. After gas collection, the traps are disconnected from the puncture system and placed in a Ge detector. A high-purity Ge detector system calibrated by a special form source designed to mimic a trap will be used to perform gamma counting of the traps. The activity of the 85Kr can be calculated using Eq. 6 in which the released 85Kr activity (ArKr85) is equal to the difference in the total count (Ctot) and the background counts (Cbkgr) divided by the product of the branching ratio (BR) of 85Kr, the detector efficiency (ε), and the counting time (t). In practice, activities as low as .05 µCi have been detectable with this system.
The FGR of the fuel can then be calculated using the 85Kr source term (AKr85) calculated during the simulation of fuel burn up over the irradiation cycles and the measured 85Kr released activity, as shown in Eq. 7:
To minimize uncertainty during the puncture experiments, the system is checked for leaks before every measurement, and the traps are checked to ensure that no 85Kr remains from previous experiments. The traps are also checked for plugging before puncturing the capsule.
The MiniFuel puncture system was designed based on the design for puncturing fuel-length commercially irradiated rods to measure plenum volume and rod pressure (Raftery et al., 2018). Therefore, the pressure inside the subcapsule before puncture and the plenum volume can be calculated using the puncture system. However, with the current setup, the void volume in the MiniFuel subcapsule is very small compared with the volume of the puncture system, leading to high uncertainties in subcapsule pressure calculation compared to those typical of a larger integral fuel irradiation test (Raftery et al., 2018). The internal volume of the piping and valves might be able to be reduced to a minimum value so that the subcapsule plenum volume is more comparable to the isolated system free volume, allowing a measurement with less uncertainty to be made. Although this pressure measurement would be useful as additional data on the irradiation behavior of the fuel, it is unnecessary to estimate the FGR. Also, the pressure rise after puncturing can be used to provide a qualitative indication that the subcapsule welds did not fail during irradiation or postirradiation handling before puncturing (Raftery et al., 2018; Harp et al., 2021).
Evaluation of swelling/density change is a primary motivation for the experiment. Density of samples of the geometry used for the MiniFuel irradiation can be accomplished through many means for unirradiated materials, but considerations inherent to irradiated fuel drove development of methods amenable to irradiated nuclear fuels examined in a hot cell environment. Dimensional analysis on postirradiation specimens will be conducted by XCT and laser profilometry. XCT has the advantage of providing a full 3D view of the sample but is significantly more time consuming for high-attenuation samples, such as U-Mo. In this work, XCT was performed similarly to postirradiation examination samples, as described in this section, and a Xradia MicroXCT-400 unit was loaded with a W sample (nominally .3 mm thick disk with a 3 mm diameter).
Four sets of scans were collected with different total frame counts (400 and 800) and dwell times (4 and 8 s/frame). Frames were collected over a 180° span to enable a full 3D sample reconstruction. After collection, 3D intensity maps were evaluated using a custom MATLAB script to standardize the image segmentation process. Filtering and morphological operations were performed for noise reduction and to improve edge sharpness. Initially, Otsu’s method (Kittler and Illingworth, 1985) was used for thresholding, and this method was later refined interactively with the user. Next, the image was segmented in voxel groups, which were each assigned their own material. Morphological operations based on the sample’s cylindrical geometry were performed to improve the segmentation. Finally, physical dimensions were assigned based on known image size.
The second method of dimensional analysis uses a custom laser profilometry system that comprises two Keyence CL-P030 fiber-optic laser sensors and a ThorLabs MCM3000 mechanical stage, as illustrated in Figure 2A. The CL-P030 sensors have a height precision of .94 µm and a spot size of 38 µm. The process diagram in Figure 2 shows the method by which pre- and postirradiation measurements were conducted. First, data were collected over a field of view large enough to capture the complete specimen. These data were then imported and filtered to remove background and edge effects, which can be visualized in Figure 2B. Finally, using the convex hull approach, the minimum enclosing volume was computed, as shown in Figure 2C. Using two coincident lasers allows direct thickness to be measured without assumptions intrinsic to the caliper or depth-microscopy techniques. Primary uncertainties involve resolution (i.e., edge effects due to XY step resolution and laser spot size), data filtering, and volume rendering algorithms.
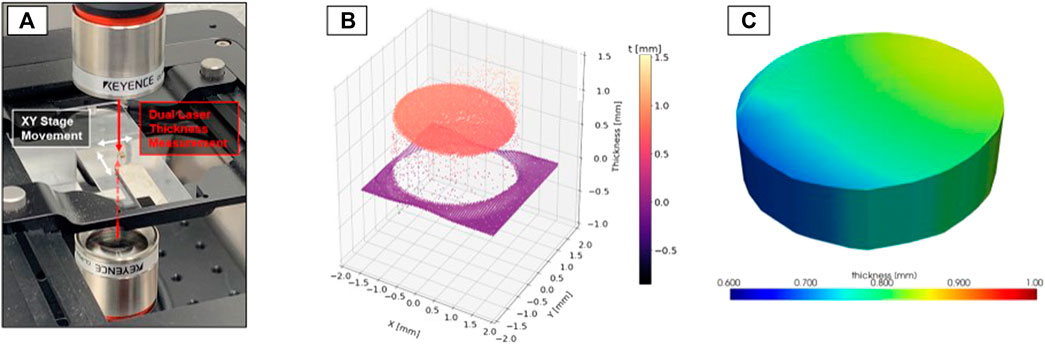
FIGURE 2. Process diagram for laser profilometry measurements (A) dual-laser data acquisition across MiniFuel disk specimen, (B) data import and visualization, and (C) volume rendering.
Following irradiation, several microscopy features are of interest: (Mueller et al., 1962): changes in preirradiation dendritic bands of variable Mo concentration (Section 4.1.5), (Bleiberg et al., 2019), the development of precipitate structures, (Hofman et al., 1998), alterations in grain boundary structure, (Rest et al., 2006), the formation of gas bubbles, and (Dwight, 1960) phase decomposition. General microscopy will be performed using the Thermofisher Scios SEM with imaging conditions similar to those in Section 3.1. SE and BSE imaging will be used to preliminarily assess each of the aforementioned features, where possible. If dendritic bands (Section 4.1.5) are present after irradiation, they will be quantified using EDS. Precipitates and nucleation of α and/or γ’ U will be observed, where visible. Like in this work, Slice-and-View will be used to partially quantify voids and precipitates in select samples, based on other observations. EBSD and XRD will be used to identify any changes in crystal and grain boundary structure more generally.
Following these larger examinations, FIB liftouts will be taken from relevant samples and examined with TEM using the FEI Talos S/TEM. The primary goals of this examination will be to (Mueller et al., 1962) identify nanoscale nucleation of non-cubic-U if none is observed by other means, (Bleiberg et al., 2019), examine observed precipitate structures, and (Hofman et al., 1998) evaluate the presence and content of nanoscale gas bubbles.
Thickness maps for the 18 U-Mo MiniFuel disks are presented in Figure 3 and normalized to the same color scale. These maps show significant specimen-to-specimen variations in maximum thickness while also highlighting significant variations in thickness within each specimen. These variations become paramount when estimating pre- and postirradiation volumes. Volumes of each specimen can be computed in two different ways. First, the volume can be estimated using a convex hull approach whereby the volume of the smallest volume containing the point cloud is calculated. The second way that this volume can be calculated by generating a 2D finite element mesh across all XY points extruded over each point thickness. The difference between these two methods is usually small (i.e., less than 5%), and the first method provides slightly higher values because of the nature of the convex hull approach. Regardless of the aforementioned method, the average difference between caliper-based volume measurements and the high-fidelity laser profilometry measurements ranges from 8 to 13% for these 18 disks, which is a non-trivial error when attempting to discern dimensional changes during postirradiation examination.
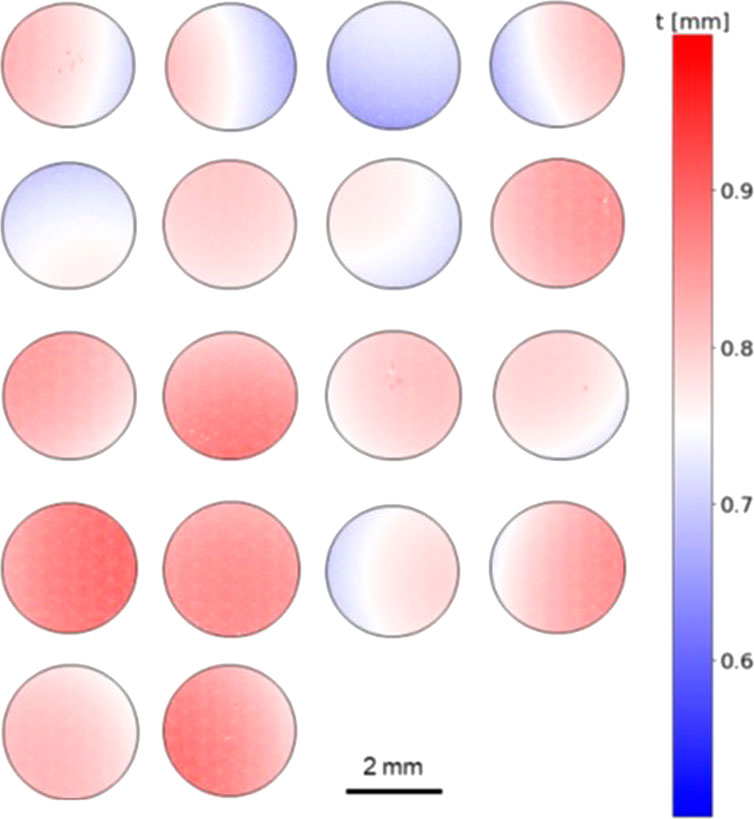
FIGURE 3. Color maps of specimen thickness for 18 U-Mo MiniFuel samples as measured by the laser profilometry method.
Errors in the laser-profilometry approach are primarily attributed to the precision achievable for the XY stage. Figure 4 shows this in two different ways by analyzing a .5 mm steel gauge block procured from Mitutoyo. Theoretically, a gauge block should be a smooth standard with constant thickness (published uncertainty .03 μm at room temperature). Practically, however, the laser profilometry system can capture local thickness variations across the gauge block. These variations are on the order of only a few micrometers, but scans using a step size of 25 (Figure 4A) and 100 µm (Figure 4B) can resolve these nuanced thickness gradients across the gauge block surface. This shows the high accuracy of the laser system. Conversely, five consecutive scans of the same area are compared as thickness histograms in Figure 4C. The average thickness of these five scans is approximately 498 µm with a standard deviation of 320 nm, but each sequential scan shows a trend for decreasing average thickness. This trend is due to a slight hysteresis in stage position caused by a lack of precision translating encoder values to dimensional translations. The result is a slight change in the center of the field of view during repeated scans, which leads to a slight change in average thickness. This phenomenon is less concerning for single scans with a small step size than for scans with large jumps in XY coordinates. By understanding and controlling these stage artifacts, laser-based dimensional measurements can significantly improve postirradiation volume measurements. Because these gauge blocks are used for calibration, the uncertainty associated with the laser profiling system is estimated to be 3 µm. Compared to the 700–900 µm heights of the sample, a 3 µm uncertainty results in <.5% overall height error for the present samples. For a cubic, γ-U, crystal, the swelling is isotropic and thus swelling can be measured either with full volume change, or, with only height change following irradiation.
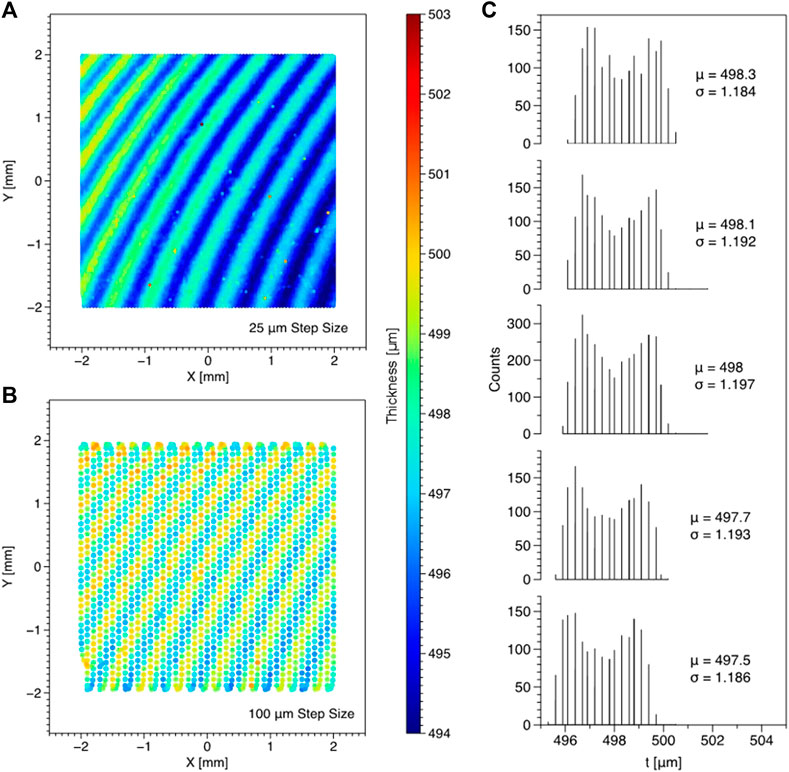
FIGURE 4. Demonstration of laser profilometry system precision and repeatability on a .5 mm gauge block. Color maps of laser scans on a 4 × 4 mm region are taken using a step size of (A) 25 µm and (B) 100 µm. Furthermore, consecutive scans of the same area using 100 µm step sizes are shown in (C) as scan-to-scan variation in thickness measurements.
Bulk density measured against theoretical density was used to determine overall sample porosity. Local porosity and precipitate density were calculated based on the Slice-and-View results. Theoretical density was estimated based on a rule of mixtures (Rest et al., 2006):
where
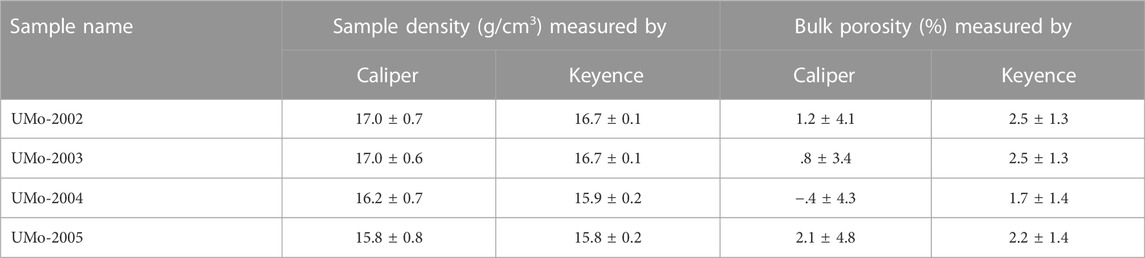
TABLE 2. Sample geometric density and bulk porosity based on sample dimensions measured by calipers and the Keyence Macroscope.
Density and porosity were both similar for samples with identical concentration, indicating good repeatability between batches; this was also shown by XRD and microscopy observations. Additionally, the samples were small enough that caliper error was significant and led to larger errors than those estimated using the Keyence Macroscope. The Keyence Macroscope data further resulted in estimates that were within one standard deviation of the Caliper values and resulted in lower error values. As a result, the Keyence-derived data are presumed to be more useful for the purposes of swelling evaluation, as discussed in Section 4.4.2.
Bulk porosity is contributed to by large, sometimes interconnected voids, as well as by much smaller voids. Slice-and-View data were used to quantify nanoscale precipitates (Section 4.1.5), as well as more localized pores. The result of this local defect evaluation is shown in Table 3 for one Slice-and-View operation on U-10Mo from the 2003 batch. Four different properties for both pores and precipitates are shown in Table 3 the percent of the Slice-and-View block composed of the pores/precipitates; the minimum, average, and maximum volume of each defect; and average aspect ratio and sphericity. Aspect ratio was computed as the maximum principle axis divided by the minimum principle axis, and sphericity was computed as the true surface area divided by the surface area of a perfect sphere with the same volume (Wadell, 1932). Pores comprised much more of the local volume and were either small, <.005 µm3 spheres or larger voids. The larger voids comprised nearly the entirety of the porosity and were less spherical. In contrast, precipitates were more numerous, smaller, and more elongated on average than the voids. Because of the local nature of the Slice-and-View operation, the results in Table 3 may not be characteristic of the distribution of pores and precipitates throughout all samples. However, these results are consistent with the general microscopy of the samples. The geometry of each identified defect is provided in the Supplementary Table S1.
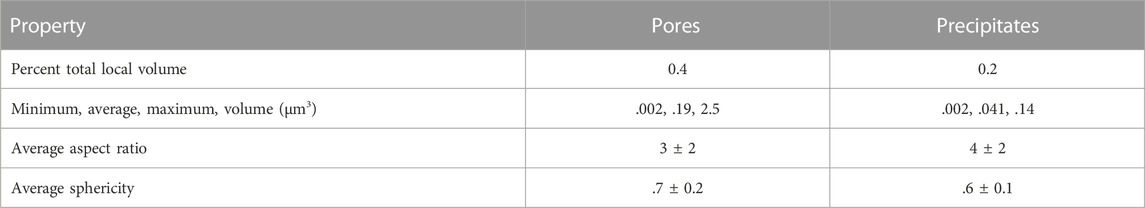
TABLE 3. Local porosity and precipitate characteristics, as determined by data from Slice-and-View operations.
Both types of porosity as well as precipitate defects are likely to influence the irradiation performance of the U-Mo alloys compared to defect-free alloys. Precipitates are expected to have two primary effects. First, both U-10Mo and U-17Mo are anticipated to remain in the meta-stable γ-U crystal structure as a consequence of ballistic mixing during irradiation (Lu et al., 2021). However, if any phase decomposition into α- and/or γ′-U does occur, the numerous nano-scale precipitate defects in the alloys can serve as crystal nucleation points (Hofman et al., 1998; Neogy et al., 2012). If ballistic mixing and fission recoil are insufficient redissolve any nucleated crystals, the presence of the as-cast defects may lead to early-onset phase decomposition. PIE will focus on identifying any such decomposition. Second, the interface between precipitates and the bulk matrix is a likely surface on which larger voids may nucleate and recrystallization may begin from (Rest et al., 2006; Kim and Hofman, 2011; MEYER et al., 2014). During the initial low-swelling regime, precipitate interfaces may not have much of an effect as most of the gas will be trapped in nano-bubbles within the matrix. However, as gases diffuse, precipitate surfaces will act as a non-grain boundary sink leading to higher overall bubble density with lower average bubble size than in a precipitate-free sample. Similarly, the pre-existing precipitates can act as nucleation points for grain recrystallization, leading to a lower overall fission density recrystallization threshold (Rest, 2005; Kim et al., 2013; Hu et al., 2016). As with precipitates, the local, non-interconnected voids will act as high-efficiency gas sinks as gases diffuse from nanobubbles. Because these voids do not initially have gas inside them, they have a small impact in reducing initial swelling until internal pressure becomes large enough to cause swelling. However, the total initial void porosity was so small (.4%), that this effect is unlikely to be noticeable in the final swelling data. Large, interconnected voids, on the other hand, have the potential to impact some of the results in certain samples. Because of the casting method used in this work, porosity was widely distributed across all samples, as shown in Table 2, with most porosity being concentrated into the larger voids. This is shown in Section 4.1.5. Such voids, if exposed to a surface, have the potential to be gas release conduits. PIE will identify any such gas release by gas puncture of the capsules and correlate it to exposed interconnected voids, which only reached the surface of some of the samples.
Despite the small fraction of overall precipitates, XRD examination of the four as-received U-Mo samples, reported in Figure 5, reveal only µ-U in the bulk of the matrix. Figure 5A shows the raw XRD patterns for each sample, along with peak locations for the Si standard (pentagons) and literature values for γ-U (triangles). The large background at low 2θ is the result of the Kapton tape. All peaks not associated with the Kapton or Si standard were found to correspond to γ-U with no evidence of either γ′-U2Mo (relevant to the U-17Mo samples), α-U or other impurity phases. Furthermore, no differences were observed between samples of identical concentration, indicating good repeatability. While this result does confirm that the major component of the U-Mo alloys is γ-U, it is primarily a bulk measurement. Extremely small crystals, such as the nanoprecipitates discovered by Slice-and-View, will often not generate a sufficient signal to be detected by a benchtop XRD instrument.
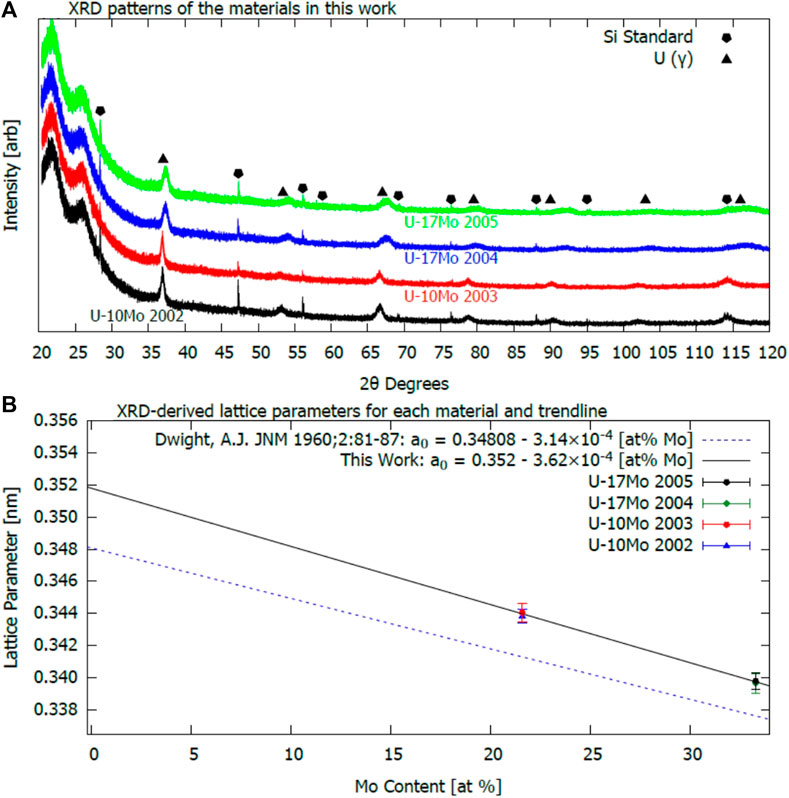
FIGURE 5. (A) XRD spectra for each of the four batches of U-Mo alloys, and (B) lattice parameters calculated from (A) using Rietveld refinement. Each curve in (A) is labeled with the relevant sample name and overlaid with the γ-U and Si standard peak locations. In (B), calculated parameters are given as a function of Mo content in atom percent. In both concentrations, both batches overlap one another, but the points can be discerned upon close inspection.
Rietveld-refinement produced lattice parameters for each sample, which are shown in Figure 5B as a function of atomic Mo content. The derived lattice parameters were found to be consistent for samples of identical concentration. Fitting with linear regression resulted in the black line per (Waldron et al., 1958),
where
Evidence of straining can be seen directly in Figure 5 in which the γ-U peaks are broad in both U-10Mo and U-17Mo patterns; the U-17Mo samples produced the most significantly broadened peaks. As discussed in Section 4.1.5, this lattice strain may be related to dendritic bands distributed across the samples. These bands were composed of U-Mo where each band represented either slight enrichment or slight depletion in Mo content, compared to the bulk. Considering the lattice shrinkage rate from Dwight (Dwight, 1960), there is an approximate lattice mismatch of 2.3 × 10⁻³ nm (U-10Mo) and 3.2 × 10⁻³ nm (U-17Mo) across the variable Mo concentration bands. This lattice mismatch may result in overall straining across the interface that is on the order of .7–.9%. Although the estimated strain will not be uniform over the entire sample given the micrometer-sized width of the dendrites, the similarity to the observed straining of the lattice by XRD suggests that the dendritic bands may be responsible for the lattice strain.
The modulus and hardness of each sample were also examined with nanoindentation after calibrating the frame stiffness and tip area using a SiO2 standard. After calibration and below 200 nm, the SiO2 data were noisy, whereas above 200 nm, they converged to calibration values. The supplementary material provides more information on the raw SiO2 indentation curves (Supplementary Figure S3). The U-Mo reference samples were then indented using the same configuration as the SiO2 standard. Initial values between 200 and 400 nm depths were more variable than the SiO2 standard, and bulk values were not achieved until approximately 900–1,000 nm indent depths. This behavior was attributed to the various defects in the sample, particularly the precipitates, which will be more impactful at low indent depths where the stress field from the small defects affect a comparatively small tip area. All useful indent curves for each sample type were averaged from 900 to 1,000 nm, and the results are shown in Figure 6A for hardness and Figure 6B for modulus.
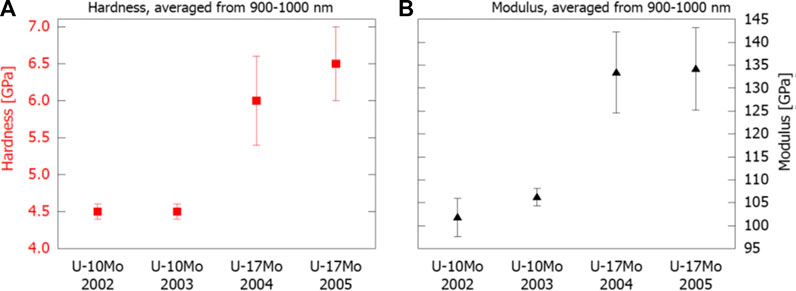
FIGURE 6. (A) Hardness and (B) modulus of each of the U-Mo alloys sorted by batch with concentration noted. The parameters were obtained by averaging the sample data after indenting between 900 and 1,000 nm into the material.
Elastic modulus and hardness in the bulk were found to be 134 ± 13 GPa and 6.3 ± .8 GPa, respectively, for U-17Mo. U-10Mo was found to have a modulus of 104 ± 5 GPa and a hardness of 4.5 ± .1 GPa. Literature values report U-10Mo modulus on the order of 80–100 GPa (Waldron et al., 1958; Gates et al., 2019; Rest et al., 2006; Newell et al., 2017). The present properties are at the upper limit of the range of modulus found in literature for U-10Mo samples (Waldron et al., 1958; Gates et al., 2019; Newell et al., 2017). It is possible that normal scatter in the literature data related to instrumentation, sample fabrication methods, or other errors may generally account for the higher range of the data. However, some of the higher range is expected to be caused by the impact of the numerous nano-scale precipitates within the matrix. These strengthened the material and led to the reported data instability at low depths that required using indents from 900 to 1,000 nm for bulk value reporting.
Finally, electron microscopy, consisting of SEM, EDS, and TEM, was used to confirm several observations from foregoing sections and add additional insight into the as-cast samples. Representative SEM BSE images of all four batches of U-Mo castings are shown in Figure 7. The left column—Figures 7A, C, E, G—contains low-magnification images, and the right column—Figures 7B, D, F, H—contains higher magnification images. Figures 7A, B show images from U-10Mo 2002. Figures 7C, D show images from U-10Mo 2003. Figures 7E, F show images from U-17Mo 2004. Finally, Figures 7G, H show images from U-17Mo 2005. Figure 7 shows a high degree of similarity between samples of identical concentration; U-10Mo 2002 and U-10Mo 2003 are similar, and U-17Mo 2004 and U-17Mo 2005 are similar. This indicates good sample reproducibility via this arc-casting method. All samples showed a varying degree of localized defect regions (blackened regions), which primarily appear to be pores.
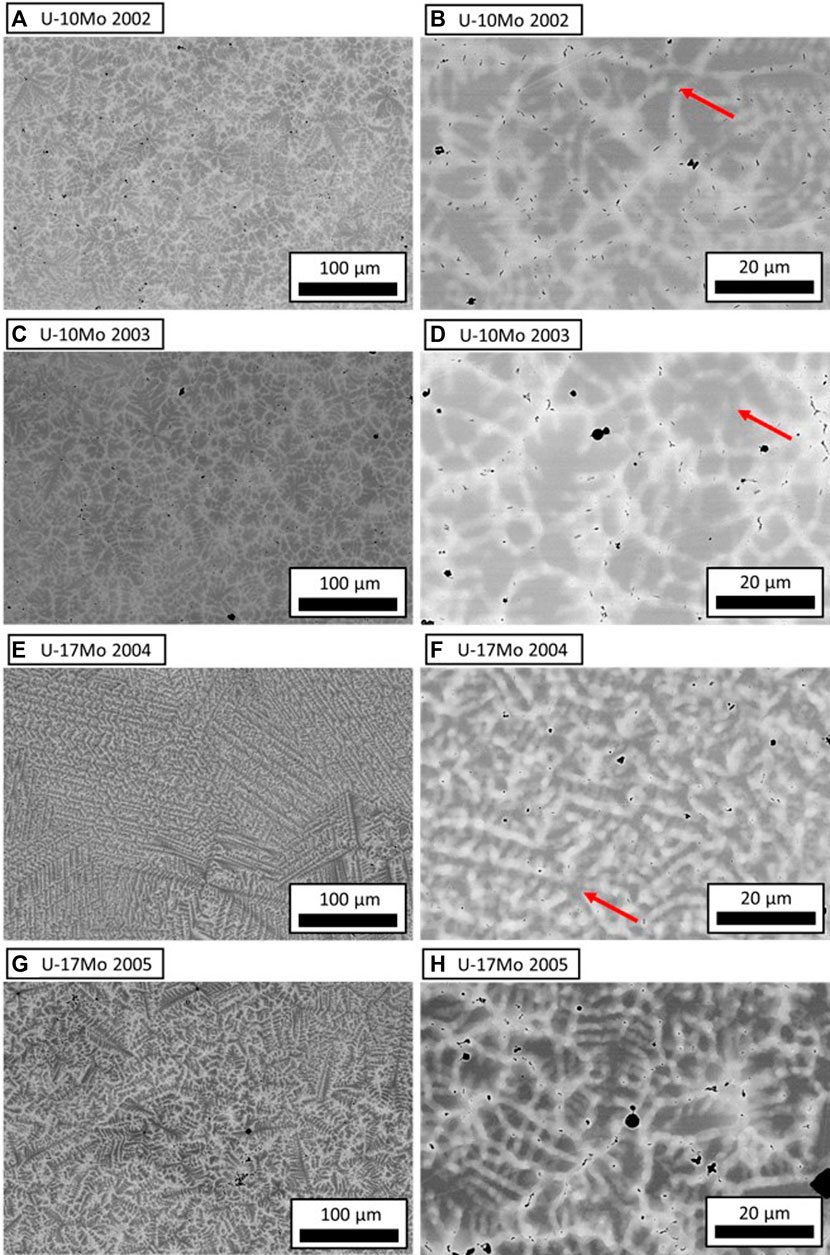
FIGURE 7. Representative BSE images of each U-Mo alloy at low (A,C,E,G) and high (B,D,F,H) magnifications. Voids and recessed regions appear as blackened areas. Darker areas are regions of lower electron density. Red arrows indicate locations where darker banded regions intersect.
These pores are distributed throughout the entire surface of the sample. Other pores were observed distributed over the surface, with some preference towards the middle. A few of the interconnected pores are shown in the Supplementary Figure S4 using SE imaging for two samples, one from each batch. Higher magnification images (SE and BSE) of local defects (precipitates and “non-interconnected” voids) on two samples, one from each batch, are also shown in the Supplementary Figures S5. The density of these larger, often interconnected pores on the surface varied significantly between samples with some showing several percent areal coverage and others showing none on the surface. This observation does not require that certain batches were denser than others. As shown in Table 2 already, the bulk porosity for all batches was roughly similar. Changes in visually observed porosity between sample batches was related only to the choice of cutting location when the U-Mo disks were fabricated.
In addition to small pores and precipitates, in both sample sets, high-contrast BSE imaging resulted in the observation of dendritic dark-banded regions, which are indicative of significant electron density variation across the samples. The darker banded regions also appear to emanate from singular points in Figure 7, some of which are indicated with red arrows. In the U-10Mo samples, the bands are up to a few micrometers wide and similarly 5–20 µm long, whereas in the U-17Mo samples, the bands are >20 µm long and thin, <2-3 µm. These banded regions were further found to be independent of grain boundaries. Representative EBSD inverse pole figures (IPF) are shown in Supplementary Figure S6 for each of the four samples examined. Grain shapes and sizes were found to be inconsistent across U-Mo batches, although all grains were large with averages of 77 ± 40 μm, 50 ± 16 μm, 123 ± 45 μm, and 57 ± 25 μm, for the UMo-2002, UMo-2003, UMo-2004, and UMo-2005 samples, respectively. The differences observed in the average grain size and in the IPF plots are likely due to cast-to-cast heating time and cooling rate variations. Such large grains are typical of observed grains in U-Mo fuels (Kim and Hofman, 2011; Kim et al., 2013). Regardless of the batch, all grains were significantly larger than any of the dendritic bands. The latter of these was postulated to be the result of incomplete Mo dissolution into the matrix during casting.
EDS revealed that the lighter regions have larger amounts of U than the darker regions with the balance being Mo. Evaluating the concentration at the center of both the light and dark bands enabled the quantification of the relative enrichment of Mo, the result of which is presented in Figure 8. Figures 8A, B show the minimum (squares) and maximum (pentagons) local concentrations, as well as bulk concentrations (triangles) of U and Mo, respectively, for each sample type. In agreement with the surface microscopy, samples with identical Mo concentration showed similar concentration variations across bands, and similar band structure. However, the U-10 Mo samples showed about 3-4 wt % Mo variation across bands—less than that of the U-17Mo samples—in which the Mo concentration varied by approximately 6 wt %. These bands are attributed to the sample casting without subsequent annealing (Kautz et al., 2021).
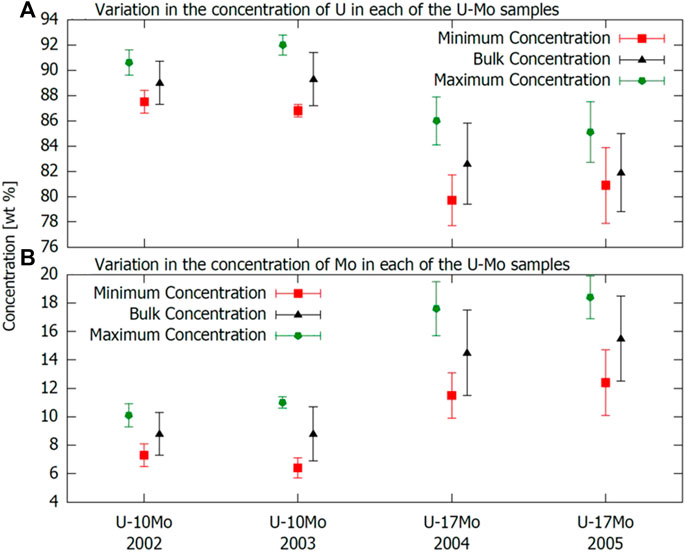
FIGURE 8. Summary of the EDS-calculated (A) U and (B) Mo concentrations in each set of U-Mo samples. The red squares, black triangles, and green pentagons represent the concentration average in the low concentration regions, in the bulk, and at the point of maximum concentration, respectively.
Finally, TEM revealed that in addition to a variety of small pores and Mo concentration variations, several of the precipitates identified during the Slice-and-View and SEM operations. All observed local defects also included small, often elongated defects. These defects did not appear to be substantively different for samples of different concentrations. Two such defects are shown, along with EDS line scans, in Figures 9A, C are HAADF images of different precipitates, along with overlaid lines indicating line scans across the precipitates. Line scans in Figures 9B, D are given for U, Mo, C, and N, whose concentrations all varied over each precipitate. In both precipitates, C and N were enriched, whereas the Mo concentration was significantly depleted. Such precipitates were previously observed in other works (Kautz et al., 2021) and are likely due to impurities in the source materials or casting environment.
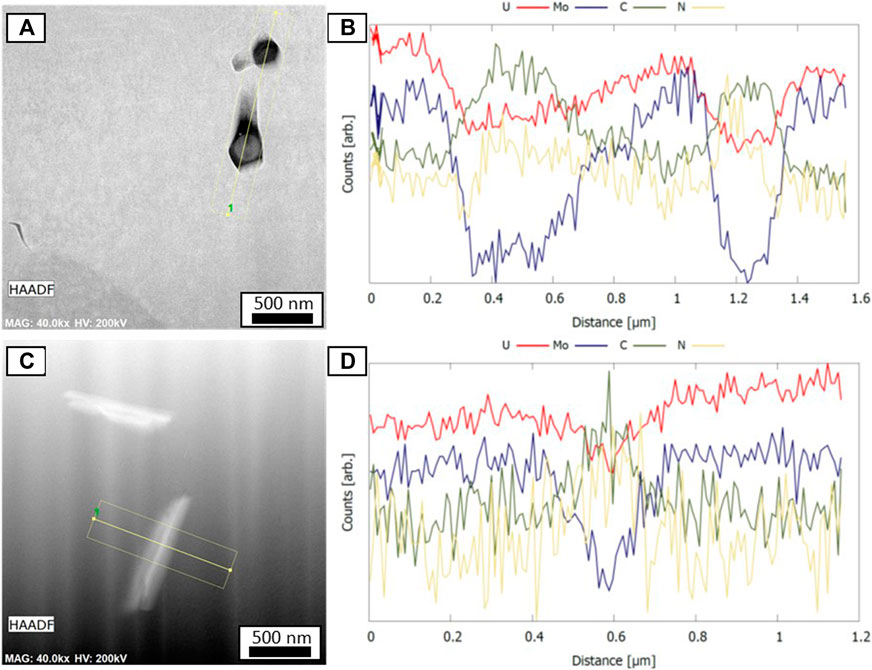
FIGURE 9. TEM-EDS line scans of the U-10Mo 2002 sample indicating that the precipitates feature a lack of Mo but still contain high concentrations of U in addition to N and O. Linescans (B, D) were produced by averages of the map data across the specific regions shown in (A,C), using a line step size of 8.5 nm.
To provide some insight into the expected irradiation performance of the U-Mo alloys characterized in Section 4.1, eighteen disks were simulated for 8, HFIR cycles, each 24 days long. Startup and shutdown power ramps were assumed to last for 24 h each. Additional 24 h periods were added between cycles to approximate outages. The assumed lengths of the ramps and outages were not expected to affect the results because minimal burnup occurs during power ramps.
BISON’s strain predictions as functions of fission density and average disk temperature at the end of each HFIR cycle are shown in Figure 10. Figure 10A shows the thermal expansion strain, which is a function of temperature only. Figure 10B shows the fission gas swelling strain. The line matches Eq. 4. Figure 10C shows the solid fission product swelling strain, which likewise matches Eq. 3. Figure 10D shows the creep-induced strain, which is a function of fission density and temperature. This likely reflects stresses induced by the temperature gradients that form across the disk because BISON’s existing U-10Mo creep model does not account for temperature. Figure 10E shows the permanent strain, which is the sum of the gaseous swelling strain, solid swelling strain, and creep strain. This is the strain that would be measured during postirradiation examinations. Figure 10F shows the total strain, which includes the permanent strain and reversible thermal expansion. BISON predicted no FGR in any of the disks, so those results are not shown. This is consistent with Eq. 4, which shows fission gas swelling increasing steadily up to 65 × 1020 fissions cm−3. This increase suggests that little-to-no FGR occurs because FGR decreases the rate of fission gas swelling (Pahl et al., 1990).
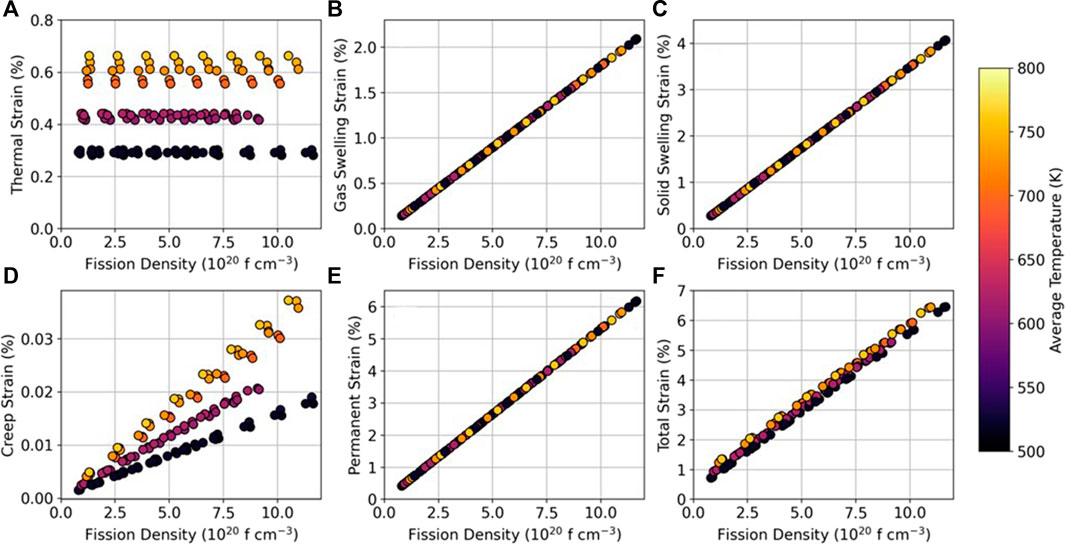
FIGURE 10. BISON-predicted strains of U-10Mo disks compared with fission density and average disk temperature. The strains shown include (A) thermal expansion strain (B) gaseous fission product swelling strain, (C) solid fission product swelling strain (D) creep-induced strain, (E) permanent strain caused by swelling and creep, and (F) total strain caused by thermal expansion, swelling, and creep.
The predicted strains followed simple patterns for two reasons. First, the empirical correlations used in the models are relatively simple. Second, the MiniFuel design reduces or eliminates many non-linear relationships—such as large temperature gradients, cladding interactions, and fission rate variations—that normally complicate fuel performance predictions. However, these BISON simulation results are not certain given that the small number of available U-10Mo models have been developed using data relevant to low temperature research reactors. High temperature reactor results show different behavior than research reactor suggesting potential differences in applicable models as the temperature increases to the range of 250–500°C explored in this work (Harp et al., 2018). Never-the-less, the BISON results are valuable as a baseline expectation of mechanical behavior of the U-Mo samples. The planned PIE methods (Section 3.3) will shed light on model accuracy and can be used to improve predictions.
Following irradiation and gas puncture, XCT and light profilometry will be used as complementary techniques to examine as-irradiated fuel disk swelling. Light profilometry will be used to accurately quantify sample height, while XCT has the capability to produce a 3D image, include a second measurement of post-irradiation disk height. The profilometry system for PIE will be the same as in Section 4.1.1, with a height uncertainty of approximately 3 µm.
XCT volume uncertainty is less straightforward than for the light profilometer and is determined from the error in segmenting the edge of the sample from the surroundings. This uncertainty can be estimated based on the change in brightness at the boundary. Brightness is affected by several factors, including sample geometry, sample orientation relative to the x-ray source, and scan parameters, as shown in Figure 11. Figure 11A shows brightness line profiles for the collection at 800 frame collection at 8 s/frame. Profiles are given as raw intensity against the number of pixels relative to the top, bottom, and radial segmented edges (pixel 0 for each) with negative pixel numbers indicating the sample interior. Figure 11B shows the radial profiles for all four different collection conditions.
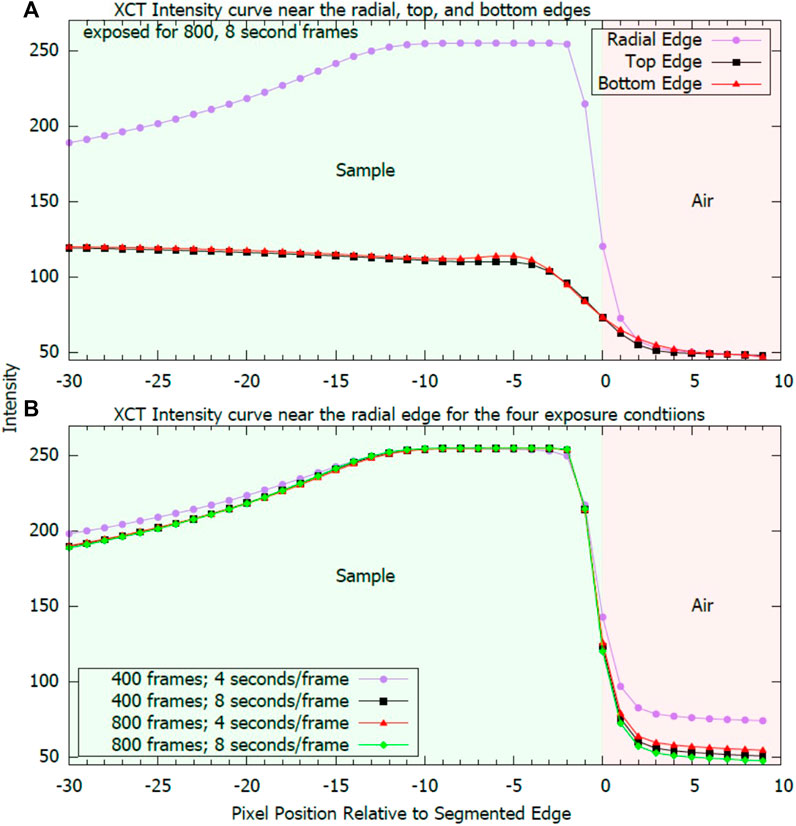
FIGURE 11. Intensity curves for the W disks for (A) 800 frames at 8 s/frame from the radial, top, and bottom segmented edges and (B) all four collection conditions near the radial edge.
From the center of the sample to the edge, Figure 11A shows significant improvement in the brightness contrast as the edge is approached radially but less contrast at the top and bottom edges. This effect is directly related to sample orientation and geometry. Sitting flat on the sample stand, x-ray attenuation varies substantially as a function of radial location because the samples are cylindrical. At the furthest edge, the path through the sample is almost zero, leading to minimized attenuation, whereas the path is the full sample diameter in the sample center, leading to maximized attenuation. As the sample rotates, attenuation at any given point on the edge will vary between this maximum and minimum attenuation, whereas attenuation will always be maximized in the center. This effect was not observed in the top and bottom edges because rotation does not change the path length through the material. The resulting net effect is that there is significantly higher boundary contrast at the radial edges than in the top and bottom edges. For all edges, the segmentation boundary (pixel 0) is approximately in the center of the brightness reduction curve.
Scan parameters are also shown to affect the appearance of the edge, as shown in Figure 11B. The lowest exposure condition (400 frames at 4 s/frame) showed the least edge contrast. Any increase in the exposure condition led to an improvement in edge contrast. Differences between the three higher exposure conditions are marginal; however, Figure 11B shows a greater effect for increasing dwell times than for increasing frame count. Collecting data using 400 frames at 8 s/frame improved the contrast somewhat more than collecting data with 800 frames at 4 s/frame. Little additional improvement was seen by further doubling the count to 800 frames at 8 s/frame from 400 frames at 8 s/frame.
Uncertainty in the volume calculation was performed by estimating uncertainty in the location of each segmented edge. Visually inspecting the data lead to an estimated uncertainty in the pixel range corresponding to approximately ±25% of the total brightness change. This analysis led to estimated radial and height uncertainties of σr = 3.3 µm and σh = 8.5 µm, respectively, for the 800 frame exposure at 8 s/frame. Both uncertainties varied less than 5% from these values for collections using 400 frames at 8 s/frame and 800 frames at 4 s/frame. The lower contrast values for collection of 400 frames at 4 s/frames led to a larger increase in errors to σr = 3.7 µm and σh = 11 µm. Although the ultimate evaluation of as-irradiated U-Mo samples will result in somewhat different errors, the values reported here are expected to be limiting because of the similar attenuation coefficients of W and U. Additional improvement in uncertainty may also be obtained by improvement in XCT instrumentation and turning the sample 90° to allow the contrast-improving edge effect to be transferred to the height, whose error is about 2.5 times that of the radius.
Gas release will be measured using the puncture unit described in Section 3.3.1. With the gas-release system, an approximate .05 µCi of 85Kr can be resolved, although volume limitations prevent a total gas release measurement by pressure change. In low burnup (two cycle, .5–.9%FIMA) samples, approximately 130–200 µCi of 85Kr will be created, depending on composition, size, and exact fluence (Weber, 1963). This leads to a detectability limit range of better than .02% of total produced Kr. For higher fluence, this resolution increases further due to increased total 85Kr. Although Section 4.2 notes that no gas release is expected, the BISON model used to generate those results carries uncertainties that this work aims to reduce. If significant amounts of gas are released, the current system is expected to reliably detect any significant fraction of released gas.
Determining breakaway swelling in U-10Mo and U-17Mo fuels under the conditions described in Section 2.2 is critical to evaluating prospects for use of U-Mo fuels where reactor design dictates fuel temperatures will be higher than those of low temperature research reactors but below those of SFRs. An example of such an application would be evaluation of U-10Mo for use in commercial light water reactors (LWRs), as has been previously proposed as part of accident tolerant fuel research (Nelson and Demkowicz, 2020). Previous studies in research reactors and sodium-cooled fast reactors have found significant swelling of >10% in U-Mo fuels for fission densities up to 1022 cm−3 (Rest et al., 2006; MEYER et al., 2014; Harp et al., 2018) with breakaway swelling reaching above 50%. Fission densities in the present work are planned for up to 1.4 × 1021 cm−3 (3.5% FIMA), which is expected to encompass a potential breakaway transition point, expected to be under 1021 cm−3 (Rest et al., 2006; Harp et al., 2018).
To determine whether breakaway has occurred, the error in swelling measurements must be well known. For any given set of initial and final volume measurements, V1 and V2, respectively, the error in swelling can be expressed as (Smirnova et al., 2015).
In the present work, V1 was determined in three ways: taking caliper measurements, taking measurements using a Keyence Macroscope, and using height mapping with the laser profilometer. Similarly, V2 will be determined by either or both XCT and laser profilometry. When computing swelling with the laser profilometer, height changes will be used in place of a full volume change. Figure 12 shows the result of plotting (Smirnova et al., 2015) for the resulting possible data combination. Regardless of the method of swelling measurement chosen, the projected errors in the swelling determination are <4.5%, indicating that the breakaway swelling, which is several 10 s of percent, should be readily resolvable and that statistically non-zero swelling measurements should also be observable between .5 and 3.7% swelling, depending on the measurement method. The most robust method is using the laser profilometer, which provides the lowest swelling measurement error of all the methods and yields swelling resolution <.9% with little resolution worsening with increased swelling. The XCT and macroscope methods also yield comparable resolution <1.5%. Calipers do not provide good swelling resolution because the samples themselves are not perfectly flat (Figure 3); thus, the thickness data are very uncertain from caliper measurements. This also results in a much higher net swelling error for the caliper/profilometer data combination, which uses only height changes for swelling, than for the caliper/XCT combination, which uses the full volume swelling.
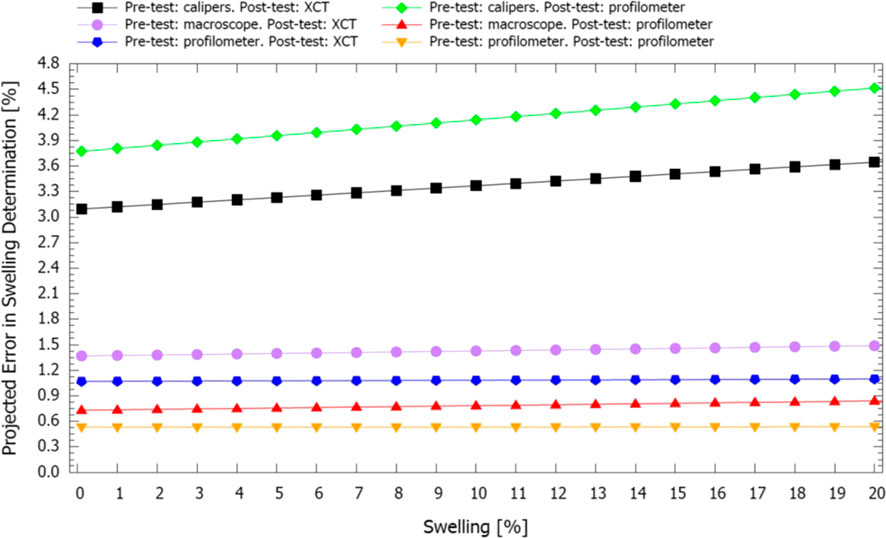
FIGURE 12. Projected error in swelling determination as a function of potential swelling using six measurement scenarios. Pre-test and Post-test refer to measurements before and after the irradiation, respectively. Macroscope refers to the Keyence 3D macroscope, calipers refers to manual measurements with calipers, and profilometer refers to the laser profilometer. Errors were estimated from repeated sampling.
While HFIR irradiations provide the ability to achieve high fission densities relatively quickly in nuclear fuel, the burnup accumulation rate is significantly higher than reactor designs would impart. In the U-Mo context, the effect of high flux remains to be evaluated in both the temperature and lower flux range of interest to various applications. Three potential effects are relevant for discussion of U-Mo fuels: excess Mo transmutation leading to buildup of impurities, dislocation structures relevant to recrystallization developing at different rates than in a low flux environment, and void swelling. Of these, Mo transmutation is the least likely to have an effect. Transmutation of Mo is almost universally a neutron capture event, with only two isotopes having recorded (n, α) reactions: both reactions have <.05 mb cross-sections are thus inconsequential (Baum et al., 2009). Dislocation structures are more likely to have an impact, with most prominent effect being the enhancement or suppression of recrystallization (Rest, 2005; Kim et al., 2013; Frazier et al., 2019). Recrystallization kinetics have been found to depend strongly on the number density of available loop structures, which has some dependence on both temperature (for diffusivity of the loop clusters) and fission rate (for the production and cluster annihilation of existing defect structures). Moreover, recrystallization is delayed in larger grains. For the irradiation temperatures in the present study, defect clusters will be sufficiently mobile that the higher fission rate is expected to have less of an effect than defect motion, particularly in the higher, 450–500°C, temperature range (Frazier et al., 2019). However, this expectation will have to be assessed by additional investigations. Finally, void swelling is not expected to be appreciably affected by the fission rate. In applying the Booth gas bubble model to U-Mo fuels, Hu et al. found no effect of fission rate across the range of 1020–1022 cm−3 s−1 (Hu et al., 2016). In that work the maximum simulated grain size was an order of magnitude smaller than the average grains in this work and it is also not clear whether the detailed distribution of bubbles and their sizes will have a burn up rate dependence. Some additional modeling following the PIE from this work is appropriate to answer these questions.
This paper discusses the irradiation of U-10Mo and U-17Mo samples. Four samples representing each sample batch were examined by several methods to precharacterize the samples. Using XRD and EBSD, all samples were found to comprise uniform γ-U crystals, and TEM and Slice-and-View showed nanometer-scale precipitates that were enriched in C and N and depleted in Mo. No metallic Mo, α-U peaks, or γ′-U2Mo were identified via either EBSD or XRD. Significantly, all samples showed dendritic bands that were characteristic of variations in actual U and Mo concentration. Across these bands, U-10Mo samples showed variations of ±2 wt % from the bulk concentration, and U-17Mo samples showed variation so of ±3 wt %. These bands were thinner and longer in U-17Mo than in U-10Mo and were attributed to the casting process absent annealing. Mechanical properties were found to be on the upper range of previous reports at 104 ± 5 GPa for U-10Mo and increased to 134 ± 13 GPa for U-17Mo alloys. Hardness was 4.5 ± .1 GPa for U-10Mo and increased to 6.3 ± .8 GPa for U-17Mo alloys. Finally, samples were found to contain variable porosity up to 3%. No effect of concentration was observed in total porosity, which was attributed to the casting process. Significantly, no batch-to-batch variation was detected for either concentration.
This paper also presents irradiation method and postirradiation examination methods. Irradiations in HFIR are ongoing using the recently developed MiniFuel design. Three sample burnups from across the range of .5 to 3.5%FIMA are completed or almost completed for four different temperatures from 250 to 500°C. Expected irradiation behavior is estimated using BISON simulations which predicted that swelling will be linear across the full irradiation period with total swelling up to approximately 6% at the highest burnup. These simulations were performed by importing fuel parameters from other fuel types and with U-Mo correlations developed for conditions outside of the 250–500°C temperature range. Thus, the BISON predictions provide a valuable, but uncertain initial estimate of the U-Mo irradiation behavior in this work. Swelling will be evaluated by measuring the dimensions of the fuel samples with XCT and laser profilometry. When comparing these measurements with preirradiation testing, swelling is predicted to be resolvable when above 1–2%. Furthermore, gas release is expected to be resolvable to better than .02% of produced 85Kr, if any is released.
PIE data and analysis presented in this work will be used to improve understanding of the U-10Mo and U-17Mo fuel systems under irradiations across the 250–500°C temperature range. Specific focus will be given to understanding 1) bulk swelling behavior, 2) fission gas release during normal operation, 3) phase stability and grain restructuring under irradiation, and 4) gas bubble formation and evolution. These data will finally be used to improve modelling designs.
The raw data supporting the conclusion of this article will be made available by the authors, without undue reservation.
PD: Data collection and analysis on preirradiated materials, writing related to the preirradiation examination, writing and editing. CM: Data collection and synthesis, visualization, and writing. DR: XCT data collection and analysis, writing, and editing. IG: Fuel performance modeling, contributed section to manuscript. RS: TEM data collection and reporting, Slice-and-View data collection and processing. GH: XCT analysis and 3D data processing. TU: Planned capsule punctures and fission gas collection and writing. RG: Irradiation experiment thermal design and safety analyses, experiment assembly and delivery. KG: Performed neutronics calculations during the design phase of this experiment. RF: Initial specimen fabrication. AN: Supervision, conception, design, writing and editing. JH: Conception, irradiation design, supervision of pre-irradiation examination and technical advice, writing and editing.
The research is sponsored by the National Nuclear Security Administration Office of Defense Nuclear Non-proliferation Research and Development (DNN R&D), United States, Department of Energy (DOE).
The authors gratefully acknowledge the work of Christopher Hobbs and Andrew Kercher for assistance in sample preparation and testing. Christian Petrie, Annabelle Le Coq, Alicia Raftery, and Kurt Smith also provided valuable assistance in irradiation design and deployment. Tyler Gerczak and Matt Kurley provided helpful technical review of the document and Elizabeth Kirby assisted with technical editing.
The authors declare that the research was conducted in the absence of any commercial or financial relationships that could be construed as a potential conflict of interest.
The handling editor declared a shared affiliation, though no other collaboration, with one of the authors JH at the time of the review. The reviewer MM declared a shared affiliation, with no collaboration, with one of the authors, JH, to the handling editor at the time of the review.
All claims expressed in this article are solely those of the authors and do not necessarily represent those of their affiliated organizations, or those of the publisher, the editors and the reviewers. Any product that may be evaluated in this article, or claim that may be made by its manufacturer, is not guaranteed or endorsed by the publisher.
The Supplementary Material for this article can be found online at: https://www.frontiersin.org/articles/10.3389/fnuen.2022.1054288/full#supplementary-material
Anderson, G. M. (1976). Error propagation by the Monte Carlo method in geochemical calculations. Geochim. Cosmochim. Acta 40 (12), 1533–1538. doi:10.1016/0016-7037(76)90092-2
ASTME (2019). Standard practice for determining average grain size using electron backscatter diffraction (EBSD) in fully recrystallized polycrystalline, 13. West Conshohocken, PA.
Baum, E. M., Ernesti, M. C., Knox, H. D., Miller, T. R., Watson, A. M., and Travis, S. D. (2009). Nuclides and isotopes chart of the nuclides. 7th ed. Schenectady, NY: Knolls Atomic Power Laboratory.
Beausoleil, G. L., Povirk, G. L., and Curnutt, B. J. (2020). A revised capsule design for the accelerated testing of advanced reactor fuels. Nucl. Technol. [Internet] 206 (3), 444–457. doi:10.1080/00295450.2019.1631052
Bess, J. D., Woolstenhulme, N. E., Jensen, C. B., Parry, J. R., and Hill, C. M. (2019). Nuclear characterization of a general-purpose instrumentation and materials testing location in TREAT. Ann Nucl Energy 124, 270–294. [Internet]. Available at: https://www.sciencedirect.com/science/article/pii/S0306454918305371.
Besson, J., Blum, P. L., and Laugier, J. (1965). Sur l’existence d’une transformation directe α → γ dans l’uranium disperse dans un milieu inerte. J. Nucl. Mater. 16 (1), 74–75. doi:10.1016/0022-3115(65)90095-4
Bleiberg, M. L., Eichenberg, J. D., Fillnow, R. H., and Jones, L. J. (2019). Development and properties of uranium-base alloys corrosion resistant in high temperature water. Part IV. Radiation Stability Of Uranium-Base Alloys. Pittsburgh, PA: Westinghouse Electric Company.
Chakraborty, S., Choudhuri, G., Banerjee, J., Agarwal, R., Khan, K. B., and Kumar, A. (2015). Micro-structural study and Rietveld analysis of fast reactor fuels: U–Mo fuels. J. Nucl. Mater. 467, 618–627. doi:10.1016/j.jnucmat.2015.09.055
Cheniour, A., Pastore, G., Harp, J. M., Petrie, C. M., and Capps, N. A. (2022). Application of BISON to UO2 MiniFuel fission gas release analysis. J. Nucl. Mater. 565, 153686. doi:10.1016/j.jnucmat.2022.153686
Creasy, J. T. (2012). Thermal Properties of Uranium-Molybdenum alloys: Phase decomposition effects of heat treatments. College Station, TX: Texas A & M University.
Dwight, A. E. (1960). The uranium-molybdenum equilibrium diagram below 900°C. J. Nucl. Mater. 2 (1), 81–87. doi:10.1016/0022-3115(60)90028-3
Field, K. G., McDuffee, J. L., Geringer, J. W., Petrie, C. M., and Katoh, Y. (2019). Evaluation of the continuous dilatometer method of silicon carbide thermometry for passive irradiation temperature determination. Nucl. Instrum. Methods Phys. Res. B 445, 46–56. doi:10.1016/j.nimb.2019.02.022
Frazier, W. E., Hu, S., Burkes, D. E., and Beeler, B. W. (2019). A Monte Carlo model of irradiation-induced recrystallization in polycrystalline UMo fuels. J. Nucl. Mater. 524, 164–176. doi:10.1016/j.jnucmat.2019.07.004
Gates, J. E., Bodine, E. G., Bell, J. C., Bauer, A. A., and Calkins, G. D. (2019). Stress-Strain Properties Of Irradiated Uranium-10 W/O Molybdenum.
Greenquist, I., Cunningham, K. M., Hu, J., Powers, J. J., and Crawford, D. C. (2021). Development of a U-19Pu-10Zr fuel performance benchmark case based on the IFR-1 experiment. J. Nucl. Mater. 553, 152997. doi:10.1016/j.jnucmat.2021.152997
Greenquist, I., Harp, J., and Nelson, A. (2021). U-10Mo MiniFuel disk fuel performance simulations using BISON. Oak Ridge, TN: Oak Ridge National Laboratory.
Greenquist, I., and Powers, J. J. (2021). 25-Pin metallic fuel performance benchmark case based on the EBR-II X430 experiments series. J. Nucl. Mater. 556, 153211. doi:10.1016/j.jnucmat.2021.153211
Harp, J. M., Chichester, H. J. M., and Capriotti, L. (2018). Postirradiation examination results of several metallic fuel alloys and forms from low burnup AFC irradiations. J. Nucl. Mater. 509, 377–391. doi:10.1016/j.jnucmat.2018.07.003
Harp, J. M., Morris, R. N., Petrie, C. M., Burns, J. R., and Terrani, K. A. (2021). Postirradiation examination from separate effects irradiation testing of uranium nitride kernels and coated particles. J. Nucl. Mater. 544, 152696. doi:10.1016/j.jnucmat.2020.152696
Hofman, G. L., Meyer, M. K., and Ray, A. E. (1998). Design of high density gamma-phase uranium alloys for LEU dispersion fuel applications. Argonne, IL. [Internet]Available at: https://www.osti.gov/biblio/11060.
Hu, S., and Beeler, B. (2021). Gas bubble evolution in polycrystalline UMo fuels under elastic-plastic deformation: A phase-field model with crystal-plasticity. Front. Mater 8. doi:10.3389/fmats.2021.682667
Hu, S., Burkes, D., Lavender, C. A., and Joshi, V. (2016). Effect of grain morphology on gas bubble swelling in UMo fuels – a 3D microstructure dependent Booth model. J. Nucl. Mater. 480, 323–331. doi:10.1016/j.jnucmat.2016.08.038
Kautz, E. J., Shahrezaei, S., Athon, M., Frank, M., Schemer-kohrn, A., Soulami, A., et al. (2021). Evaluating the microstructure and origin of nonmetallic inclusions in as-cast U-10Mo fuel. J. Nucl. Mater. 554, 152949. doi:10.1016/j.jnucmat.2021.152949
Kim, Y. S., Hofman, G. L., and Cheon, J. S. (2013). Recrystallization and fission-gas-bubble swelling of U–Mo fuel. J. Nucl. Mater. 436 (1), 14–22. doi:10.1016/j.jnucmat.2013.01.291
Kim, Y. S., and Hofman, G. L. (2011). Fission product induced swelling of U–Mo alloy fuel. J. Nucl. Mater. 419 (1), 291–301. doi:10.1016/j.jnucmat.2011.08.018
Kittel, J. H., Frost, B. R. T., Mustelier, J. P., Bagley, K. Q., Crittenden, G. C., and Van Dievoet, J. (1993). History of fast reactor fuel development. J. Nucl. Mater. 204, 1–13. doi:10.1016/0022-3115(93)90193-3
Kittler, J., and Illingworth, J. (1985). On threshold selection using clustering criteria. IEEE Trans. Syst. Man. CybernSMC- 15 (5), 652–655. doi:10.1109/tsmc.1985.6313443
Leenaers, A., Van den Berghe, S., Koonen, E., Jarousse, C., Huet, F., Trotabas, M., et al. (2004). Post-irradiation examination of uranium–7wt% molybdenum atomized dispersion fuel. J. Nucl. Mater. 335 (1), 39–47. doi:10.1016/j.jnucmat.2004.07.004
Lu, Y., Jiang, Z., Li, L., Wang, C., and Liu, X. (2021). Calculation of steady-state dynamical phase diagram in U-Mo binary system under irradiation. J. Nucl. Mater. 544, 152698. doi:10.1016/j.jnucmat.2020.152698
May, G. H. (1962). The annealing of a quenched uranium-5 at % molybdenum alloy. J. Nucl. Materials1 7 (1), 72–84. doi:10.1016/0022-3115(62)90195-2
McCusker, L. B., Von Dreele, R. B., Cox, D. E., Louër, D., and Scardi, P. (1999). Rietveld refinement guidelines. J. Appl. Crystallogr. 32 (1), 36–50. doi:10.1107/s0021889898009856
McKinney, C., Seibert, R., Helmreich, G., Aitkaliyeva, A., and Terrani, K. (2020). Three-dimensional bubble reconstruction in high burnup UO2. J. Nucl. Mater. 532, 152053. doi:10.1016/j.jnucmat.2020.152053
Meyer, M. K., Gan, J., Jue, J. F., Keiser, D. D., Perez, E., Robinson, A., et al. (2014). Irradiation performance of u-mo monolithic fuel. Nucl. Eng. Technol. 46 (2), 169–182. doi:10.5516/net.07.2014.706
Mueller, M. H., Hitterman, R. L., and Knott, H. W. (1962). The atomic position parameter in alpha uranium - room temperature and above. Acta Crystallogr. 15 (4), 421–422. doi:10.1107/s0365110x62001024
Nelson, A. T., and Demkowicz, P. (2020). “5 - other power reactor fuels,” in Piro MHABTA in NFCWoodhead publishing series in energy (Woodhead Publishing), 215–247. doi:10.1016/B978-0-08-102571-0.00006-9
Neogy, S., Saify, M. T., Jha, S. K., Srivastava, D., Hussain, M. M., Dey, G. K., et al. (2012). Microstructural study of gamma phase stability in U–9wt.% Mo alloy. J. Nucl. Mater. 422 (1), 77–85. doi:10.1016/j.jnucmat.2011.12.005
Newell, R., Mehta, A., Keiser, D. D., and Sohn, Y. (2020). Phase reversion kinetics of thermally decomposed (α + γ′) phases to γ-phase in U – 10 wt% Mo alloy. J. Nucl. Mater. 530, 151983. doi:10.1016/j.jnucmat.2019.151983
Newell, R., Park, Y., Mehta, A., Keiser, D., and Sohn, Y. (2017). Mechanical properties examined by nanoindentation for selected phases relevant to the development of monolithic uranium-molybdenum metallic fuels. J. Nucl. Mater. 487, 443–452. doi:10.1016/j.jnucmat.2017.02.018
Ozaltun, H., Shen, H., and Medvedev, P. (2011). Numerical simulation for mechanical behavior of U10Mo monolithic miniplates for research and test reactors, 311–325.
Pahl, R. G., Wisner, R. S., Billone, M. C., and Hofman, G. L. (1990). Steady-state irradiation testing of U-Pu-Zr fuel to >18% burnup. In International fast reactor safety meeting. UT: Snowbird.
Petrie, C. M., Burns, J. R., Morris, R. N., Smith, K. R., Le Coq, A. G., and Terrani, K. A. (2022). Irradiation of miniature fuel specimens in the high flux isotope reactor.
Petrie, C. M., Burns, J. R., Raftery, A. M., Nelson, A. T., and Terrani, K. A. (2019). Separate effects irradiation testing of miniature fuel specimens. J. Nucl. Mater. 526, 151783. doi:10.1016/j.jnucmat.2019.151783
Raftery, A. M., Morris, R. N., Smith, K. R., Helmreich, G. W., and Nelson, A. T. (2018). Development of a characterization methodology for post-irradiation examination of miniature fuel specimens. Oak Ridge, TN.
Rest, J. (2005). A model for the effect of the progression of irradiation-induced recrystallization from initiation to completion on swelling of UO2 and U–10Mo nuclear fuels. J. Nucl. Mater. 346 (2), 226–232. doi:10.1016/j.jnucmat.2005.06.012
Rest, J., Kim, Y. S., Hofman, G. L., Meyer, M. K., and Hayes, S. L. (2006). U-Mo fuels handbook. Version 1.0. Argonne, IL. [Internet]Available at: https://www.osti.gov/biblio/1335128.
Schappel, D., Brown, N. R., and Terrani, K. A. (2020). Modeling reactivity insertion experiments of TRISO particles in NSRR using BISON. J. Nucl. Mater. 530, 151965. doi:10.1016/j.jnucmat.2019.151965
Smirnova, D. E., Kuksin, A. Y., Starikov, S. V., and Stegailov, V. V. (2015). Atomistic modeling of the self-diffusion in γ-U and γ-U-Mo. Phys. Metals Metallogr. 116 (5), 445–455. doi:10.1134/s0031918x1503014x
Terrani, K. A., Capps, N. A., Kerr, M. J., Back, C. A., Nelson, A. T., Wirth, B. D., et al. (2020). Accelerating nuclear fuel development and qualification: Modeling and simulation integrated with separate-effects testing. J. Nucl. Mater. 539, 152267. doi:10.1016/j.jnucmat.2020.152267
Wadell, H. (1932). Volume, shape, and roundness of rock particles. J. Geol. 40 (5), 443–451. doi:10.1086/623964
Waldron, M. B., Burnett, R. S., and Pugh, S. F. (1958). The mechanical properties of uranium-molybdenum alloys. Berkshire: Harwell.
Walters, L. C., Seidel, B. R., and Kittel, J. H. (1984). Performance of metallic fuels and blankets in liquid-metal fast breeder reactors. Nucl. Technol. 65 (2), 179–231. doi:10.13182/nt84-a33408
Weber, J. W. (1963). Fission gas yield in uranium metal. J. Nucl. Mater. 10 (1), 67–69. doi:10.1016/0022-3115(63)90119-3
Keywords: U-10Mo, nuclear fuel, PIE, HFIR, swelling, pre-irradiation characterization, bison, post-irradiation characterization
Citation: Doyle P, Massey C, Richardson D, Greenquist I, Seibert R, Helmreich G, Ulrich T, Gallagher R, Godsey K, Fielding R, Nelson AT and Harp J (2023) Accelerated fission rate irradiation design, pre-irradiation characterization, and adaptation of conventional PIE methods for U-10Mo and U-17Mo. Front. Nucl. Eng. 1:1054288. doi: 10.3389/fnuen.2022.1054288
Received: 26 September 2022; Accepted: 13 December 2022;
Published: 09 January 2023.
Edited by:
Robert Allen Roach, Idaho National Laboratory, United StatesReviewed by:
Lionel Desgranges, Commissariat à l'Energie Atomique et aux Energies Alternatives, FranceCopyright © 2023 Doyle, Massey, Richardson, Greenquist, Seibert, Helmreich, Ulrich, Gallagher, Godsey, Fielding, Nelson and Harp. This is an open-access article distributed under the terms of the Creative Commons Attribution License (CC BY). The use, distribution or reproduction in other forums is permitted, provided the original author(s) and the copyright owner(s) are credited and that the original publication in this journal is cited, in accordance with accepted academic practice. No use, distribution or reproduction is permitted which does not comply with these terms.
*Correspondence: Peter Doyle, ZG95bGVwakBvcm5sLmdvdg==
Disclaimer: All claims expressed in this article are solely those of the authors and do not necessarily represent those of their affiliated organizations, or those of the publisher, the editors and the reviewers. Any product that may be evaluated in this article or claim that may be made by its manufacturer is not guaranteed or endorsed by the publisher.
Research integrity at Frontiers
Learn more about the work of our research integrity team to safeguard the quality of each article we publish.