 Luciana Marcal Ravaglia1
 Paola Dias de Oliveira
 Ulrike Holzgrabe
 Glaucia Braz Alcantara
94% of researchers rate our articles as excellent or good
Learn more about the work of our research integrity team to safeguard the quality of each article we publish.
Find out more
MINI REVIEW article
Front. Nat. Prod., 25 June 2024
Sec. Structural and Stereochemical Analysis
Volume 3 - 2024 | https://doi.org/10.3389/fntpr.2024.1416195
This article is part of the Research TopicNMR insights into Natural Product ChemistryView all 6 articles
NMR (Nuclear Magnetic Resonance) spectroscopy is a well-established technique for elucidating the structure and composition of Natural Products (NP). However, while NMR spectra offer qualitative insights, there is often a growing demand within the NP research community for quantitative analysis using NMR techniques. Unfortunately, this demand is sometimes met with misconceptions and lacks the methodological rigor typically associated with analytical procedures, particularly concerning validation and mandatory adjustments of quantitative NMR (qNMR) parameters. Therefore, this minireview highlights the practical approaches concerning preparation and validation for qNMR analyses of plant extracts. Specifically, we provide a concise protocol detailing experimental settings crucial for ensuring the accuracy and reliability of quantitative measurements. It is noteworthy that such guidance is often absent in existing literature, and our minireview wants to bridge this gap by offering clear methodological recommendations.
Quantitative Nuclear Magnetic Resonance (qNMR) is a primary method of measurement for quantifying substances (King, 2000a; King, 2000b; Malz and Jancke, 2005) and has been increasingly utilized over the years. Concerning the application of qNMR in organic compounds quantification, 1H, 31P, 19F, and 13C nuclei are widely used, and the definition of experimental NMR parameters is beyond the lab routine acquisition of NMR spectra. In the Natural Products (NP) field, qNMR applications usually cover both target metabolomics (Ramos et al., 2019; Rebiai et al., 2022) and determination of the content of bioactive compounds (Yu et al., 2020; Zhao et al., 2022), with quantities of substances based on the mass of dried plant extract (mg/g of dried extract) or based on the mass of the analyzed plant material (mg/g of plant).
Considering a recent search on ScienceDirect online database using different combinations of the keywords “qNMR”, “plant”, “natural products”, “quantitative NMR”, and “qHNMR”, the results revealed that the majority of papers reports some of the NMR parameters important for quantitative analysis, such as acquisition time and relaxation delay. These two parameters are extremely important for a quantitative analysis using NMR spectroscopy. It is mandatory to use sufficiently high acquisition time and relaxation delay to guarantee the complete longitudinal relaxation (T1) of the nuclei which are responsible for the NMR signals selected for the quantification. However, most of the papers found in the literature do not report either T1 estimation, usually performed by the inversion-recovery experiment, or validation data to increase the reliability of the results. Thereby, the data bank search demonstrates the gap between the expectation of applying an NMR quantification method and obtaining it adequately, indicating the importance of a joint approach to approximate the quantification expectations of NP researchers with the language of the NMR spectroscopists. This joint approach can facilitate the development of projects involving qNMR and NP, allowing to achieve more reliable results, showing the required analytical rigor, to make better discussions and to publish paper with excellent quality, such as publication of Pauli et al., 2005; Pauli et al., 2012; Thapa et al., 2022.
Therefore, this minireview aims to bring some practical details to perform the 1H qNMR method in NP samples, including sampling plants, extraction preparation, qNMR parameter adjustments, and validation. In addition, this minireview brings a brief protocol for helping NP researchers to organize their experimental designs for application of qNMR in their NP works. Subsequently, we shall elucidate critical aspects frequently overlooked in scientific papers yet of paramount significance for starting a qNMR study.
Sampling approach for qNMR investigation in Natural Products typically follows the same criteria as sampling for metabolomic studies, among them: 1) sample acquisition, involving the collection of plants in their natural state followed by immediate cryogenic freezing in liquid nitrogen (Salem et al., 2020), or the acquisition of plant material, particularly in the case of studies involving commercial samples, such as herbal medicines; 2) statistical representativeness, considering the balance between the number of analytical and biological replicates; 3) analytical rigor in the weighing of material for extract preparation, as well as in processes such as grinding/pulverization of the plant material, among others. In all these cases, the decision on whether plants are processed in natura or after drying depends on the specific objectives of the study. This multifaceted decision-making process ensures that the sampling strategy aligns with the research proposal and optimally addresses the analytical and biological aspects inherent in qNMR investigations in NP.
In this minireview, we aim to raise a specific inquiry regarding sample representativeness, as it is common to observe analyses conducted on pooled individuals in qNMR studies applied to NP area (Chauthe et al., 2012; Tan et al., 2020). Depending on the research objectives, sampling that aggregates diverse individuals may indeed be a good strategy, resulting in a reduced number of analytical replicates, because biological diversity is reduced into a pooled sample. Conversely, these practices are not observed in studies with other types of samples out of NP area, such as in metabolomics including plasma/serum or urine analyses, where samples from various individuals can never be combined to present results for the population studied. Regarding this sampling difference, it seems provocative to consider that the use of pooled samples in the NP area reduces the sampling Universe too much and, whenever possible, it would be interesting to avoid it.
In this context, it appears more logical that in NP studies, quantification of the analyte in each biological replicate is performed. This approach facilitates the demonstration of sample variability among the studied groups and, ultimately, allows for the presentation of statistical significance for the identified differences/similarities. Thus, an effective sampling should encompass diverse individuals (biological replicates) and some analytical replicates for each individual (different extracts/spectra for the same specimen). This comprehensive approach ensures a robust evaluation of both the biological and analytical variability within the study, enabling a more detailed interpretation of the results obtained.
Obtaining plant extracts is crucial to access the plant material composition for quantification of the components of interest. It is important to decide which solvent or solvent system is suitable for each specific case, as NP researchers well know (Deborde et al., 2019; Abubakar and Haque, 2020; Verpoorte et al., 2022; Bitwell et al., 2023). The importance of solvent choice is because signal position might change depending on the solvent. Additionally, some solvents could improve extraction and dissolve the extracted chemicals better.
For quantitative purposes, we must consider two different scenarios to present the results: 1) based on the mass of dried extract, or 2) based on the mass of the analyzed plant. In both cases, it may be more effective to use a small mass of the plant (between 50 and 200 mg) for testing. This amount is suitable for obtaining an extract that is completely soluble in 600–700 µL of deuterated solvent for qNMR analyses. However, the potential effect of heterogeneity in the distribution of metabolites within the plant when such a small sample is analyzed might lead to biased results. Therefore, it is crucial to start with a homogeneous plant sample. This can be achieved by pooling the studied plant tissue and ensuring the material is ground, finely divided, or even sieved when possible (Deborde et al., 2019; Ramos et al., 2019). In large extracts (made from a greater quantity of plants), only a small portion can be satisfactorily solubilized, which is far from the optimal strategy. In addition, to work with a large plant extract with the intention of resuspending a small portion of the extract can be tricky. The solid material formed during the freeze-drying processes of a large liquid extract can be non-uniform due to differential deposition of the material, besides the texture of the extract may hinder the effective weighing of the material. In this case, it is extremely important to completely homogenize the dried extract before resuspending it.
If the goal is to express the quantification of the substance based on the mass of the analyzed plant (e.g., mg of the analyte/g of plant) and not based on the mass of dried extract, exhaustive extraction is required (Martins et al., 2016; Owczarek et al., 2019). In practice, successive extractions should be performed and combined before drying (which can be done in a fume hood, using gaseous N2, or by freeze-drying, depending on the case). The use of a rotary evaporator can be also an alternative, especially when a large amount of extract is prepared.
A tip for obtaining exhaustive extraction is to perform a pilot with a minimum of seven consecutive extractions without combining the material. 1H NMR spectra of each resuspended fraction should be measured to determine the last sequential fraction that no longer shows the analyte signals. In practice, to determine the number of sequential extracts needed to complete extraction of the analyte from the plant material, it would be interesting to consider the first fraction without it. Based on the pilot experiment, it is recommended to pool all the sequential fractions before evaporating the solvent when the final experiment is accomplished. The combined extract will contain the total amount of the analyte (or of the mixture of analytes, when applicable) in the portion of plant analyzed (qNMR results, in this case, can be expressed as mg of each analyte per g of plant).
Another inevitable point, especially in exhaustive extractions, although also important in a single extraction, is the need to check if the final combined extract can be dissolved in the recommended deuterated solvent volume (∼600 µL). The presence of insoluble material can compromise the presented result of analyte mass per plant mass. Additionally, it is recommended that the extract must be dissolved in a slightly larger volume (∼700 µL) of deuterated solvent, followed by centrifugation to ensure the deposition of any suspended particulate material. After that, the resuspended solution must be transferred with a slightly smaller volume (∼600 µL) to the NMR tube. However, in quantitative calculations, never forget to consider the total volume of the resuspended solution when expressing in mass (g) rather than molar concentration (mmol/L)!
In the pilot experiment stage, it is important to remember to test the stability of the analyte in solution during the time required for the analyses. It is usual to prepare a batch of samples and it is important to remember that the NMR acquisitions are made one by one. A 1H NMR experiment acquired a few hours after sample preparation can reveal whether the conditions are adequate (solvent choice for resuspension, for example,), as well as the permissible waiting time between extract resuspension and the beginning of the acquisitions.
Even though 1H and 13C nuclei are usually common in NP samples, the choice of the quantifiable nucleus depends on the NMR sensitivity and the amount of the interested substance in the plant extract. For this reason, 1H qNMR is more common and more applicable in NP studies (Gödecke et al., 2013). Herein, all discussions will be based on 1H qNMR analyses. Another important matter is to know undoubtedly the complete NMR spectral assignment of the analyte to select a free and non-overlapped quantifiable 1H NMR signal (see selectivity and specificity, item 2.4).
Thereafter, it is essential to define which qNMR method to use (Schönberger et al., 2023): internal calibration (a standard substance together the sample, inside the NMR tube, with the application of the qNMR equation) (Westwood et al., 2019; Choi et al., 2021; Solovyev et al., 2021; Wang et al., 2021) or external calibration (calibration curve or electronic methods). Considering that the NP samples have a highly overlapped 1H NMR spectrum, it is sometimes challenging to find an internal standard with quantifiable 1H NMR signal fitted in a free spectral region. On the other hand, external calibration by a calibration curve with different analyte concentrations has been less used in recent papers (Choi et al., 2021; Nishizaki et al., 2021). Thus, electronic methods are important alternatives, such as pulse length–based concentration determination (PULCON) (Monakhova et al., 2014; Monakhova et al., 2015). PULCON is also referred as ERETIC2 by Bruker company. In fact, ERETIC2 is an electronic calibration that functions as an external standard method applying PULCON (Paniagua-Vega et al., 2019; Parra-Naranjo et al., 2022). Therefore, the PULCON method is usually desirable for qNMR determinations in complex matrices, such as NP samples. For more details about PULCON (or ERETIC2, in a Bruker jargon/language), please see Burton et al., 2005; Wider and Dreier, 2006; Cullen et al., 2013; Garrido and Carvalho, 2015; Giraudeau et al., 2014; Wang et al., 2021.
The longitudinal relaxation (T1) for the interested signal is an extremely important NMR parameter in a quantitative study. It is indispensable to determine the 7*T1 (seven times the longitudinal relaxation time) for the quantifiable 1H NMR signal, since quantitative NMR parameters depend on 99.93% of recovery of magnetization (at least) between the scans (Wang et al., 2023). Ideally, the T1 estimation experiment using inversion-recovery pulse sequence should be performed using the real samples in different molar concentrations (e.g., concentrated and diluted samples prepared from the plant extract resuspended in the chosen deuterated solvent), because the T1 time the different protons in one compound can differ; this holds also true for the T1 of the same proton measured in different solvents and different concentrations. Obviously, acquisition time + relaxation delay ≥7*T1 is a sine-qua-non condition for all qNMR studies. However, how to decide the distribution of 7*T1 in acquisition time and relaxation delay? One point of view is to guarantee the complete FID decay to obtain a good spectral resolution. On the other hand, FID extremely long includes noise in the processed spectra, reducing the signal-to-noise (S/N) ratio. Therefore, the best cost-benefit can be found about 2–4s for 1H nucleus (Malz and Jancke, 2005; Bharti and Roy, 2012), the remaining time to complete 7*T1 depends on the relaxation delay, in most of the observed studies (Wang et al., 2023).
Concerning the choice of the pulse sequence as a fundamental part in qNMR method development, it is important to avoid pulse sequence for solvent signal suppression whenever is possible. Common solvent suppression techniques, such as presaturation, are not advisable in quantitative studies because of their lack of frequency selectivity, which can cause a partial suppression of the interested signal (Maiwald et al., 2008). However, there are more selective suppression methods available in two main categories of experiments: those which selectively eliminate the water signal, and those which selectively excite or refocus the signals of interest (Giraudeau et al., 2015).
To ensure accurate measurements in 1H qNMR, it is essential to perform a careful selection of integrals of both the analyte and the standard signals. This choice aims to ensure that the chosen integrals are free from interference (Table 1) (Bharti and Roy, 2012; Westwood et al., 2019). Common interferences include 13C satellite signals from adjacent integrals, low-concentration impurities, and tautomer signals. Additionally, 13C satellites can decrease quantification accuracy in complex matrices due to the risk of overlapping signals. An effective approach to identify and prevent this interference is decoupling of 13C satellites, representing one of the simplest strategies in this context (Bahadoor et al., 2021). 1H-13C-decoupled NMR pulse sequence (for example, zgig pulse sequence (Bruker language)) usually is an excellent option in complex matrices to avoid the 1H-13C satellites of other signals being overlapped with those interested (Pauli et al., 2012). Besides, the integral of the signal is centered in one single signal (without satellites) when 13C-decoupled pulse sequence is employed in 1H qNMR. In time, it is important to note that qNMR measurements are performed without NMR tube rotation, to avoid spinning side bands due to rotation, which could impair the measurement of the signal integral.
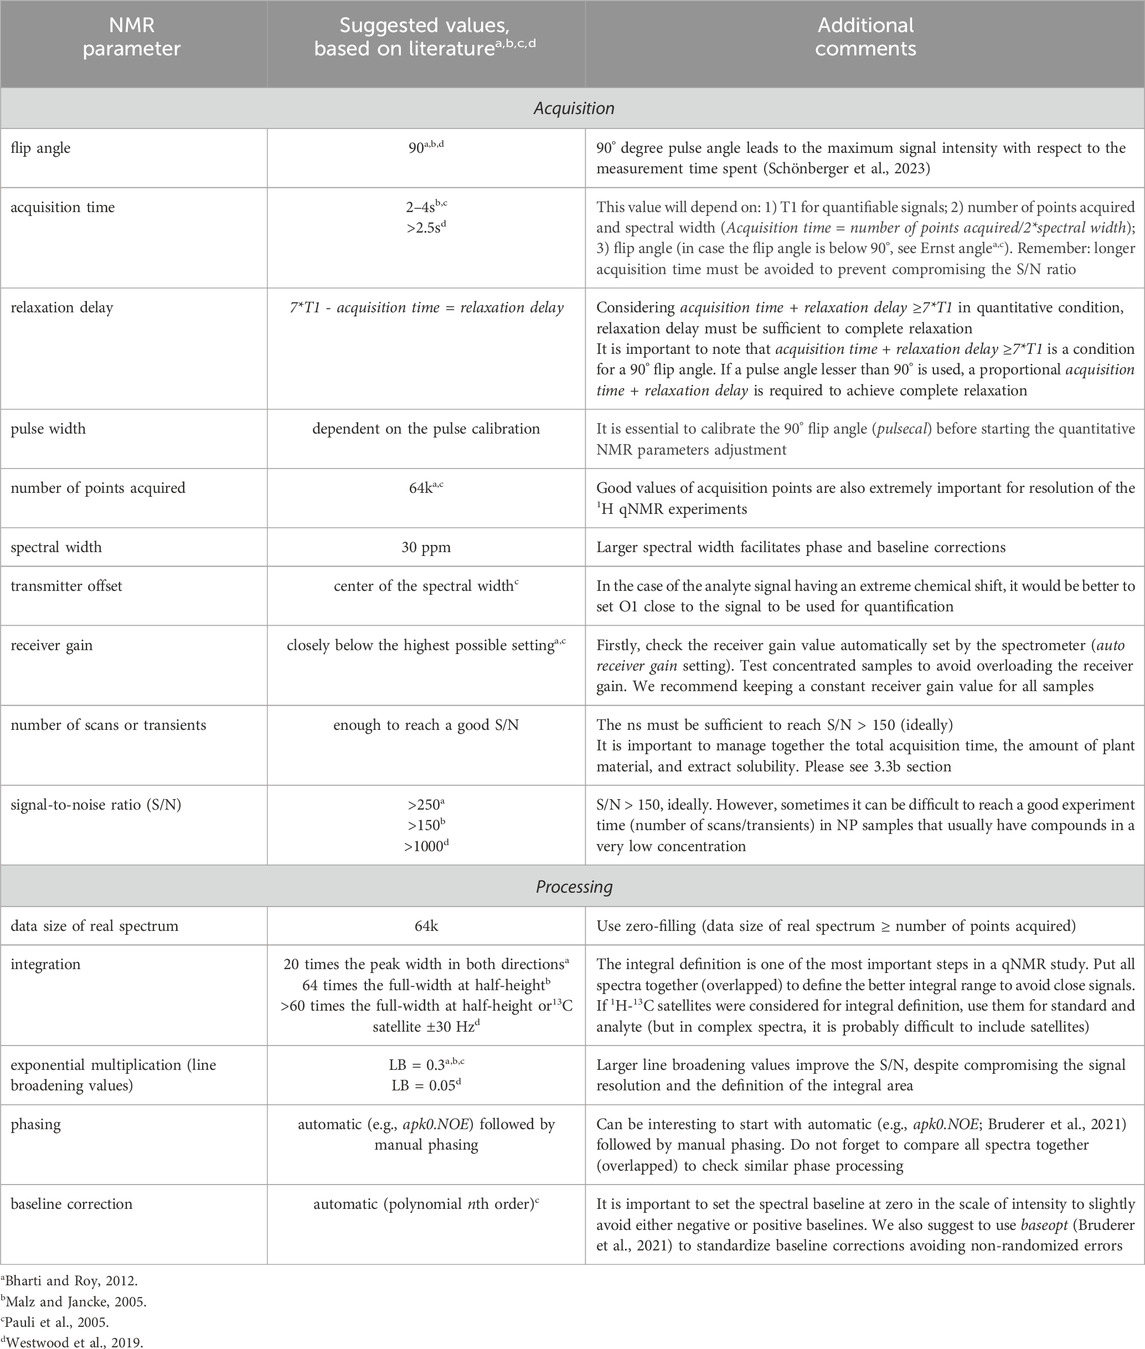
Table 1. Some suggested 1H qNMR parameters based on important reviews on the literature (Malz and Jancke, 2005; Pauli et al., 2005; Bharti and Roy, 2012; Westwood et al., 2019) for spectral acquisition and processing in organic compounds.
Regarding the flip angle definition, the most commonly used flip angles in qNMR are generally in the range between 30° and 90°. However, a 90° degree pulse provides maximum signal strength, improved signal-to-noise (S/N) ratio and reduced artifacts. The use of 90° degree pulse in quantitative NMR leads to the maximum signal intensity with respect to the measurement time spent (Schönberger et al., 2023). For example, in experiments using 30° degree pulses, to double the S/N ratio and achieve the same S/N ratio as with the 90° degree pulse, it would be necessary to perform four times more scans (transients). This makes experiments using 30° degree pulses more time-consuming than those using 90-degree pulses when the S/N ratio is a limiting factor. Additionally, according to the EUROLAB Technical Report 1/2023 (Schönberger et al., 2023), in qNMR, especially when using external calibration, the 90° degree pulse angle is usually preferred since this pulse angle provides the smallest deviation in signal intensity when the angle is not set entirely correctly.
Several other important NMR acquisition parameters adjustments are not individually discussed here, considering that they are similar to all qNMR studies. A useful summary including practical comments can be found in Table 1. Concerning the spectral processing, baseline correction is a particularly sensible step even more intricate in case of complex spectra such as for NP samples. Sometimes, an automatic phase correction (e.g., apk0. noe) followed by manual correction are suitable for obtaining good phased spectra. In all cases, a deep learning-based phase and baseline correction of 1D 1H NMR spectra is recommendable (Bruderer et al., 2021) and a visual inspection of the results obtained (all spectra together, overlapped) is essential.
qNMR results should be validated to guarantee that the quantitative data is reliable. In analytical studies, some essential figures of merit are shown in a quantitative study. Herein, we will discuss the following figures of merit for validation of qNMR method: specificity/selectivity, linearity, trueness/recovery, precision, limits of detection and quantification, and robustness. Useful information about definitions can be found in these references: VIM4 CD, 2021; Schönberger et al., 2023.
Specificity and selectivity: qNMR is intrinsically a specific and selective method since the interested signal for quantification appears in a free and non-overlapped spectral region. Thus, because NP samples often have a large number of overlapping 1H NMR signals, the acquisition of 2D NMR experiments is essential to prove that there are no small signals overlapped to those interested ones. 2D NMR experiments, especially HSQC, TOCSY, and Jres, using a large number of scans are excellent options to prove the selectivity/specificity of an qNMR method.
Linearity: When quantitative NMR parameters are achieved (acquisition time + relaxation delay ≥7*T1), the NMR signal area is directly proportional to the sample concentration. Thus, qNMR is essentially a linear method (Schoenberger, 2019). Nevertheless, considering that linearity is a usual figure of merit shown in current analytical papers, it can be performed in qNMR for NP samples using a concentration range in which the analyte concentration is centered, similar to an calibration curve. Therefore, the linearity assessment can be performed using a standard solution of the analyte at different concentrations (at least five). In this case, a pilot experiment with real samples is essential to determine the concentration range of the standard substance. Interesting papers with the expression of linearity of qNMR method can be found in the literature (Li et al., 2020; Tan et al., 2020; Zhang et al., 2021). The linearity is expressed by the correlation coefficient (R2), which a good result shows R2 ≥ 0.99.
Trueness and Recovery: The closeness of agreement between the average of measured values obtained by replicate measurements and a reference value is extremely important in a qNMR method (as well as any analytical method). Obviously, some deviation from exact value is observed, according to Benedito and co-workers (2018), an uncertainty of up to 5% is acceptable. In fact, the trueness measurement could be measured using some samples from the linearity test, because the concentration from the weighed quantity of the substance is known for these samples. It is important to ensure the trueness is determined using different concentrations (e.g., three different linearity test samples, in triplicate at least). The trueness measurement results normally can be shown using Eq. 1.
In the case of the recovery test, the addition of a reference (the standard analyte) can reveal the range of recovery. In fact, there is a different acceptable range of recovery (Tan et al., 2020), and it is important to know the calculated amount of the analyte before and after reference addition, and the true amount of reference addition, as the following equation:
Where Ax is the calculated amount of analyte after reference addition, A0 is the calculated amount of original analyte before reference addition, As is the true amount of analyte after reference addition.
In the recovery test for plant extraction, the use of exhaustive extraction is the best way to prove the complete recovery of the substance. However, we can also see in the literature the addition of the interested substance (a purchased standard) in the NP samples, performing the extraction and measuring the recovery in these cases (Tan et al., 2020).
Precision: The precision is usually divided in intraday precision (repeatability) and interday precision (intermediate precision). The reproducibility also can be performed to evaluate the influences of aleatory factors (such as instrument, operator, etc), since it is the measure of dispersion of results when different laboratories are performing the measurements. Herein, we will show practical approaches for intra- and interday precision.
The samples for evaluation of intra- and interday precision could be either one plant extract sample (Cao and Hahn, 2023) or one standard sample (Windarsih et al., 2018; Thongphichai et al., 2022) (e.g., samples from linearity test). It is important to carry out 1H qNMR experiments along the day (repeatability/intraday precision) and on non-sequential alternate days (reproducibility/interday precision). One suggestion is to perform five to seven intraday 1H qNMR acquisitions of the same sample. This procedure will also be important to test the stability of the sample (How much time the prepared samples can wait for NMR analysis, for example, in an autosampler?). For reproducibility, plant extract samples could be measured by running the experiments once a day for five non-consecutive days (Owczarek et al., 2019), e.g., 1st, 2nd, 4th, 7th, and 10th days. Precision results could be expressed as relative standard deviations (RSD). RSD up to 3.6% has been reported on plant extracts (Giraudeau, 2017).
Limit of detection (LOD) and limit of quantification (LOQ): LOD and LOQ are usually found by performing replicates of blank samples (without the substance of interest). Three to ten replicates could be performed. Thus, only the solvent is added in the NMR tube and the optimized 1H qNMR experiments are carried out. LOD and LOQ values are found using the Eqs 3, 4, respectively (Owczarek et al., 2019):
Where XB and σB are the mean and standard deviation of blank measurements. XB and σB were determined using free regions of the spectrum, similar in size to the integral regions of the appropriate analyte.
The working range of an NMR method usually starts from the LOQ (lower limit) to the analyte solubility (upper limit) for an analyte in a given matrix (Schönberger et al., 2023).
Robustness: The robustness of the method is assessed by changing some NMR parameters and checking the differences found in comparison with the optimized parameters. Among NMR parameters included in robustness, one possibility is to evaluate two levels of number of scans, relaxation delay, acquisition time, and spectral width (Owczarek et al., 2019; Tan et al., 2020), although other acquisition and processing NMR parameters could be also evaluated (Benedito et al., 2018). Contrast values should be calculated and a confidence interval (95%) must be determined. qNMR is characterized by a high degree of robustness.
A qNMR work in the NP area usually involves important steps aiming for a successful performance. Here, you can see a brief protocol which is summarized in Figure 1 and described below.
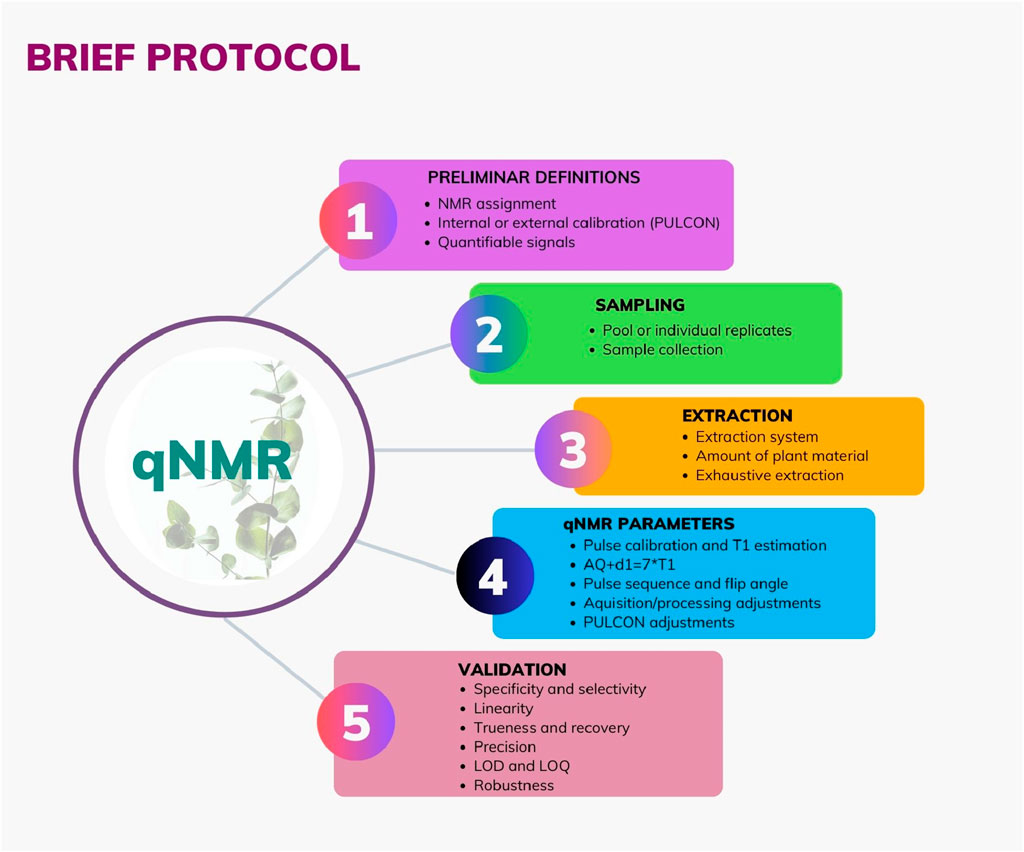
Figure 1. Graphical brief protocol in a qNMR study for Natural Products samples: sampling, extraction, qNMR parameter, and validation.
a) Accomplish the complete 1H NMR assignment of the analyte.
b) Select a free and non-overlapped quantifiable 1H NMR signal of the substance of interest and define the integral regions. Check signal purity by 2D NMR experiments. Sometimes, the overlapped signals might be influenced by the solvent or solvent mixture in a way that the signals do not overlap anymore (Beyer et al., 2010).
c) Select the qNMR method: internal standard or external standard (calibration curve or PULCON). The PULCON method is an experimental qNMR technique used for the quantification of analytes through an electronic reference signal applied during acquisition. ERETIC2 is a Bruker’s nomenclature for the PULCON method. Herein, we focus on PULCON (Burton et al., 2005; Garrido and Carvalho, 2015; Choi et al., 2022).
d) Select a suitable calibration standard (Malz, 2008; Westwood et al., 2019).
a) Decide between a pool or individual (biological) replicates.
b) Collect samples for all extracts: quantitative analysis, as well as larger extracts (for 2D NMR analysis) and additional extracts for all upcoming tests (pilot experiments).
a) Define the extraction system (How the sample is going to be pulverized? Which solvent is going to be used? The solvent system is going to be a mixture? Is freeze-drying an option?).
b) Test the amount of plant material required for an adequate NMR sample. Balance three important points:
i) the amount of plant material.
ii) the mass of extract obtained and the solubilization in the quantity of deuterated solvent required for analysis.
iii) NMR parameters (e.g., number of scans/transients) to obtain a signal/noise ratio (S/N) suitable for the qNMR study.
c) Decide the type of extraction depending on the expression of the quantities of substances based on the mass of dried plant extract (mg/g of dried extract–one single extraction process) or based on the mass of the analyzed plant material (mg/g of plant–exhaustive extraction).
d) In case of exhaustive extraction: set the number of consecutive extractions.
e) Sample preparation for NMR analysis.
i) Define which deuterated solvent is suitable for extract resuspension (the solvent must solubilize 100% of the analyte and must not overlap its NMR signal).
ii) Define the volume of the solvent (ensure that the entire amount of the analyte is soluble in the resuspension in the same way as it was observed in the exhaustive extraction test. Use at least 700 µL of deuterated solvent to accomplish this.
iii) Centrifuge the resuspended extract to guarantee a limpid solution. After centrifugation, put 600 µL into the NMR tube.
Important: See Table 1 and Supplementary Table S1 (Supplementary Material) for checking all NMR parameters and the list of abbreviations and equivalence for different instruments.
a) Calibrate the pulse width (use pulsecal).
b) Perform the T1 estimation for the nuclei responsible for the interested NMR signals (selected signal of the analyte, the internal/external standard, etc) in different conditions, like using different sample concentrations into the range of the study. Choose the greater value found for T1 and use it in the equation AQ + D1≥ 7*T1 to balance the acquisition time and relaxation delay values simultaneously.
c) Pulse sequence
Consider.
i) Flip angles of 30° or 90° are possible (See Table 1).
ii) 13C decoupling could be of interest to avoid 1H-13C satellites close to analyte signal.
iii) Avoid, whenever possible, solvent suppression pulse sequences (Bharti and Roy, 2012).
d) Define acquisition time value.
Take care of the dependency of acquisition time with number of points acquired and/2*spectral width (Acquisition time = number of points acquired/2*spectral width).
It also depends on the equation AQ + D1≥ 7*T1 (see Table 1 and Supplementary Material).
e) Define relaxation delay value.
Balance acquisition time and relaxation delay to complete relaxation (≥7*T1, for a 90° flip angle).
f) Define a suitable number of scans/transients.
Observe signal/noise and balance the acquisition time for the shortest possible time, references usually cite S/N > 150.
g) Define the number of points acquired and data size of real spectrum values.
For 1H, the number of points acquired is at least 64k to keep good resolution. It is important to use zero filling (number of points acquired = data size of real spectrum, at least).
h) Use a large spectral window.
Large spectral window helps phase and baseline corrections.
i) Define receiver gain value.
Closely below the highest possible setting. It is important to maintain a constant receiver gain value for all samples.
j) Center the O1 frequency (center of the spectral width) close to both quantifiable signal (or signals) and the standard compound (in the case of using an internal standard).
k) Processing parameters (Fourier transform + exponential function (LB = 0.3) + automatic/manual phase correction + automatic baseline correction + chemical shift calibration).
l) In the case of the PULCON method, acquire a 1H qNMR spectrum for the standard substance designated for electronic calibration (employing a solution of known concentration). Use the optimized NMR parameters.
a. Specificity and selectivity
Select a non-overlapped signal; check 2D NMR experiments.
b. Linearity
Use standard solutions of the analyte at different concentrations (at least five concentrations being equidistant). Decide the concentration range based on the pilot with NP real samples.
c. Trueness and recovery
i) For the trueness measurement, use the same samples from linearity (Eq. 1).
ii) For the recovery test, add a known quantity of the analyte in a standard solution with known concentration (Eq. 2).
iii) For the recovery test in plant extraction, the exhaustive extraction is the best way to prove the complete recovery of the substance.
d. Precision
i) For repeatability/intraday precision, acquire five to seven measurements at the same day.
ii) For intermediate precision (interday precision), run experiments once a day for five non-consecutive days.
e. Limits of detection (LOD) and quantification (LOQ)
Prepare blank samples. Use Eqs 3, 4. However, LOD/LOQ are not necessary when the main component is determined. They are required for determination of minor components.
f. Robustness
Define the number of samples and which parameters you would like to vary: pulse sequence, number of scans/transients, receiver gain, number of points acquired, acquisition time, etc.
The quantification of natural product samples using a qNMR method highlights the significance of NMR for this area. This approach extends beyond NMR’s traditional role in structural elucidation and, therefore, requires a set of experimental adjustments responsible for the feasibility of the proposal, providing reliability to the results. Consequently, the application of qNMR to NP samples requires a previously planned experimental design and can only proceed following a thorough validation stage.
Actually, regardless of the nature of the sample, a qNMR work is always an Analytical Chemistry work! Thus, the same rigor as analytical chemists should be maintained, unless researchers are in fact interested in a broader, more qualitative overview, where relative proportion measurements derived from integral comparisons may suffice for the investigation. In these cases, the terminology “qNMR” or “quantitative NMR” should be avoided, and terms like “relative proportion” could prove more apt.
Therefore, this minireview hopes to encourage NP researchers to explore the applications of qNMR in their work in order to strengthen results, increase the impact of publications and, why not, facilitate collaboration with NMR spectroscopists.
LR: Conceptualization, Investigation, Visualization, Writing–original draft, Writing–review and editing. PO: Conceptualization, Investigation, Supervision, Writing–original draft, Writing–review and editing. UH: Visualization, Writing–review and editing. GA: Conceptualization, Funding acquisition, Investigation, Supervision, Writing–original draft, Writing–review and editing.
The author(s) declare that financial support was received for the research, authorship, and/or publication of this article. This study was financed in part by the UFMS and Coordenação de Aperfeiçoamento de Pessoal de Nível Superior–Brazil (CAPES)–Finance Code 001. FUNDECT (71/020.168/2021; 71/038.233/2022; 71/032.446/2022), CNPq (427221/2018-8), and FINEP (0113.0358.00).
We are grateful to Federal University of Mato Grosso do Sul (UFMS); Fundação de Apoio ao Desenvolvimento do Ensino, Ciência e Tecnologia do Estado de Mato Grosso do Sul (FUNDECT-MS); Brazilian Council for Scientific and Technological Development (CNPq) and scholarships, Coordenação de Aperfeiçoamento de Pessoal de Nível Superior–Brazil (CAPES); Financiadora de Estudos e Projetos–Brazil (FINEP) for all support in our research.
The authors declare that the research was conducted in the absence of any commercial or financial relationships that could be construed as a potential conflict of interest.
All claims expressed in this article are solely those of the authors and do not necessarily represent those of their affiliated organizations, or those of the publisher, the editors and the reviewers. Any product that may be evaluated in this article, or claim that may be made by its manufacturer, is not guaranteed or endorsed by the publisher.
The Supplementary Material for this article can be found online at: https://www.frontiersin.org/articles/10.3389/fntpr.2024.1416195/full#supplementary-material
Abubakar, A. R., and Haque, M. (2020). Preparation of medicinal plants: basic extraction and fractionation procedures for experimental purposes. J. Pharm. Bioallied Sci. 12 (1), 1–10. doi:10.4103/jpbs.JPBS_175_19
Bahadoor, A., Brinkmann, A., and Melanson, J. E. (2021). 13C-Satellite decoupling strategies for improving accuracy in quantitative nuclear magnetic resonance. Anal. Chem. 93 (2), 851–858. doi:10.1021/acs.analchem.0c03428
Benedito, L. E. C., Maldaner, A. O., and Oliveira, A. L. (2018). An external reference 1H qNMR method (PULCON) for characterization of high purity cocaine seizures. Anal. Methods. 10, 489–495. doi:10.1039/C7AY02343J
Beyer, T., Schollmayer, C., and Holzgrabe, U. (2010). The role of solvents in the signal separation for quantitative 1H NMR spectroscopy. J. Pharm. Biomed. Anal. 52, 51–58. doi:10.1016/j.jpba.2009.12.007
Bharti, S. K., and Roy, R. (2012). Quantitative 1H NMR spectroscopy. Trac. Trends Anal. Chem. 35, 5–26. doi:10.1016/j.trac.2012.02.007
Bitwell, C., Indra, S., Luke, C., and Kakoma, M. K. (2023). A review of modern and conventional extraction techniques and their applications for extracting phytochemicals from plants. Sci. Afr. 19, e01585. doi:10.1016/j.sciaf.2023.e01585
Bruderer, S., Paruzzo, F., and Bolliger, C. (2021). Deep learning-based phase and baseline correction of 1D 1H NMR spectra. Public bruker white paper. Available at: https://www.bruker.com/en/products-and-solutions/mr/nmr-software/topspin.html (Accessed February 29, 2024).
Burton, I. W., Quilliam, M. A., and Walter, J. A. (2005). Quantitative 1H NMR with external standards: use in preparation of calibration solutions for algal toxins and other natural products. Anal. Chem. 77 (10), 3123–3131. doi:10.1021/ac048385h
Cao, T. Q., and Hahn, D. (2023). Quantification of allantoin in yams (Dioscorea sp.) using a 1H NMR spectroscopic. Method. J. Microbiol. Biotechnol. 33 (5), 662–667. doi:10.4014/jmb.2301.01009
Chauthe, S. K., Sharma, R. J., Aqil, F., Gupta, R. C., and Singh, I. P. (2012). Quantitative NMR: an applicable method for quantitative analysis of medicinal plant extracts and herbal products. Phytochem. Anal. 23 (6), 689–696. doi:10.1002/pca.2375
Choi, H., Kim, S., Jang, H., Kim, H. J., and Choe, S. (2022). Identification of a novel bromoindazole synthetic cannabinoid analogue in seized e-cigarette liquid: ADB-BRINACA. Forensic Sci. Int. 338, 111385. doi:10.1016/j.forsciint.2022.111385
Choi, K., Myoung, S., Seo, Y., and Ahn, S. (2021). Quantitative NMR as a versatile tool for the reference material preparation. Magnetochemistry 7 (1), 15. doi:10.3390/magnetochemistry7010015
Cullen, C. H., Ray, G. J., and Szabo, C. M. (2013). A comparison of quantitative nuclear magnetic resonance methods: internal, external, and electronic referencing. Magn. Reson. Chem. 51, 705–713. doi:10.1002/mrc.4004
Deborde, C., Fontaine, J. X., Jacob, D., Botana, A., Nicaise, V., Richard-Forget, F., et al. (2019). Optimizing 1D 1H-NMR profiling of plant samples for high throughput analysis: extract preparation, standardization, automation and spectra processing. Metabolomics 15, 28. doi:10.1007/s11306-019-1488-3
Garrido, B. C., and Carvalho, L. J. (2015). Nuclear magnetic resonance using electronic referencing: method validation and evaluation of the measurement uncertainties for the quantification of benzoic acid in orange juice. Magn. Reson. Chem. 53, 135–141. doi:10.1002/mrc.4166
Giraudeau, P. (2017). Challenges and perspectives in quantitative NMR. Magn. Reson. Chem. 55, 61–69. doi:10.1002/mrc.4475
Giraudeau, P., Silvestre, V., and Akoka, S. (2015). Optimizing water suppression for quantitative NMR-based metabolomics: a tutorial review. Metabolomics 11, 1041–1055. doi:10.1007/s11306-015-0794-7
Giraudeau, P., Tea, I., Remaud, G. S., and Akoka, S. (2014). Reference and normalization methods: essential tools for the intercomparison of NMR spectra. J. Pharm. Biomed. Anal. 96, 3–16. doi:10.1016/j.jpba.2013.07.020
Gödecke, T., Napolitano, J. G., Rodríguez-Brasco, M. F., Chen, S.-N., Jaki, B. U., Lankin, D. C., et al. (2013). Validation of a generic quantitative 1H NMR method for natural products. Phytochem. Anal. 24 (6), 581–597. doi:10.1002/pca.2436
King, B. (2000a). The practical realization of the traceability of chemical measurements standards. Accred Qual. Assur. 5, 429–436. doi:10.1007/s007690000207
King, B. (2000b). Metrology in chemistry: Part II. Future requirements in Europe. Accred Qual. Assur 5, 266–271. doi:10.1007/s007690000133
Li, Y., Hou, Z., Su, F., Chen, J., Zhang, X., Xu, L., et al. (2020). Quantitative determination and validation of four ketones in salvia miltiorrhiza bunge using quantitative proton nuclear magnetic resonance spectroscopy. Molecules 25, 2043. doi:10.3390/molecules25092043
Maiwald, M., Steinhof, O., Sleigh, C., Bernstein, M., and Hasse, H. (2008). “Quantitative high-resolution online NMR spectroscopy in pharmaceutical reaction and monitoring,” in NMR spectroscopy in pharmaceutical analysis. Editors U. Holzgrabe, I. Waner, and B. Diehl (Oxford, UK: Elsevier), 471–491.
Malz, F. (2008). “Quantitative NMR in the solution state NMR,” in NMR spectroscopy in pharmaceutical analysis. Editors U. Holzgrabe, I. Waner, and B. Diehl (Oxford, UK: Elsevier), 43–62.
Malz, F., and Jancke, H. (2005). Validation of quantitative NMR. J. Pharm. Biomed. Anal. 38, 813–823. doi:10.1016/j.jpba.2005.01.043
Martins, P. M., Thorat, B. N., Lanchote, A. D., and Freitas, L. A. P. (2016). Green extraction of glycosides from Stevia rebaudiana (Bert.) with low solvent consumption: a desirability approach. Resource-Efficient Technol. 2 (4), 247–253. doi:10.1016/j.reffit.2016.11.007
Monakhova, Y. B., Kohl-Himmelseher, M., Kuballa, T., and Lachenmeier, D. W. (2014). Determination of the purity of pharmaceutical reference materials by 1H NMR using the standardless PULCON methodology. J. Pharm. Biomed. Anal. 100, 381–386. doi:10.1016/j.jpba.2014.08.024
Monakhova, Y. B., Lachenmeier, D. W., Kuballa, T., and Mushtakova, S. P. (2015). Standardless multicomponent qNMR analysis of compounds with overlapped resonances based on the combination of ICA and PULCON. Magn. Reason. Chem. 53 (10), 821–828. doi:10.1002/mrc.4275
Nishizaki, Y., Lankin, D. C., Chen, S. N., and Pauli, G. F. (2021). Accurate and precise external calibration enhances the versatility of quantitative NMR (qNMR). Anal. Chem. 93 (5), 2733–2741. doi:10.1021/acs.analchem.0c02967
Owczarek, A., Kłys, A., and Olszewska, M. A. (2019). A validated 1H qNMR method for direct and simultaneous quantification of esculin, fraxin and (-)-epicatechin in Hippocastani cortex. Talanta 15 (192), 263–269. doi:10.1016/j.talanta.2018.09.036
Paniagua-Vega, D., Cavazos-Rocha, N., Huerta-Heredia, A. A., Parra-Naranjo, A., Rivas-Galindo, V. M., Waksman, N., et al. (2019). A validated NMR method for the quantitative determination of rebaudioside A in commercial sweeteners. J. Food Compos. Anal. 79, 134–142. doi:10.1016/j.jfca.2019.02.009
Parra-Naranjo, A., Delgado-Montemayor, C., Salazar-Aranda, R., Castro-Ríos, R., Saucedo, A. L., and Waksman-Minsky, N. (2022). Two ways to achieve the same goal—two validated quantitative NMR strategies for a low-abundance natural product in standardized extracts: the case of hepatodamianol in Turnera diffusa. Molecules 27 (19), 6593. doi:10.3390/molecules27196593
Pauli, G. F., Gödecke, T., Jaki, B. U., and Lankin, D. C. (2012). Quantitative 1HNMR. Development and potential of an analytical method: an update. J. Nat. Prod. 75, 834–851. doi:10.1021/np200993k
Pauli, G. F., Jaki, B. U., and Lankin, D. C. (2005). Quantitative 1H NMR: development and potential of a method for natural products analysis. J. Nat. Prod. 68 (1), 133–149. doi:10.1021/np0497301
Ramos, A. S., Mar, J. M., da Silva, L. S., Acho, L. D. R., Silva, B. J. P., Lima, E. S., et al. (2019). Pedra-ume caá fruit: an Amazon cherry rich in phenolic compounds with antiglycant and antioxidant properties. Int. Food Res. J. 123, 674–683. doi:10.1016/j.foodres.2019.05.042
Rebiai, A., Seghir, B. B., Hemmami, H., Zeghoud, S., Amor, I. B., Kouadri, I., et al. (2022). Quality assessment of medicinal plants via chemometric exploration of quantitative NMR data: a review. Compounds. 2 (2), 163–181. doi:10.3390/compounds2020012
Salem, M. A., Perez de Souza, L., Serag, A., Fernie, A. R., Farag, M. A., Ezzat, S. M., et al. (2020). Metabolomics in the context of plant natural products research: from sample preparation to metabolite analysis. Metabolites 10 (1), 37. doi:10.3390/metabo10010037
Schoenberger, T. (2019). Guideline for qNMR analysis. DWG-NMR-001, ENFSI. Available at: https://enfsi.eu/wp-content/uploads/2017/06/qNMR-Guideline_version001.pdf (Accessed February 29, 2024).
Schönberger, T., Bachmann, R., Gerhardt, N., Panzer, J., Meyer, K., Romoth, M., et al. (2023). Technical report No. 01/2023. Guide to NMR method development and validation – Part 1: identification and quantification. EUROLAB Tech. Rep. Available at: https://www.eurolab.org/pubs-techreports (Accessed May 22, 2024).
Solovyev, P. A., Fauhl-Hassek, C., Riedl, J., Esslinger, S., Bontempo, L., and Camin, F. (2021). NMR spectroscopy in wine authentication: an official control perspective. Compr. Rev. Food Sci. Food Saf. 20 (2), 2040–2062. doi:10.1111/1541-4337.12700
Tan, D. C., Quek, A., Kassim, N. K., Ismail, I. S., and Lee, J. J. (2020). Rapid quantification and validation of biomarker scopoletin in paederia foetida by qNMR and UV-vis for herbal preparation. Molecules 25, 5162. doi:10.3390/molecules25215162
Thapa, P., Kim, H. M., Hong, J.-P., Kim, R., Paudel, S. B., Choi, H., et al. (2022). Absolute quantification of isoflavones in the flowers of Pueraria lobata by qHNMR. Plants 11, 548. doi:10.3390/plants11040548
Thongphichai, W., Uttarawichien, T., Chanvorachote, P., Pitiporn, S., Charoen-Ame, T., Kwankhao, P., et al. (2022). Standardization of the ethanolic extract of Crinum latifolium leaves by two bioactive markers with antiproliferative activity against TGF-β-promoted prostate stromal cells (WPMY-1). BMC Complement. Med. Ther. 22 (1), 139–214. doi:10.1186/s12906-022-03617-x
Verpoorte, R., Kim, H. K., and Choi, Y. H. (2022). Trivialities in metabolomics: artifacts in extraction and analysis. Front. Mol. Biosci. 8, 972190. doi:10.3389/fmolb.2022.972190
VIM4 CD (2021). International vocabulary of Metrology fourth edition – committee draft (VIM4 CD) 11 january 2021. Joint committee for guides in Metrology. Available at: https://www.bipm.org/documents/20126/54295284/VIM4_CD_210111c.pdf (Accessed May 23, 2024).
Wang, T., Liu, Q., Wang, M., Zhou, J., and Yang, M. (2023). Quantitative 1H NMR methodology for purity assay with high accuracy. Accred Qual. Assur 28, 253–260. doi:10.1007/s00769-023-01550-1
Wang, Z. F., You, Y. L., Li, F. F., Kong, W. R., and Wang, S. Q. (2021). Research progress of NMR in natural product quantification. Molecules 26, 6308. doi:10.3390/molecules26206308
Westwood, S., Yamazaki, T., Huang, T., Garrido, B., Ün, I., Zhang, W., et al. (2019). Development and validation of a suite of standards for the purity assignment of organic compounds by quantitative NMR spectroscopy. Metrologia 56, 064001. doi:10.1088/1681-7575/ab45cb
Wider, G., and Dreier, L. (2006). Measuring protein concentrations by NMR spectroscopy. J. Am. Chem. Soc. 128 (8), 2571–2576. doi:10.1021/ja055336t
Windarsih, A., Rohman, A., and Swasono, R. (2018). Application of H-NMR metabolite fingerprinting and chemometrics for the authentication of Curcuma longa adulterated with Curcuma manga. J. Appl. Pharm. Sci. 8, 06. doi:10.7324/JAPS.2018.8610
Yu, Y., Pauli, G., Huang, L., Gan, L.-S., Breemen, R. B. V., Li, D., et al. (2020). Classification of flavonoid metabolomes via data mining and quantification of hydroxyl NMR signals. Anal. Chem. 92 (7), 4954–4962. doi:10.1021/acs.analchem.9b05084
Zhang, Y.-Y., Zhang, J., Zhang, W.-X., Wang, Y., Wang, Y.-H., Yang, Q.-Y., et al. (2021). Quantitative 1H nuclear magnetic resonance method for assessing the purity of dipotassium glycyrrhizinate. Molecules 26 (12), 3549–3611. doi:10.3390/molecules26123549
Keywords: 1H qNMR, qHNMR, quantitative nuclear magnetic resonance, plant extracts, validation, quantification, secondary metabolites
Citation: Ravaglia LM, de Oliveira PD, Holzgrabe U and Alcantara GB (2024) qNMR in natural products: practical approaches. What nobody tells you before starting your qNMR study!. Front. Nat. Produc. 3:1416195. doi: 10.3389/fntpr.2024.1416195
Received: 12 April 2024; Accepted: 30 May 2024;
Published: 25 June 2024.
Edited by:
Alan Diego Conceição Santos, Federal University of Amazonas, BrazilReviewed by:
Aline Oliveira, University of Brasilia, BrazilCopyright © 2024 Ravaglia, de Oliveira, Holzgrabe and Alcantara. This is an open-access article distributed under the terms of the Creative Commons Attribution License (CC BY). The use, distribution or reproduction in other forums is permitted, provided the original author(s) and the copyright owner(s) are credited and that the original publication in this journal is cited, in accordance with accepted academic practice. No use, distribution or reproduction is permitted which does not comply with these terms.
*Correspondence: Glaucia Braz Alcantara, Z2xhdWNpYS5hbGNhbnRhcmFAdWZtcy5icg==
Disclaimer: All claims expressed in this article are solely those of the authors and do not necessarily represent those of their affiliated organizations, or those of the publisher, the editors and the reviewers. Any product that may be evaluated in this article or claim that may be made by its manufacturer is not guaranteed or endorsed by the publisher.
Research integrity at Frontiers
Learn more about the work of our research integrity team to safeguard the quality of each article we publish.