
95% of researchers rate our articles as excellent or good
Learn more about the work of our research integrity team to safeguard the quality of each article we publish.
Find out more
HYPOTHESIS AND THEORY article
Front. Syst. Neurosci. , 22 April 2021
Volume 15 - 2021 | https://doi.org/10.3389/fnsys.2021.641684
This article is part of the Research Topic Cognitive Neurodynamics: Integrating Cognitive Science and Brain Dynamics View all 15 articles
 Robert Kozma1*
 Sanqing Hu2
 Yury Sokolov3Tim Wanger4
 Andreas L. Schulz4
 Marie L. Woldeit4Ana I. Gonçalves4
 Miklós Ruszinkó5,6
 Frank W. Ohl4,7,8*
This work studies the evolution of cortical networks during the transition from escape strategy to avoidance strategy in auditory discrimination learning in Mongolian gerbils trained by the well-established two-way active avoidance learning paradigm. The animals were implanted with electrode arrays centered on the surface of the primary auditory cortex and electrocorticogram (ECoG) recordings were made during performance of an auditory Go/NoGo discrimination task. Our experiments confirm previous results on a sudden behavioral change from the initial naïve state to an avoidance strategy as learning progresses. We employed two causality metrics using Granger Causality (GC) and New Causality (NC) to quantify changes in the causality flow between ECoG channels as the animals switched to avoidance strategy. We found that the number of channel pairs with inverse causal interaction significantly increased after the animal acquired successful discrimination, which indicates structural changes in the cortical networks as a result of learning. A suitable graph-theoretical model is developed to interpret the findings in terms of cortical networks evolving during cognitive state transitions. Structural changes lead to changes in the dynamics of neural populations, which are described as phase transitions in the network graph model with small-world connections. Overall, our findings underscore the importance of functional reorganization in sensory cortical areas as a possible neural contributor to behavioral changes.
There is a growing body of literature on the neural basis of learning and memory formation over various sensory modalities in humans and animals (Goldstone, 1998; Seger and Miller, 2010; Chapuis and Wilson, 2012; Aizenberg and Geffen, 2013). For example, in auditory learning there is ample experimental evidence of learning-induced plasticity in various neuronal structures including primary and higher-order auditory cortex (Eggermont et al., 1983; Weinberger et al., 1984; Ohl and Scheich, 1996; Villa et al., 1998, 1999a; Fritz et al., 2003; Weinberger, 2004, 2007; Plakke et al., 2013; Grosso et al., 2015, 2017; Cambiaghi et al., 2016; Concina et al., 2018), corpus striatum (Znamenskiy and Zador, 2013), and prefrontal cortex (Romanski et al., 1999; Funamizu et al., 2013; Concina et al., 2018). In such neural structures, the responses of single neurons and population of neurons to relevant spectral, temporal, or spectrotemporal features of stimuli undergo changes when these features attain behavioral or cognitive relevance during learning or specific task scenarios (Villa et al., 1999b; Machens et al., 2004; Ohl and Scheich, 2005; Bar-Yosef and Nelken, 2007; Schreiner and Winer, 2007; Rabinowitz et al., 2013; Meyer et al., 2014; Weinberger, 2015).
However, learning is not a singular continuous process that takes an individual from a naïve state to a learned state, rather it constitutes a set of discernible subprocesses that typically take the subject through several distinguishable phases, even for the simplest learning scenarios (Cambiaghi et al., 2016; Deliano et al., 2016). As these phases evolve, stimulus processing in the sensory nervous system may change in association with changes in the cognitive state.
Here we investigate the behavioral state changes and corresponding neuronal changes in the auditory cortex during a standard auditory-cued Go/NoGo task in a shuttle box. The shuttle box Go/NoGo discrimination task is a well-established experimental paradigm to investigate auditory learning (Ohl et al., 1999; Wetzel et al., 2008; Deliano et al., 2009; Happel et al., 2014; Schulz et al., 2016) and the formation of cognitive categories in rodents (Ohl and Scheich, 1997; Wetzel et al., 1998; Ohl et al., 2001, 2003). In this paradigm, the animal is placed in a two-compartment cage (shuttle box) with a little hurdle separating the two compartments. The animal is trained to cross this hurdle in response to a specific auditory signal and to stay in the current compartment in response to another signal, in order to avoid a mild aversive electrical stimulation (“foot shock”) via the floor grid. This is achieved by consequently preceding the foot shock with the acoustic stimulus (to provide the possibility for prediction), and by terminating the shock upon the desired behavioral response, i.e., crossing the hurdle. Previous work has shown that this type of learning is determined by complex behavioral processes, involving at least three different stages that occur in sequence:
1. Conditioning: In the first stage, the animal learns that the sensory stimulus predicts the foot shock. The behavioral process and its underlying mechanisms are akin to Pavlovian conditioning in which a conditioned stimulus (CS) is learned to have predictive power for the occurrence of an unconditioned stimulus (US).
2. Escape Strategy: In the second stage, the animal learns that the aversive effect of the foot shock can in fact be terminated by crossing the hurdle (escape strategy). Here the animal learns that an appropriate behavior can have desirable effects on the reinforcement scenario (e.g., a reduced duration of an aversive event), which is an important element of the classical concept of instrumental or operant conditioning.
3. Avoidance Strategy: In the final stage, the animal learns that the aversive foot shock can be avoided altogether, if it crosses the hurdle fast enough after onset of the sensory signal. In the avoidance phase, the animal acquires a new behavioral strategy by re-evaluating its hitherto existing behavioral strategy (escape) and replacing it by a new one (avoidance).
The transition from the escape to the avoidance strategy represents a behavioral and cognitive state change (Ohl, 2015; Kozma and Freeman, 2016). The underlying neuronal mechanisms of such state change are not well-understood. In particular, it remains to be seen how the local interactions between neural assemblies change after the switch to avoidance strategy.
Functional connectivity in various networks has been widely analyzed using causality measures. Granger causality (GC) has been successfully applied to identify the directional influence of system components in many different fields, such as economics (Chen et al., 2011), climate studies (Kodra et al., 2011), genetics (Zhu et al., 2010), and neuroscience (Ding et al., 2006; Wang et al., 2008; Bressler and Seth, 2011; Gao et al., 2011; Ge et al., 2012; Barnett and Seth, 2014; Seth et al., 2015; Cambiaghi et al., 2016). Granger formulated his approach to causal analysis (Granger, 1969), following Wiener's insight (Wiener, 1956). The key idea can be summarized as follows: Time series X1 has GC relationship with time series X2, if the prediction accuracy of X2 can be improved by using past values of X1. Granger causality has many successful applications, but it has limitations in recovering causal relationships in complex networks (see Spirtes et al., 2000; Pearl, 2009). This is especially true in highly convoluted brain networks with circular causality interactions, in the presence of common-mode observation noise, field effects, and volume conduction (see Friston et al., 2014; Pesaran et al., 2018; Pascual-Marqui et al., 2021). To address some of the limitations of Granger causality, Hu et al. (2011) proposed the New Causality (NC) method, which considers the proportion that Y occupies among all contributions to predict X. As demonstrated by a number of applications, NC is often more robust than GC in revealing causal relationships in data (Hu et al., 2011, 2012). NC and GC methods have been successfully applied in motor imagery to identify causal flows among regions Cz, C3, and C4, whereas NC shows significantly improved classification rate, as compared to GC (see, e.g., Hu et al., 2015; Kozma and Hu, 2015).
In this paper, we describe electrocorticographic (ECoG) data recordings using a 5 × 4 electrode array centered on the top of the primary auditory cortices of seven Mongolian gerbils, while they perform an auditory Go/NoGo discrimination task using two distinct frequency modulated (FM) tones as conditioned stimuli, CS+ and CS−. Based on previous results, in particular (Ohl et al., 1999, 2000a,b, 2001, 2003; Freeman, 2000), we focus our analysis on the beta/gamma band (20–80 Hz). We extend on preliminary results reported in Kozma et al. (2016a,b).
Transitions in the learning performance can be described using various methods. This work uses the approach called d′ (d-prime), which is based on signal detection theory (Deliano et al., 2009; Happel et al., 2014). As an alternative criterion, conditioned response (CR) behavioral signature be used as well, in which case transition is detected when the CR rate exceeds a given threshold the first time. We use d′-based discrimination in the present work, following decades-long tradition of behavioral and physiological analysis. We identified channel pairs with inverse bidirectional causality flow for the two tone patterns representing CS+ and CS−. The results show that learning produces statistically significant increase in the number of causal pairs, as the gerbils transit from the escape strategy to the avoidance strategy. This, in turn, is an indication of adaptive reorganization in cortical networks. Our results indicate the emergence of spatial patterns of causality flow as learning progressed. The increased causality flows are detectable both by GC and NC measures, while NC appearing to be more robust than GC in terms of extracting spatial patterns across experiments with various animals.
We introduce a mathematical model of neurodynamical processes across the cortical layers, based on percolation processes in graphs and networks (Balister et al., 2006; Kozma et al., 2016b; Janson et al., 2019). Of special interest is the adaptation of brain networks during the learning process. Brain networks have been intensively studied in recent decades, identifying structural, functional, and effective connectivity graphs (Bollobás et al., 2010; Bressler and Seth, 2011; Bullmore and Sporns, 2012; Haimovici et al., 2013; Kozma and Freeman, 2016).
This study develops a neurodynamic theory based on the hierarchy of Freeman K sets, corresponding to increasing complexity of structure, dynamics, and function (Freeman et al., 1975; Freeman, 1991). The analysis uses basic building blocks of neurodynamics, including excitatory and inhibitory neural populations, called Freeman KI sets, which can generate non-zero fixed point dynamics for a sufficient level of mutual interaction. We also study interacting excitatory and inhibitory populations (Freeman KII sets), which may exhibit limit cycle oscillations in response to previously conditioned sensory stimuli (Kozma and Freeman, 2003, 2009). The implementation of KI and KII networks dynamics using percolation processes in 2-dimensional models of the cortical neuropil demonstrate potential benefits of the proposed network theory approach in the interpretation of the experimental findings, especially when describing the emergence of common-mode oscillations in neural cell assemblies as the result of the learning process. We extend earlier results on stability analysis by Sokolov and Kozma (2014) and on cortical phase transitions between fixed-point and limit cycle oscillations by Kozma et al. (2016a,b) and Kozma and Freeman (2016). The introduced results underscore the importance of functional reorganization in early sensory areas of rodents in discrimination learning and identify inverse causality flows as possible neural signatures of behavioral changes.
The behaviorial paradigm is summarized here; for details, see Ohl et al. (2001). A rectangular electrode array with 20 electrodes was implanted above the auditory cortex on top of the dura mater; for the spatial arrangement of surface array electrodes (see Supplementary Figure 2). In addition, a wire bundle of 8 depth electrodes was implanted into the ventral striatum. In the present study only the signals from the auditory cortex were analyzed. Gerbils were exposed to two different types of tones: linear rising frequency modulated tones (FM 2–4 kHz, duration 200 ms) and falling FM (FM 2–4 kHz, duration 200 ms). FM tones were presented not as single tones but in short sequences, with 300 ms pauses, yielding an inter-stimulus-interval of 500 ms. This allowed to produce a sufficiently long auditory stimulus while simultaneously keeping the frequency-modulation slope of each segment sufficiently high for robust learning (Ohl et al., 1999, 2000b). Every sequence consisted solely of rising or falling FM signals, but not of a mixture of alternating rising and falling FM signals.
The gerbils were trained in a shuttle box to move from one side of the shuttle box to the other, by crossing a small hurdle, when the rising FM tone (CS+) occurred (Go trial). The falling FM tone (CS−) served as the NoGo signal. If the animal crossed the hurdle within a time period of 6 s after CS+ onset (hit) the tone was switched off, the trial terminated and after an inter-trial interval of 25–30 s, the next trial started. If the animal missed to cross the hurdle within the 6 s window (miss) in a Go trial, it received a mild electrical foot shock via the metallic grid floor of the shuttle box. This resulted in a forced escape response to the other side of the box, after which both shock and tone were switched off (end of trial).
For the falling FM (CS−) animals were supposed to stay within the presently occupied compartment of the box for at least 10 s, which corresponded to a correct rejection and terminated the trial. If animals did change compartments during such a NoGo trial (false alarm), they also received a mild electrical foot shock directly after hurdle crossing and the trial ended. One training session, which corresponded to one training day, consisted of 96 trials (48 Go and NoGo 48 trials). The pseudo-randomized trial sequence was identical for every day and was coded in an offline list (based on a Gellermann sequence). Trials, in which the signal was contaminated with artifacts, were removed from further analysis. Consequently, the effective number of trials of a session could be different from 96.
We calculated for every session a d-prime d′ value (signal detection theory) based on the correct CR (hit) and incorrect CR (false alarm). A d-prime value exceeding 1 indicates statistically significant change (Deliano et al., 2009; Happel et al., 2014). We used d-prime to identify two stages of the experiments, Stage 1 and Stage 2, always starting with Stage 1. If on three consecutive sessions the condition d′ > 1 was satisfied, we marked the first of these sessions as the first session of Stage 2. Therefore, the identification of Stage 1 and Stage 2 was based on the behavior of the animals.
We analyzed causal flows between electrodes implanted over the auditory cortex of seven gerbils; for details, see Supplementary Material. Granger Causality (GC) is based on the notion that if historical information of time series X1 significantly improves the prediction accuracy of the future of time series X2, then time series X1 has causal relationship with X2 in the sense of GC (see Granger, 1969). Granger Causality has been widely applied to identify the directional influence of system components in many different fields, including neuroscience (e.g., Ding et al., 2006; Wang et al., 2008; Bressler and Seth, 2011; Gao et al., 2011; Ge et al., 2012). In addition to GC, we use New Causality (NC) proposed by Hu et al. (2011, 2012). New Causality generalizes the concept of GC, such that it considers the proportion that X1 occupies among all contributions to predict X2. As demonstrated by a number of applications, NC may provide additional insight beyond GC in revealing details of causal relationships in data, as shown by Hu et al. (2015) and Kozma and Hu (2015). We use the following notations for causal flow from X1 to X2 (X1 → X2):
If the experimental conditions involve two stimuli, e.g., CS+ and CS−, the notion of inverse causality may be of benefit. When determining inversely causal pairs, we seek pairs (X1, X2) with the property that the causal flows between X1 and X2 are of the opposite direction for CS+ and CS− trials, respectively. Specifically, for NC method, we collect all pairs satisfying condition:
Similarly, for GC method, we collect all pairs satisfying condition:
Using the above conditions, we determine inverse causality pairs for each animal in each session, where the causal flow values are averaged over all CS+ or CS− trials in the specific session. Using the GC and NC measures, we develop the following algorithm to identify possible learning-induced changes in the cross-channel causality flow:
1. Collect those pairs that satisfy condition (1) for NC or (2) for GC, i.e., channel pairs that showed significant inverse causality flow in CS+ vs. CS− trials; these are called collected pairs.
2. Identify a subset of collected pairs, which appeared only after the animal switched to the avoidance strategy during the learning process. These pairs are referred to as core pairs.
3. Analyze the causality flows for collected pairs in all sessions, we introduced a statistical index (classification measure) to characterize the discrimination performance of the given pair of electrodes between CS+ and CS− trials.
4. Analyze the evolution of the spatial distribution of collected pairs and core pairs in the 5 × 4 electrode array.
5. Determine specific cortical activity patterns, which may serve as mesoscopic neural correlates of the learning process.
In section 3, we determine causality indices (NC and GC) for all electrode pairs band-passed evoked potentials filtered over the gamma band (20–80 Hz). First we illustrate the algorithm for one representative animal (Gerbil 1), then we present a comprehensive group analysis for seven animals.
Data for Gerbil 1 include six daily training sessions. Figure 1A shows the behavioral response of Gerbil 1 with hits (blue) and false alarms (green) evolving during the training sessions; the conditioned response (CR) rate indicates the percentage of hits and false alarms per session. There is a marked increase in the CR rate of the hits starting from day 3. These results are in accordance with previous research conducted on gerbils using auditory learning (Ohl et al., 2001). Causality flow analysis has been conducted using 18 channels with this animal, while 2 channels (#10 and #26) have been excluded from this study due to artifacts (see Supplementary Table 1), last column of the first row. As a result, a total of 153 channel pairs have been analyzed for inverse causality flow.
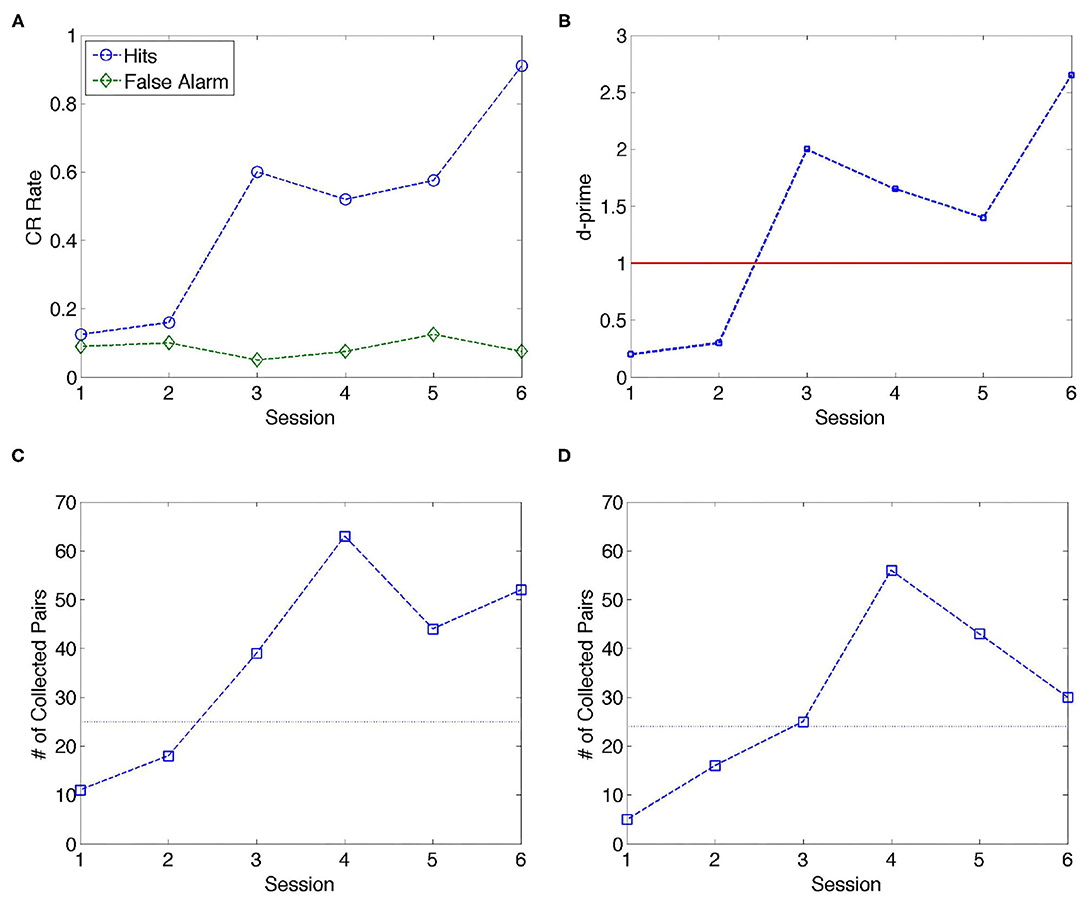
Figure 1. Analysis of data over six training sessions for one animal (Gerbil 1). (A) Conditioned response (CR) rate per session. From Session 3 onwards, the discrimination performance of the gerbil markedly improves in terms of hits; the CR rate corresponding to false alarms maintains a low value around 0.1 through the training sessions. (B) d' (d-prime) quantifies detection sensitivity independently of the response bias of the animal; d′ > 1 indicates better than chance level; from Session 3, the gerbil performed significantly above chance level. (C,D) Number of collected pairs using the inverse causality criterion determined by NC and GC methods, respectively. The dashed line is drawn to guide the eye in separating Stage 1 (Sessions 1 and 2) and Stage 2 (Sessions 3–6).
According to Figure 1C, the number of collected pairs per session was consistently higher in sessions (S3–S6) after the animal switched to avoidance strategy, as compared to naïve sessions before the switch (S1 and S2) for NC analysis. Similar conclusion can be drawn from Figure 1D in the case of GC criteria. In Table 1, sessions corresponding to the escape behavior (S1 and S2) are marked as Stage 1, while sessions after the switch to avoidance stage are marked as Stage 2. Table 1 displays the mean values of the collected pairs in Stages 1 and 2, respectively, clearly indicating the increased number of collected pairs in Stage 2. The observation that the number of the collected pairs is larger in Stage 2 than in Stage 1 gives rise to the hypothesis that the number of causal pairs obtained using NC and GC methods contain relevant information on the cognitive state of the animal. Next, the consistency of this hypothesis is evaluated.
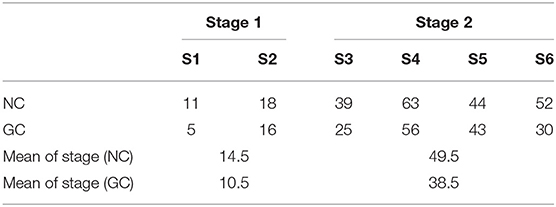
Table 1. Number of collected pairs in Gerbil 1 Sessions S1–S6; NC and GC methods.
From the pool of all collected channel pairs, we sought to identify those pairs that emerged as potential predictors of CS contingency in Stage 2; i.e., the pairs that can be used to discriminate CS+ vs. CS- trials after the transition to the avoidance phase. To this aim, we defined core pairs that were collected in every session of Stage 2, but were absent during the sessions of Stage 1. Table 2 shows the example of (C21, C23) as a core pair for the NC method, while (C1, C19) is a core pair using GC approach. Indeed, according to Table 2, NC values are always larger from C21 to C23 than from C23 to C21 in the case of CS+ trials, while NC values are always smaller from C21 to C23 than from C23 to C21 for CS− trials. Similar conclusions are valid for (C1, C19) using GC method. Note that (C21, C23) and (C1, C19) have not been selected in Sessions S1 and S2, as they do not satisfy the inverse causality conditions using NC and GC, respectively.
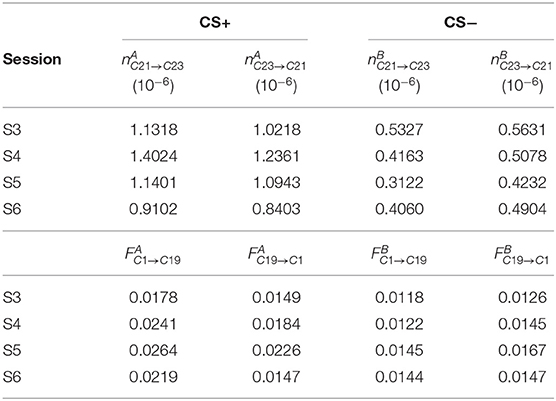
Table 2. NC values of the pair (C21, C23) and GC values of the pair (C1, C19) in Gerbil 1.
For Gerbil 1, there are 6 core pairs for NC: (C21, C23), (C3, C18), (C17, C18), (C17, C22), (C17, C23), and (C21, C22), while we have 3 core pairs for GC analysis: (C1, C19), (C3, C22), and (C19, C21). The significance of some of the core pairs in the discrimination capability of neural signatures measured over the gerbil auditory cortex is studied next.
We define a classification rate for CS− and CS+ trials based on the inverse causality flow in a core pair. We use the following notations: NCS+ is the number of CS+ trials in a session; NCS− is the number of CS− trials in a session; N+ is the number of CS+ trials with causality values satisfying Equations 1 or 2 for NC or GC, respectively; N− is the number of CS− trials with causality values satisfying Equations 1 or 2 for NC or GC, respectively. For pair (C1, C2), the classification rates for CS+ and CS− conditions are given by and , respectively. The overall classification rate is . Using the above procedure, Table 3 displays the classification rates in Gerbil 1 for core pair (C21, C23) using NC and for core pair (C1, C19) using GC. For these core pairs, the mean classification rates are higher in Stage 2 than in Stage 1.
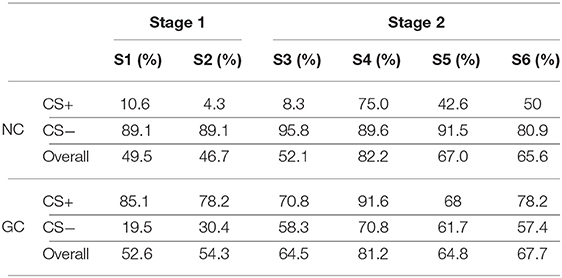
Table 3. Classification rates in Gerbil 1 using pairs (C1, C19) for GC and (C21, C23) for NC.
Table 4 contains the average classification rates in Stages 1 and 2 for all 6 core pairs determined by NC method for Gerbil 1. We observe that the six core pairs show better classification performance in Stage 2 than in Stage 1 for NC method. The GC method gives the following three core pairs for Gerbil 1: (C1, C19), (C3, C22), and (C19, C21). Table 5 shows that two of the three GC core pairs have considerably better classification performance in Stage 2 than in Stage 1, while one pair has better classification in Stage 1. A comprehensive analysis involving all gerbils, however, shows that core pairs frequently produce worse classification in Stage 2 than in Stage 1. To characterize the corresponding effect, we will study a subset of core pairs with improved classification at Stage 2.
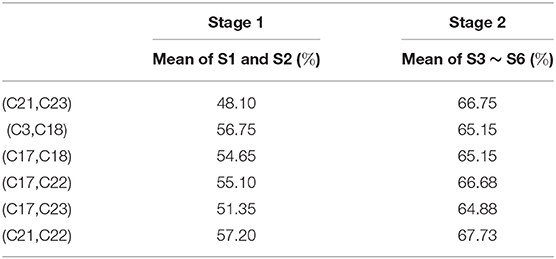
Table 4. Classification rates for the 6 core pairs obtained by NC method for Gerbil 1.
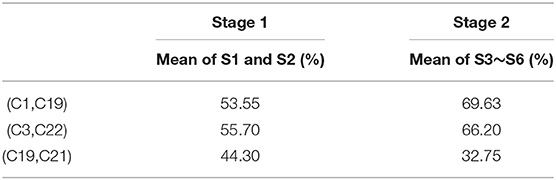
Table 5. Classification rates for the 3 core pairs obtained by GC method for Gerbil 1.
In this section, we introduce results of the causality analysis for Gerbils 2–7 in a similar way as previously for Gerbil 1 (see Supplementary Material for details). Here, we will study core pairs collected for all seven animals to obtain a comprehensive understanding of the emerging inverse causality flows following the switch to the avoidance phase. In particular, we study the common spatial patterns of the causality flows in the auditory cortex.
Results on the collected pairs with inverse causality flows for all seven gerbils are summarized in Table 6. Details of the tests of statistical significance using surrogate data are described in the Supplementary Material. We used the d′ criterion from signal detection theory with d′ > 1 to identify the transition from escape to avoidance strategy. According to this criterion, transitions occurred at S3 for Gerbil 1, then at S4, S2, S5, S2, S2, and S2 for Gerbils 2 though 7, respectively.
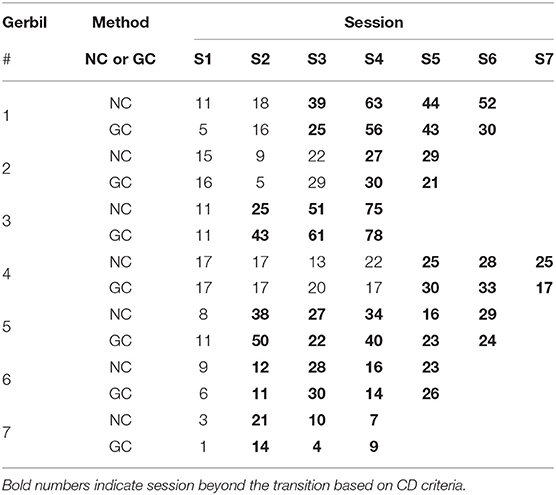
Table 6. Number of collected pairs using NC and GC in the experiments with 7 Gerbils*.
The number of collected pairs in any session of Stage 1 was smaller than the number of collected pairs in any session of Stage 2 in the case of NC. The collected pairs showed generally similar behavior using the GC analysis, with the exception of Gerbils 2 and 4 in some sessions toward the end of Stage 2. Still, the average number of collected pairs was larger in Stage 2 than in Stage 1 also for GC method.
In order to test the statistical significance of the difference in the number of collected pairs between Stages 1 and 2, we applied a paired group analysis using non-parametric Wilcoxon test, when all animals were pooled together for Stage 1 and Stage 2, respectively. The Wilcoxon test showed that the differences in the collected pairs between Stage 1 and Stage 2 were indeed statistically significant. Namely, for NC: meanStage1 = 12.4 ± 1.2 (SEM), meanStage2 = 30.1 ± 5.7 (SEM); Wilcoxon signed-rank test (W = 1), p < 0.05. For GC: meanStage1 = 11.5 ± 1.6 (SEM), meanStage2 = 30.0 ± 6.4 (SEM), Wilcoxon signed-rank test (W = 1), p < 0.05. The statistical t-test has limitations in our experiments due to the small number of data points, nevertheless, t-test also points to the significance of the difference between Stage 1 and Stage 2 in terms of collected pairs.
We pooled channels that were part of collected pairs (in Stage 1) and core pairs (in Stage 2) for all animals where the array had a similar orientation with respect to the cortical surface, i.e., Gerbils 2, 4, 6, and 7 (see Supplementary Material). The spatial distribution of the corresponding electrodes are given in Table 7 for the pooled animals Gerbil 2, 4, 6, and 7. The numbers in Tables 7A,B indicate how many times a particular channel was counted as part of a collected pair in Stage 1 using (Table 7A) NC and (Table 7B) GC method, while Tables 7C,D shows the number of times a particular channel was counted as part of a core pair in Stage 2 using (Table 7C) NC and (Table 7D) GC method.
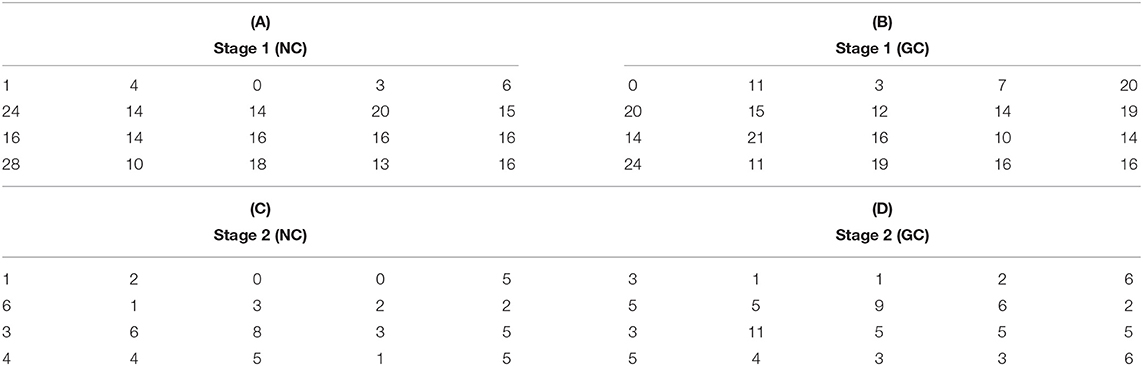
Table 7. The number of times a given channel is used as part of a collected pair in Stage 1 and as part of a core pair in Stage 2 for NC and GC.
To help visualize the spatial distribution of the pairs, Figure 2 provides a color coded representation of data in Table 7, where light yellow and deep purple colors mark high and low values, respectively. Data in Figure 2 have been obtained by normalizing each map with the total number of channel pair counts across the array. The distribution of collected pairs across the array in Stage 1 is rather uniform spatially for both NC and GC, without the emergence of a salient localized spatial clusters of channels with high degree of connectivity across the array (see Figures 2A,B). If the formation of pairs would be biased by the spatial neighborhood relationships, then channels in the middle of the array would be preferred as they have more neighbors that are physically close to them. This is not what we see in Figures 2A,B and in Table 7, where the nodes with the highest connectivity are in fact located at the boundary of the arrays; see first column of Table 7A and first and last columns of Table 7B.
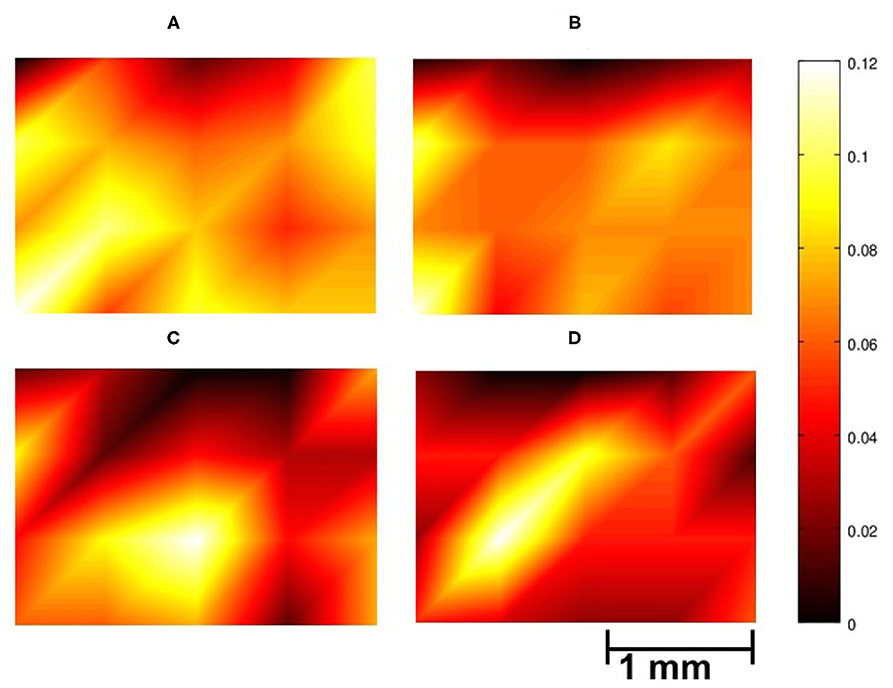
Figure 2. Spatial distribution of the contribution of the electrodes to inverse causality relationships over the auditory cortex of gerbils; illustrating data from a rectangular array of size 1.8 × 2.5 mm with 4 × 5 electrodes. The colorbar indicates the proportion of a specific channel appearing in the inverse causality pairs. (A,B) Case of collected pairs in Stage 1 using NC (A) and GC (B); (C,D) Electrodes contributing to core pairs in Stage 2 for NC (C) and GC (D). The bright regions around electrodes 23, 2, and 8 in (C), and around 2 and 6 in (D) indicate the increased significance of those local areas in avoidance learning for these gerbils. To create the figures, piecewise linear interpolation is applied between the data points using MATLAB interp function.
For core pairs in Stage 2, on the other hand, there are localized spatial “hubs” for NC (electrodes 23, 2, and 8) and GC (electrodes 2 and 6; see Figures 2C,D). Moreover, the variance of the spatial distribution is higher in Figures 2C,D than in Figures 2A,B. Overall, we observe a marked difference between Stage 1 and Stage 2 based on the spatial distribution of causality relationships between channels. This result indicates that causal pairs can be useful tools to trace the neural basis underlying the transition from the escape strategy to the avoidance strategy.
We applied causality analysis to ECoG data recorded from seven Mongolian gerbils, which perform an auditory Go/NoGo discrimination task. We investigated how pairwise causal interactions between channels of the surface electrode array were affected by the progression of the learning. We studied inverse causality flows for CS+ and CS− stimuli, using the well-established Granger Causality (GC) and the recently introduced New Causality (NC). Our main findings are summarized as follows:
1. The number of channel pairs, which were collected based on the inverse causality criteria using GC and NC metrics significantly increased after the animals made a transition from the escape strategy (Stage 1) to the avoidance strategy (Stage 2) during the learning process.
2. Spatial patterns of core pairs have been analyzed during the learning process. It has been observed that the core pairs are more broadly distributed before transition to avoidance, while some regional hot spots emerged after the transition. This may imply that the implicated local areas play an important role in FM-tone discrimination during the learning process. This observation is especially prominent for NC analysis, while GC measure is more broadly distributed with less evidence of learning-related clustering.
3. The core pairs have been evaluated for classification performance regarding CS+ and CS− conditions. Some of the core pairs demonstrated statistically significant discrimination power after the transition to avoidance strategy, while most of the pairs did not possess such a property. These results require further detailed studies.
Our data with ECoG recordings in small rodents show that both NC and GC are capable to reliably track the development of causal interactions in primary sensory areas during learning. We found that NC and GC are comparable in terms of identifying the increase of the absolute numbers of collected channel pairs after the switch to the avoidance strategy. When applying the core pairs for classification of CS+ and CS− stimuli, NC appears to be a more robust method with respect to extracting common features expressed at the inter-individual level. Hence, our study supports earlier reports which point out advantages of NC over GC in the analysis of neuronal data based on human EEG (Hu et al., 2011, 2012, 2015), and extends these findings to ECoG recordings in small rodents.
In the present study we have focused on the gamma frequency band. We note that other frequency bands play also an important role in grouping and segregating neuron assemblies and consequently encode stimulus identification, memory and drive (goal directed) behavior. However, signals in the theta band are prone to contamination of volume-conducted electrical activity generated by distal sources e.g., hippocampus, particularly during locomotion (Lalla et al., 2017). Delta bands might be affected by entrained neuronal activity caused by the inter-stimulus interval of 2 Hz of the FM-tones in the tone sequences in the present study. On the other hand, local gamma band synchrony seems to drive discrimination learning. Concina et al. (2018) found an increased coherence of slow gamma band activity between prelimbic and auditory cortex only for animals which did learn an auditory discrimination task. This increased coherence was absent for other frequency bands (theta, beta) and non-learning animals.
Our results contribute to the ongoing discussion on the role of neuronal assembly interactions for auditory learning and their qualitative nature (Eggermont, 2006; Grosso et al., 2015; Keating and King, 2015; Ohl, 2015; Weinberger, 2015). For instance, the behavioral relevance of temporal coherence or coupling for auditory information processing has been demonstrated by numerous recent studies both in intra-cortical circuits (Noda et al., 2014; Yokota et al., 2015), as well as on cortico-subcortical circuit levels (Bachiller et al., 2014; Liégeois-Chauvel et al., 2014; Schulz et al., 2016). In this context, our finding of an increase in inverse predictive causality flow among certain channel pairs with the progression of learning can be reasonably interpreted as an indication of spatial reorganization or remapping of effective intra-cortical connectivity on the mesoscopic level of neuronal assemblies (Weinberger and Bakin, 1998; Pienkowski and Eggermont, 2011).
The criterion of inverse causality flow seems particularly suited in revealing the potential reorganization of intra-cortical interactions during learning, because it emphasizes qualitative changes in the directional component of pairwise interactions that emerge over the course of the training, as opposed to quantitative changes in the absolute magnitude of unidirectional causal flows. These findings emphasize the importance of functional connectivity changes in unimodal sensory areas, including the primary auditory cortex, as potential neural contributors to behavioral changes.
We introduce a graph theoretical model featuring phase transition behavior, to interpret learning effects in the gerbil experiments. We develop a random graph to model the cortical neuropil with short- and long-range connections (edges) describing the combination of short dendritic connections and long axons (see Kozma et al., 2005, 2012; Kozma and Freeman, 2016). The short dendritic connections are modeled by lattice edges on a torus, while long axons are described by a few additional edges superimposed on the lattice. This model is related to small-world networks, and it provides a systematic treatment of some of their properties related to cortical networks (see Bollobás et al., 2010; Bullmore and Sporns, 2012; Haimovici et al., 2013). The definition of the model captures an important property of cortical networks; namely, it is more likely for a neuron to be connected to nearby neurons than to neurons which are far from the given one. The long-range connections have power law length distributions, leading to drastic reduction of the diameter of the brain graph (see Janson et al., 2019).
The spread of activity in the cortical tissue will be described by a simplified mathematical model—bootstrap percolation (BP) (see, e.g., Balister et al., 2006; Bollobás et al., 2010). The model is defined as follows. The set of vertices of the random graph is given by the vertex set of , where is a torus on N2 vertices. All edges of the torus are presented in . The random edges of are distance-dependent, i.e., the probability that an arbitrary pair of vertices, u, v, that are at graph distance d apart of each other, is given by
where d > 1, c is a positive constant, and α is the power exponent of long-range edge length distribution. In this work, we use α = 1, for simplicity. It is assumed that there are no multiple edges between the vertices. We will use the following notation λ = 4 c ln 2, i.e., λ is proportional to the probability of adding long-range edges.
We state here a generalized definition of bootstrap percolation that consists of two types of vertices, which correspond to excitatory and inhibitory units. Bootstrap percolation with one type of vertices (excitatory or inhibitory) can be viewed then as a special case. At the beginning each vertex of the graph is described by two random variables, its type and state. The types of vertices are excitatory (1) or inhibitory (2). We define the type as a Bernoulli random variable Be(ω), which is selected at the start of the process and remains unchanged afterwards. In contrast, state of a vertex may change during the process as follow. At each time step a vertex is either active or inactive. For each vertex v of the graph we assign a binary function χv(t) which describes the activity state of the vertex at time t. A vertex is said to be active if χv(t) = 1, otherwise it is inactive and χv(t) = 0. For each vertex v, the potential function χv(0) at the beginning is a Bernoulli random variable Be(p).
Let , i ∈ {E, I}, denote the set of active vertices of type E and I at time t, respectively, A(t) = AE(t)∪AI(t). A(0) consists of all vertices that are active at the beginning. Each vertex may change its activity based on the states of its neighbors. For a vertex v which is of type E, the evolution rule is given by
where NE(v) and NI(v) denote the subset of vertices in the closed neighborhood of vertex v, which are of E and I type, respectively; and 𝟙 is the indicator function. For a vertex v of type I, the following rule holds
where N(v) = NE(v)∪NI(v) is the closed neighborhood of vertex v. The rules try to capture the behavior that a node is active if its neighbors total activity (considering sign) exceeds a threshold k1 or k2, respectively.
We consider the evolution of the following two density functions, corresponding to active nodes of type 1 (excitatory) and type 2 (inhibitory). Let:
and
be the densities of the first and second types, correspondingly, where Ai(t) is the number of active vertices of type i, i = 1, 2, at time t. Then, in particular, the density of all active nodes is given by
The dynamics of the BP with one type of (excitatory) vertices is fully described in Janson et al. (2019).
Theorem 1. In the mean-field approximation of the activation process A(t) over random graph there exists a critical probability pc such that for a fixed p, with high probability for large N, all vertices will eventually be active if p > pc, while all vertices will eventually be inactive for p < pc. The value of pc is given as the function of k and λ as follows:
(i) For k = 0 and any λ, pc = 0 and all vertices will become active in one step for any p.
(ii) For k = 1 and any λ, pc = 0, i.e., for any fixed p > 0, all vertices will eventually become active with high probability.
(iii) For k = 2, 3, 4 and any λ, pc = xk(λ), where xk(λ) ∈ (0, 1) is a nontrivial solution to .
(iv) For k = 5 and λ > ln(5), pc = x5(λ), where x5(λ) ∈ (0, 1) is a nontrivial solution to ; for λ ≤ ln(5), pc = 1.
It is possible to describe the dynamics of BP with two types of (excitatory and inhibitory) nodes (Kozma et al., 2016b). In this case, one needs to find the solutions of the following set of fixed-point equations, for the mathematically derived nonlinear mapping functions f1(x, y) and f2(x, y):
The fixed point can be either stable or unstable, which determines the nature of the percolation dynamics, e.g., fixed point, limit cycle, or non-periodic oscillations (Kozma et al., 2016b). Numerical examination of BP with two types of vertices shows dynamic behavior that is richer than in BP with only one type of vertices. In particular, when the threshold parameter in the update rules for vertices of the first and second types are different, limit cycle dynamics may appear. A bifurcation diagram of the process with excitatory-inhibitory nodes is shown in Figure 3A with respect to ω, λ, where parameters k1 = 2 and k2 = 3. The type of a vertex is determined at the beginning uniformly at random, thus ω defines the overall ratio of excitatory and inhibitory nodes, which is unchanged throughout the process. It is observed that limit cycle behavior belongs to the excitatory to inhibitory ratio of around 4/1. The next section will investigate how the phase transitions to narrow-band (limit-cycle) oscillations in the percolation model may be beneficial in the interpretation of the experimental findings on the emergence of common-mode oscillations in neural populations as the result of the learning process.
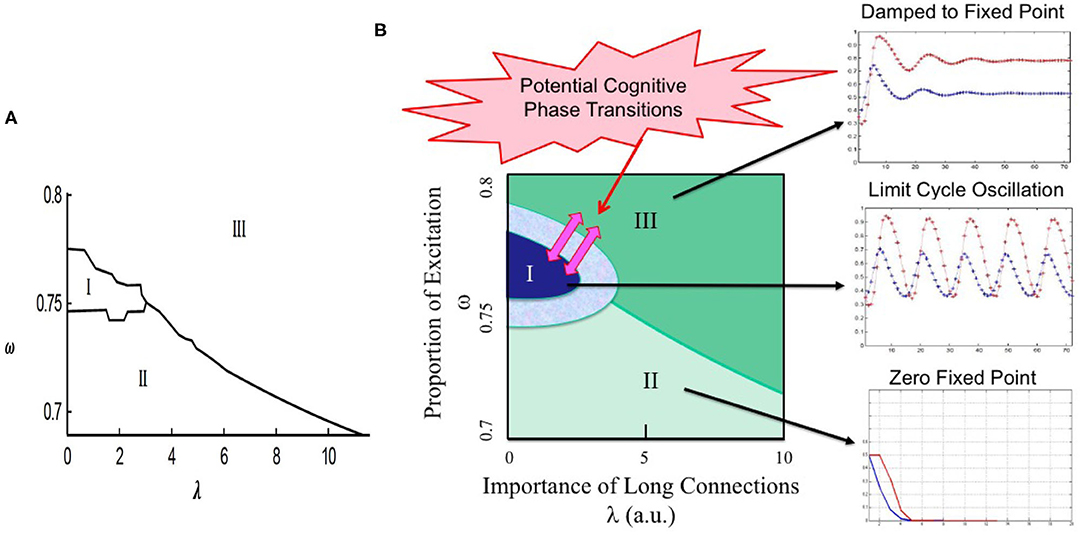
Figure 3. Illustration of the potential of bootstrap percolation (BP) model to describe learning-induced state transitions in the sensory cortex. (A) Bifurcation diagram of BP with two types of nodes (excitatory and inhibitory), where k1 = 2 and k2 = 3. Parameter ω gives the proportion of excitatory neurons; increasing λ signifies stronger long-range connections. Limit cycle dynamics exists in region I, processes of both types eventually die out in II, and non-zero fixed point dynamics exist in region III; (B) Proposed interpretation of dynamic regimes illustrated over the phase diagram in the λ vs. ω space. The solid dark (blue) region corresponds to conditions with limit cycle oscillations created as the result of learning. There is a transitionary region (light blue) illustrate transitionary conditions due to local parameters and inhomogeneities. Transitions from limit cycle regime to non-zero base state (dark green area) indicate the absence of learnt stimuli. Zero fixed point (light green) is shown in the lower segment of the phase diagram. The region corresponding to the hypothetic cognitive phase transitions is illustrated by pink arrows; modified and reprinted with permission from Kozma et al. (2016b).
In this section we analyze the potential role of several key model parameters in the interpretation of the learning dynamics of the cortical tissue. Based on Freeman's neurodynamics theory, we know that learning is closely related to the onset of narrow band oscillations in the cortex as a consequence of sustained reinforcement signal, and the possible formation of Hebbian cell assemblies (Freeman, 1991). These insights provide important input to our modeling studies, which provide theoretical insights into the interpretation of the experimental results.
Our bootstrap percolation model describes phase transitions between fixed point and limit cycle dynamics when certain control parameters of the model vary. Here let us focus on the significance of long-range edges (λ) and threshold values of the update rule (k1 and k2). For example, in the case of k1 = k2 = 3 our model shows fixed point behavior, which can change to oscillatory behavior if k1 is decreased to 2. Decreasing k1 can be interpreted as the reduction of the dynamic threshold in the interaction between the cortical locations due to learning. Moreover, changes in λ can also produce transitions between dynamic regimes. This is illustrated in Figure 3B, which is based on the phase diagram obtained from our model and depicted in Figure 3A. Three main regions are shown as follows: Region I: limit cycle oscillations at the middle range of ω (deep blue); Region II: zero fixed point regime (light green) at the bottom section; Region III: nonzero fixed point (dark green) at the top half. The region corresponding to the hypothetic cognitive phase transitions is indicated by pink arrows (pink).
The presence of the oscillatory behavior in a narrow frequency band is shown in Figure 3B using Region I (dark blue). Oscillatory behavior is a hallmark of learning effects, which are modeled in our model using the adaptation (decrease) of excitatory threshold k1 from its original value of 3 to 2, while the inhibitory threshold k2 remained unchanged; the corresponding effect is visualized by the transitionary region with light blue color around Region I. Note, that in the case of high values of both excitatory and inhibitory thresholds k1 = k2 = 3 no oscillatory behavior takes place, rather the dynamics converges to fixed points (not shown). In short, k1 may be indeed a control parameter for a state transition in neurodynamics accompanying a cognitive state transition during learning.
The results introduced in this study show that it is possible to detect neural correlates of cognitive state changes in the gerbil's cortex using causality measures. The difference between the behavior of the early escape stage and advanced avoidance strategy in the trained animal has an experimentally observable neural measure through the formation of connections (causal links) between certain cortical regions as the result of learning. The regions and links between them may be the manifestations of Hebbian cell assembly (HCA) formation, and our results may provide evidence for the existence of HCAs.
This work is dedicated to the memory of our dear colleague and friend Sanqing Hu, who relentlessly pursued research at the forefront of science, leading to the discoveries reported in this work. Without him these results would not exist.
The data supporting the conclusions of this article will be made available on reasonable requests to the corresponding authors, without undue reservations.
The animal study was reviewed and approved by Ethics Commission of the state of Sachsen-Anhalt, Germany. All experiments were in compliance with the guidelines of the European Community (EUVD 86/609/EEC).
The study was conceived by FO and RK. Experiments and data preprocessing were conducted by AG, FO, AS, TW, and MW. SH contributed to the overview of causality analysis. YS contributed to data analysis and computational algorithms design. MR, YS, and RK contributed to graph theory modeling. YS and SH leading the HDU team conducted the computer analysis for causality. All authors contributed to interpretation of the data. RK and FO coordinated the interdisciplinary research team. RK, FO, and AS wrote the manuscript that was approved by all authors.
This work has been supported in part by Bundesministerium fuer Bildung und Forschung (BMBF) and U.S. National Science Foundation (NSF Grant No. DMS-1311165): US-German Collaboration on Computational Neuroscience, Project: Strategy Change in Cognitive Biological and Technical Systems; NKFIH Grants No. K116769, 132696, and DYNASNET ERC Synergy Grant No. 810115; National Natural Science Foundation of China under Grants (Nos. 61473110, and 61633010), Natural Science Foundation of Zhejiang Province, China, under Grant No. LZ13F030002, grants from the German Science Foundation (Deutsche Forschungsgemeinschaft, DFG), Project-ID 425899996 (SFB 1436, TP A06), and the EU-EFRE grant IAIS of the state Saxony-Anhalt, Germany.
The authors declare that the research was conducted in the absence of any commercial or financial relationships that could be construed as a potential conflict of interest.
This work is the extension of the preliminary results reported by Kozma et al. (2016b) at IEEE SMC2016 conference, with permission. We thank Kathrin Ohl for performing animal surgeries and technical assistance. We thank Jikang Xue and Jianhai Zhai of Hangzhou Dianzi University, and Feng Bao and Qionghai Dai of Tsinghua University, Beijing, for help with the computer analysis of causality.
The Supplementary Material for this article can be found online at: https://www.frontiersin.org/articles/10.3389/fnsys.2021.641684/full#supplementary-material
Aizenberg, M., and Geffen, M. N. (2013). Bidirectional effects of aversive learning on perceptual acuity are mediated by the sensory cortex. Nat. Neurosci. 16, 994–996. doi: 10.1038/nn.3443
Bachiller, A., Poza, J., Gómez, C., Molina, V., Suazo, V., and Hornero, R. (2014). A comparative study of event-related coupling patterns during an auditory oddball task in schizophrenia. J. Neural Eng. 12:016007. doi: 10.1088/1741-2560/12/1/016007
Balister, P., Bollobás, B., and Kozma, R. (2006). Large deviations for mean field models of probabilistic cellular automata. Random Struct. Algor. 29, 399–415. doi: 10.1002/rsa.20126
Barnett, L., and Seth, A. K. (2014). The MVGC multivariate granger causality toolbox: a new approach to granger-causal inference. J. Neurosci. Methods 223, 50–68. doi: 10.1016/j.jneumeth.2013.10.018
Bar-Yosef, O., and Nelken, I. (2007). The effects of background noise on the neural responses to natural sounds in cat primary auditory cortex. Front. Comput. Neurosci. 1:3. doi: 10.3389/neuro.10.003.2007
Bollobás, B., Kozma, R., and Miklos, D. (2010). Handbook of Large-Scale Random Networks, Vol. 18. Berlin; Heidelberg; New York, NY: Springer Science & Business Media.
Bressler, S. L., and Seth, A. K. (2011). Wiener-granger causality: a well established methodology. Neuroimage 58, 323–329. doi: 10.1016/j.neuroimage.2010.02.059
Bullmore, E., and Sporns, O. (2012). The economy of brain network organization. Nat. Rev. Neurosci. 13, 336–349. doi: 10.1038/nrn3214
Cambiaghi, M., Grosso, A., Renna, A., and Sacchetti, B. (2016). Differential recruitment of auditory cortices in the consolidation of recent auditory fearful memories. J. Neurosci. 36, 8586–8597. doi: 10.1523/JNEUROSCI.0561-16.2016
Chapuis, J., and Wilson, D. A. (2012). Bidirectional plasticity of cortical pattern recognition and behavioral sensory acuity. Nat. Neurosci. 15:155. doi: 10.1038/nn.2966
Chen, M.-p., Lee, C.-C., and Hsu, Y.-C. (2011). The impact of American depositary receipts on the Japanese index: do industry effect and size effect matter? Econ. Model. 28, 526–539. doi: 10.1016/j.econmod.2010.07.001
Concina, G., Cambiaghi, M., Renna, A., and Sacchetti, B. (2018). Coherent activity between the prelimbic and auditory cortex in the slow-gamma band underlies fear discrimination. J. Neurosci. 38, 8313–8328. doi: 10.1523/JNEUROSCI.0540-18.2018
Deliano, M., Scheich, H., and Ohl, F. W. (2009). Auditory cortical activity after intracortical microstimulation and its role for sensory processing and learning. J. Neurosci. 29, 15898–15909. doi: 10.1523/JNEUROSCI.1949-09.2009
Deliano, M., Tabelow, K., König, R., and Polzehl, J. (2016). Improving accuracy and temporal resolution of learning curve estimation for within- and across-session analysis. PLoS ONE 11:e157355. doi: 10.1371/journal.pone.0157355
Ding, M., Chen, Y., and Bressler, S. (2006). “Granger causality: Basic theory and application to neuroscience,” in Handbook of Time Series Analysis [Internet] (Weinheim: Wiley). doi: 10.1002/9783527609970.ch17
Eggermont, J., Aertsen, A., and Johannesma, P. (1983). Prediction of the responses of auditory neurons in the midbrain of the grass frog based on the spectro-temporal receptive field. Hear. Res. 10, 191–202. doi: 10.1016/0378-5955(83)90053-9
Eggermont, J. J. (2006). Properties of correlated neural activity clusters in cat auditory cortex resemble those of neural assemblies. J. Neurophysiol. 96, 746–64. doi: 10.1152/jn.00059.2006
Freeman, W. (2000). Neurodynamics: An Exploration in Mesoscopic Brain Dynamics. London: Springer Science & Business Media. doi: 10.1007/978-1-4471-0371-4
Freeman, W. J. (1991). The physiology of perception. Sci. Am. 264, 78–87. doi: 10.1038/scientificamerican0291-78
Friston, K. J., Bastos, A. M., Oswal, A., van Wijk, B., Richter, C., and Litvak, V. (2014). Granger causality revisited. Neuroimage 101, 796–808. doi: 10.1016/j.neuroimage.2014.06.062
Fritz, J., Shamma, S., Elhilali, M., and Klein, D. (2003). Rapid task-related plasticity of spectrotemporal receptive fields in primary auditory cortex. Nat. Neurosci. 6, 1216–1223. doi: 10.1038/nn1141
Funamizu, A., Kanzaki, R., and Takahashi, H. (2013). Pre-attentive, context-specific representation of fear memory in the auditory cortex of rat. PLoS ONE 8:e63655. doi: 10.1371/journal.pone.0063655
Gao, Q., Duan, X., and Chen, H. (2011). Evaluation of effective connectivity of motor areas during motor imagery and execution using conditional granger causality. Neuroimage 54, 1280–1288. doi: 10.1016/j.neuroimage.2010.08.071
Ge, T., Feng, J., Grabenhorst, F., and Rolls, E. T. (2012). Componential granger causality, and its application to identifying the source and mechanisms of the top-down biased activation that controls attention to affective vs. sensory processing. Neuroimage 59, 1846–1858. doi: 10.1016/j.neuroimage.2011.08.047
Goldstone, R. L. (1998). Perceptual learning. Annu. Rev. Psychol. 49, 585–612. doi: 10.1146/annurev.psych.49.1.585
Granger, C. W. (1969). Investigating causal relations by econometric models and cross-spectral methods. Econometrica 424–438. doi: 10.2307/1912791
Grosso, A., Cambiaghi, M., Milano, L., Renna, A., Sacco, T., and Sacchetti, B. (2017). Region- and layer-specific activation of the higher order auditory cortex TE2 after remote retrieval of fear or appetitive memories. Cereb. Cortex 27, 3140–3151. doi: 10.1093/cercor/bhw159
Grosso, A., Cambiaghi, M., Renna, A., Milano, L., Roberto Merlo, G., Sacco, T., et al. (2015). The higher order auditory cortex is involved in the assignment of affective value to sensory stimuli. Nat. Commun. 6:8886. doi: 10.1038/ncomms9886
Haimovici, A., Tagliazucchi, E., Balenzuela, P., and Chialvo, D. R. (2013). Brain organization into resting state networks emerges at criticality on a model of the human connectome. Phys. Rev. Lett. 110:178101. doi: 10.1103/PhysRevLett.110.178101
Happel, M. F., Niekisch, H., Rivera, L. L. C., Ohl, F. W., Deliano, M., and Frischknecht, R. (2014). Enhanced cognitive flexibility in reversal learning induced by removal of the extracellular matrix in auditory cortex. Proc. Natl. Acad. Sci. U.S.A. 111, 2800–2805. doi: 10.1073/pnas.1310272111
Hu, S., Cao, Y., Zhang, J., Kong, W., Yang, K., Zhang, Y., et al. (2012). More discussions for granger causality and new causality measures. Cogn. Neurodyn. 6, 33–42. doi: 10.1007/s11571-011-9175-8
Hu, S., Dai, G., Worrell, G. A., Dai, Q., and Liang, H. (2011). Causality analysis of neural connectivity: critical examination of existing methods and advances of new methods. IEEE Trans. Neural Netw. 22, 829–844. doi: 10.1109/TNN.2011.2123917
Hu, S., Wang, H., Zhang, J., Kong, W., Cao, Y., and Kozma, R. (2015). Comparison analysis: granger causality and new causality and their applications to motor imagery. IEEE Trans. Neural Netw. Learn. Syst. 27, 1429–1444. doi: 10.1109/TNNLS.2015.2441137
Janson, S., Kozma, R., Ruszinkó, M., and Sokolov, Y. (2019). A modified bootstrap percolation on a random graph coupled with a lattice. Discr. Appl. Math. 258, 152–165. doi: 10.1016/j.dam.2018.11.006
Keating, P., and King, A. J. (2015). Sound localization in a changing world. Curr. Opin. Neurobiol. 35, 35–43. doi: 10.1016/j.conb.2015.06.005
Kodra, E., Chatterjee, S., and Ganguly, A. R. (2011). Exploring granger causality between global average observed time series of carbon dioxide and temperature. Theor. Appl. Climatol. 104, 325–335. doi: 10.1007/s00704-010-0342-3
Kozma, R., and Freeman, W. J. (2003). Basic principles of the kiv model and its application to the navigation problem. J. Integr. Neurosci. 2, 125–145. doi: 10.1142/S0219635203000159
Kozma, R., and Freeman, W. J. (2009). The KIV model of intentional dynamics and decision making. Neural Netw. 22, 277–285. doi: 10.1016/j.neunet.2009.03.019
Kozma, R., and Freeman, W. J. (2016). Cognitive Phase Transitions in the Cerebral Cortex-Enhancing the Neuron Doctrine by Modeling Neural Fields. Heidelberg; New York, NY; Dordrecht; London: Springer. doi: 10.1007/978-3-319-24406-8
Kozma, R., and Hu, S. (2015). Stochastic causality, criticality, and non-locality in brain networks. comment on" foundational perspectives on causality in large-scale brain networks" by M. mannino and sl bressler. PhLRv 15, 133–135. doi: 10.1016/j.plrev.2015.10.006
Kozma, R., Puljic, M., Balister, P., Bollobás, B., and Freeman, W. J. (2005). Phase transitions in the neuropercolation model of neural populations with mixed local and non-local interactions. Biol. Cybern. 92, 367–379. doi: 10.1007/s00422-005-0565-z
Kozma, R., Puljic, M., and Freeman, W. J. (2012). “Thermodynamic model of criticality in the cortex based on EEG/ECOG data,” in Criticality in Neural Systems, ed D. Plenz (Weinheim: Wiley-VCH Verlag GmbH), 1–28.
Kozma, R., Sokolov, Y., Freeman, W. J., Ruszinko, M., Hu, S., Schultz, A., et al. (2016a). “Functional reorganization via phase transitions in early sensory areas during category learning,” in NSF CRCNS Annual Meeting (Paris: Pasteur Institute). Available online at: http://crcns2016.anr.fr/abstracts
Kozma, R., Sokolov, Y., Puljic, M., Hu, S., and Ruszinkó, M. (2016b). “Modeling learning and strategy formation as phase transitions in cortical networks,” in 2016 IEEE International Conference on Systems, Man, and Cybernetics (SMC) (Budapest), 004099–004105. doi: 10.1109/SMC.2016.7844874
Lalla, L., Rueda Orozco, P. E., Jurado-Parras, M.-T., Brovelli, A., and Robbe, D. (2017). Local or not local: Investigating the nature of striatal theta oscillations in behaving rats. eNeuro 4, 1–14. doi: 10.1523/ENEURO.0128-17.2017
Liégeois-Chauvel, C., Bénar, C., Krieg, J., Delbé, C., Chauvel, P., Giusiano, B., et al. (2014). How functional coupling between the auditory cortex and the amygdala induces musical emotion: a single case study. Cortex 60, 82–93. doi: 10.1016/j.cortex.2014.06.002
Machens, C. K., Wehr, M. S., and Zador, A. M. (2004). Linearity of cortical receptive fields measured with natural sounds. J. Neurosci. 24, 1089–1100. doi: 10.1523/JNEUROSCI.4445-03.2004
Meyer, A. F., Diepenbrock, J.-P., Happel, M. F., Ohl, F. W., and Anemüller, J. (2014). Discriminative learning of receptive fields from responses to non-gaussian stimulus ensembles. PLoS ONE 9:e93062. doi: 10.1371/journal.pone.0093062
Noda, T., Kanzaki, R., and Takahashi, H. (2014). Amplitude and phase-locking adaptation of neural oscillation in the rat auditory cortex in response to tone sequence. Neurosci. Res. 79, 52–60. doi: 10.1016/j.neures.2013.11.002
Ohl, F. W. (2015). Role of cortical neurodynamics for understanding the neural basis of motivated behavior-lessons from auditory category learning. Curr. Opin. Neurobiol. 31, 88–94. doi: 10.1016/j.conb.2014.08.014
Ohl, F. W., Deliano, M., Scheich, H., and Freeman, W. J. (2003). Early and late patterns of stimulus-related activity in auditory cortex of trained animals. Biol. Cybern. 88, 374–379. doi: 10.1007/s00422-002-0389-z
Ohl, F. W., and Scheich, H. (1996). Differential frequency conditioning enhances spectral contrast sensitivity of units in auditory cortex (field AI) of the alert mongolian gerbil. Eur. J. Neurosci. 8, 1001–1017. doi: 10.1111/j.1460-9568.1996.tb01587.x
Ohl, F. W., and Scheich, H. (1997). Orderly cortical representation of vowels based on formant interaction. Proc. Natl. Acad. Sci. U.S.A. 94, 9440–9444. doi: 10.1073/pnas.94.17.9440
Ohl, F. W., and Scheich, H. (2005). Learning-induced plasticity in animal and human auditory cortex. Curr. Opin. Neurobiol. 15, 470–477. doi: 10.1016/j.conb.2005.07.002
Ohl, F. W., Scheich, H., and Freeman, W. (2001). Change in pattern of ongoing cortical activity with auditory category learning. Nature 412, 733–736. doi: 10.1038/35089076
Ohl, F. W., Scheich, H., and Freeman, W. J. (2000a). Topographic analysis of epidural pure-tone-evoked potentials in gerbil auditory cortex. J. Neurophysiol. 83, 3123–3132. doi: 10.1152/jn.2000.83.5.3123
Ohl, F. W., Schulze, H., Scheich, H., and Freeman, W. J. (2000b). Spatial representation of frequency-modulated tones in gerbil auditory cortex revealed by epidural electrocorticography. J. Physiol. Paris 94, 549–554. doi: 10.1016/S0928-4257(00)01091-3
Ohl, F. W., Wetzel, W., Wagner, T., Rech, A., and Scheich, H. (1999). Bilateral ablation of auditory cortex in mongolian gerbil affects discrimination of frequency modulated tones but not of pure tones. Learn. Mem. 6, 347–362.
Pascual-Marqui, R., Achemann, P., Faber, P., Kinoshita, T., Kochi, K., Nichida, K., et al. (2021). Pervasive false brain connectivity from electrophysiological signals. bioRxiv. 1–13. doi: 10.1101/2021.01.28.428625
Pearl, J. (2009). Causal inference in statistics: an overview. Stat. Surv. 3, 96–146. doi: 10.1214/09-SS057
Pesaran, B., Vinck, M., Einevoll, G. T., Sirota, A., Fries, P., Siegel, M., et al. (2018). Investigating large-scale brain dynamics using field potential recordings: analysis and interpretation. Nat. Neurosci. 21, 903–919. doi: 10.1038/s41593-018-0171-8
Pienkowski, M., and Eggermont, J. J. (2011). Cortical tonotopic map plasticity and behavior. Neurosci. Biobehav. Rev. 35, 2117–2128. doi: 10.1016/j.neubiorev.2011.02.002
Plakke, B., Ng, C.-W., and Poremba, A. (2013). Neural correlates of auditory recognition memory in primate lateral prefrontal cortex. Neuroscience 244, 62–76. doi: 10.1016/j.neuroscience.2013.04.002
Rabinowitz, N. C., Willmore, B. D., King, A. J., and Schnupp, J. W. (2013). Constructing noise-invariant representations of sound in the auditory pathway. PLoS Biol. 11:e1001710. doi: 10.1371/journal.pbio.1001710
Romanski, L. M., Tian, B., Fritz, J., Mishkin, M., Goldman-Rakic, P. S., and Rauschecker, J. P. (1999). Dual streams of auditory afferents target multiple domains in the primate prefrontal cortex. Nat. Neurosci. 2, 1131–1136. doi: 10.1038/16056
Schreiner, C. E., and Winer, J. A. (2007). Auditory cortex mapmaking: principles, projections, and plasticity. Neuron 56, 356–365. doi: 10.1016/j.neuron.2007.10.013
Schulz, A. L., Woldeit, M. L., Gonçalves, A. I., Saldeitis, K., and Ohl, F. W. (2016). Selective increase of auditory cortico-striatal coherence during auditory-cued go/nogo discrimination learning. Front. Behav. Neurosci. 9:368. doi: 10.3389/fnbeh.2015.00368
Seger, C. A., and Miller, E. K. (2010). Category learning in the brain. Ann. Rev. Neurosci. 33, 203–219. doi: 10.1146/annurev.neuro.051508.135546
Seth, A. K., Barrett, A. B., and Barnett, L. (2015). Granger causality analysis in neuroscience and neuroimaging. J. Neurosci. 35, 3293–3297. doi: 10.1523/JNEUROSCI.4399-14.2015
Sokolov, Y., and Kozma, R. (2014). “Stability of dynamic brain models in neuropercolation approximation,” in 2014 IEEE International Conference on Systems, Man, and Cybernetics (SMC) (San Diego, CA), 2230–2233. doi: 10.1109/SMC.2014.6974256
Spirtes, P., Glymour, C. N., Scheines, R., and Heckerman, D. (2000). Causation, Prediction, and Search. Cambridge, MA; London: MIT Press. doi: 10.7551/mitpress/1754.001.0001
Villa, A. E., Eriksson, J., Eriksson, C., Haeberli, C., Hyland, B., and Najem, A. (1999a). Stimulus congruence affects perceptual processes in a novel go/nogo conflict paradigm in rats. Behav. Process. 48, 69–88. doi: 10.1016/S0376-6357(99)00070-4
Villa, A. E., Hyland, B., Tetko, I. V., and Najem, A. (1998). Dynamical cell assemblies in the rat auditory cortex in a reaction-time task. Biosystems 48, 269–277. doi: 10.1016/S0303-2647(98)00074-4
Villa, A. E., Tetko, I. V., Hyland, B., and Najem, A. (1999b). Spatiotemporal activity patterns of rat cortical neurons predict responses in a conditioned task. Proc. Natl. Acad. Sci. U.S.A. 96, 1106–1111. doi: 10.1073/pnas.96.3.1106
Wang, X., Chen, Y., and Ding, M. (2008). Estimating granger causality after stimulus onset: a cautionary note. Neuroimage 41, 767–776. doi: 10.1016/j.neuroimage.2008.03.025
Weinberger, N., Hopkins, W., and Diamond, D. (1984). Physiological plasticity of single neurons in auditory cortex of the cat during acquisition of the pupillary conditioned response: I. primary field (AI). Behav. Neurosci. 98, 171–188. doi: 10.1037/0735-7044.98.2.171
Weinberger, N. M. (2004). Specific long-term memory traces in primary auditory cortex. Nat. Rev. Neurosci. 5, 279–290. doi: 10.1038/nrn1366
Weinberger, N. M. (2007). Associative representational plasticity in the auditory cortex: a synthesis of two disciplines. Learn. Mem. 14, 1–16. doi: 10.1101/lm.421807
Weinberger, N. M. (2015). “New perspectives on the auditory cortex: learning and memory,” in Handbook of Clinical Neurology, Vol. 129, eds M. J. Aminoff, F. Boller, and D. F. Swaab (Amsterdam; Oxford; Waltham, MA: Elsevier), 117–147. doi: 10.1016/B978-0-444-62630-1.00007-X
Weinberger, N. M., and Bakin, J. S. (1998). Learning-induced physiological memory in adult primary auditory cortex: receptive field plasticity, model, and mechanisms. Audiol. Neurotol. 3, 145–167. doi: 10.1159/000013787
Wetzel, W., Ohl, F. W., and Scheich, H. (2008). Global versus local processing of frequency-modulated tones in gerbils: an animal model of lateralized auditory cortex functions. Proc. Natl. Acad. Sci. U.S.A. 105, 6753–6758. doi: 10.1073/pnas.0707844105
Wetzel, W., Wagner, T., Ohl, F., and Scheich, H. (1998). Categorical discrimination of direction in frequency-modulated tones by mongolian gerbils. Behav. Brain Res. 91, 29–39. doi: 10.1016/S0166-4328(97)00099-5
Yokota, R., Aihara, K., Kanzaki, R., and Takahashi, H. (2015). Learning-stage-dependent plasticity of temporal coherence in the auditory cortex of rats. Brain Topogr. 28, 401–410. doi: 10.1007/s10548-014-0359-5
Zhu, J., Chen, Y., Leonardson, A. S., Wang, K., Lamb, J. R., Emilsson, V., et al. (2010). Characterizing dynamic changes in the human blood transcriptional network. PLoS Comput. Biol. 6:e1000671. doi: 10.1371/journal.pcbi.1000671
Keywords: auditory cortex, electrocorticogram, discrimination learning, granger causality, new causality, graph theory, percolation, state transition
Citation: Kozma R, Hu S, Sokolov Y, Wanger T, Schulz AL, Woldeit ML, Gonçalves AI, Ruszinkó M and Ohl FW (2021) State Transitions During Discrimination Learning in the Gerbil Auditory Cortex Analyzed by Network Causality Metrics. Front. Syst. Neurosci. 15:641684. doi: 10.3389/fnsys.2021.641684
Received: 14 December 2020; Accepted: 16 March 2021;
Published: 22 April 2021.
Edited by:
Alessandro E. P. Villa, University of Lausanne, SwitzerlandReviewed by:
Tzai-Wen Chiu, National Chiao Tung University, TaiwanCopyright © 2021 Kozma, Hu, Sokolov, Wanger, Schulz, Woldeit, Gonçalves, Ruszinkó and Ohl. This is an open-access article distributed under the terms of the Creative Commons Attribution License (CC BY). The use, distribution or reproduction in other forums is permitted, provided the original author(s) and the copyright owner(s) are credited and that the original publication in this journal is cited, in accordance with accepted academic practice. No use, distribution or reproduction is permitted which does not comply with these terms.
*Correspondence: Robert Kozma, cmtvem1hQG1lbXBoaXMuZWR1; Frank W. Ohl, ZnJhbmsub2hsQGxpbi1tYWdkZWJ1cmcuZGU=
Disclaimer: All claims expressed in this article are solely those of the authors and do not necessarily represent those of their affiliated organizations, or those of the publisher, the editors and the reviewers. Any product that may be evaluated in this article or claim that may be made by its manufacturer is not guaranteed or endorsed by the publisher.
Research integrity at Frontiers
Learn more about the work of our research integrity team to safeguard the quality of each article we publish.