 Zijie Li
 Ling Qin
- Department of Physiology, China Medical University, Shenyang, China
Objective: Auditory steady-state response (ASSR) is a gamma oscillation evoked by periodic auditory stimuli, which is commonly used in clinical electroencephalographic examination to evaluate the neurological functions. Though it has been suggested that auditory cortex is the origin of ASSR, how the laminar architecture of the neocortex contributes to the ASSR recorded from the brain surface remains unclear.
Methods: We used a 16-channel silicon probe to record the local field potential and the single-unit spike activity in the different layers of the auditory cortex of unanesthetized mice. Click-trains with a repetition rate at 40-Hz were present as sound stimuli to evoke ASSR.
Results: We found that the LFPs of all cortical layers showed a stable ASSR synchronizing to the 40-Hz click stimuli, while the ASSR was strongest in the granular (thalamorecipient) layer. Furthermore, time-frequency analyses also revealed the strongest coherence between the signals recorded from the granular layer and pial surface.
Conclusion: Our results reveal that the 40-Hz ASSR primarily shows the evoked gamma oscillation of thalamorecipient layers in the neocortex, and that the ASSR may be a biomarker to detect the cognitive deficits associated with impaired thalamo-cortical connection.
Introduction
Recording the electrical activity of neurons, such as an electroencephalogram (EEG), is an effective means to evaluate the brain function. Recently, accumulating evidence suggests that auditory steady-state response (ASSR), measured non-invasively using an EEG, is an effective approach to evaluate the neural function in mental illness, including depression (Oda et al., 2012; Isomura et al., 2016; Zhou et al., 2018) and schizophrenia (Uhlhaas and Singer, 2010; Thuné et al., 2016), and in neuropharmacological experiments on animal models (Leishman et al., 2015; Shahriari et al., 2016; Sivarao et al., 2016). The ASSR is an electrophysiological response entrained to both the frequency and the phase of rapid, periodic auditory stimuli (Galambos et al., 1981; Brenner et al., 2009). EEG measurement of ASSR in the gamma frequency range (40-Hz) is often assumed to reflect the integrity of the sensory pathways and the capacity of these pathways to generate synchronous activity.
The physiological processes generating ASSR are still being studied. Many results of magnetoencephalography (MEG) studies on human subjects have suggested that the auditory cortex (AC) may be a source of ASSR (Herdman et al., 2003; Teale et al., 2008; Lazzouni et al., 2010; Kuriki et al., 2013; Bharadwaj et al., 2014). This is also supported by some electrophysiological recording results from animal experiments (Wang et al., 2019). It should be noted that one of the most prominent features of the mammalian neocortex is the laminar architecture in cortical information processing. It has been shown that the primary thalamic afferents, which drive the sensory responses, mainly projects toward the granular layers of the AC (Romanski and LeDoux, 1993; Kimura et al., 2003; Winer and Lee, 2007). In contrast, the supra- and infragranular layers do not receive the same proportion of inputs from the thalamus, but mediate the corticocortical connections for the feedback and feedforward pathways (Felleman and Van Essen, 1991). Previous electrophysiological studies on rodents have found that the neurons in the different layers of the AC exhibited different spontaneous and sensory-evoked activities, showing differences in the flow of information through cortical circuits (Rouiller et al., 1991; Hromádka et al., 2008; Sakata and Harris, 2009), and revealed differential involvements of supragranular, granular, and infragranular layers in auditory attentional processes (Ramayya et al., 2014; De Martino et al., 2015; Francis et al., 2018) and multisensory interactions (Lakatos et al., 2007). There have been many studies on the laminar profiles of electrical rhythm in the sensory regions of the neocortex (Lakatos et al., 2005; Haegens et al., 2015; Sotero et al., 2015; Senzai et al., 2019). However, the role of laminar architecture of the AC in the origin of ASSR remains elusive. To reveal the origin of ASSR from the layer-dependent neural activities, here, we analyzed the laminar multielectrode data recorded in the AC of unanesthetized mice to explore how the local field potential (LFP) and the single-unit spike activity (SUA) in different cortical layers contributes to the ASSR recorded at the pial surface. We found a non-uniform distribution of neural response evoked by a 40-Hz click-train across the layers of the AC, and the strongest generators of ASSR are in the granular cortical layers.
Materials and Methods
Animals
All experiments were performed in adult female (n = 8) KM mice between 6 and 8 weeks of age weighing between 18–25 g. Mice were housed on a 12 h/12 h day/night cycle. Mice were free to eat and drink. All procedures were approved by the Animal Ethics Committee (CEUA) of China Medical University (No. KT2018060). All surgeries were performed under anesthesia, and all efforts were made to minimize animal suffering.
Surgical Procedures
Mice were anesthetized with isoflurane in conjunction with air (3% for induction and 1–2% for maintenance) and fixed in a stereotaxic apparatus with blunt ear bars (#68001, RWD Life science, Shenzhen, China). After shaving the hair, to expose the skull, an incision was made and the skull surface was cleaned with hydrogen peroxide solution (5%) and dried off with an air puffer. The skull was positioned such that the lambda and bregma marks were aligned on the anteroposterior and dorsoventral axes. A custom-designed headpost was attached to the skull with four screws for head fixation. The headpost was fixed with dental cement for later recording. Mice recovered 2 weeks before the experiments began. Analgesic was given once before and for 3 days following surgery.
Electrophysiological Recording
After the animals recovered from surgery, they were habituated with the experimental devices in a sound-attenuated recording room. The mice were head-fixed on a custom-made frame through the headpost. The body rested atop a disk, which was mounted on a low-friction, silent rotor. This habituation procedure lasted for 30 min per day and was repeated for 3 days. On the fourth day, the mice were briefly anesthetized with isoflurane, and a 500 μm diameter craniotomy was performed on top of the AC (AP −3.0 mm; ML −4.0 mm; DV 2.0 mm, Figure 1A). The dura was removed and the craniotomy was protected with saline. After the animal completely recovered from anesthesia, a single-shank linear silicon electrode with 16 recording sites spacing regularly at a 50 um distance (Neuro-Nexus, A1 × 16–3.8 mm-50-177) was inserted into the AC perpendicular to the brain surface. Ground and reference electrodes were positioned on the interparietal bone. The electrode was mounted on a remotely controlled manipulator (MO-10, Narishige, Japan) and gradually penetrated into the cortex under audio-visual monitoring the recorded electrophysiological signals. The penetration was held after the top recording site just entered the brain tissue (Figure 1B), indicated by an abrupt change of a potential wave pattern. After determining the laminar structure using a noise sound stimulus, the recording experiment of a click-train stimulus started. At the end of the recording session, a small chamber was built around the craniotomy with cement and filled with ointment. The chamber was removed before each subsequent recording session and rebuilt after it. Typically, each animal was recorded for four to seven sessions.
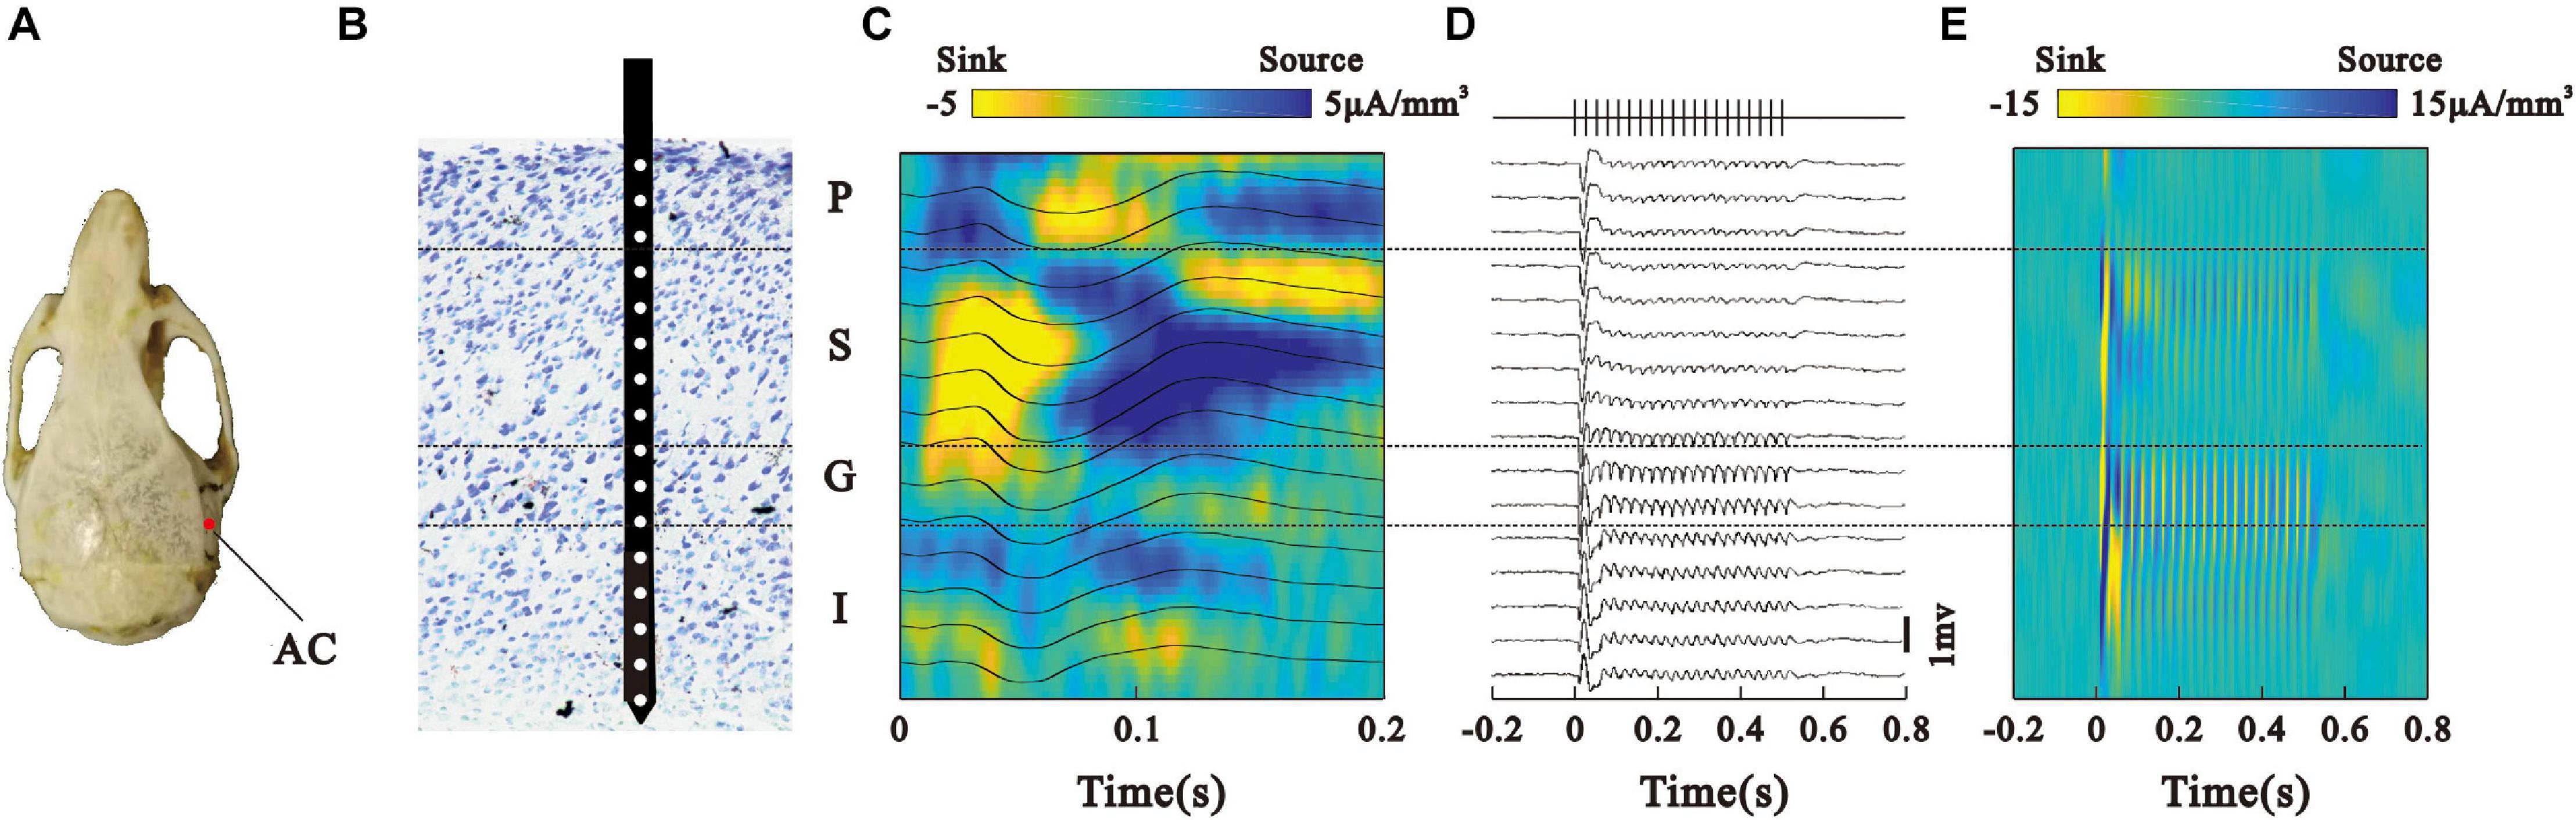
Figure 1. Laminar bistability profile of LFPs in the AC. (A) Projection point of the AC on the skull. (B) Laminar structure of cortex and the recording electrode location. (C) Noise-evoked LFPs (black line) recorded from different sites in the AC and average current source density (CSD) map. (D) LFPs in response to the 40-Hz click-train stimulus. Vertical lines at the top represent the click-train stimulus. (E) CSD map constructed by the LFPs in panel (D).
Acoustic Stimuli
When the silicon probe reached an AC column, broadband noise bursts were used to evoke the CSD pattern to find the laminar position. The noise was 80 ms in duration, 70 dB, 75 trials in one session, and 1.5 s interval. We used a train of click sounds as sound stimulus to evaluate ASSR. One click of the click-train was a 0.2 ms duration rectangular pulse. The click-train lasted for 0.5 s and repeated for 40 cycles/s. MATLAB (Mathworks, United States) was used to digitally generate 100 kHz of sampling rate waveforms. A D/A board (PCI-6052E, National Instruments, United States) was used to transfer the waveform to an analog signal, and a loudspeaker (K701, AKG, Vienna, Austria) was used to play it. The click-train intensity was adjusted to 70 dB SPL and measured at the middle of the recording box (Brüuel and Kjaer type 2,238 sound level meter, Naerum, Danish). In one session, 120 trials of click-train were played at a random interval between 4 and 8 s.
Acquisition and Analysis of Electrophysiological Data
The microwire output was delivered to a multi-channel preamplifier (RA16PA; TDT, Alachua, FL, United States), then to a digital signal processing module (RZ-5; TDT). The signal was amplified and split into LFP (0.1–300 Hz) and SUA (300–5,000 Hz) range by filtering. The data was imported into the MATLAB for analysis. The current-source density (CSD) was calculated as the second spatial derivative of the LFP signal according to the following formula:
Where V is the potential at position h and Δh is the distance between the electrodes. CSD represents the net current density entering or leaving the extracellular medium at a particular spatial position. Noise-evoked columnar CSD patterns were used to determine the layer of the AC. Ten milliseconds after the sound started, a brief current sink appears (Figure 1C). The granular layer of the AC was determined by this biomarker (Kaur et al., 2005; Leszczyński et al., 2020). Normally, three channels were assigned to the granular layers. The position of the granular layer was used to identify the positions of the supragranular and infragranular layers.
We used a custom-written Matlab script to analyze the LFPs evoked by the click-trains at 40 Hz. The 120 trials of LFP recorded in one session were analyzed by a wavelet-based analysis algorithm embedded in the eeglab toolbox1 to calculate the mean trial power (MTP) and phase-locking factor (PLF) (Delorme and Makeig, 2004). The MTP is obtained by calculating the power distribution in the spectral-temporal domain for each trial, and then constructing a mean spectral-temporal function averaged across one recording session. The PLF in one session described the phase synchronization across individual trials of LFP at particular frequencies and time intervals. For the data recorded from one session, the MTP and PLF were calculated to obtain a spectral-temporal function using the multitaper method provided by the eeglab. The results presented as a relative estimation of the ratio between the values after stimulus onset and baseline value (stimulus/pre-stimulus). We also calculated the evoked power by subtracting the non-phase locking compartments (induced power) from the total power (Steinschneider et al., 2008).
All spike detection and sorting took place off-line using the OpenSorter software (TDT). Peristimulus time histogram (PSTH) of each trial was constructed by calculating the instantaneous firing rate (1 ms bin) from SUA for each stimulus presentation from 500 ms pre- to 1,000 ms post-stimulus-onset. Then, PSTH was smoothened with a 5 ms Gaussian sliding window.
Neural Contribution to the ASSR of Pial Surface
Referring to the anatomical characteristics of the AC (Hackett et al., 2001), we used the LFP signal recorded from the top electrode channel to represent the signal at the pial surface of the AC. We calculated the coherence between the LFPs of pial and deeper layers by using the eeglab toolbox function “newcross” to research which laminar LFP is the origin of the pial surface ASSR. Event-related phase coherence (ERCOH) is a phase coupling factor between the two signals. The ERCOH result is a spectral-temporal function and the values are between zero (0) and one (1). The value indicates the phase and amplitude level of coherence between the two signals.
Granger causality was used to examine the flow of information between the cortical layers. Granger causality is based on the concept of time series prediction. For two simultaneously measured time series, one series can be called causal to the other if we can better predict the second series by incorporating past knowledge of the first one. Granger causality has been applied to reveal the generator of alpha current in a monkey’s visual cortex (Bollimunta et al., 2008, 2011). We conducted Granger causality analysis on the CSDs obtained from the different cortical layers. To test whether the Granger causality value is significantly greater than zero, a random permutation approach was adopted (Bollimunta et al., 2008). We randomly shuffled trial indices to create a synthetic ensemble of trials. Such random permutations were repeated many times, resulting in a distribution of causality value that corresponds to the null hypothesis of no statistical interdependence. The causality value calculated from the actual data is compared with this baseline null hypothesis distribution for the assessment of significance levels (p < 0.01).
Phase-Locking of SUA to LFP
We also calculated the phase-locking between the pia LFP and SUAs recorded at the different layers by using the spike-field coherence (SFC) analysis. SFC is commonly used to compute phase synchronization between spikes LFPs (Gregoriou et al., 2009; Jutras et al., 2009; Chalk et al., 2010). All LFPs from each layer group were averaged to rule out the possible contamination of spikes (Waldert et al., 2013). The cohgramcpt function (nine tapers, five time-band width) of the Chronux toolbox was used to obtain the power spectra of PSTH and LFP. Then, we computed the coherence between spikes and LFPs using the formula below (Fries et al., 2001; Jarvis and Mitra, 2001).
SSL indicates the cross-spectrum between spikes and LFPs. SS and SL indicate the autospectra of spikes and LFPs, respectively. If there is no phase synchronization between spikes and LFPs, the value of CSL will be zero. CSL will be one if they are perfectly synchronized.
Histology
We confirm the position and depth of the electrode at the end of the experiment. Electrodes were confirmed by microscopic observation. All electrodes were implanted into correct positions.
Statistical Analysis
Kruskal–Wallis test was performed on the comparisons between the data of the different layers. Each Kruskal–Wallis test reporting significant effects was followed by the Tukey’s post hoc test of multiple comparison.
Results
Laminar Profile of LFPs Evoked by 40-Hz Click-Trains
We investigated the neural activities generating ASSR by analyzing the LFP and accompanying SUA signals in the mouse’s AC (eight animals, 42 experimental sessions) recorded with laminar multi electrodes. Figure 1A shows the electrode location in the skull. We firstly used the CSD responses to noise sounds to localize the laminar profile of cortical LFPs (Figures 1B,C), then analyzed their spatiotemporal relationship to the ASSR recorded at the pial surface, and determined the neuronal generators of ASSR in the AC. Consistent with earlier work (Sakata and Harris, 2009; Guo et al., 2017; Leszczyński et al., 2020), we localized the LFPs into four groups: pial surface (P), supragranular (S), granular (G), and infragranular (I) layer. Next, we present the representative LFPs averaged across 120 click-train stimulus trials in one session (Figure 1D). The LFPs showed a larger deflection at the onset of stimulation, and a train of adapted response synchronizing to the stimulus frequency (40-Hz) during the steady state of stimulation. We also constructed a laminar map of CSD driven by click-train stimulus, which showed strong responses in the G and S layers (Figure 1E).
To conduct a quantitative comparison between the layers, we divided the LFPs into four groups according to the CSD profile and plotted the mean LFPs averaged across each group in Figures 2A–D. To compare the LFP oscillation with the stimulus frequency, the LFPs were further filtered through a linear-phase FIR bandpass filter of 35 − 45 Hz (Figures 2E–H). This process was fulfilled using the “eegfilt” function in the EEGLAB toolbox, which caused a little shifting of signal onset in the temporal domain. All groups of LFP displayed a big fluctuate at the onset of stimulus, followed by a clear oscillation throughout the stimulus period (ASSR), while the response amplitude was largest in the G layer.
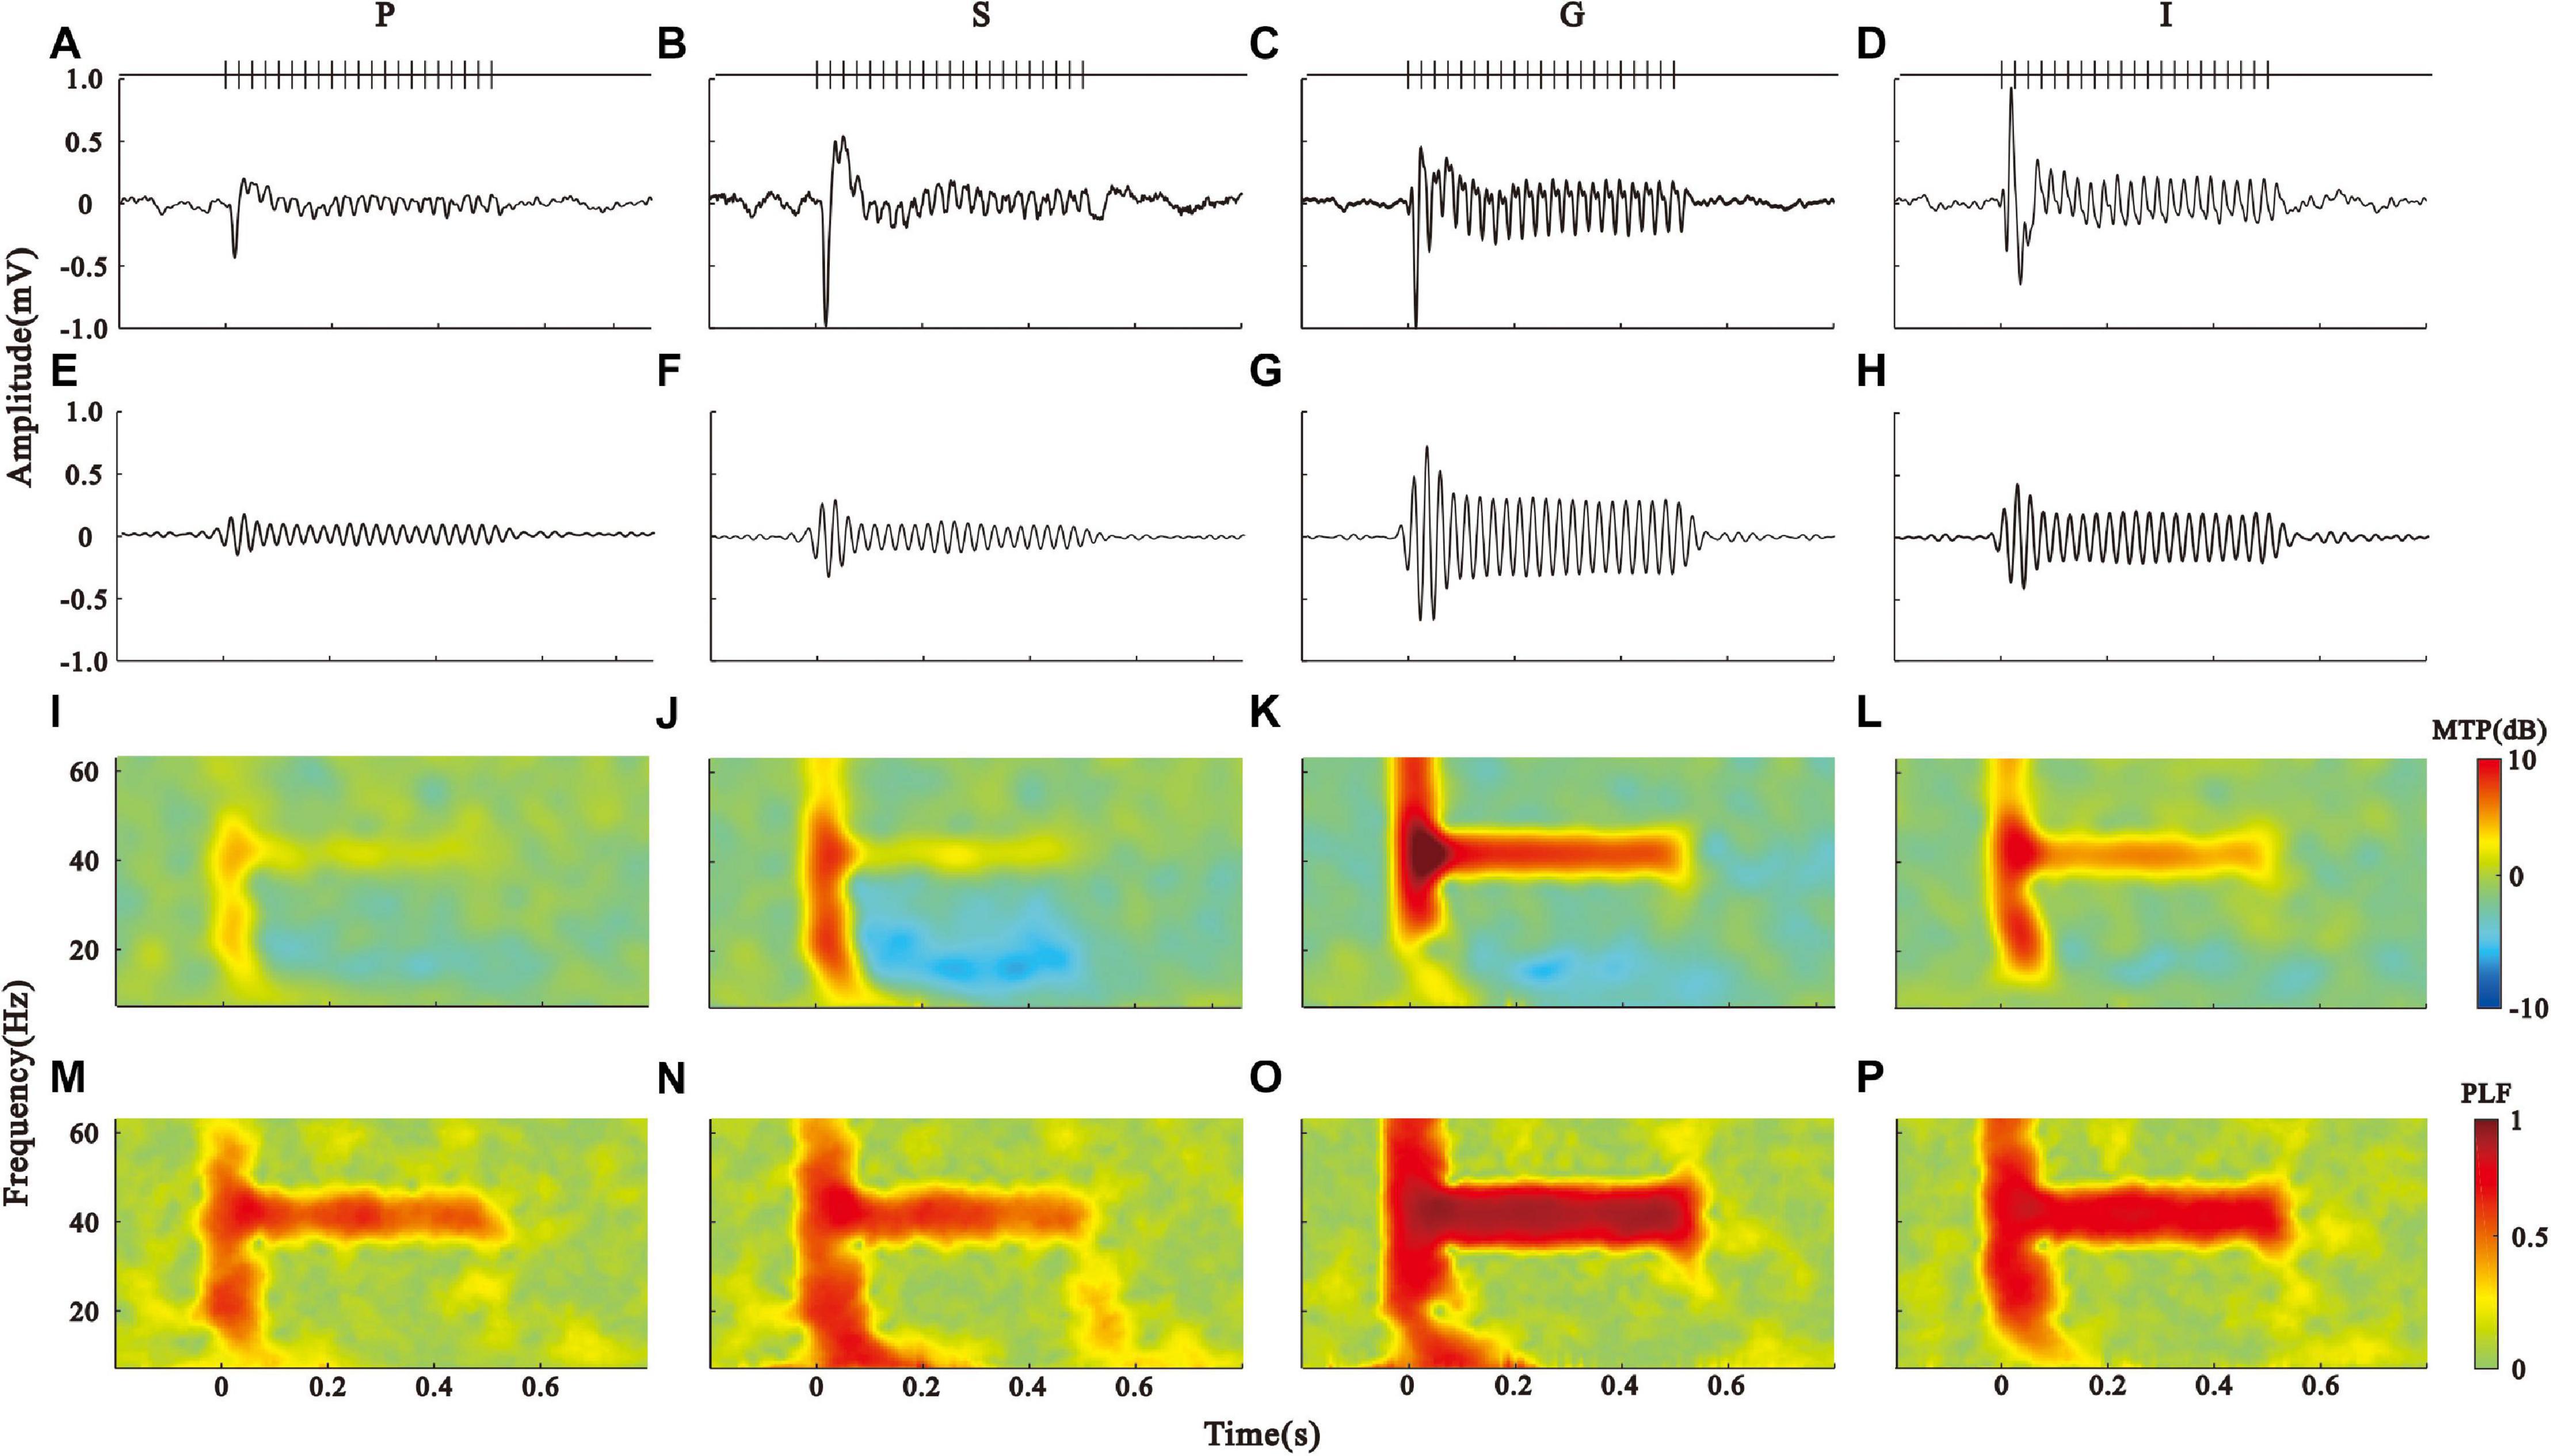
Figure 2. Layer-specific ASSR patterns in the AC. (A–D) Click-train evoked LFPs averaged across the pia (P), supragranular (S), granular (G), and infragranular (I) layers, respectively. (E–H) 35–45 Hz filtered LFPs. (I–L) spectral-temporal function of MTP in the P, S, G, and I layers. (M–P) spectral-temporal function of PLF in the P, S, G, and I layers.
To assess the ASSR, we conducted the spectrotemporal analysis of MTP (Figures 2I–L) and PLF (Figures 2M–P) on the LFPs. The population results of MTP and PLF are presented by the time function of MTP and PLF averaged across the 35–45 Hz frequency range (Figures 3A,B). These results were further quantified by calculating the 40-Hz MTP and PLF values averaged across the 35–45 Hz frequency and 0.2–0.5 s post-stimulus time window. The MTP and PLF locking to the stimulus frequency (40 Hz) were significantly higher in the G layer than those in other layers (Figures 3D,E, Kruskal–Wallis test, MTP: F(3,164) = 77.30, ITC: F(3,164) = 22.93, ∗∗p < 0.01, ∗p < 0.05, Tukey’s multiple comparison). We also calculated the evoked power of ASSR to remove the induced power of a non-phase locking response. The differences of evoked power between the layers were consistent with that of MTP (Figures 3C,F, Kruskal–Wallis test, F(3,164) = 28.28, ∗∗p < 0.01, Tukey’s multiple comparison). These results suggest that the G layer is the origin of the 40-Hz ASSR in the AC.
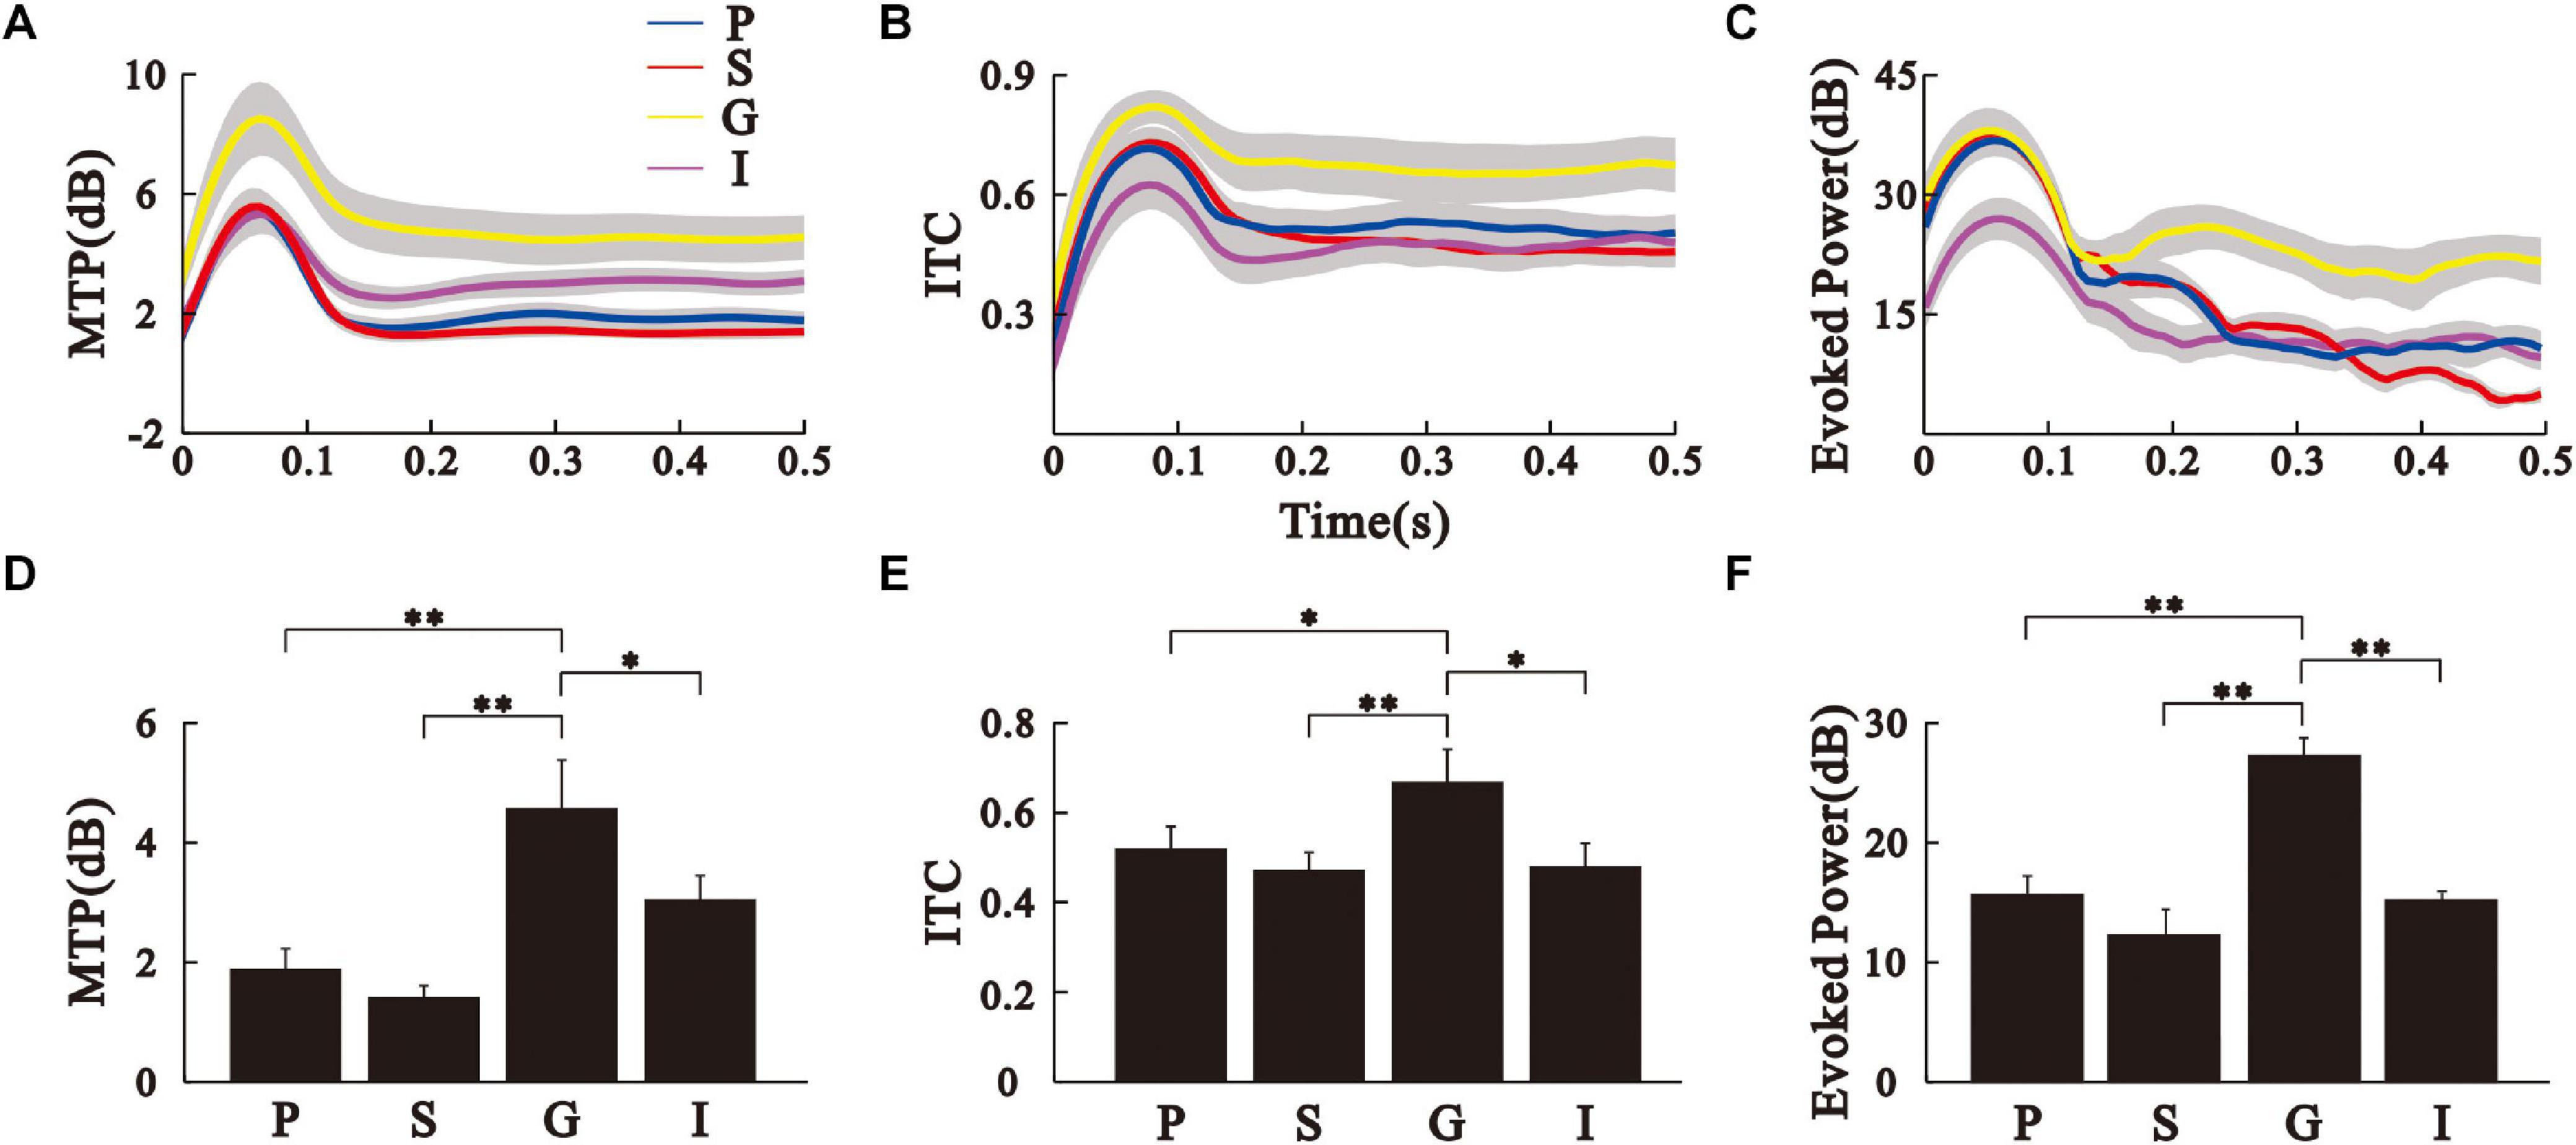
Figure 3. Comparison of MTP, PLF, and evoked power between the different AC layers. (A–C) time function of MTP, PLF, and evoked power of the different AC layers averaged over eight animals. Sold line represents mean, shade area represents SE. (D–F) Bar graph shows the mean and SE of MTP, PLF, and evoked power values averaged across the 35–45 Hz frequency and 0.2–0.5 s post-stimulus time window. ∗∗p < 0.01, ∗p < 0.05, Kruskal–Wallis test followed by Tukey’s multiple comparison.
Coherence Between the LFPs of Pial Surface and Deep Layers
Next, we examined the coherence between the LFPs of the different layers (ERCOH) to reveal the potential source of pial ASSR. An example for one session and one animal of the ERCOH spectrum (between 0 and 60 Hz) averaged over trials was shown (Figure 4A). We observed an obvious increase of ERCOH at 40-Hz between the G and P layers, and between the I and P layers during the steady post-stimulus period. The consequences of 40-Hz coherences averaged over sessions and animals were shown in mean and SE (Figure 4B). Figure 4C displays that the mean ERCOH (35–45 Hz frequency range, 0.2–0.5 s post-stimulus time window) between the P and G layers was significantly higher than the other two pairs [Kruskal–Wallis, F(2,123) = 89.11, ∗∗ p < 0.01, ∗p < 0.05, Tukey’s multiple comparison].
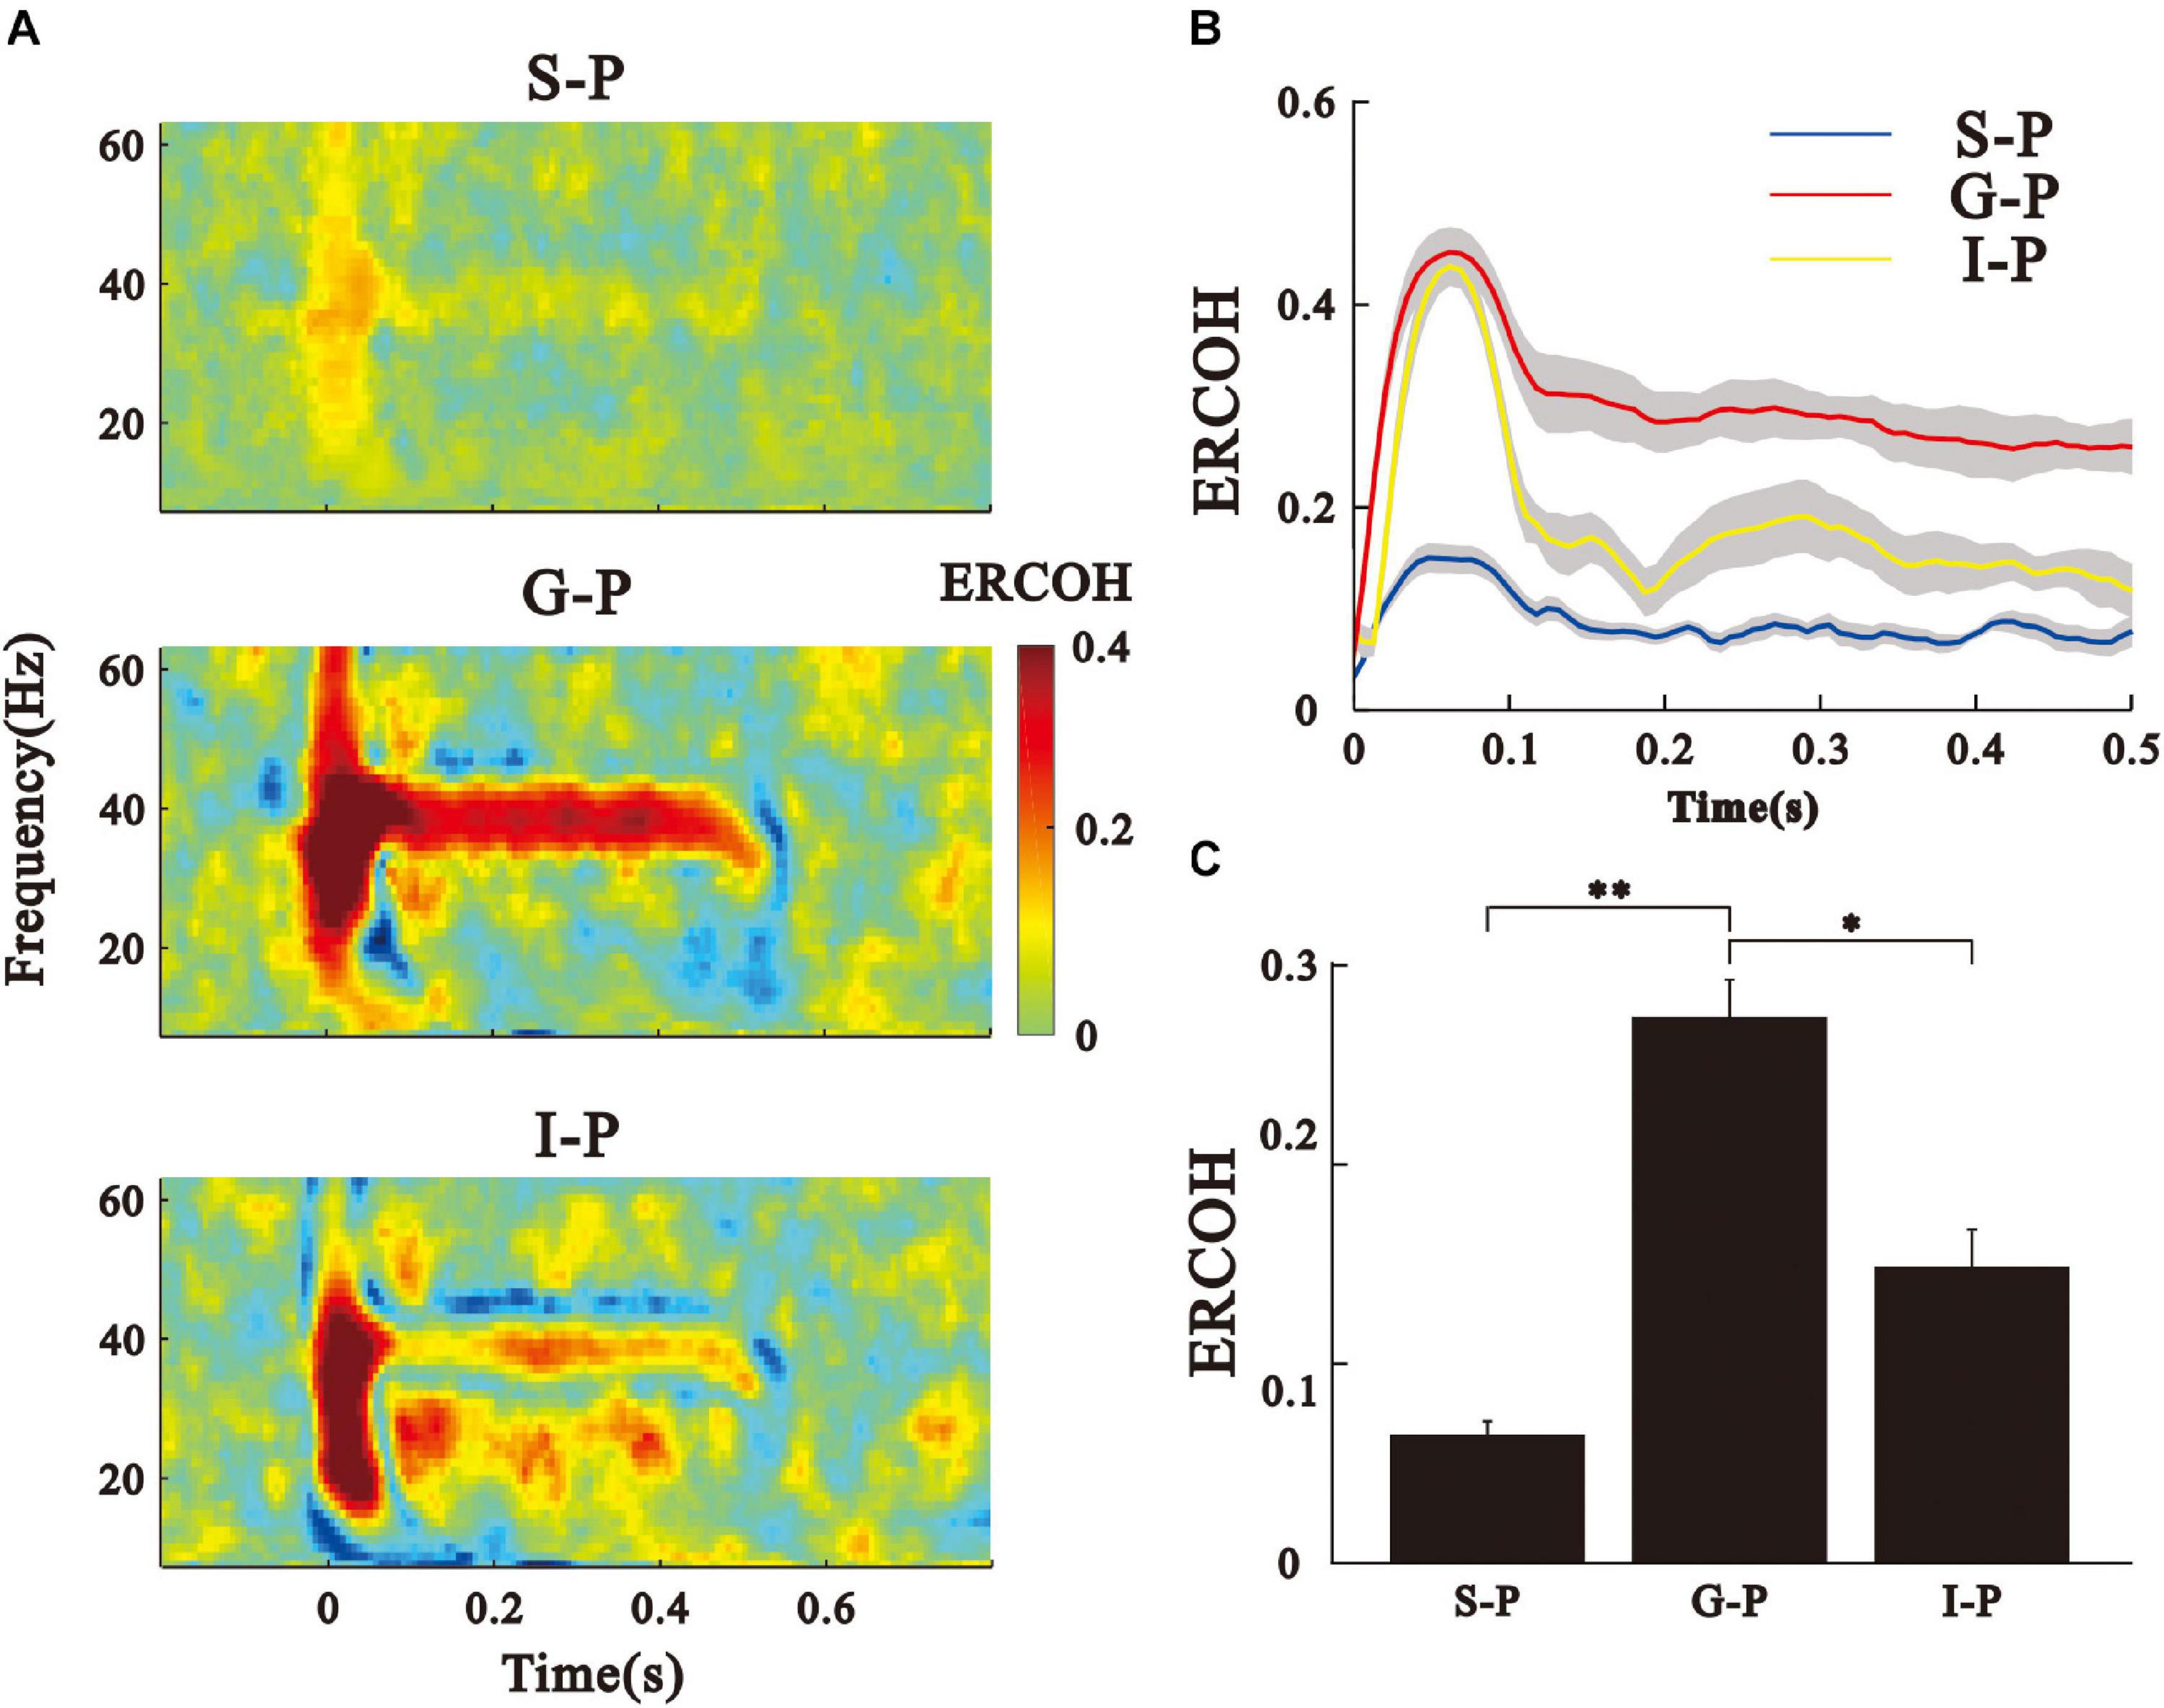
Figure 4. ERCOH between the LFPs of pial surface and deep layers. (A) Spectral-temporal function of ERCOH between the P layer and other layers. (B) Time function of ERCOH (35–45 Hz) of the different pairs of layers averaged over eight animals. Sold line represents mean, shade area represents SE. (C) Bar graph shows the mean and SE of ERCOH values averaged across the 35–45 Hz frequency and 0.2–0.5 s post-stimulus time window. ∗∗p < 0.01, ∗p < 0.05, Kruskal–Wallis test followed by Tukey’s multiple comparison.
Laminar Profile of CSD
To exclude the potential effect of volume conduction on LFP, we analyzed the CSD of 40 Hz ASSR. Figure 5A shows the laminar profile of CSD of the representative recording. The CSDs were calculated from the 35 − 45 Hz filtered LFPs, similar to those shown in Figures 2E–H. Consistent with the results based on the LFP signals, 40 Hz CSD was strongest in the G layer, weakest in the P layer, and intermediate in the S and I layers (Figure 5B, Kruskal–Wallis, F(3,164) = 40.67, ∗∗p < 0.01, Tukey’s multiple comparison).
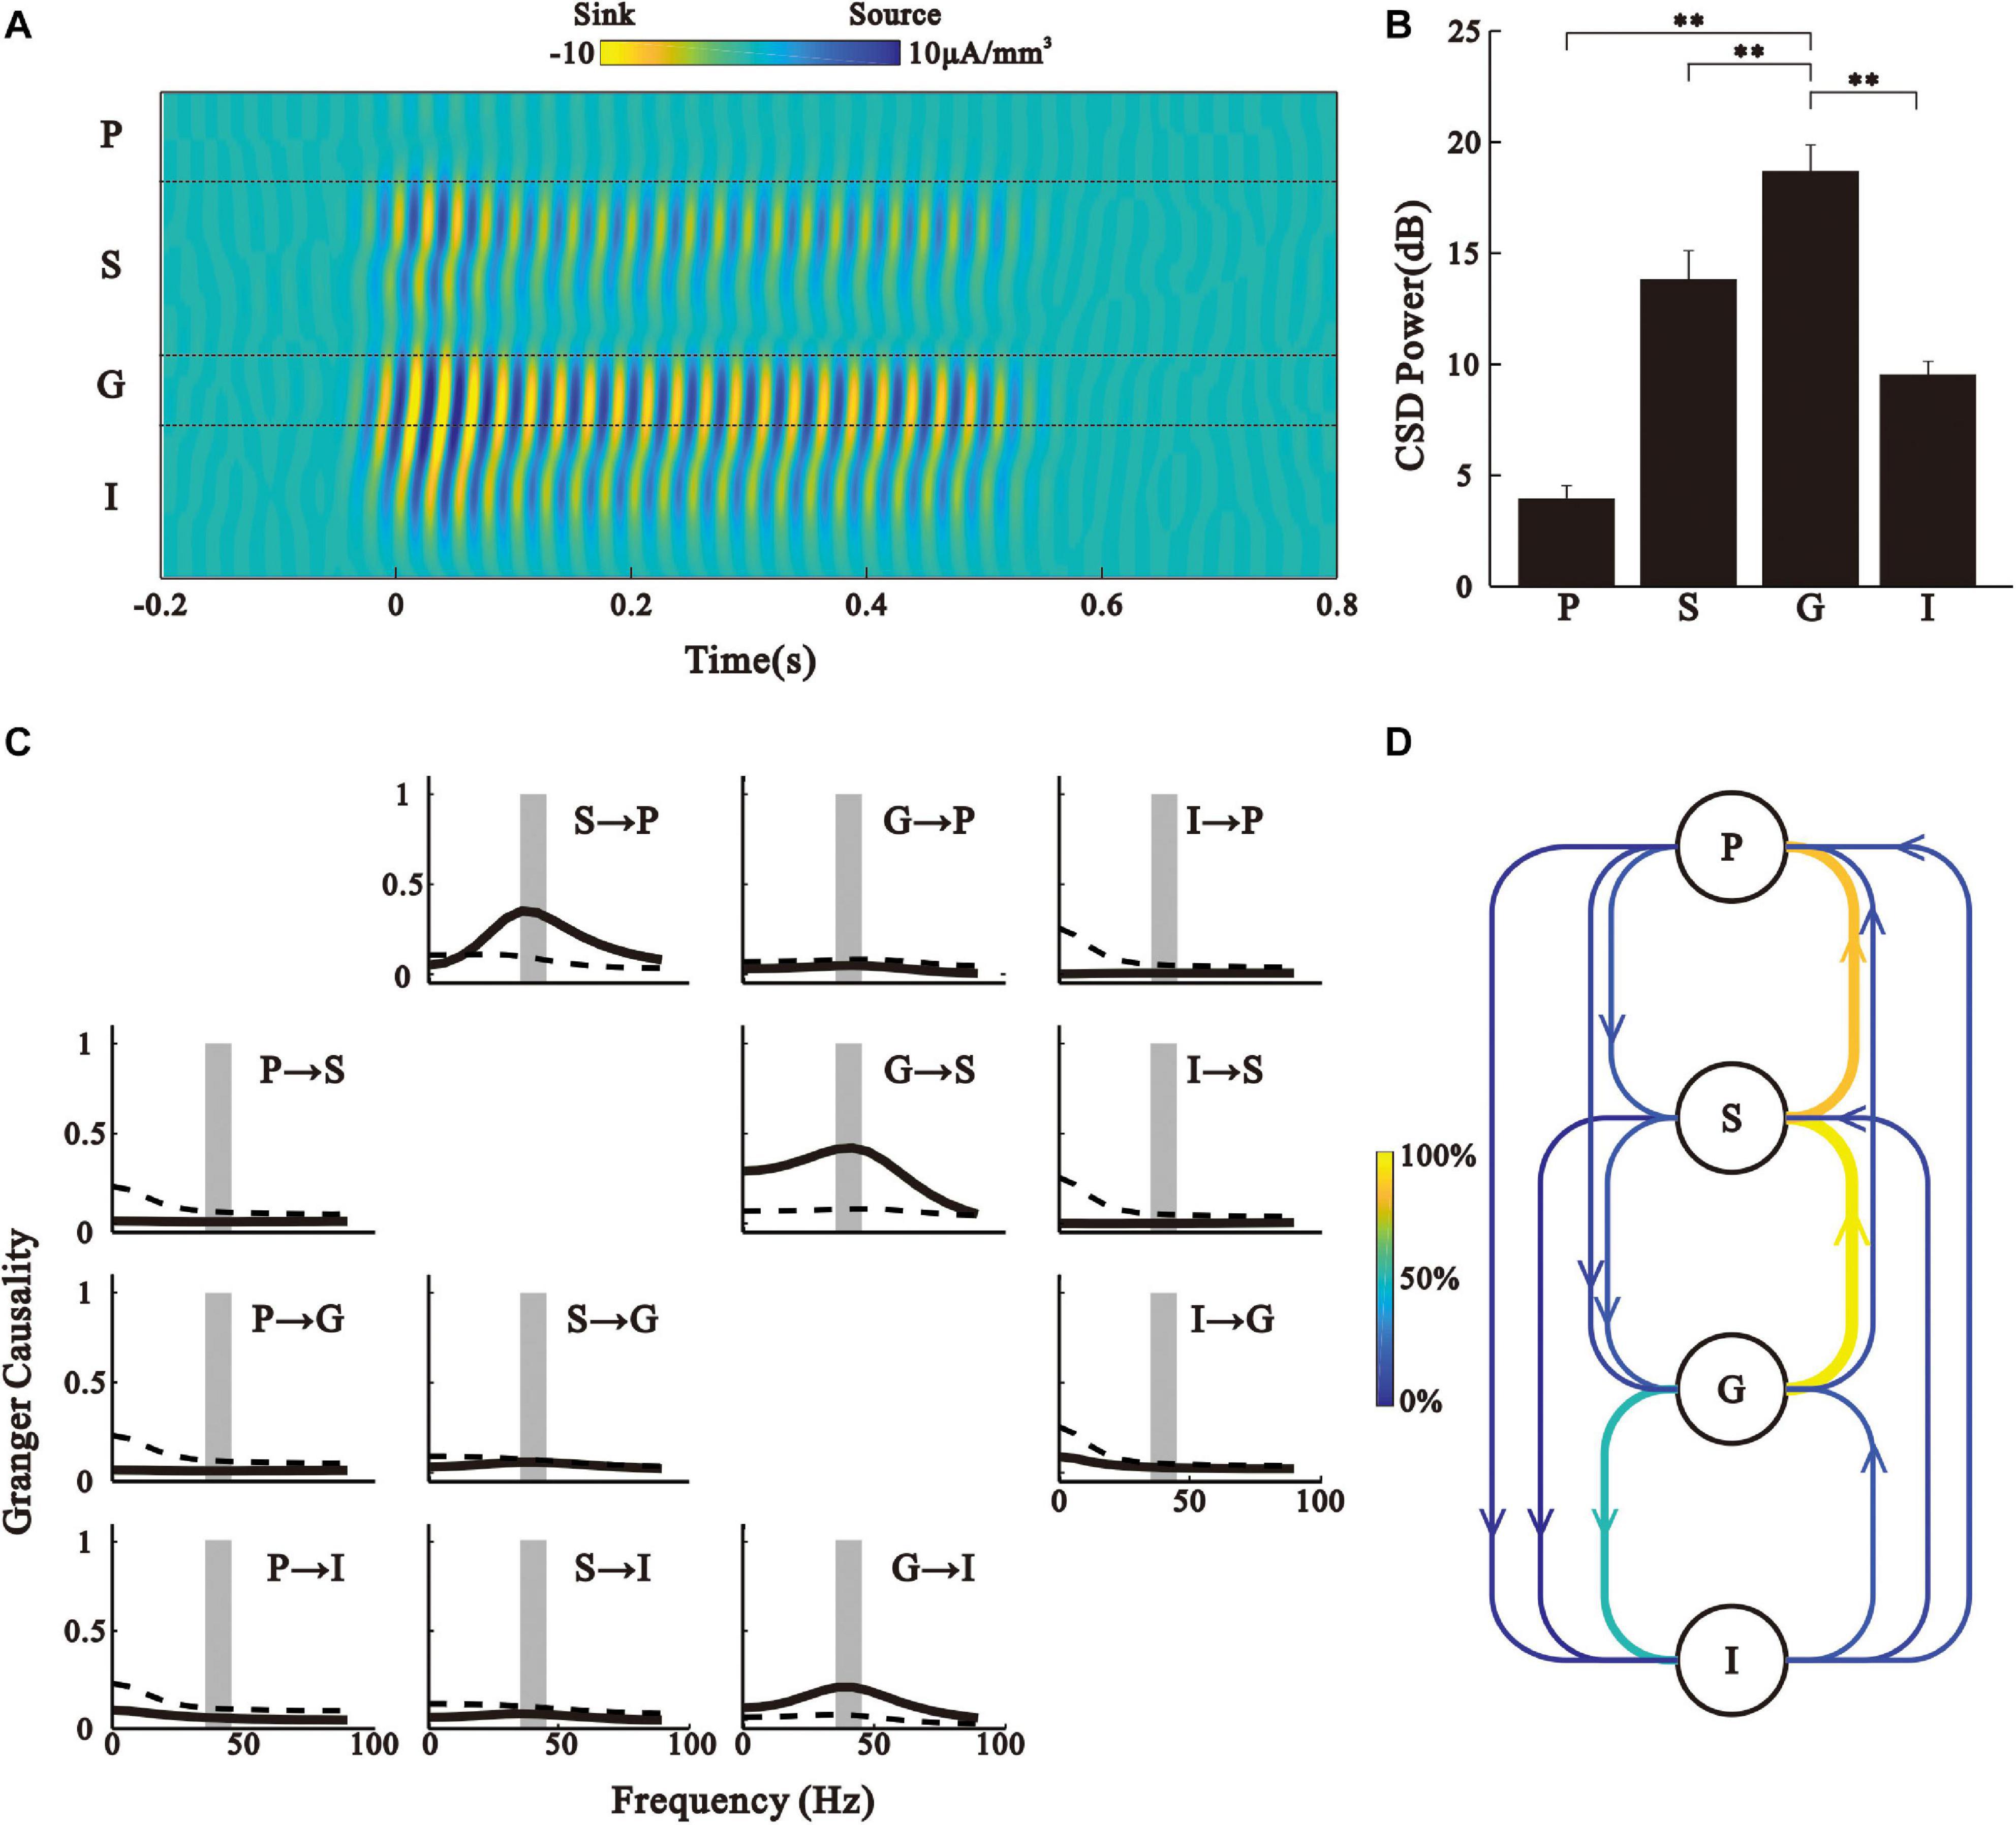
Figure 5. CSD analysis. (A) Laminar map of 35–45 Hz CSD driven by 40 Hz click-train for the example in Figure 1. (B) Bar graph shows the mean and SE of CSD power during 0.2–0.5 s post-stimulus time window. ∗∗p < 0.01, Kruskal–Wallis test followed by Tukey’s multiple comparison. (C) Granger causality spectra for different layer pairs for the example in Figure 1. The y-axis is the target and x-axis is the driver (i.e., panel xy, where x is the row index of the panel and y is the column index, shows the Granger causality spectrum for x- > y). Solid line is the Granger causality spectrum. Dashed line shows the threshold level of statistical significance (p < 0.01, random permutation approach). Vertical shaded strip marks the frequency band of 35–45 Hz. (D) Schematic representation of directional information flow between different layers. Color of an arrow represents the percentage of significant Granger causality observed in all the recorded trials.
We further used Granger causality analysis to examine directional causal influences between the CSDs of the different layers, and found a significant peak at the spectrum of Granger causality around 40 Hz in the direction of G- > S, G- > I, and S- > P (Figure 5C). For the population analysis results of each layer pair, we counted the percentage of occurrence of a significant Granger causality peak in the 35 − 45 Hz range to represent the strength of directional information flow (Figure 5D). These results further suggest that the G layer is the generator of ASSR in the AC.
Phase-Locking of SUA to the LFP of Pial Surface
We also used SFC to investigate synchronization between the neuronal activities of different cortical layers and the pial ASSR. The examples of SUA recorded from the different layers of AC in one electrode penetration (Figure 6A). The firing rate of neurons in the S layer demonstrated a transient increase at the stimulus onset, which rapidly flowed to the background level during the steady period of stimulus. In contrast, neurons in the G layer could periodically fire synchronizing to the stimuli. Neurons in the I layer exhibited a discharge pattern intermediating between those of the S and G layers. For each SUA, we conducted a SFC analysis with the simultaneously recorded LFP in the P layer. This analysis confirmed that the strongest 40-Hz phase locking during the stimulus period occurred between the SUA of the G layer and LFP of the P layer (Figure 6B, Kruskal–Wallis, F(2,273) = 201.17, ∗∗p < 0.01, Tukey’s multiple comparison). It should be notified that the SUA and LFP signals were obtained through the band pass filters with different frequency bands, therefore, SUAs cannot directly contribute to LFP. The coherence between them only suggests that the ASSR of LFP recorded in the pial layer correlated with the SUAs in the G layer.
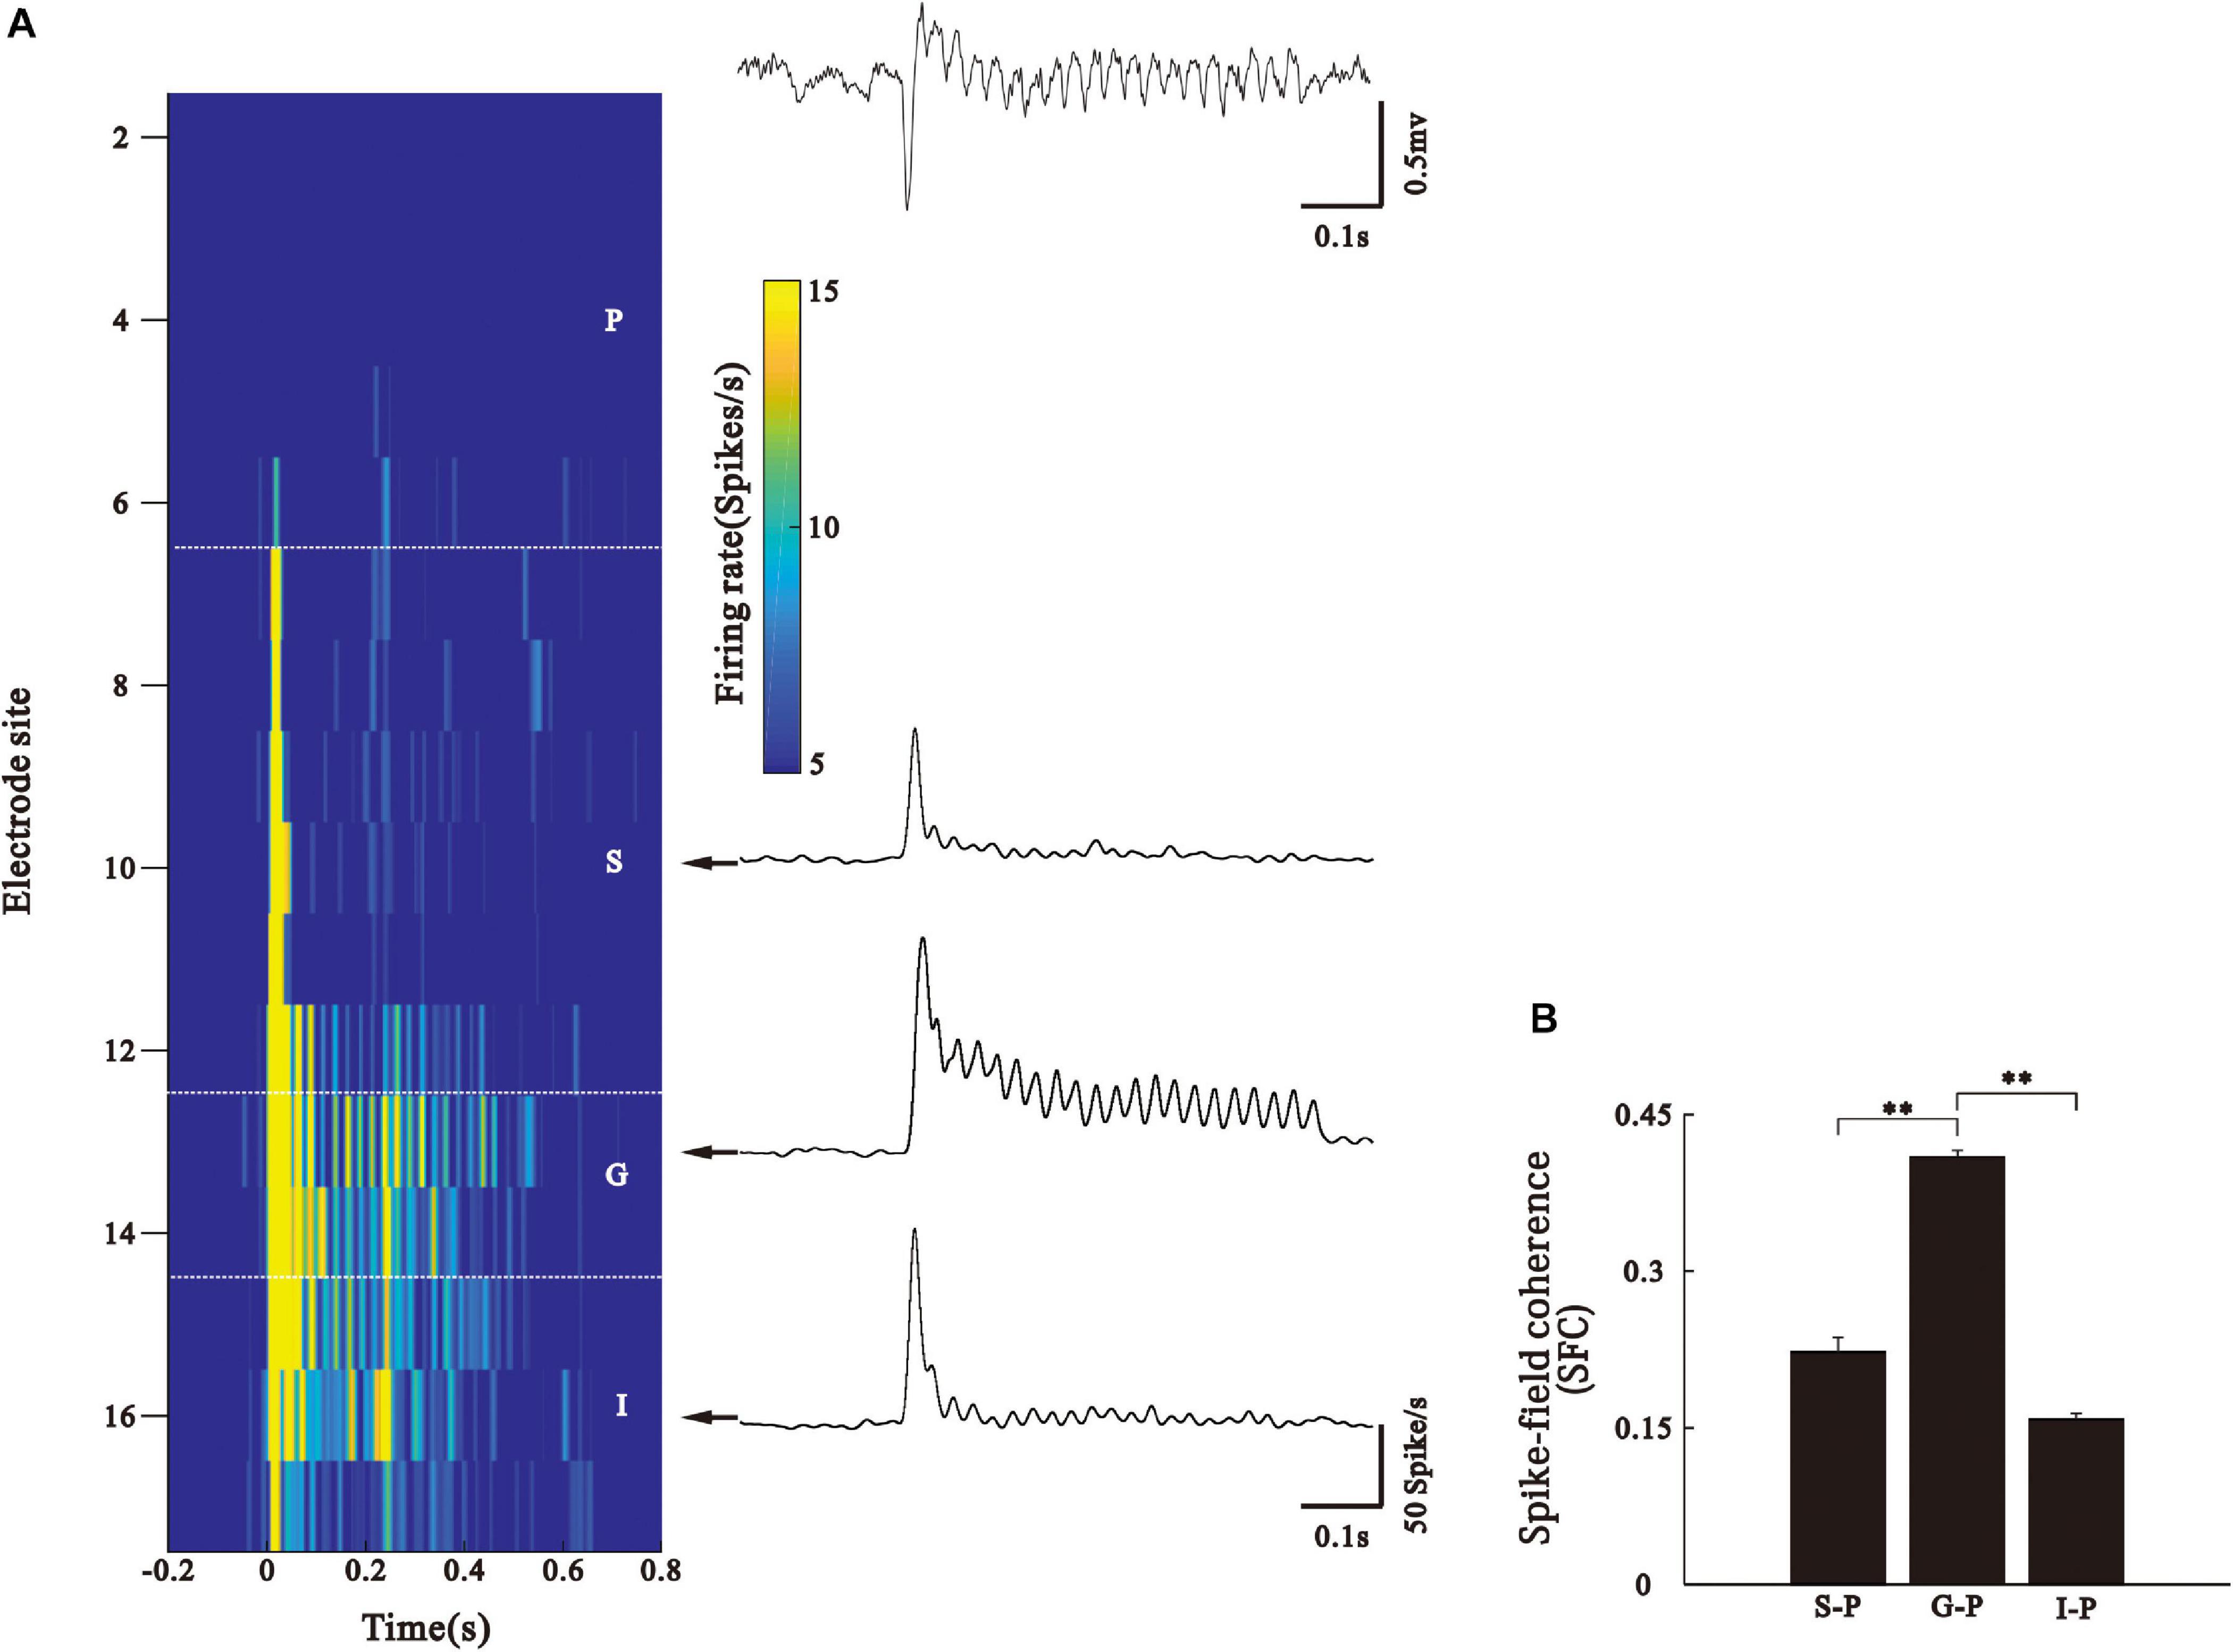
Figure 6. Phase-locking of SUA to the LFP of pial surface. (A) Left: firing rate of SUA (represented by color) simultaneously recorded from different layers. Right: LFP recorded at pial surface and representative PSTH in each layer. (B) Bar graph shows mean and SE of SFC values averaged across the 35–45 Hz frequency and 0.2–0.5 s post-stimulus time window. ∗∗p < 0.01, Kruskal–Wallis test followed by Tukey’s multiple comparison.
Discussion
Gamma oscillations are well-known features of cortical activity, which may play an important role in local gain control (Cardin, 2016; Sohal, 2016) and signal transmission among cortical networks (Akam and Kullmann, 2010; Fries, 2015). Though the mechanism of gamma oscillations still is not entirely clear (Butler and Paulsen, 2014; Bastos et al., 2015; Ray and Maunsell, 2015; Lasztóczi and Klausberger, 2016; Sohal, 2016), alterations in gamma oscillations have been used as a biomarker of cortical functions (Herrmann and Demiralp, 2005; Uhlhaas and Singer, 2006, 2010; Basar-Eroglu et al., 2007; Antonoudiou et al., 2020). Forty Hertz (40-Hz) ASSR is a gamma oscillation evoked by auditory stimuli, which is commonly measured with the use of an EEG in the clinic to evaluate the neurological functions. Uncovering the neural source of 40-Hz ASSR is helpful to close the gap between human neurological manifestations and animal electrophysiology consequences. Thus, it is necessary to investigate the correlation between ASSR of the EEG recorded from the brain surface and the neural electric signals recorded inside the cortex. In this study, we compared the laminar structure of CSD, LFP, and SUA evoked by 40-Hz click-trains in the AC. We found that the neural activity showed the strongest synchrony in presumptive thalamorecipient layers (G layers), and the ASSR recorded in the pial surface was the most correlative with the activation of thalamorecipient layers.
Previous anatomical and physiological evidence shows that auditory responses in the AC originate mainly from the thalamic afferents, which is biased toward the granule layers (Romanski and LeDoux, 1993; Kimura et al., 2003; Winer and Lee, 2007). Consistent with this, 40-Hz click-trains evoked the strongest activation in putative thalamorecipient layers (G layers), from where spreading to the S and I layers. It has been shown that the S and I layers mediate corticocortical connections (Felleman and Van Essen, 1991), which are involved in attentional processes (O’Connell et al., 2014; De Martino et al., 2015; Francis et al., 2018) and multisensory interactions (Lakatos et al., 2007). Our results show that the strength of ASSR in the S and I layers was significantly lower than that in the G layers, indicating that the rhythmic thalamocortical signals are inhibited as transmission in the cortex. Functional connectivity with higher-order cortical areas may contribute to the inhibition of ASSR transmission. For example, top-down projections from the prefrontal cortex have been found to target neurons in the S layer in the AC (Jones et al., 2011; Medalla and Barbas, 2014; Plakke and Romanski, 2014). Future studies measuring ASSR simultaneously in laminar profiles of the AC and higher-order cortex will help to clarify the cortico-cortical network dynamics of ASSR associating with sensory behavioral. Furthermore, there are also other possible reasons; for example, the inhibitory input from the G layer to the S layer within the cortical column may be faster than the excitatory input, which reduces the responsibility of S layer neurons to a click-train stimulus. Several studies on the somatosensory cortex have shown that both parvalbumin-expressing (PV+) interneurons and pyramidal neurons in the thalamorecipient layers receive direct thalamic inputs, but PV+ interneurons respond faster than pyramidal neurons (Sermet et al., 2019; Yu et al., 2019). Thus, the cell-type-specific study is necessary to reveal the intracortical regulation mechanism of ASSR.
It has been suggested that the generation of gamma rhythms depends on the inhibitory interneurons spiking. The fast synaptic inhibition inhibiting the firing of excitatory pyramidal cells is one reason (Bartos et al., 2007; Buzsáki and Wang, 2012; Kim et al., 2016; Chen et al., 2017; Veit et al., 2017). PV+ interneurons target the perisomatic domain of pyramidal neurons. In the brain, it is important for gamma oscillations generating and maintaining (Hájos and Paulsen, 2009; Tukker et al., 2013; Cardin, 2016). PV+ interneurons are adapted for fast synchronization of network activity, as they resonate at gamma frequencies and exert strong perisomatic inhibition that is capable of precisely controlling spike timing (Cardin et al., 2009; Hu et al., 2014; Kohus et al., 2016). In addition, dendrite-targeting somatostatin-expressing (SST +) interneurons are also suggested to contribute to the generation of gamma oscillation (Chen et al., 2017; Veit et al., 2017; Hakim et al., 2018; Antonoudiou et al., 2020). Studies on the rodent somatosensory cortex found that SST + interneurons can provide differential inhibition in a cortical layer specific way to excitatory neurons (Xu et al., 2013). How the SST and PV sub-system cooperate to influence the dynamics of gamma oscillations remains unclear. Consider that PV neurons are frequently found in thalamorecipient layers and have large, fast synaptic conductance and short membrane time-constants, they might be the main contributor to the early and strong CSD of ASSR observed in the G layer. Direct thalamic input to SST neurons is weak (Cruikshank et al., 2010; Audette et al., 2018). SST neurons receive intracortical inputs from both pyramidal and inhibitory neurons (Yu et al., 2019). The rapid and large input from PV neurons may delay and reduce the response of SST neurons, which perhaps contribute to the CSD of ASSR in the S and G layers. These speculations require being examined in the future using cell-type-specific methods.
In conclusion, we found that 40-Hz ASSR primarily reflects the evoked gamma oscillation of thalamorecipient layers in the neocortex. Accumulating evidence suggests that the defects in the thalamo-cortical pathway are associated with schizophrenia (Woodward et al., 2012; Giraldo-Chica et al., 2018; Kupferschmidt and Gordon, 2018), and aberrant gamma oscillations are also consistently observed in the studies with schizophrenia patients (Ferrarelli et al., 2008; Gonzalez-Burgos and Lewis, 2008; Uhlhaas and Singer, 2010; Jadi et al., 2016; Zhou et al., 2018). Therefore, our current finding suggests that ASSR of EEG recording can be used as a biomarker to examine the function of thalamo-cortical circuit and detect the cognitive deficits associated with impaired gamma oscillation.
Data Availability Statement
The raw data supporting the conclusions of this article will be made available by the authors, without undue reservation.
Ethics Statement
The animal study was reviewed and approved by Animal Ethics Committee (CEUA) of China Medical University.
Author Contributions
ZL was primarily responsible for experiment studies and statistical analysis. SW, JL, JC, and XW assisted with statistical collection and analysis. LQ was primarily responsible for statistical analysis and manuscript editing. All authors contributed to and approved of the final version of the manuscript.
Funding
This work was supported by the grants from the National Natural Science Foundation of China under grant 31671080 (to LQ) and Key Research and Development Project of Liaoning Province (2020JH2/10100014 to LQ).
Conflict of Interest
The authors declare that the research was conducted in the absence of any commercial or financial relationships that could be construed as a potential conflict of interest.
Footnotes
References
Akam, T., and Kullmann, D. M. (2010). Oscillations and filtering networks support flexible routing of information. Neuron 67, 308–320. doi: 10.1016/j.neuron.2010.06.019
Antonoudiou, P., Tan, Y. L., Kontou, G., Upton, A. L., and Mann, E. O. (2020). Parvalbumin and somatostatin interneurons contribute to the generation of hippocampal gamma oscillations. J. Neurosci. 40, 7668–7687. doi: 10.1523/JNEUROSCI.0261-20.2020
Audette, N. J., Urban-Ciecko, J., Matsushita, M., and Barth, A. L. (2018). POm thalamocortical input drives layer-specific microcircuits in somatosensory cortex. Cereb. Cortex 28, 1312–1328. doi: 10.1093/cercor/bhx044
Bartos, M., Vida, I., and Jonas, P. (2007). Synaptic mechanisms of synchronized gamma oscillations in inhibitory interneuron networks. Nat. Rev. Neurosci. 8, 45–56. doi: 10.1038/nrn2044
Basar-Eroglu, C., Brand, A., Hildebrandt, H., Karolina Kedzior, K., Mathes, B., and Schmiedt, C. (2007). Working memory related gamma oscillations in schizophrenia patients. Int. J. Psychophysiol. 64, 39–45. doi: 10.1016/j.ijpsycho.2006.07.007
Bastos, A. M., Vezoli, J., and Fries, P. (2015). Communication through coherence with inter-areal delays. Curr. Opin. Neurobiol. 31, 173–180. doi: 10.1016/j.conb.2014.11.001
Bharadwaj, H. M., Lee, A. K., and Shinn-Cunningham, B. G. (2014). Measuring auditory selective attention using frequency tagging. Front. Integr. Neurosci. 8:6. doi: 10.3389/fnint.2014.00006
Bollimunta, A., Chen, Y., Schroeder, C. E., and Ding, M. (2008). Neuronal mechanisms of cortical alpha oscillations in awake-behaving macaques. J. Neurosci. 28, 9976–9988. doi: 10.1523/JNEUROSCI.2699-08.2008
Bollimunta, A., Mo, J., Schroeder, C. E., and Ding, M. (2011). Neuronal mechanisms and attentional modulation of corticothalamic α oscillations. J. Neurosci. 31, 4935–4943. doi: 10.1523/JNEUROSCI.5580-10.2011
Brenner, C. A., Krishnan, G. P., Vohs, J. L., Ahn, W. Y., Hetrick, W. P., Morzorati, S. L., et al. (2009). Steady state responses: electrophysiological assessment of sensory function in schizophrenia. Schizophr. Bull. 35, 1065–1077. doi: 10.1093/schbul/sbp091
Butler, J. L., and Paulsen, O. (2014). The hippocampal cacophony: multiple layers of communication. Neuron 84, 251–253. doi: 10.1016/j.neuron.2014.10.017
Buzsáki, G., and Wang, X. J. (2012). Mechanisms of gamma oscillations. Annu. Rev. Neurosci. 35, 203–225. doi: 10.1146/annurev-neuro-062111-150444
Cardin, J. A. (2016). Snapshots of the brain in action: local circuit operations through the lens of γ oscillations. J. Neurosci. 36, 10496–10504. doi: 10.1523/JNEUROSCI.1021-16.2016
Cardin, J. A., Carlén, M., Meletis, K., Knoblich, U., Zhang, F., Deisseroth, K., et al. (2009). Driving fast-spiking cells induces gamma rhythm and controls sensory responses. Nature 459, 663–667. doi: 10.1038/nature08002
Chalk, M., Herrero, J. L., Gieselmann, M. A., Delicato, L. S., Gotthardt, S., and Thiele, A. (2010). Attention reduces stimulus-driven gamma frequency oscillations and spike field coherence in V1. Neuron 66, 114–125. doi: 10.1016/j.neuron.2010.03.013
Chen, G., Zhang, Y., Li, X., Zhao, X., Ye, Q., Lin, Y., et al. (2017). Distinct inhibitory circuits orchestrate cortical beta and gamma band oscillations. Neuron 96, 1403.e6–1418.e6. doi: 10.1016/j.neuron.2017.11.033
Cruikshank, S. J., Urabe, H., Nurmikko, A. V., and Connors, B. W. (2010). Pathway-specific feedforward circuits between thalamus and neocortex revealed by selective optical stimulation of axons. Neuron 65, 230–245. doi: 10.1016/j.neuron.2009.12.025
De Martino, F., Moerel, M., Ugurbil, K., Goebel, R., Yacoub, E., and Formisano, E. (2015). Frequency preference and attention effects across cortical depths in the human primary auditory cortex. Proc. Natl. Acad. Sci. U.S.A. 112, 16036–16041. doi: 10.1073/pnas.1507552112
Delorme, A., and Makeig, S. (2004). EEGLAB: an open source toolbox for analysis of single-trial EEG dynamics including independent component analysis. J. Neurosci. Methods 134, 9–21. doi: 10.1016/j.jneumeth.2003.10.009
Felleman, D. J., and Van Essen, D. C. (1991). Distributed hierarchical processing in the primate cerebral cortex. Cereb. Cortex 1, 1–47. doi: 10.1093/cercor/1.1.1
Ferrarelli, F., Massimini, M., Peterson, M. J., Riedner, B. A., Lazar, M., Murphy, M. J., et al. (2008). Reduced evoked gamma oscillations in the frontal cortex in schizophrenia patients: a TMS/EEG study. Am. J. Psychiatry 165, 996–1005. doi: 10.1176/appi.ajp.2008.07111733
Francis, N. A., Elgueda, D., Englitz, B., Fritz, J. B., and Shamma, S. A. (2018). Laminar profile of task-related plasticity in ferret primary auditory cortex. Sci. Rep. 8:16375. doi: 10.1038/s41598-018-34739-3
Fries, P. (2015). Rhythms for cognition: communication through coherence. Neuron 88, 220–235. doi: 10.1016/j.neuron.2015.09.034
Fries, P., Reynolds, J. H., Rorie, A. E., and Desimone, R. (2001). Modulation of oscillatory neuronal synchronization by selective visual attention. Science 291, 1560–1563. doi: 10.1126/science.1055465
Galambos, R., Makeig, S., and Talmachoff, P. J. (1981). A 40-Hz auditory potential recorded from the human scalp. Proc. Natl. Acad. Sci. U.S.A. 78, 2643–2647. doi: 10.1073/pnas.78.4.2643
Giraldo-Chica, M., Rogers, B. P., Damon, S. M., Landman, B. A., and Woodward, N. D. (2018). Prefrontal-thalamic anatomical connectivity and executive cognitive function in schizophrenia. Biol. Psychiatry 83, 509–517. doi: 10.1016/j.biopsych.2017.09.022
Gonzalez-Burgos, G., and Lewis, D. A. (2008). GABA neurons and the mechanisms of network oscillations: implications for understanding cortical dysfunction in schizophrenia. Schizophr. Bull. 34, 944–961. doi: 10.1093/schbul/sbn070
Gregoriou, G. G., Gotts, S. J., Zhou, H., and Desimone, R. (2009). High-frequency, long-range coupling between prefrontal and visual cortex during attention. Science 324, 1207–1210. doi: 10.1126/science.1171402
Guo, W., Clause, A. R., Barth-Maron, A., and Polley, D. B. (2017). A corticothalamic circuit for dynamic switching between feature detection and discrimination. Neuron 95, 180.e5–194.e5. doi: 10.1016/j.neuron.2017.05.019
Hackett, T. A., Preuss, T. M., and Kaas, J. H. (2001). Architectonic identification of the core region in auditory cortex of macaques, chimpanzees, and humans. J. Comp. Neurol. 441, 197–222. doi: 10.1002/cne.1407
Haegens, S., Barczak, A., Musacchia, G., Lipton, M. L., Mehta, A. D., Lakatos, P., et al. (2015). Laminar profile and physiology of the α rhythm in primary visual, auditory, and somatosensory regions of neocortex. J. Neurosci. 35, 14341–14352. doi: 10.1523/JNEUROSCI.0600-15.2015
Hájos, N., and Paulsen, O. (2009). Network mechanisms of gamma oscillations in the CA3 region of the hippocampus. Neural. Netw. 22, 1113–1119. doi: 10.1016/j.neunet.2009.07.024
Hakim, R., Shamardani, K., and Adesnik, H. (2018). A neural circuit for gamma-band coherence across the retinotopic map in mouse visual cortex. Elife 7:e28569. doi: 10.7554/eLife.28569
Herdman, A. T., Wollbrink, A., Chau, W., Ishii, R., Ross, B., and Pantev, C. (2003). Determination of activation areas in the human auditory cortex by means of synthetic aperture magnetometry. Neuroimage 20, 995–1005. doi: 10.1016/S1053-8119(03)00403-8
Herrmann, C. S., and Demiralp, T. (2005). Human EEG gamma oscillations in neuropsychiatric disorders. Clin. Neurophysiol. 116, 2719–2733. doi: 10.1016/j.clinph.2005.07.007
Hromádka, T., Deweese, M. R., and Zador, A. M. (2008). Sparse representation of sounds in the unanesthetized auditory cortex. PLoS Biol. 6:e16. doi: 10.1371/journal.pbio.0060016
Hu, H., Gan, J., and Jonas, P. (2014). Interneurons. Fast-spiking, parvalbumin+ GABAergic interneurons: from cellular design to microcircuit function. Science 345:1255263. doi: 10.1126/science.1255263
Isomura, S., Onitsuka, T., Tsuchimoto, R., Nakamura, I., Hirano, S., Oda, Y., et al. (2016). Differentiation between major depressive disorder and bipolar disorder by auditory steady-state responses. J. Affect Disord. 190, 800–806. doi: 10.1016/j.jad.2015.11.034
Jadi, M. P., Behrens, M. M., and Sejnowski, T. J. (2016). Abnormal gamma oscillations in N-Methyl-D-Aspartate receptor hypofunction models of schizophrenia. Biol. Psychiatry 79, 716–726. doi: 10.1016/j.biopsych.2015.07.005
Jarvis, M. R., and Mitra, P. P. (2001). Sampling properties of the spectrum and coherency of sequences of action potentials. Neural Comput. 13, 717–749. doi: 10.1162/089976601300014312
Jones, T. A., Jones, S. M., Vijayakumar, S., Brugeaud, A., Bothwell, M., and Chabbert, C. (2011). The adequate stimulus for mammalian linear vestibular evoked potentials (VsEPs). Hear. Res. 280, 133–140. doi: 10.1016/j.heares.2011.05.005
Jutras, M. J., Fries, P., and Buffalo, E. A. (2009). Gamma-band synchronization in the macaque hippocampus and memory formation. J. Neurosci. 29, 12521–12531. doi: 10.1523/JNEUROSCI.0640-09.2009
Kaur, S., Rose, H. J., Lazar, R., Liang, K., and Metherate, R. (2005). Spectral integration in primary auditory cortex: laminar processing of afferent input, in vivo and in vitro. Neuroscience 134, 1033–1045. doi: 10.1016/j.neuroscience.2005.04.052
Kim, D., Jeong, H., Lee, J., Ghim, J. W., Her, E. S., Lee, S. H., et al. (2016). Distinct roles of parvalbumin- and somatostatin-expressing interneurons in working memory. Neuron 92, 902–915. doi: 10.1016/j.neuron.2016.09.023
Kimura, A., Donishi, T., Sakoda, T., Hazama, M., and Tamai, Y. (2003). Auditory thalamic nuclei projections to the temporal cortex in the rat. Neuroscience 117, 1003–1016. doi: 10.1016/s0306-4522(02)00949-1
Kohus, Z., Káli, S., Rovira-Esteban, L., Schlingloff, D., Papp, O., Freund, T. F., et al. (2016). Properties and dynamics of inhibitory synaptic communication within the CA3 microcircuits of pyramidal cells and interneurons expressing parvalbumin or cholecystokinin. J. Physiol. (Lond.) 594, 3745–3774. doi: 10.1113/JP272231
Kupferschmidt, D. A., and Gordon, J. A. (2018). The dynamics of disordered dialogue: prefrontal, hippocampal and thalamic miscommunication underlying working memory deficits in schizophrenia. Brain Neurosci. Adv. 2:2398212818771821. doi: 10.1177/2398212818771821
Kuriki, S., Kobayashi, Y., Kobayashi, T., Tanaka, K., and Uchikawa, Y. (2013). Steady-state MEG responses elicited by a sequence of amplitude-modulated short tones of different carrier frequencies. Hear. Res. 296, 25–35. doi: 10.1016/j.heares.2012.11.002
Lakatos, P., Chen, C. M., O’Connell, M. N., Mills, A., and Schroeder, C. E. (2007). Neuronal oscillations and multisensory interaction in primary auditory cortex. Neuron 53, 279–292. doi: 10.1016/j.neuron.2006.12.011
Lakatos, P., Shah, A. S., Knuth, K. H., Ulbert, I., Karmos, G., and Schroeder, C. E. (2005). An oscillatory hierarchy controlling neuronal excitability and stimulus processing in the auditory cortex. J. Neurophysiol. 94, 1904–1911. doi: 10.1152/jn.00263.2005
Lasztóczi, B., and Klausberger, T. (2016). Hippocampal place cells couple to three different gamma oscillations during place field traversal. Neuron 91, 34–40. doi: 10.1016/j.neuron.2016.05.036
Lazzouni, L., Ross, B., Voss, P., and Lepore, F. (2010). Neuromagnetic auditory steady-state responses to amplitude modulated sounds following dichotic or monaural presentation. Clin. Neurophysiol. 121, 200–207. doi: 10.1016/j.clinph.2009.11.004
Leishman, E., O’Donnell, B. F., Millward, J. B., Vohs, J. L., Rass, O., Krishnan, G. P., et al. (2015). Phencyclidine disrupts the auditory steady state response in rats. PLoS One 10:e0134979. doi: 10.1371/journal.pone.0134979
Leszczyński, M., Barczak, A., Kajikawa, Y., Ulbert, I., Falchier, A. Y., Tal, I., et al. (2020). Dissociation of broadband high-frequency activity and neuronal firing in the neocortex. Sci. Adv. 6:eabb0977. doi: 10.1126/sciadv.abb0977
Medalla, M., and Barbas, H. (2014). Specialized prefrontal “auditory fields”: organization of primate prefrontal-temporal pathways. Front. Neurosci. 8:77. doi: 10.3389/fnins.2014.00077
O’Connell, M. N., Barczak, A., Schroeder, C. E., and Lakatos, P. (2014). Layer specific sharpening of frequency tuning by selective attention in primary auditory cortex. J. Neurosci. 34, 16496–16508. doi: 10.1523/JNEUROSCI.2055-14.2014
Oda, Y., Onitsuka, T., Tsuchimoto, R., Hirano, S., Oribe, N., Ueno, T., et al. (2012). Gamma band neural synchronization deficits for auditory steady state responses in bipolar disorder patients. PLoS One 7:e39955. doi: 10.1371/journal.pone.0039955
Plakke, B., and Romanski, L. M. (2014). Auditory connections and functions of prefrontal cortex. Front. Neurosci. 8:199. doi: 10.3389/fnins.2014.00199
Ramayya, A. G., Zaghloul, K. A., Weidemann, C. T., Baltuch, G. H., and Kahana, M. J. (2014). Electrophysiological evidence for functionally distinct neuronal populations in the human substantia nigra. Front. Hum. Neurosci. 8:655. doi: 10.3389/fnhum.2014.00655
Ray, S., and Maunsell, J. H. (2015). Do gamma oscillations play a role in cerebral cortex. Trends Cogn. Sci. (Regul. Ed.) 19, 78–85. doi: 10.1016/j.tics.2014.12.002
Romanski, L. M., and LeDoux, J. E. (1993). Organization of rodent auditory cortex: anterograde transport of PHA-L from MGv to temporal neocortex. Cereb. Cortex 3, 499–514. doi: 10.1093/cercor/3.6.499
Rouiller, E. M., Simm, G. M., Villa, A. E., de Ribaupierre, Y., and de Ribaupierre, F. (1991). Auditory corticocortical interconnections in the cat: evidence for parallel and hierarchical arrangement of the auditory cortical areas. Exp. Brain Res. 86, 483–505. doi: 10.1007/BF00230523
Sakata, S., and Harris, K. D. (2009). Laminar structure of spontaneous and sensory-evoked population activity in auditory cortex. Neuron 64, 404–418. doi: 10.1016/j.neuron.2009.09.020
Senzai, Y., Fernandez-Ruiz, A., and Buzsáki, G. (2019). Layer-specific physiological features and interlaminar interactions in the primary visual cortex of the mouse. Neuron 101, 500.e5–513.e5. doi: 10.1016/j.neuron.2018.12.009
Sermet, B. S., Truschow, P., Feyerabend, M., Mayrhofer, J. M., Oram, T. B., Yizhar, O., et al. (2019). Pathway-, layer- and cell-type-specific thalamic input to mouse barrel cortex. Elife 8:e52665. doi: 10.7554/eLife.52665
Shahriari, Y., Krusienski, D., Dadi, Y. S., Seo, M., Shin, H. S., and Choi, J. H. (2016). Impaired auditory evoked potentials and oscillations in frontal and auditory cortex of a schizophrenia mouse model. World J. Biol. Psychiatry 17, 439–448. doi: 10.3109/15622975.2015.1112036
Sivarao, D. V., Chen, P., Senapati, A., Yang, Y., Fernandes, A., Benitex, Y., et al. (2016). 40Hz auditory steady-state response is a pharmacodynamic biomarker for cortical NMDA receptors. Neuropsychopharmacology 41, 2232–2240. doi: 10.1038/npp.2016.17
Sohal, V. S. (2016). How close are we to understanding what (if anything) γ oscillations do in cortical circuits. J. Neurosci. 36, 10489–10495. doi: 10.1523/JNEUROSCI.0990-16.2016
Sotero, R. C., Bortel, A., Naaman, S., Mocanu, V. M., Kropf, P., Villeneuve, M. Y., et al. (2015). Laminar distribution of phase-amplitude coupling of spontaneous current sources and sinks. Front. Neurosci. 9:454. doi: 10.3389/fnins.2015.00454
Steinschneider, M., Fishman, Y. I., and Arezzo, J. C. (2008). Spectrotemporal analysis of evoked and induced electroencephalographic responses in primary auditory cortex (A1) of the awake monkey. Cereb. Cortex 18, 610–625. doi: 10.1093/cercor/bhm094
Teale, P., Collins, D., Maharajh, K., Rojas, D. C., Kronberg, E., and Reite, M. (2008). Cortical source estimates of gamma band amplitude and phase are different in schizophrenia. Neuroimage 42, 1481–1489. doi: 10.1016/j.neuroimage.2008.06.020
Thuné, H., Recasens, M., and Uhlhaas, P. J. (2016). The 40-Hz auditory steady-state response in patients with schizophrenia: a meta-analysis. JAMA Psychiatry 73, 1145–1153. doi: 10.1001/jamapsychiatry.2016.2619
Tukker, J. J., Lasztóczi, B., Katona, L., Roberts, J. D., Pissadaki, E. K., Dalezios, Y., et al. (2013). Distinct dendritic arborization and in vivo firing patterns of parvalbumin-expressing basket cells in the hippocampal area CA3. J. Neurosci. 33, 6809–6825. doi: 10.1523/JNEUROSCI.5052-12.2013
Uhlhaas, P. J., and Singer, W. (2006). Neural synchrony in brain disorders: relevance for cognitive dysfunctions and pathophysiology. Neuron 52, 155–168. doi: 10.1016/j.neuron.2006.09.020
Uhlhaas, P. J., and Singer, W. (2010). Abnormal neural oscillations and synchrony in schizophrenia. Nat. Rev. Neurosci. 11, 100–113. doi: 10.1038/nrn2774
Veit, J., Hakim, R., Jadi, M. P., Sejnowski, T. J., and Adesnik, H. (2017). Cortical gamma band synchronization through somatostatin interneurons. Nat. Neurosci. 20, 951–959. doi: 10.1038/nn.4562
Waldert, S., Lemon, R. N., and Kraskov, A. (2013). Influence of spiking activity on cortical local field potentials. J. Physiol. 591, 5291–5303. doi: 10.1113/jphysiol.2013.258228
Wang, Y., Li, Z., Tian, Z., Wang, X., Li, Y., and Qin, L. (2019). Emotional arousal modifies auditory steady state response in the auditory cortex and prefrontal cortex of rats. Stress 22, 492–500. doi: 10.1080/10253890.2019.1583203
Winer, J. A., and Lee, C. C. (2007). The distributed auditory cortex. Hear. Res. 229, 3–13. doi: 10.1016/j.heares.2007.01.017
Woodward, N. D., Karbasforoushan, H., and Heckers, S. (2012). Thalamocortical dysconnectivity in schizophrenia. Am. J. Psychiatry 169, 1092–1099. doi: 10.1176/appi.ajp.2012.12010056
Xu, H., Jeong, H. Y., Tremblay, R., and Rudy, B. (2013). Neocortical somatostatin-expressing GABAergic interneurons disinhibit the thalamorecipient layer 4. Neuron 77, 155–167. doi: 10.1016/j.neuron.2012.11.004
Yu, J., Hu, H., Agmon, A., and Svoboda, K. (2019). Recruitment of GABAergic interneurons in the barrel cortex during active tactile behavior. Neuron 104, 412.e4–427.e4. doi: 10.1016/j.neuron.2019.07.027
Zhou, T. H., Mueller, N. E., Spencer, K. M., Mallya, S. G., Lewandowski, K. E., Norris, L. A., et al. (2018). Auditory steady state response deficits are associated with symptom severity and poor functioning in patients with psychotic disorder. Schizophr. Res. 201, 278–286. doi: 10.1016/j.schres.2018.05.027
Keywords: EEG, gamma oscillation, auditory cortex, granular layer, thalamus
Citation: Li Z, Li J, Wang S, Wang X, Chen J and Qin L (2021) Laminar Profile of Auditory Steady-State Response in the Auditory Cortex of Awake Mice. Front. Syst. Neurosci. 15:636395. doi: 10.3389/fnsys.2021.636395
Received: 01 December 2020; Accepted: 19 February 2021;
Published: 19 March 2021.
Edited by:
Bernat Kocsis, Harvard Medical School, United StatesReviewed by:
Kevin M. Spencer, Harvard Medical School, United StatesYoshinao Kajikawa, Nathan Kline Institute for Psychiatric Research, United States
Copyright © 2021 Li, Li, Wang, Wang, Chen and Qin. This is an open-access article distributed under the terms of the Creative Commons Attribution License (CC BY). The use, distribution or reproduction in other forums is permitted, provided the original author(s) and the copyright owner(s) are credited and that the original publication in this journal is cited, in accordance with accepted academic practice. No use, distribution or reproduction is permitted which does not comply with these terms.
*Correspondence: Ling Qin, cWlubGluZ2xpbmdAeWFob28uY29t