
95% of researchers rate our articles as excellent or good
Learn more about the work of our research integrity team to safeguard the quality of each article we publish.
Find out more
ORIGINAL RESEARCH article
Front. Mol. Neurosci. , 02 February 2023
Sec. Molecular Signalling and Pathways
Volume 16 - 2023 | https://doi.org/10.3389/fnmol.2023.1117065
This article is part of the Research Topic The Role of Glial Cells in Neurodegeneration View all 9 articles
 Yanhao Chu1,2,3Shilin Jia1,2,3Ke Xu1,2,3
 Qing Liu4Lijia Mai1,2,3Jiawei Liu1,2,3
 Wenguo Fan1,2,3*
 Fang Huang1,2,3*
Satellite glial cells (SGCs) play an important role in regulating the function of trigeminal ganglion (TG) neurons. Multiple mediators are involved in the bidirectional communication between SGCs and neurons in different physiological and pathological states. However, molecular insights into the transcript characteristics of SGCs are limited. Moreover, little is known about the heterogeneity of SGCs in TG, and a more in-depth understanding of the interactions between SGCs and neuron subtypes is needed. Here we show the single-cell RNA sequencing (scRNA-seq) profile of SGCs in TG under physiological conditions. Our results demonstrate TG includes nine types of cell clusters, such as neurons, SGCs, myeloid Schwann cells (mSCs), non-myeloid Schwann cells (nmSCs), immune cells, etc., and the corresponding markers are also presented. We reveal the signature gene expression of SGCs, mSCs and nmSCs in the TG, and analyze the ligand-receptor pairs between neuron subtypes and SGCs in the TG. In the heterogeneity analysis of SGCs, four SGCs subtypes are identified, including subtypes enriched for genes associated with extracellular matrix organization, immediate early genes, interferon beta, and cell adhesion molecules, respectively. Our data suggest the molecular characteristics, heterogeneity of SGCs, and bidirectional interactions between SGCs and neurons, providing a valuable resource for studying SGCs in the TG.
Satellite glial cells (SGCs) are an important component of the ganglion in the peripheral nervous system (PNS). Ganglion refers to the combination of a group of neuron cell bodies in the PNS (Aldskogius et al., 1986; Takeda et al., 2009), including sensory ganglia such as the dorsal root ganglion (DRG), trigeminal ganglion (TG), geniculate ganglion and spiral ganglion, as well as autonomic ganglia like the sympathetic and parasympathetic ganglion (Sternini, 1997). The peripheral terminals of neurons of sensory ganglion receive sensory information from the skin and viscera of the body (DRG) and signal from the orofacial areas (TG) (Huang et al., 2013). A layer of flat-shaped SGCs envelops the neurons of the ganglion, further enclosed by a connective tissue sheath, forming a morphological and functional unit (Pannese, 1981; Takeda et al., 2009). In addition to SGCs and neuron somata, the ganglion is also composed of various other cell types, including Schwann cells, fibroblasts, macrophages, etc.
SGCs have a key role in the function of the ganglion. It has become recognized that SGCs are involved in providing nutrition and support to neurons, maintaining the homeostasis of the ganglion environment by regulating the concentration of potassium, glutamate and GABA, etc., (Milosavljević et al., 2021), and neuronal protection and repair (Avraham et al., 2020; Chen et al., 2022). Thus, crosstalk between SGCs and neurons can affect information transmission in the ganglion by influencing the activity of neurons (Hanani, 2005; Messlinger et al., 2020).
Recently, advances in single-cell RNA sequencing (scRNA-seq) have promoted the understanding of the development, function, and pathology of the nervous system. A series of studies have shown the heterogeneity of neurons and glial cells (astrocytes, microglia, oligodendrocytes) in the central nervous system (CNS) and their transcriptional changes in different pathological states by scRNA-seq (Hasel et al., 2021; Sun et al., 2021; Sadick et al., 2022). However, the existing scRNA-seq studies of the ganglion in the PNS focus mainly on neurons of DRG, and studies on TG are still relatively few. In addition, the single-cell transcriptional landscape of SGCs in ganglion has not been fully established. Currently, there are a limited number of studies that have examined the single-cell transcriptomes of SGCs in DRG (Avraham et al., 2020; Tasdemir-Yilmaz et al., 2021; Mapps et al., 2022), stellate ganglion (van Weperen et al., 2021), and spiral ganglion (Tasdemir-Yilmaz et al., 2021). But there has been no in-depth analysis of the single-cell transcriptomes of SGCs in TG. SGCs and SGCs-neurons interaction in TG are involved in pulpitis, temporomandibular joint disorders or inflammation, headaches, and other orofacial inflammatory or neuropathic pain (Costa and Neto, 2015; Ye et al., 2021). The possible interaction pathways between SGCs and neurons in TG need to be further investigated.
In this study, scRNA-seq was used to generate a single-cell transcripts dataset of virtually all cell types that comprise the TG of mice under physiological conditions. We described the unique molecular features of multiple cell types in TG including neurons, SGCs, and Schwann cells, and revealed subtypes of neurons and SGCs. Among these cell types, we focused on the single-cell transcriptional landscape of SGCs in TG. We compared the differences in transcript levels of three glial cells in TG and analyzed potential receptor-ligand pairs between SGCs and neurons. These data provide a resource on SGCs-specific gene expression in mouse TG, the possible interaction pathways between SGCs and neurons, and improve the understanding of the diversity of SGCs at transcript levels. Simultaneously, our study also serves as a basis for studying different types of pain-related diseases in which SGCs are involved at the molecular level.
All experimental procedures were completed as approved by the Ethics Committee of Sun Yat-sen University in China (No. SYSU-IACUC-2020-000245). Six-week-old male C57BL/6 mice were used in this study and were purchased from the Animal Care Committee for the Care and Use of Laboratory Animals of Sun Yat-sen University (Guangzhou, Guangdong Province, China). The C57BL/6 mice were housed in individually ventilated cages, at 22–25°C, 50–60% humidity, under a 12 h/12 h diurnal cycle, with free access to food and water.
The mice were anesthetized with 4% isoflurane inhalation and sacrificed by decapitation. The TG dissection was referred to previously published literature (Katzenell et al., 2017; Malin et al., 2007). After separating the head from the carcass, the skull was removed and the underlying brain tissue was flipped to expose the base of the skull and the TG. The TGs were separated under the microscope and immediately put into PBS for dissection. The TGs were cut into 1 mm3 cubes and were digested, triturated, and resuspended using the papain dissociation system (Worthington, Lakewood, NJ, United States) according to the instructions. TGs tissues were first transferred to the papain dissociation solution containing 20 units/ml papain and 0.005% DNase. Then the tissues were incubated in the dissociation solution at 37°C for 40–60 min with the tissues being agitated every 10 min. The mixture was triturated with Pasteur pipettes to produce the single cell suspension. Then the cloudy cell suspension was collected and centrifuged at 300 ×g for 5 min at room temperature, and the cell pellet was resuspended in the solution including reconstituted albumin-ovomucoid inhibitor and diluted DNase according to the protocol of papain dissociation system. A discontinuous density gradient solution was prepared by adding albumin-inhibitor solution to the bottom of the centrifuge tube, the cell suspension to the upper layer, and then centrifuging at 70 g for 6 min at room temperature. The dissociated cell pellet is at the bottom of the tube, and membrane fragments are left at the intersection of the two gradient solutions. The supernatant was discarded and the pelleted cells were resuspended in HBSS solution+1% BSA medium to obtain single-cell suspension for subsequent experiments.
To obtain the transcriptomic expression profile of single cells in the TG, the single-cell suspension was loaded into a microwell cartridge of the BD Rhapsody Express system according to the manufacturer’s protocol. Single-cell whole-transcript libraries were generated following the manufacturer’s instructions using the BD Rhapsody cDNA Kit and the BD Rhapsody Targeted mRNA and the Tag Amplification Kit. The libraries were sequenced using the Illumina Novaseq platform (Illumina, San Diego, CA, United States), aiming sequencing depth of >20,000 reads per cell for each dataset. The sequencing data were submitted to Gene Expression Omnibus (GEO) database GSE186421 and GSE213105. The TGs from male mice were pooled in the two datasets. In GSE213105 sequencing data, the TGs (n = 10) from normal male mice were included in the sequencing process as well as included in the analysis in this study. In GSE186421, the TGs (n = 6) from normal male mice were included in the sequencing process as well as included in the analysis in this study. The TGs in both datasets were sequenced in parallel according to the same protocol and in the same batch. In this study, the data which were analyzed from GSE213105 and GSE186421 are referred to as dataset 1 and dataset 2, respectively.
According to the manufacturer’s protocol, the standard BD Rhapsody™ Whole Transcriptome Assay Analysis Pipeline on Seven Bridges1 was used to process the raw sequencing data of TG including filtering reads with low sequencing quality, generating gene expression matrices for single cells, etc. After the procedure was completed, the gene-barcode expression matrices were generated for the TG of normal mice.
The cell-gene count matrices were processed with Seurat (version 4.0.2) (Butler et al., 2018) package of R software for normalization, quality control, downstream analysis, and visualization. The datasets from two groups of TG were integrated, and check the batch effect using Seurat with default parameters. For quality control and filtering of the gene-cell matrices, low-quality cells with <300 genes or <500 unique molecular identifiers (UMI) or with >15% mitochondrial genes were removed from the analysis. Small numbers of cells expressing both neurons-and SGCs-specific markers were removed. In total, 18,704 cells passed the criteria and these cells were collected for further analysis.
The filtered count matrices were normalized by the total gene expression and multiplied by a scale factor of 10,000 followed by log transformation using Seurat’s NormalizeData function.
The top 3,000 most variable genes were selected using Seurat’s FindVariableFeatures function. Principal component analysis (PCA) was performed to identify the top 50 principal components (PC) which were selected based on the ElbowPlot function in the Seurat for data visualization using the Uniform Manifold Approximation and Projection (UMAP) technique. Unsupervised hierarchical clustering analysis was performed using the FindClusters function based on Shared Nearest Neighbor (SNN) graph and the SNN modularity optimization in the Seurat. Single-cell populations of TG were clustered into different cell clusters at a defined specified resolution. To determine the cellular identity of each cluster, marker genes of the clusters were searched for using the FindAllMarkers function of Seurat, which requires that the percentage of cells with these marker genes exceeds at least 25% (min. Pct = 0.25). The top 5 marker genes for each subcluster were presented as a gene heat map. These marker genes were compared with known cell type-specific genes from the previous studies (Avraham et al., 2020; Renthal et al., 2020; Wang et al., 2021; Yang et al., 2022). Then cell type-specific marker genes were selected to determine the identity of cell clusters. The annotation results of the cell clusters were further confirmed using the R package SingleR, which compares the transcripts of each individual cell with a reference dataset to determine cell identity. The differentially expressed genes in each identified cluster were identified by the comparison of gene expression levels in a specific cluster to all the other clusters.
To compare transcript differences between different cell types, marker genes with p < 0.05 and log2 fold change >0.2 were selected as the gene lists to perform the Venn diagram. The Gene Ontology (GO) and Kyoto Encyclopedia of Genes and Genomes (KEGG) enrichment analysis were performed for the cluster-specific biomarker genes using ClusterProfiler (v.3.18.1) (Yu et al., 2012; Wu et al., 2021) or Metascape (Zhou et al., 2019). UMAP plots, dot plots, feature plots, and gene heat map plots were all produced by the Seurat package.
To explore the intercellular interactions between SGCs and neurons, we used the R package CellChat (version 1.0.0) (Jin et al., 2021). This R package identified the potential cellular ligand-receptor interactions between SGCs and neurons based on the gene expression levels of different cellular subclusters, using existing receptor-ligand databases for matching receptor-ligand pairs. During the analysis, we followed the official workflow and loaded the normalized counts into CellChat. Standard preprocessing of the imported data was performed, including processing the data using the functions identifyOverExpressedGenes, identifyOverExpressedInteractions, and projectData in the R package. The functions of ComputeCommonProb, ComputeCommonProbPath, and aggregateNet with the standard parameters were used to analyze potential ligand-receptor interactions between SGCs and neurons.
To perform the subclustering analysis, we separated the target clusters using the subset function. The data matrix of the target clusters was extracted from the overall data using the GetAssayData function, and the whole analysis was repeated according to the above process. The ElbowPlot function was used to identify PCs for subclustering, and subclusters of cells were identified and visualized using UMAP analysis. The markers of SGCs subclusters were generated by the FindAllMarkers function of Seurat. Moreover, the functional enrichment of the markers of SGC subclusters was performed by Metascape (Zhou et al., 2019). The differences in functional enrichment were compared in SGC subclusters, and the results were shown in dot plots.
The data of SGCs were extracted from the Seurat object with clustering information and then converted to a Monocle2 (Hill et al., 2015) package for analyzing the developmental state of SGCs. The pseudotime trajectory analysis was performed with Monocle2 software using default parameters. DDRTree, a reverse graph embedding algorithm in Monocle2, was used to reduce the high-dimensional data, to predict SGCs trajectories based on global gene expression levels. In the process of unsupervised pseudotime analysis, the branch points and trajectory states were calculated and visualized through the plot_cell_trajectory () function. The identified genes that vary in the expression levels with the pseudotime trajectories of SGCs are calculated and reflected on the gene heat map.
The workflow of the scRNA-seq of TG was shown in Figure 1A. After the single-cell suspension of TG was loaded onto the BD Rhapsody Express system, the single cells of TG were captured in the microwell cartridge. In the subsequent detection process, cDNA libraries of the TG were created and the libraries were sequenced. Finally, a sequencing analysis of the matrix file was performed. After quality control, dimensionality reduction, and clustering of the data, each type of cell cluster in the TG was annotated, and then a series of subsequent analyses were completed.
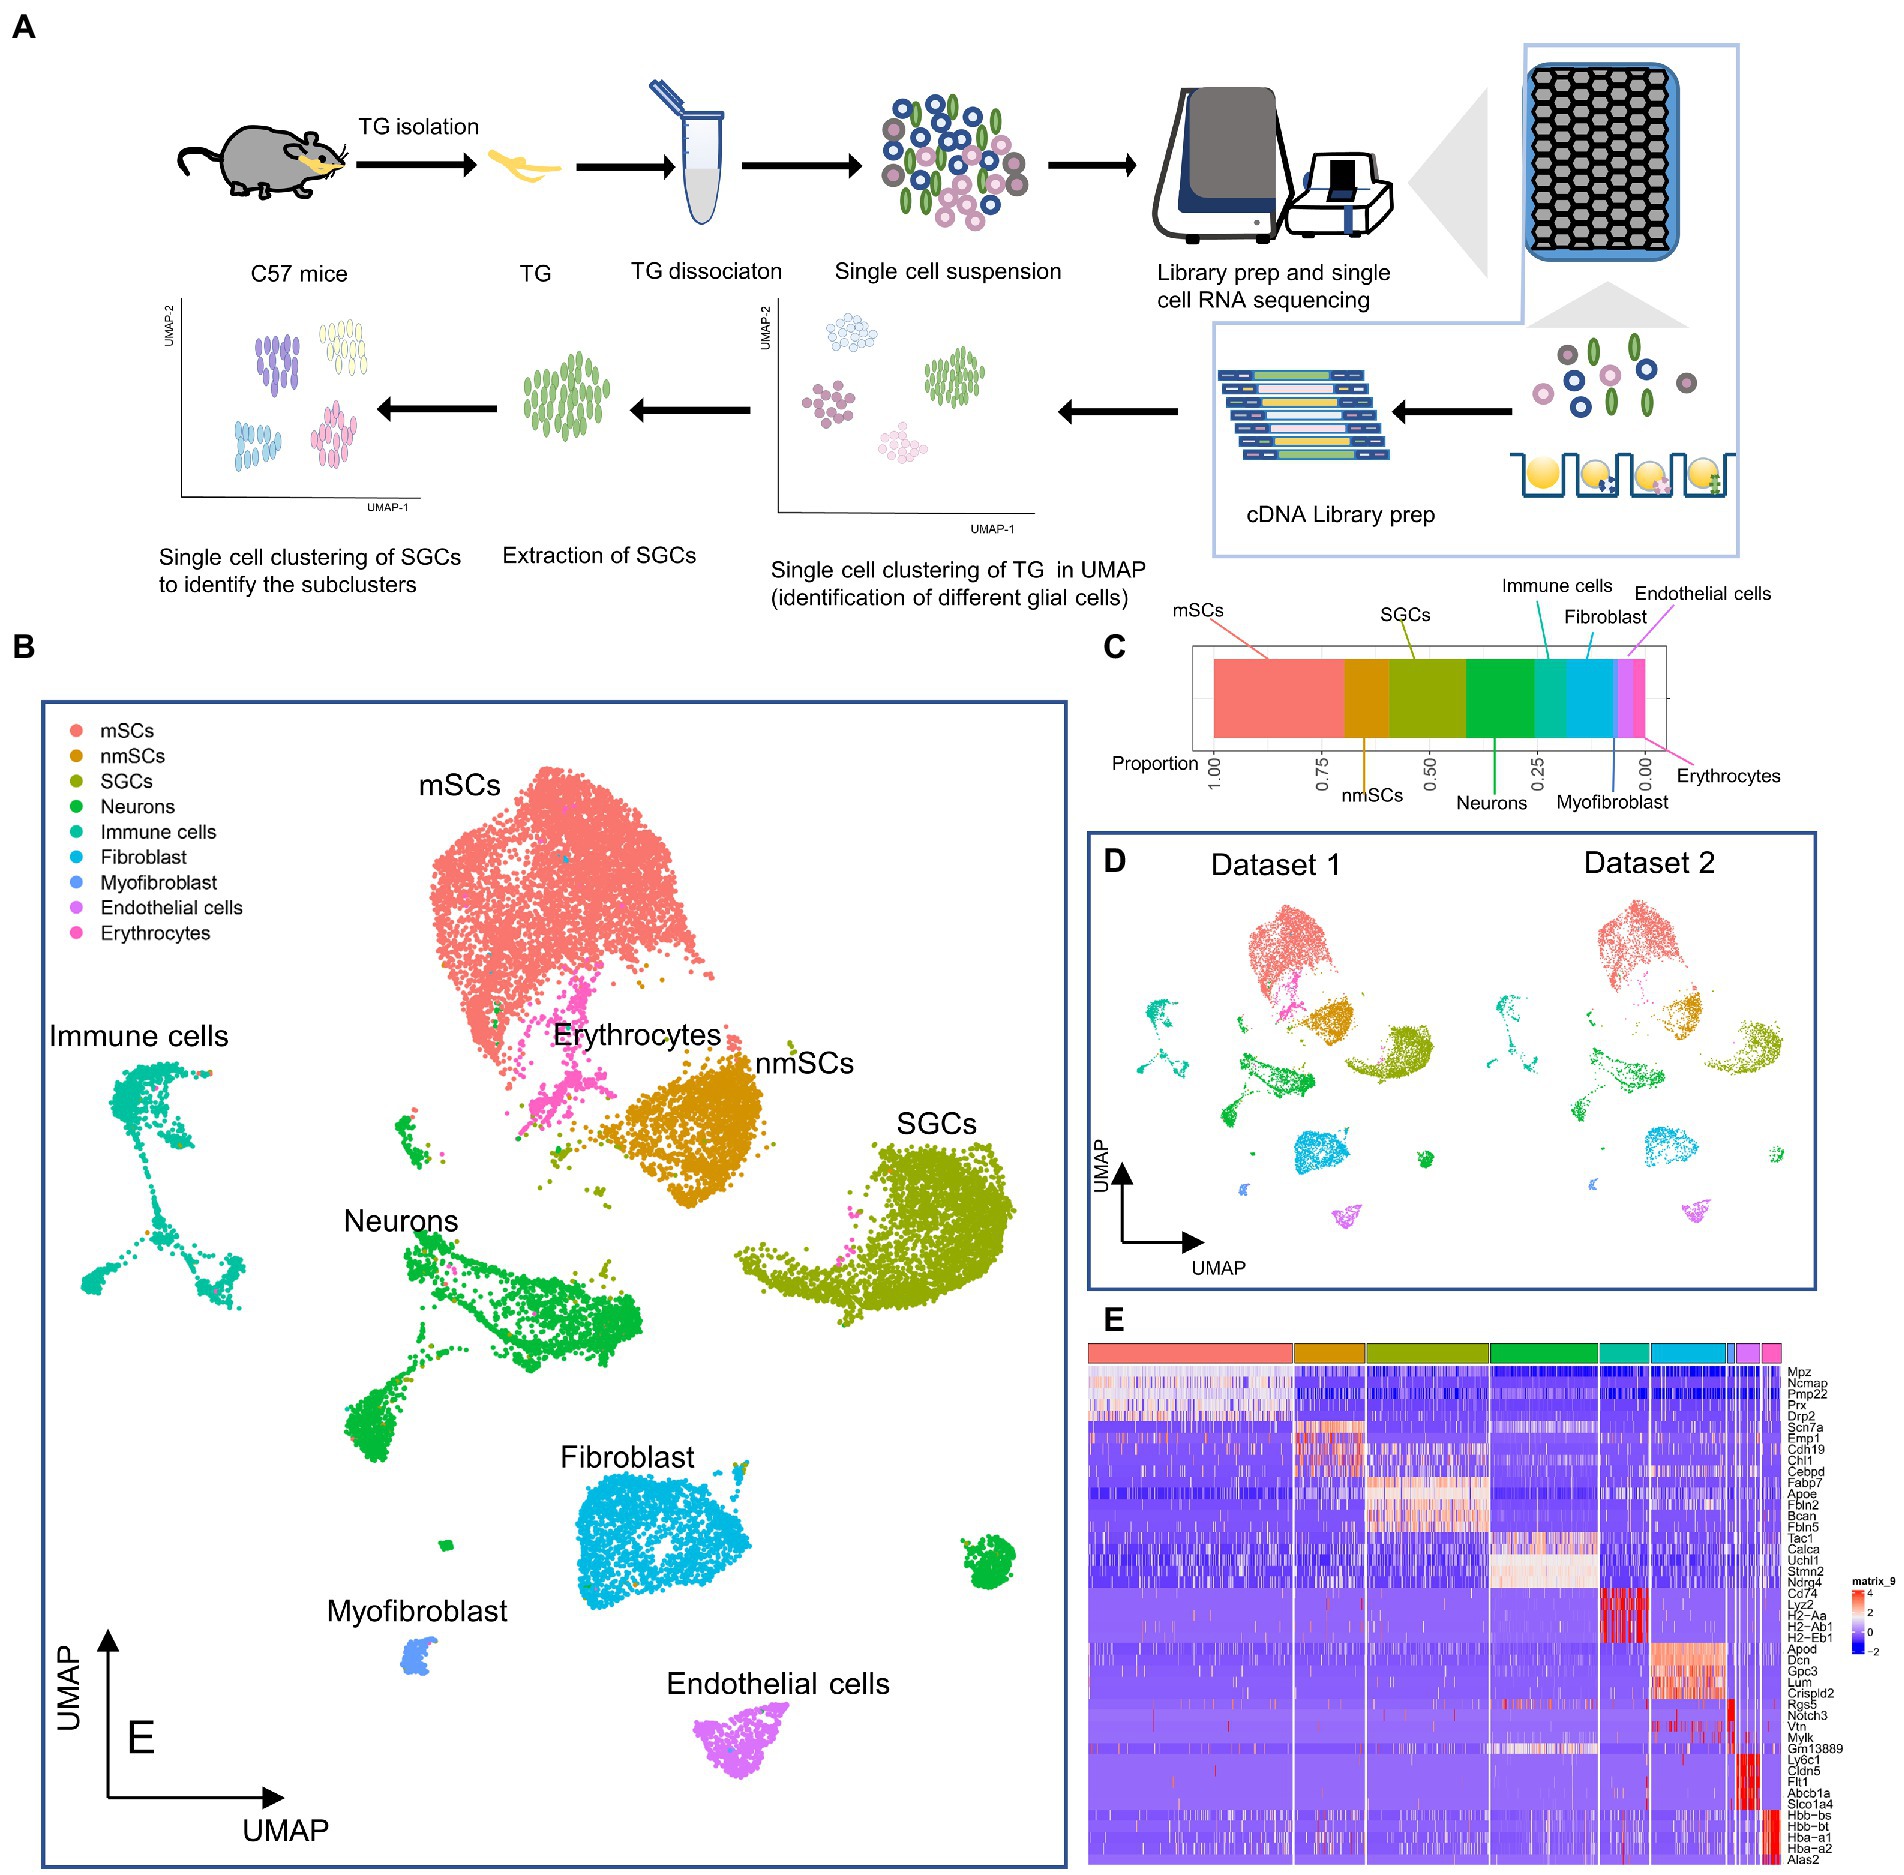
Figure 1. Identification of cell types in the profile of TG at the single cell level. (A) Scheme of experimental workflow for scRNA-seq and analysis of TG. (B) UMAP plot demonstrates clustering of TG. TG datasets 1 and 2 were combined, including neurons, SGCs (satellite glial cells), mSCs (myeloid Schwann cells), nmSCs (non-myeloid Schwann cells), immune cells, fibroblast, endothelial cells, myofibroblast, erythrocytes. Each dot represents one cell; Each color represents one cluster or one cell type. (C) The bar graph illustrates the proportion of cell types in TG. (D) The UMAP plots show the clustering of TG for dataset 1 and dataset 2, respectively. (E) The heat map of top5 genes for cell types of TG. The row is cell type, indicated by different colors. The column is top5 genes for each cell type.
Our results demonstrated the profile of TG, which consist of several cell clusters at the single-cell transcript level. Following quality control filtering, we obtained a total of 18,704 high-quality single-cell transcriptomes, from two TG sequencing datasets. After the unsupervised clustering and dimensionality reduction by the Seurat, the major types of the TG were separated into 9 large clusters including nerve cells, i.e., neurons and three types of peripheral glial cells including SGCs, myeloid Schwann cells (mSCs) and non-myeloid Schwann cells (nmSCs) as well as a variety of non-neural cells, i.e., immune cells, fibroblast, myofibroblast, endothelial cells, erythrocytes (Figure 1B). The proportions of cell clusters in TG were presented in the bar graph (Figure 1C). The annotation of these cell clusters was based on canonical marker genes in the relevant literature. To ensure the accuracy and reproducibility of the sequencing results, two separate sequencing datasets and the integrated dataset were performed dimensionality reduction and clustering individually. The UMAP plots of dataset 1, dataset 2, and the integrated dataset showed they had a consistent distribution of cell clusters (Figures 1B,D). Therefore, in order to obtain a larger number of cells for analysis, we used the integrated dataset for subsequent analysis. To identify cluster-specific genes, by the function of Findmarker, we calculated the gene expression differences between the target cluster and the average level of the other clusters (ANOVA fold change threshold >1.5), illustrated by a heat map of the top 5 differentially expressed genes for each cluster (Figure 1E). After analyzing our data and referring to markers of cell clusters of ganglia in other studies (Avraham et al., 2020; Renthal et al., 2020; Wang et al., 2021; Yang et al., 2022), the specific marker genes used for each cell cluster in our analysis are as follows; SGCs (Fabp7, Apoe), mSCs (Ncmap, Prx, Nr4a2), nmSCs (Scn7a, Cdh19), neurons (Tubb3, Uchl1), immune cells (Ptprc, Lyz2), endothelial cells (Flt1, Cldn5), fibroblasts (Dcn, Lum), erythrocytes (Hbb-bt) and myofibroblast (Rgs5), shown in Figure 2A. In addition, the representative marker gene was visualized in the UMAP plots for SGCs, mSCs, nmScs, immune cells, neurons, endothelial cells, fibroblasts and myofibroblast, demonstrating good specificity (Figure 2B).
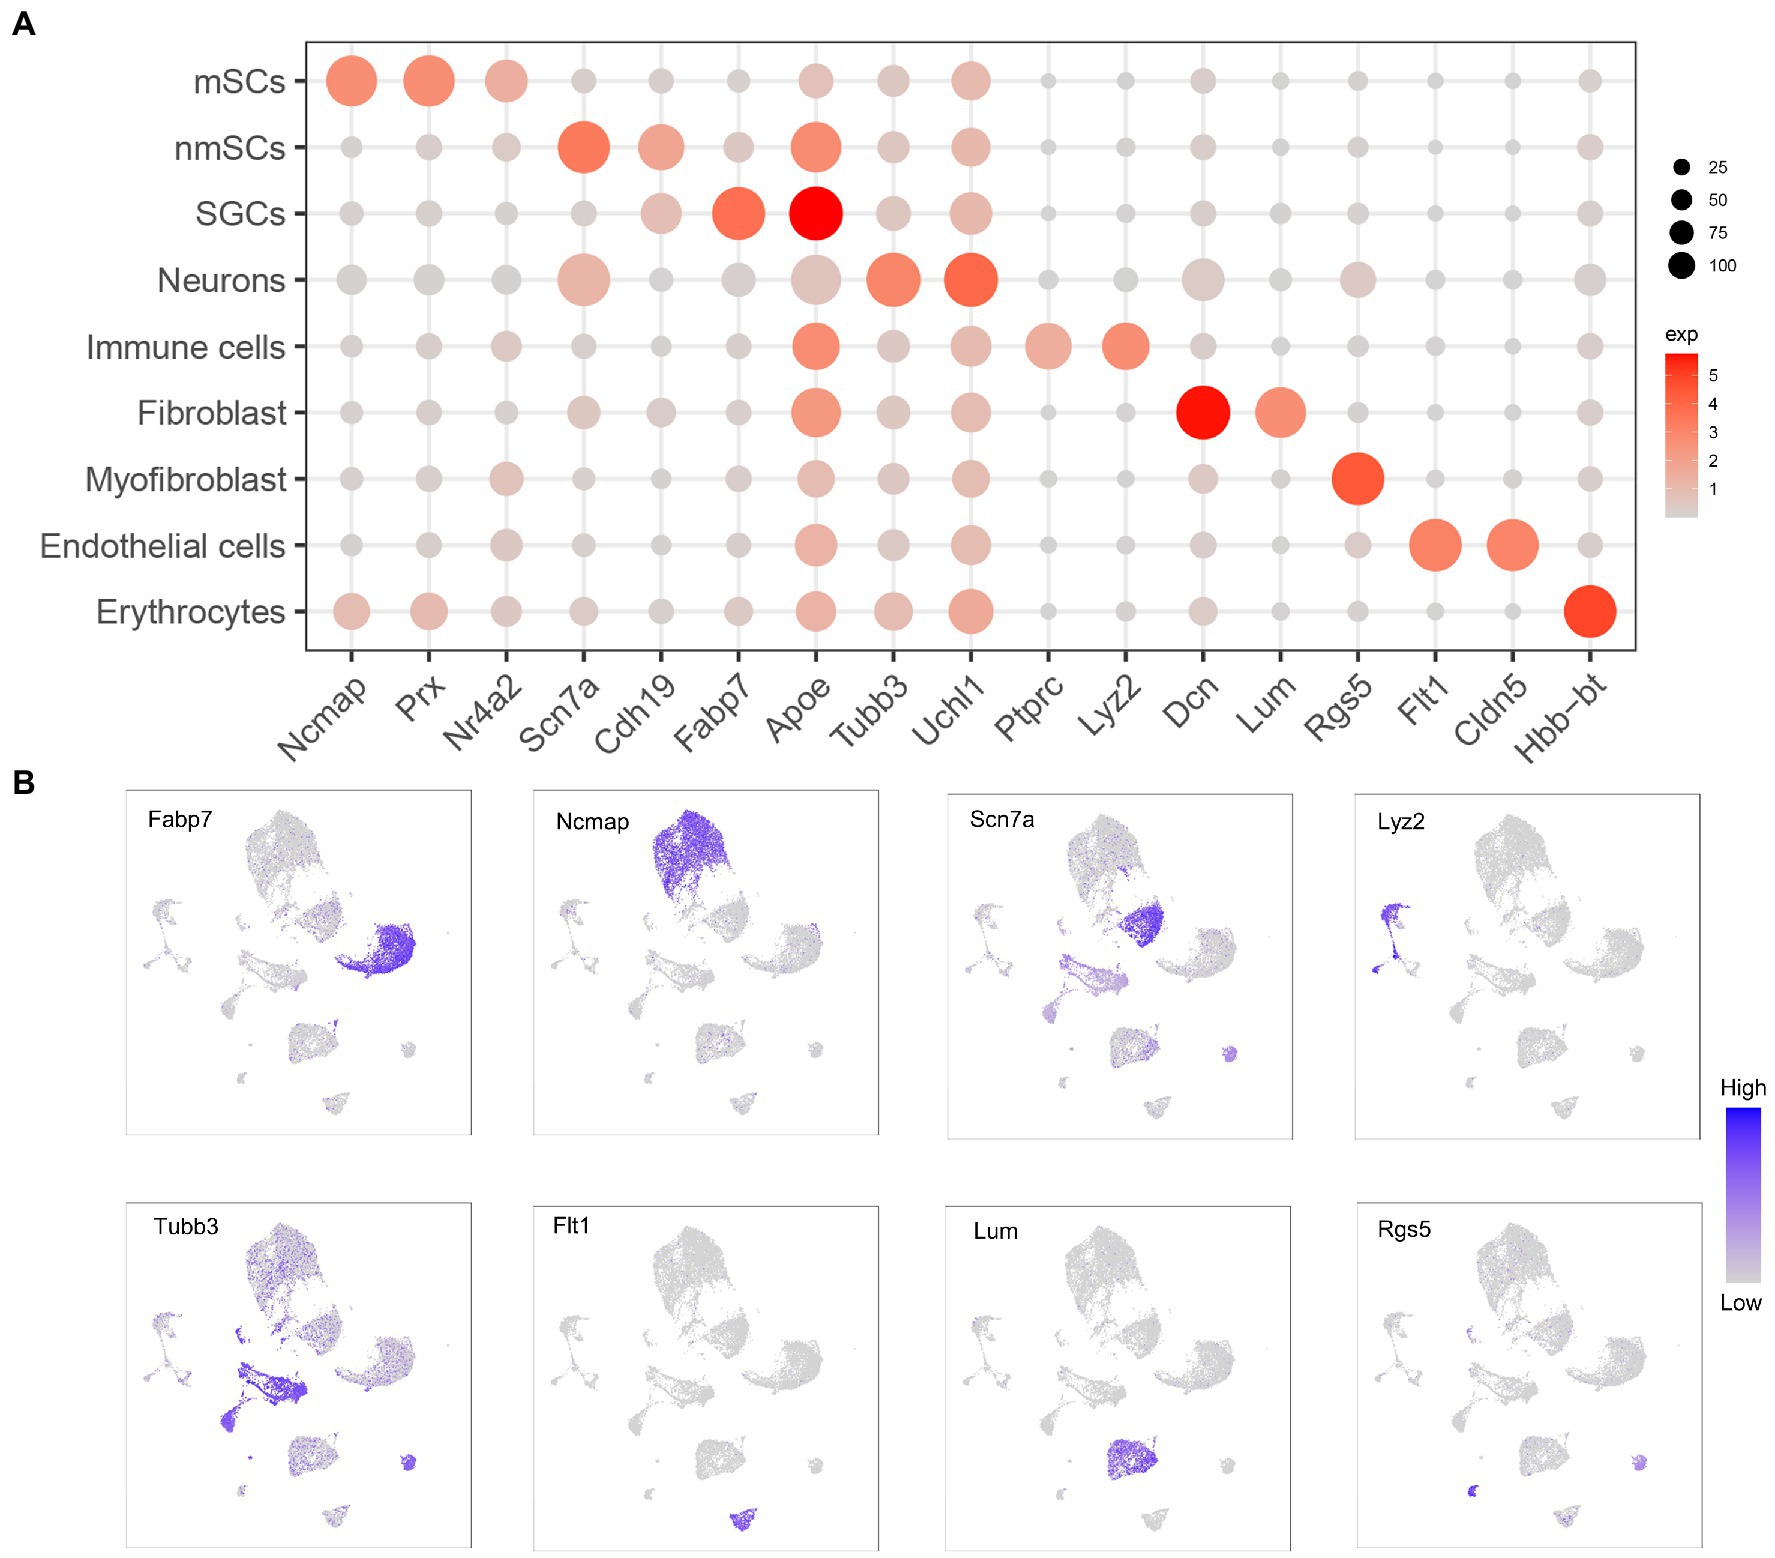
Figure 2. Expression of marker genes in different cell clusters of TG. (A) Dot plot showing expression of marker genes selected from TG data for identification of cluster cell types. Dot size is proportional to the percentage of each cluster expressing the marker gene, and the color intensity is correlated with the expression level. (B) The UMAP expression plots of marker genes for TG cell types.
Among glial cells, astrocytes, and oligodendrocytes in the CNS, and SGCs, Schwann cells in the PNS have similarities and differences in transcription and translation levels (Wolbert et al., 2020; Sun et al., 2021; Sinegubov et al., 2022). Several marker genes, including Plp1, S100b, Sox10, Gfap, Mpz, Mbp, Fabp7, Kcnj10, Prx, Drp2, and Ncmap, have been reported to express in astrocytes, oligodendrocytes or Schwann cells (Batiuk et al., 2020; Milich et al., 2021; Sun et al., 2021). To investigate the differential expression of these classical glial cell markers in TG, we performed UMAP visualization to explore the distribution of these genes in mouse TG. Overlaid cells in UMAP plots with marker genes for SGCs and Schwann cells indicated the relative expression levels by color gradients (Figure 3A). The violin plot further demonstrated the distribution of the above genes in TG glial cells (Figure 3B). The UMAP plots showed that SGCs, nmSCs, and mSCs in TG shared the expression of several Schwann cell markers, such as Plp1, Sox10, Mbp, and Mpz. The SGCs identity was identified by the marker gene, Fabp7, which was top 1 in the list of SGCs marker genes. Other top differentially expressed genes of SGCs including Bcan, Fbln2, Fbln5, were also specific for SGCs (Figure 3A). Apoe was expressed in SGCs, nmSCs, mSCs, immune cells, and fibroblasts, but it was significantly more expressed in SGCs than in other clusters (Figure 3A). Kcnj10, which is considered the marker of astrocytes (Renthal et al., 2020), was also specific to SGCs of TG (Figure 3A), but S100b, another marker gene of astrocytes, was widely expressed in the three peripheral glial cells of TG (Figure 3A). Another Schwann cell marker, Cdh19, was mainly expressed in nmSCs and SGCs of TG and was more abundantly expressed in nmSCs. The top differentially expressed genes in the mSCs cluster included Ncmap, Drp2, Mag and Nr4a2, which were also specific for mSCs (Figure 3A). The scRNA-seq data revealed that one of the top differentially expressed genes in the nmSCs cluster is Scn7a (Figure 3A), which has been proven to be a specific marker for nmSCs (Renthal et al., 2020).
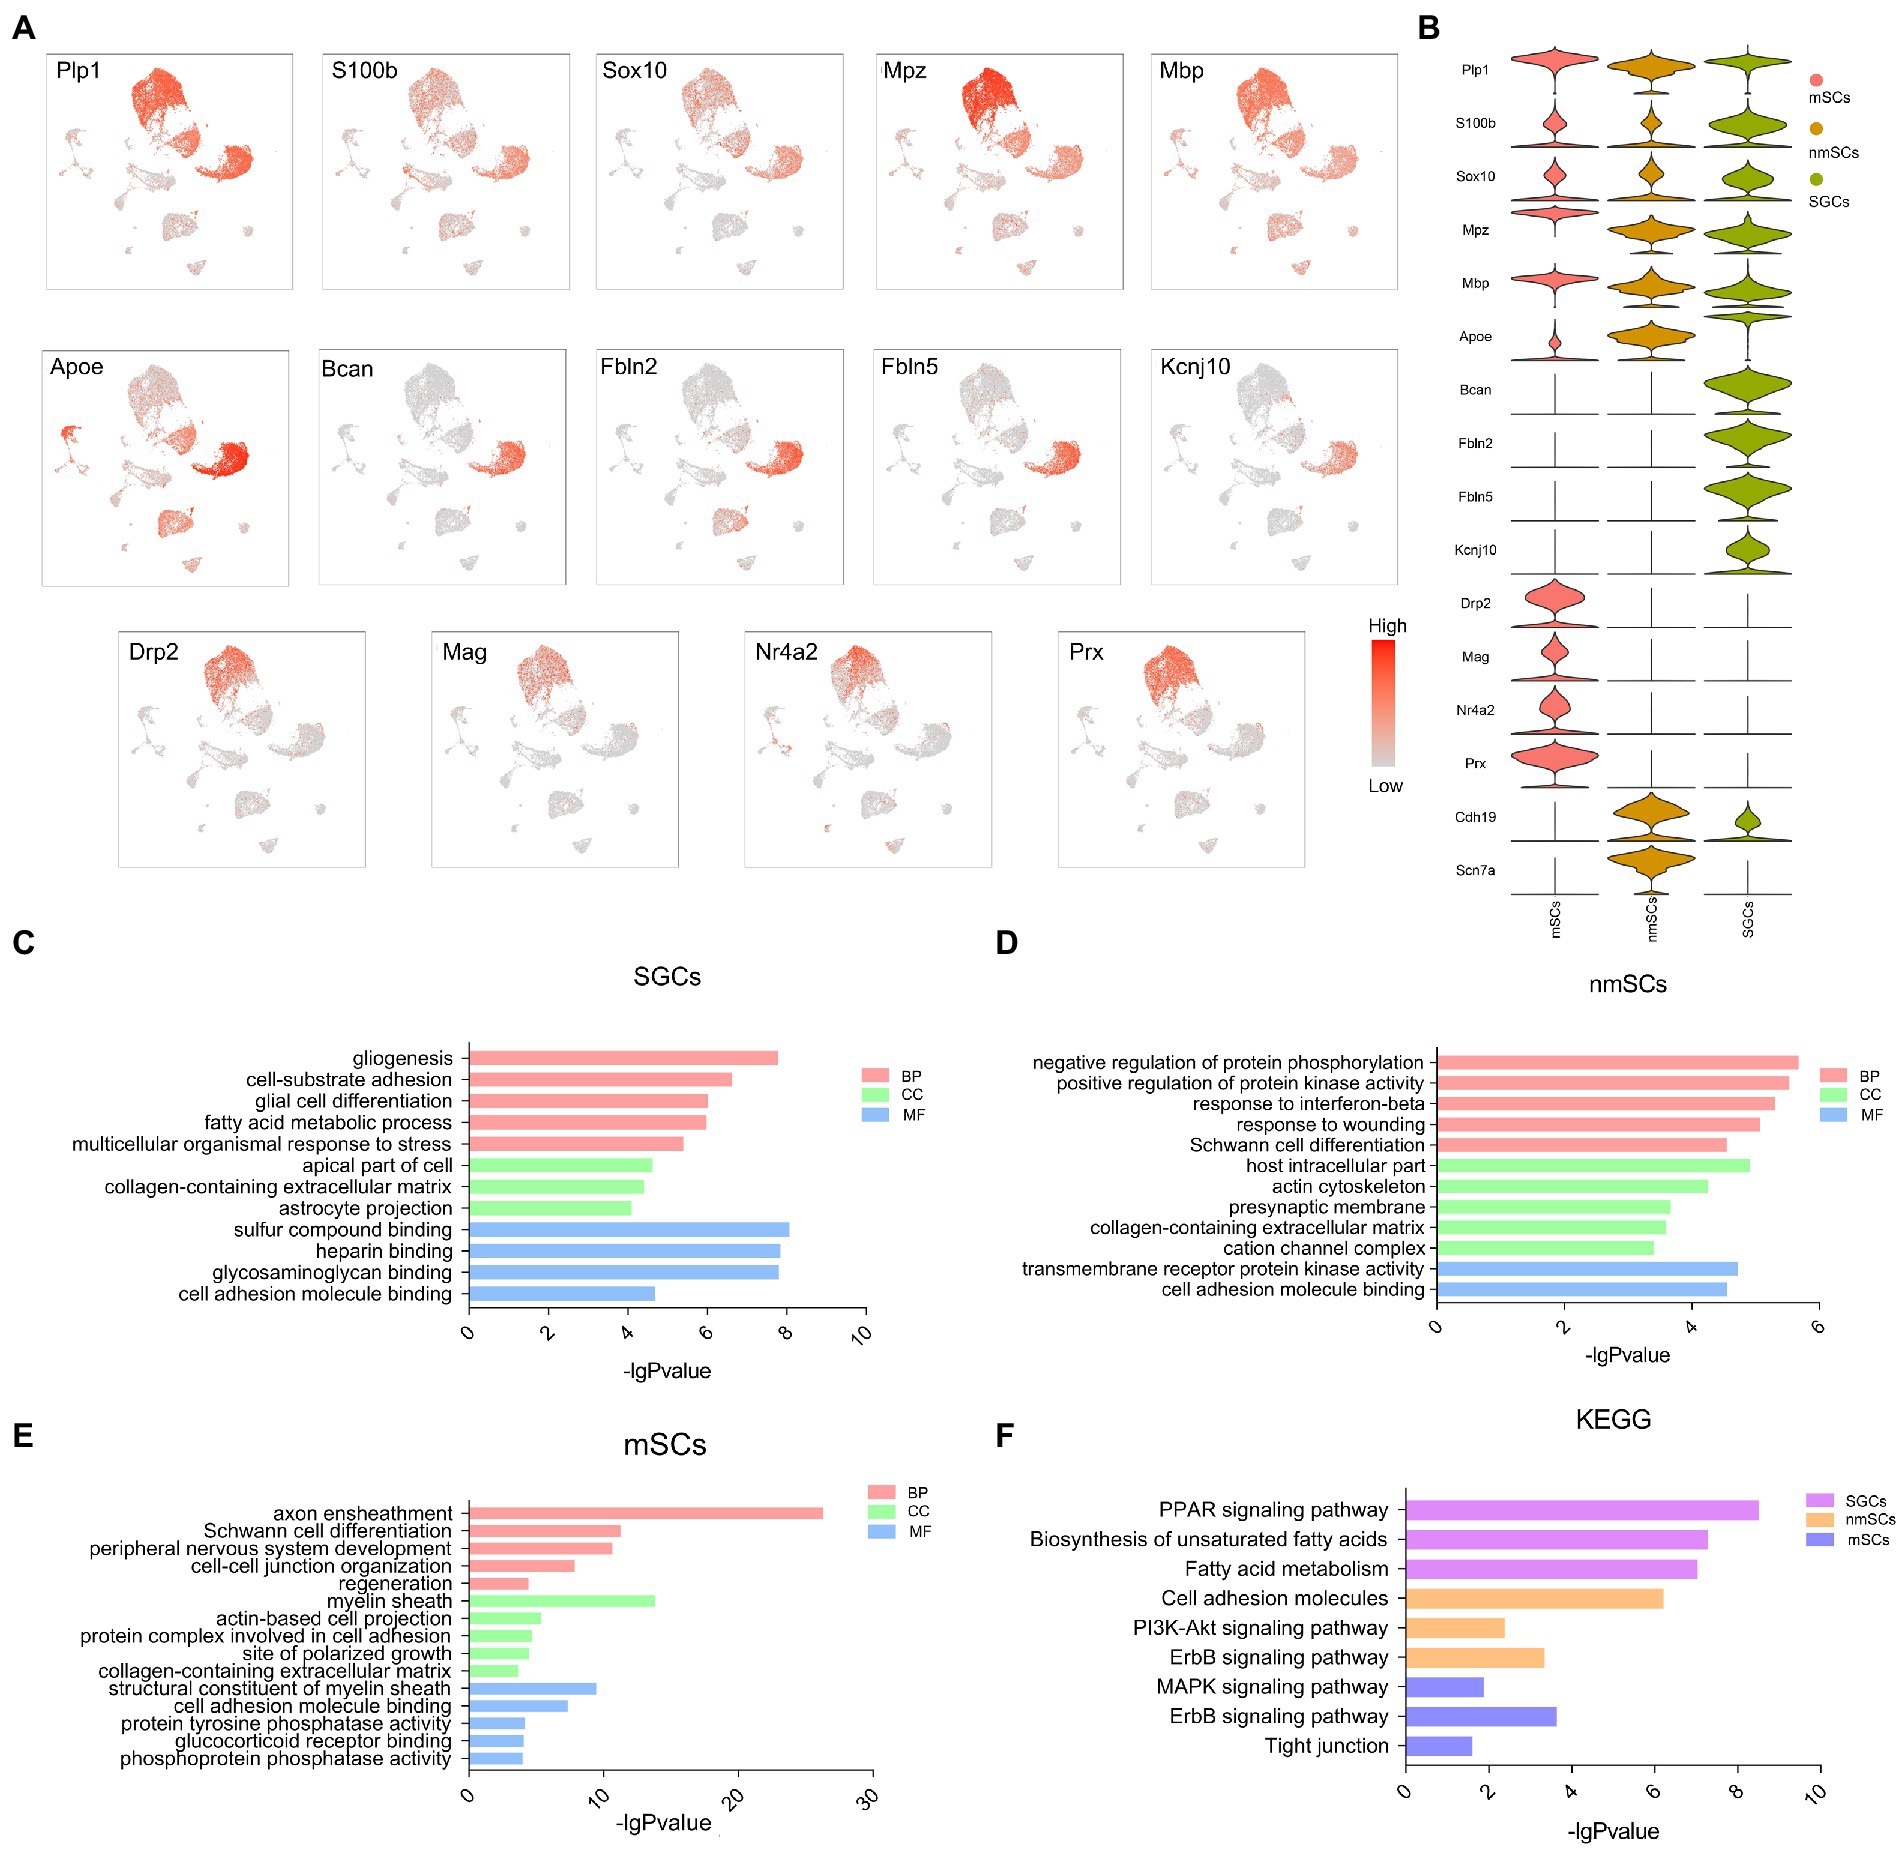
Figure 3. The signature gene expression in three peripheral glial cells of TG and the corresponding functional enrichment. (A) The UMAP plots of selected signature genes for SGCs, mScs and nmSCs. (B) The violin plot showing the distribution of glial cell signature genes in figure (A) in SGCs, mScs and nmSCs. (C–E) Gene ontology enrichment analysis of the biological process (BP), cellular component (CC), and molecular function (MF) for SGCs, mSCs, nmSCs. (F) KEGG analysis for the highly expressed genes of SGCs, mSCs, and nmSCs.
GO and KEGG enrichment analysis of the top differentially expressed genes (log2 fold change >1, p < 0.05, compared to other clusters in TG) in SGCs, nmSCs, and mSCs were performed to investigate the functional differences in three glial cells in TG (the gene lists in the supplementary material of Supplementary Table S1). The GO analysis revealed that the biological process (BP) terms for SGCs were predominantly associated with gliogenesis, cell-substrate adhesion, and fatty acid metabolic process. The cellular component (CC) terms for SGCs included collagen-containing extracellular matrix and astrocyte projection. The molecular function (MF) terms for SGCs included sulfur compound binding, heparin binding (Figure 3C). The BP terms for nmSCs were predominantly associated with the regulation of protein phosphorylation and protein kinase activity, response to wounding, and Schwann cell differentiation. The CC terms for nmSCs included host intracellular part, collagen-containing extracellular matrix, cation channel complex, and the MF terms were related to transmembrane receptor protein kinase activity, cell adhesion molecule binding (Figure 3D). The top BP terms for mSCs were axon ensheathment, Schwann cell differentiation, PNS development and regeneration. The CC terms for mSCs included myelin sheath, while the MF terms were about a structural constituent of the myelin sheath and cell adhesion molecule binding (Figure 3E). KEGG pathway analysis showed that SGCs were associated with the PPAR signaling pathway, biosynthesis of unsaturated fatty acids, and fatty acid metabolism, nmSCs were associated with cell adhesion molecules, PI3K-Akt signaling pathway, and ErbB signaling pathway. The nmSCs were correlated with the MAPK signaling pathway, ErbB signaling pathway, and tight junction (Figure 3F).
Our scRNA-seq data demonstrated three clusters of peripheral glial cells in TG, including SGCs, mSCs, and nmSCs, which was consistent with recent scRNA-seq studies of other peripheral ganglia including DRG (Renthal et al., 2020; Mapps et al., 2022), TG (Yang et al., 2022). To explore the similarities and differences for the three peripheral glial cells in TG at the single cell transcript, we generated a top marker gene list for each type by Findmarkers function (Filtering parameters: Log2 Fold changes >0.2) in Seurat (in Supplementary Table S2 of the supplementary material). After the comparison of the gene lists, we found the overlap of the marker gene lists for SGCs, nmSCs, mSCs was only 22 genes (Figure 4A). The nmSCs and mSCs were more similar in gene expression, while SGCs and nmSCs had more shared genes than SGCs and mSCs. The functional enrichment analysis showed these overlapping genes were related to extracellular matrix adhesion, glial formation, and ion channel regulation (Figure 4B).
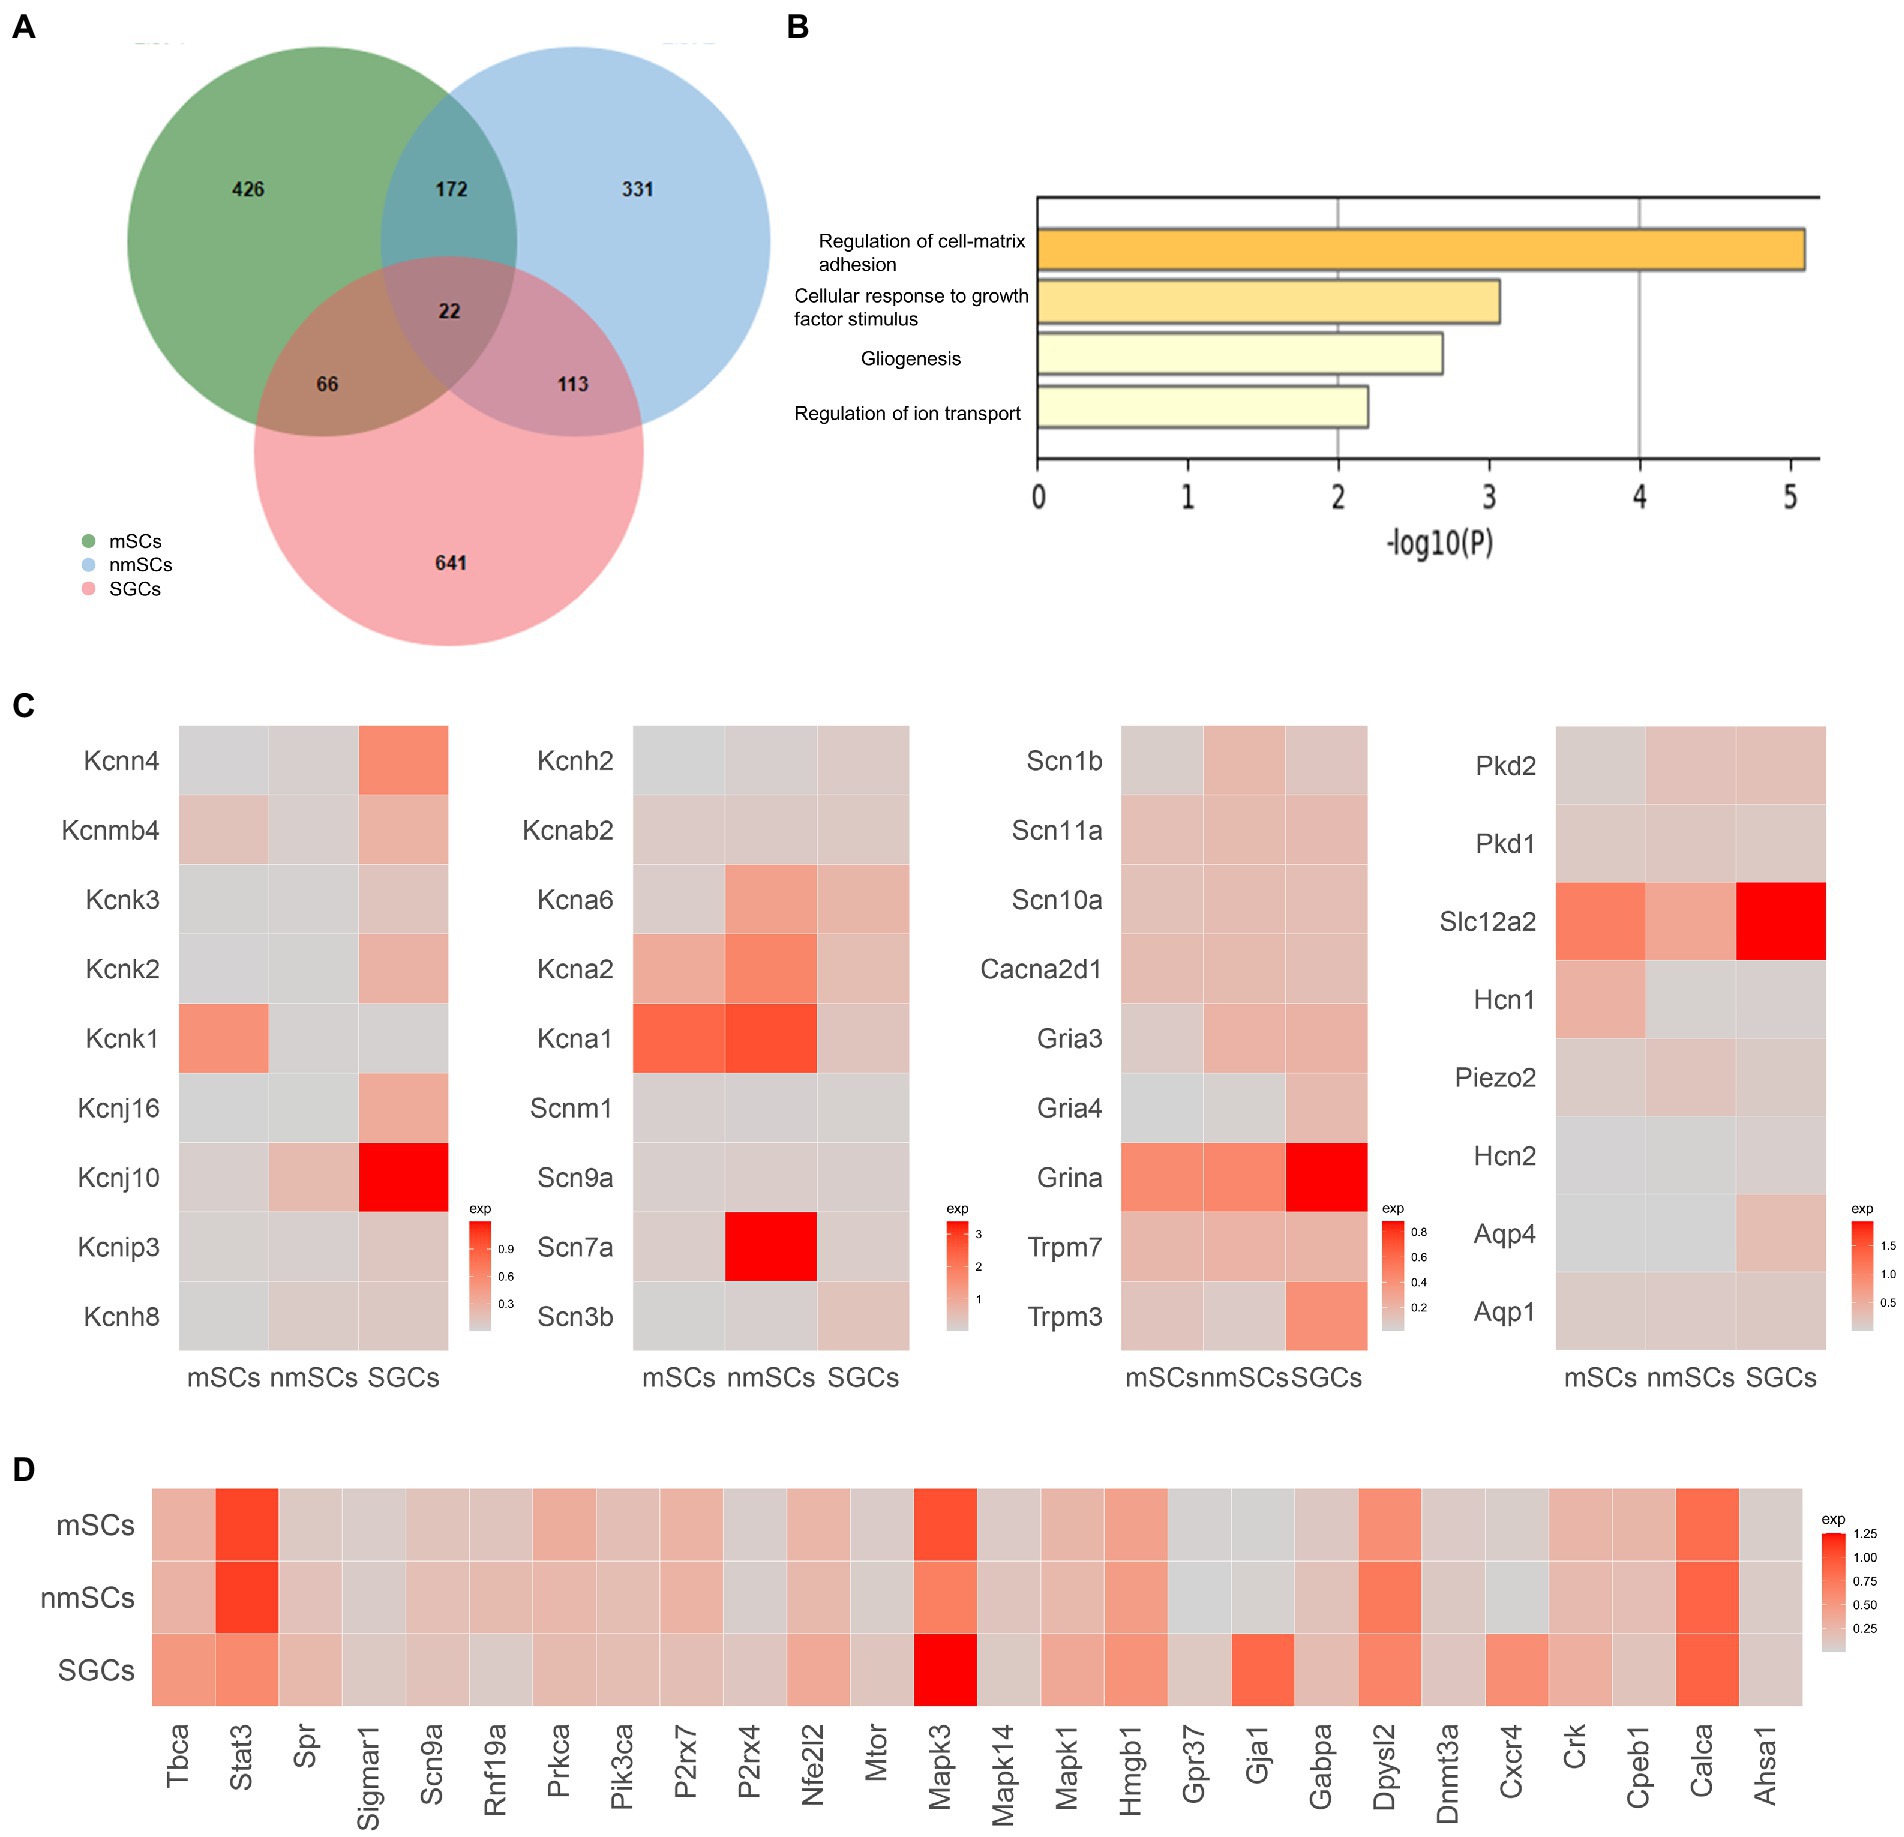
Figure 4. Comparison of gene expression in three types of glial cells in TG. (A) Venn diagram of the highly expressed genes of SGCs, mSCs, nmSCs. The colors denote the cell types. Number of cells for the glial cell clusters: mSCs (5647), nmSCs (1944), SGCs (3356). (B) Functional enrichment analysis of shared expression genes of SGCs, mSCs, nmSCs. The row represents-log 10Pvalues, the column represents terms for functional enrichment. (C) Gene heat map of sodium, potassium, calcium channels, and other channels and receptors expressed in SGCs, mSCs, and nmSCs. Color intensity indicates levels of gene expression. (D) Gene heat map of pain-related gene sets expressed in SGCs, nmSCs, mSCs.
Many studies have demonstrated that some channels and receptors play important roles in the physiological functions of glial cells or the pathological processes of some diseases (Zhang et al., 2017; Fan et al., 2019). We reviewed the relevant literature and search the Gene database to generate a gene list related to glial cell receptors and channels including sodium, calcium and potassium ion channels, glutamate, gamma-aminobutyric acid (GABA), and cholinergic receptors, transient receptor potential (TRP) channels, water channels, MAS-related GPR, and so on (in the supplementary material of Supplementary Table S3). The expression of the listed genes in SGCs, nmSCs, and mSCs was analyzed based on our TG scRNA-seq data, and genes that can be detected in more than 5% of single cells within the cell clusters were selected for graphical presentation (Figure 4C). The results showed that potassium channel-related genes were enriched in expression in peripheral glial cells. For example, Kcnj10 was highly expressed in SGCs, which was considered one of the markers of SGCs and astrocytes in previous studies (Sun et al., 2021; Tasdemir-Yilmaz et al., 2021). Kcna1, Kcna2 were enriched in mSCs, and Kcna1/Kcna2/Kcna6 were enriched in nmSCs (Figure 4C). In comparison, sodium channel genes were poorly expressed in peripheral glial cells, except for Scn7a which was abundantly expressed and also the marker gene for nmSCs (Figure 4C). For calcium channel-related genes, most were at low expression levels in SGCs, nmSCs and mSCs, and only Cacna2d1 was considered to be positively expressed (pos_pct > 5%, Figure 4C). The TRP superfamily of channels responds to a variety of external stimuli, causing variations in membrane excitability and intracellular calcium ion concentration (Venkatachalam and Montell, 2007; Moran, 2018). Trpm3 and Trpm7, subtypes of TRP channels, were found to be expressed in all three glial cells in TG (Figure 4C). Moreover, Trpm3 was shown to have a higher expression in SGCs. Other receptors or channels including Gria3, Gria4, Grina (Glutamate ionotropic receptor genes), Aqp1 and Aqp4 (water channel genes), Hcn1 and Hcn2 (hyperpolarization activated cyclic nucleotide gated channel), Piezo2 (mechanically-activated (MA) cation channels genes), were demonstrated to be expressed at in glial cells of TG. Moreover, Grina was more enriched in SGCs (Figure 4C). Slc12a2, which mediates sodium and chloride transport and reabsorption (Savardi et al., 2021), was found to be expressed in SGCs, nmSCs, and mSCs, with a higher percentage and expression in SGCs (Figure 4C).
A variety of studies have established the contribution of SGCs to chronic pain. We searched the database to obtain a list of pain-related genes (in the supplementary material of Supplementary Table S4). We then conducted further analysis to evaluate the expression of these pain-related genes in SGCs, nmSCs, and mSCs in the mouse TG under normal physiological conditions. STAT3 (signal transducer and activator of transcription 3), and ERK1 (extracellular signal-regulated kinase 1) encoded by Mapk3, are important signaling molecules that play a role in various physiological and pathological processes, including cell proliferation, differentiation, and pain, etc., (Roskoski, 2012; Hillmer et al., 2016). Other studies have shown that increased STAT3 and ERK1/2 phosphorylation in SGCs of DRG is associated with pain hypersensitivity (Reichelt et al., 2008; Yamakita et al., 2018). Our results showed Stat3 and Mapk3 were significantly expressed in the SGCs in mouse TG (Figure 4D). Gja1 (Gap junction protein alpha 1, also known as Cx43) and Cxcr4 (C-X-C motif chemokine receptor 4) were specially expressed in SGCs (Figure 4D). Connexin43 and CXCL12/CXCR4 signaling in SGCs are considered to be involved in sensory transmission in the ganglion (Vit et al., 2006; Yu et al., 2017).
Recently, several studies have shown different subtypes of sensory neurons in the peripheral ganglion (Li et al., 2016; Liu et al., 2022). To understand the communication between neurons and SGCs in TG under normal conditions, we further classified the neurons of TG into different subtypes based on our previous study (Liu et al., 2022), and then used Cellchat to analyze the receptor-ligand pairs between different neuron subtypes and SGCs. As shown in Figure 5A, the extracted neurons of TG (based on Tubb3 and Uchl1) were unbiasedly divided into six clusters. The differentially expressed genes of six neuron clusters were shown in the heatmap, indicating the transcriptional differences of neuron subtypes (Figure 5B). The neuron subtypes were identified based on the specific markers: peptidergic nociceptors (PEP) (Calca, Tac1), non-peptidergic nociceptors (NP) (Mrgprd, Lpar3), myelinated neurons (Nefh-positive neurons, NF) (Nefh), and C-fiber low-threshold mechanoreceptors (c-LTMR) (P2ry1, C1q14), pruriceptive neurons (PRU): PRU1 (Mrgpra3, Gfra1), PRU2 (Nppb, Sst). The expression of the top 5 differentially expressed genes of neuron subtypes, as determined by the FindAllMarkers function, was shown in the dot plot (Figure 5C).
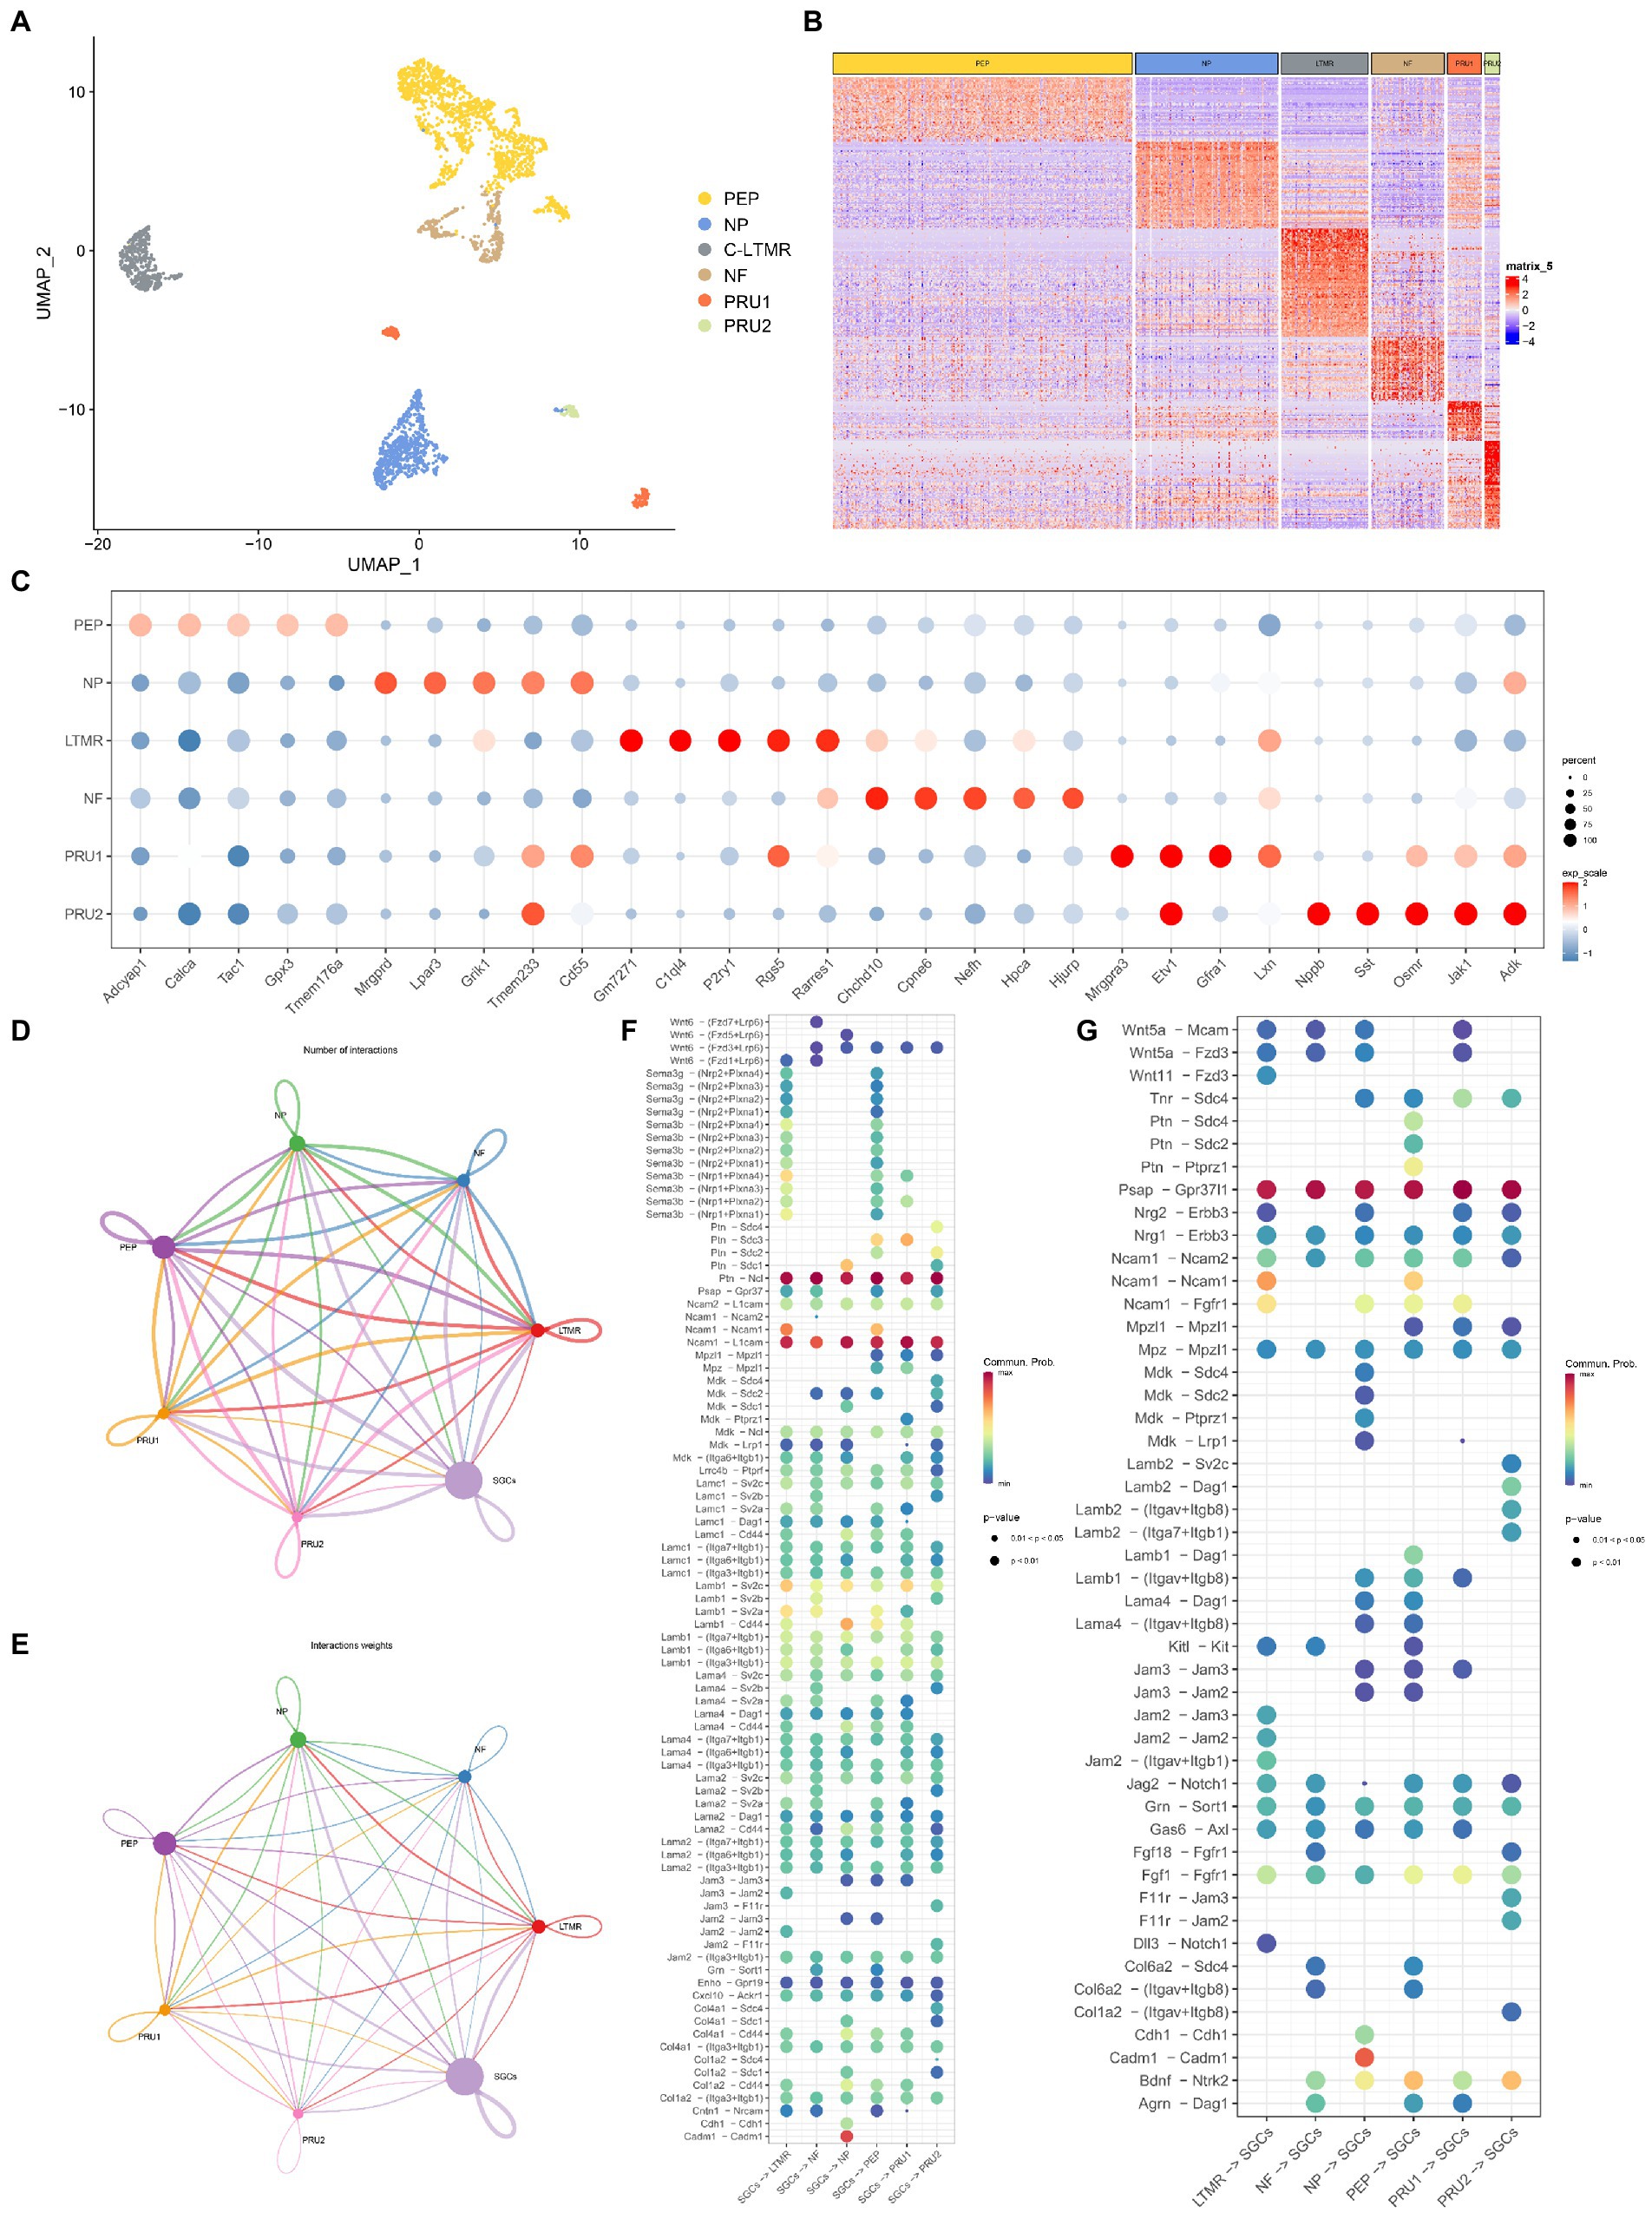
Figure 5. Cell-cell communication analysis between neurons and SGCs in TG. (A) The UMAP plot of six neuron subtypes in TG. Number of cells for the neuron subtypes: PEP (1365), NP (649), cLTMR (397), NF (332), PRU1 (155), PRU2 (69). (B) The gene heat map of neuron subtypes in TG. (C) The dot plot of the top 5 maker genes for neuron subtypes in TG. (D) Network of interaction numbers between neurons and SGCs constructed by CellChat. (E) Network of interaction weight between neurons and SGCs. The color of the line is consistent with the cell of ligand origin, and the thickness of the line indicates the interaction strength or the number of interactions. (F,G) The dot plot of interaction scores as the ligand expressing cell-the receptor expressing cell (horizontal axis). Specific ligand-receptor pairs are listed along the vertical axis. The color of the dots indicates the calculated interaction probability, with dark red dots indicating stronger predicted interactions. The ligand-receptor pairs in neurons-SGCs (F), the ligand-receptor pairs in SGCs-neurons (G).
We gained insight into the possible cellular interaction mechanisms between TG neuron subtypes and SGCs based on the average expression levels of ligand-receptor pairs. The communication network between neuron subtypes and SGCs was visualized in Figures 5D,E, using circle plots showing the number of interactions or total interaction strength (weights) between any two cell clusters. The interaction strength is quantified by calculating the communication probability through modeling the mass action law based on the average expression value of the ligand and the corresponding receptor (Jin et al., 2021). The results showed more significant cellular interactions between PEP, NP, c-LTMR, and SGCs (ligand-receptors or receptors-ligand) than other subtypes (Figures 5D,E).
In the analysis of SGCs-neurons (ligand-receptors) interaction, the pathways Ptn-Ncl and N1cam-L1cam were the top two abundant pathways, which were shared by the six neuron types (Figure 5F). Pleiotrophin (PTN), belongs to the family of heparin-binding growth factors along with midkine, and has been found to be expressed in a variety of tissues such as neural tissue, bone, and liver, and may play an important role in axonal growth, synaptic plasticity, and adipogenesis (Koutsioumpa et al., 2012). Nucleolin, a protein encoded by Ncl, exists mainly in the nucleolus and acts to transport PTN into the nucleus to alter gene expression patterns (Shibata et al., 2002; Said et al., 2005). Syndecans (Sdc) belong to a small family of acetyl heparan sulfate proteoglycans, which also have an affinity for Ptn (Afratis et al., 2017). The results showed that Ptn-Sdc1 signaling was specific for SGCs-NP, and Ptn-Sdc3 was specific for SGCs-PEP, and SGC-PRU1 (Figure 5F). Neural cell adhesion molecules of the immunoglobulin (Ig) superfamily including L1CAM and NCAM are complex transmembrane proteins that affect cell migration, axonal and dendritic projections, and synaptic targeting through contact-mediated patterns with other adhesion molecules (Maness and Schachner, 2007). In the TG, Ncam1-Ncam1 was enriched in SGCs-c-LTMR and SGCs-PEP (Figure 5F), while all neuron subtypes-SGCs shared strong interaction via Ncam1-L1cam signaling (Figure 5G). Another adhesion molecule, the cell adhesion molecule 1 (CADM1), with multiple functions, has been identified as a tumor suppressor gene (Sawada et al., 2020) and was found to exhibit significant communication through CADM1-CADM1 homophilic binding only in SGCs-NP (Figure 5F), which may indicate to some extent the specificity of NP subtype. CXC motif chemokine ligand 10 (CXCL10) is a member of the CXC chemokine family, which is suggested to have pleiotropic effects on a variety of biological processes including immunity, angiogenesis, and cancer metastasis (Luster et al., 1985). Atypical Chemokine Receptor 1, encoded by Ackr1 controls chemokine levels as a chemokine-scavenging or decoy receptor (Bonecchi and Graham, 2016). The analysis revealed that the CXCL10-ACKR1 pathway was co-enriched between SGCs and neuron subtypes at a slightly weaker interaction. The class three Semaphorin (SEMA3)-neuropilin (NRP) pathway that functions in growth guidance during neuronal development, was specific in SGCs-c-LTMR and SGCs-PEP, not matched in other neuron subtypes in TG (Figure 5F).
The ligand-receptor pairs in neuron subtypes–SGCs interaction were shown in Figure 5G. The number and match probability of receptor-ligand pairs in neurons-SGCs are obviously not as high as in SGCs-neurons. Psap encodes prosaposin that affects lysosomal enzyme function or acts as a secreted factor for neuroprotection and glioprotection (Meyer et al., 2014). PSAP has been shown to bind to the orphan G protein-coupled receptors GPR37 and GPR37L1 in the nervous system (Liu et al., 2018) and subsequently participate in a series of cascade responses including modulation of ERK signaling and cytoprotection (Meyer et al., 2013). The interaction analysis of neurons-SGCs revealed strong interactions between neuron subtypes of TG and SGCs via PSAP-GPR37L pathways (Figure 5G). The PTN pathways were shown specifically for PEP-SGCs via the Ptn-Sdc2, Ptn-Sdc4, and Ptn-Ptprz1 (Figure 5G). Brain-derived neurotrophic factor (BDNF) is the essential neurotrophic factor for the CNS, which plays a key role in the development of the nervous system, neurogenesis, and synaptic plasticity (Avey et al., 2018). Neurotrophic Receptor Tyrosine Kinase 2 (Ntrk2) is the encoding gene for tropomyosin-related kinase B (TrkB) which is a high-affinity receptor for BDNF (Kowiański et al., 2018). The BDNF–TrkB signaling is associated with normal brain function and some diseases such as Alzheimer’s disease (Colucci-D’Amato et al., 2020), depression, and pain (Cappoli et al., 2020). In addition to c-LTMR, the BDNF–TrkB signaling was found in the interaction between five other neuronal subtypes and SGCs, with more interaction scores in PEP-SGCs and PRU2-SGCs (Figure 5G).
To assess the heterogeneity of SGCs in TG, the SGCs were extracted from the TG scRNA-seq data based on the specific marker Fabp7. Then the SGCs were clustered into four subclusters including SGCs-1, SGCs-2, SGCs-3, and SGCs-4 by the Seurat, indicated in the UMAP plots in Figure 6A. The gene heat map of the four subtypes of SGCs was shown in Figure 6B. The top 50 differentially expressed genes of SGCs subtypes were subjected to functional enrichment analysis by the Metascape to explore their functions. The four SGCs subtypes were distinguished by the expression of different sets of functional genes associated with extracellular matrix organization, stress-related genes (or immediate early genes), response to interferon-beta, and cell adhesion molecules (Figure 6C). The SGCs-1 was enriched in the genes related to extracellular matrix organization including Col28a1, Adamts5, Bcan, Fbln2, Sdc3 (Figure 6C). The SGCs-2 was distinguished by a series of stress-related genes or immediate early genes that belong to the Gene Ontology term: regulation of transcription from RNA polymerase II promoter in response to stress. Immediate early genes are genes that are rapidly activated at the transcriptional level following multiple transient stimuli (Gallo et al., 2018). Early growth response factor 1 (Egr1), a transcription factor that is considered to be involved in memory, and neuronal plasticity (Knapska and Kaczmarek, 2004; Gallo et al., 2018), was the strongest marker gene in in SGCs-2. Other enriched immediate early genes in SGCs-2 included Junb and Jun, the AP-1 Transcription Factor Subunit (Fan et al., 2021), FOS and FOSB, two members of the Fos family of transcription factors that dimerize with Jun proteins to form the AP-1 transcription factor complex (Milde-Langosch, 2005), Zfp36, encoding Zinc finger protein 36 that can lead to the degradation of the target mRNA (Makita et al., 2021), were also the top markers for SGCs-2 (Figure 6C). The SGCs-2 may represent a group of SGCs that express early genes in the physiological state. In addition, the SGCs-3 was demarcated by the marker genes associated with the function of the response to interferon beta (Figure 6C). These interferon-related markers Gbp2, Gbp3, and Gbp7, encoding the guanylate-binding proteins, can bind to guanine nucleotides (GMP, GDP, and GTP), and are involved in host defense against viral, bacterial, and protozoan pathogens (Kutsch and Coers, 2021). The SGCs-3 was also enriched in interferon response-related genes including Interferon-induced protein with tetratricopeptide repeats 3 (Ifit3), Interferon-induced protein with tetratricopeptide repeats 1 (Ifit1), interferon gamma induced GTPase (Igtp), interferon gamma and inducible protein 47 (Ifi47). Other interferon related markers included transcription factor, Stat1 and Bone marrow stromal antigen 2 (Bst2) (Figure 6C). As a result, SGCs-3 represents a population of SGCs associated with immune function and respond to interferons. Compared to other subtypes, the SGCs-4 expressed abundant cell adhesion molecule-related genes including Mag, Cadm3, Cldn19, Nfasc, and Gldn (Figure 6C). Moreover, gliomedin is encoded by Gldn and acts as a ligand for glial cell neurofascin (encoded by Nfasc) and NrCAM (Eshed et al., 2005). These cell adhesion molecules may play a role in cell interaction in TG.
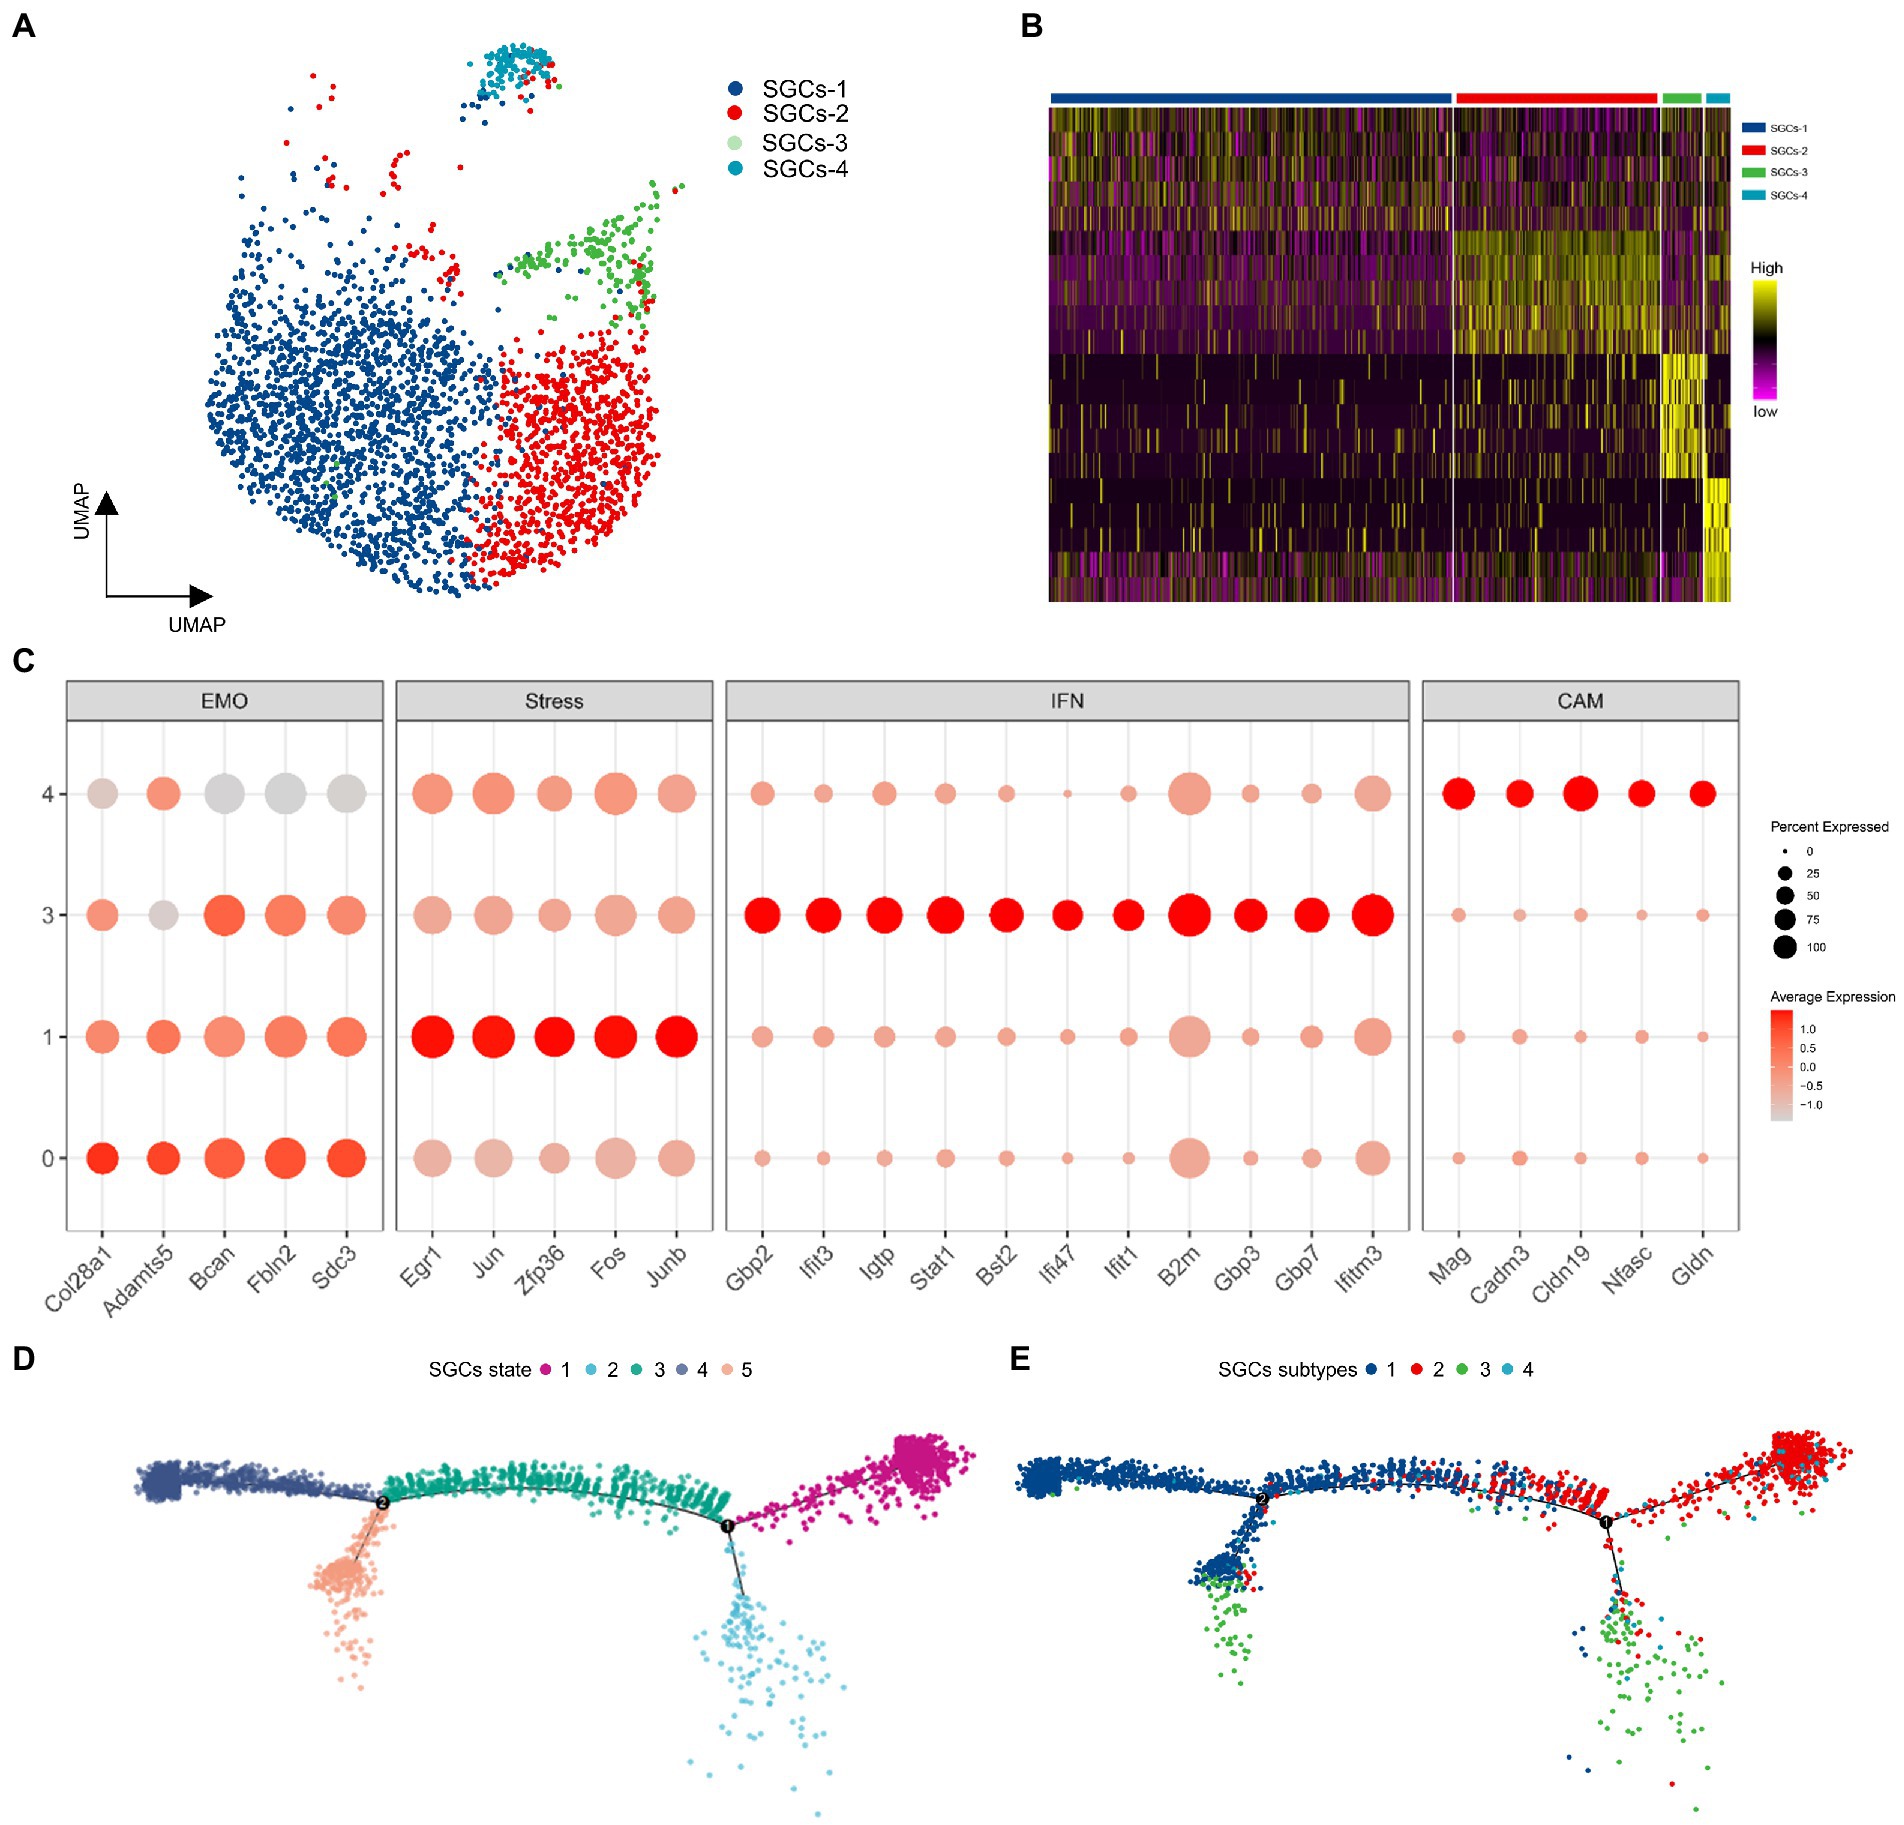
Figure 6. The analysis of SGCs subtypes in TG. (A) The UMAP plot of SGCs subtypes in TG. Number of cells for the SGCs subtypes: SGCs-1 (1685), SGCs-2 (861), SGCs (171), SGCs-4 (110). (B) The gene heat map of SGCs subtypes in TG. (C) The dot plots of SGCs enriched transcripts. EMO: extracellular matrix organization-related genes, Stress: early immediate genes, IFN: interferon response-related genes, CAM: cell adhesion molecule-related genes. (D) Pseudotime trajectory analysis of SGCs. The five states of SGCs are arranged along the trajectory. (E) Pseudotime trajectory analysis of SGCs. The four subtypes of SGCs are arranged into the trajectory state.
According to a published study, SGCs in the peripheral ganglion can be ordered in pseudo-time at the physiological single-cell transcriptional level and be arranged along a trajectory corresponding to the biological process (van Weperen et al., 2021). In order to estimate the lineage relationships between the SGCs subtypes, we performed pseudotime analysis of all SGCs clusters utilizing the R package Monocle2. After the transcriptional trajectory analysis, we found five different states and two branching points in the SGCs trajectory. Among them, State 1 mainly consisted of the SGCs-1. State 2 was mainly composed of SGCs-3. State 3 was mainly composed of SGCs-1 and SGCs-2 together, indicating that it is a transitional cell state. State 4 was composed mainly of SGCs-1 and State 5 consisted of SGCs-1 and SGCs-2.
Recently, with the development of scRNA-seq technique, many studies of peripheral ganglion have focused on neurons, which demonstrate significant heterogeneity of neurons and corresponding neuron subtype markers (Renthal et al., 2020; Yang et al., 2022). However, single-cell transcriptomic studies of SGCs in the peripheral ganglion are still relatively rare, and a few existing studies focus on SGCs of DRG (Avraham et al., 2020; Tasdemir-Yilmaz et al., 2021; Mapps et al., 2022). Moreover, there are few scRNA-seq studies related to SGCs in TG, and little is known about the heterogeneity of SGCs in TG at the single-cell transcriptional level. In this study, we identified stable markers for cell clusters in TG and presented a single-cell transcriptional landscape of SGCs. In addition, we investigated the different expressions of classical glial cell markers, receptors, ion channels and transporters in SGCs, mSCs and nmSCs of TG at the transcription level, and identified their signature genes. The possible pathways in bidirectional cell communication between SGCs and neurons in TG were also determined. Our results identified four SGCs subtypes. In general, our study provides a valuable resource to explore further the molecular entities involved in SGCs of TG.
Our study provided an overall transcriptional profile of the scRNA-seq of TG. In this study, nine cell clusters were identified in TG including neurons, SGCs, nmSCs, mSCs, immune cells, fibroblast, etc. The cell types are similar in another peripheral sensory ganglion, DRG at the sing cell RNA transcript level (Avraham et al., 2020, 2021; Renthal et al., 2020; Wang et al., 2021). The difference is that there are fewer Schwann cells in the DRG compared with our TG data, which may be due to differences in anatomical location and morphology, as well as the fact that the TG is more likely to include both proximal and distal portions of the ganglion. In single-cell transcript studies of other peripheral ganglia including sympathetic ganglion (van Weperen et al., 2021; Mapps et al., 2022) and jugular ganglion (Kupari et al., 2019), the total cell types were similar, but there were differences in neuron and SGCs subclusters. The reason may be that the sympathetic and parasympathetic ganglion belong to the autonomic ganglion with postganglionic multipolar neurons that have different functions from the sensory ganglion (Sternini, 1997; Ernsberger, 2009; Hanani, 2010). The different functions of ganglia cause structural and molecular differences in different neurons, and SGCs are considered to be compatible with different neurons (Mapps et al., 2022).
In our study, the three peripheral glial cells including SGCs, nmSCs and mSCs in TG exhibit different gene expression profiles. Glial cells of the ganglion in PNS including SGCs and Schwann cells share the same developmental origin from neural crest cells (Jessen and Mirsky, 2005; Sinegubov et al., 2022). Neural crest cells differentiate into Schwann cell precursor cells, which in turn differentiate into mSCs and nmSCs (Jessen et al., 2015; Jessen and Mirsky, 2019). Boundary cap cells are pluripotent stem cells that originate from neural crest cells and give rise to different neural cell lineages which are progenitors of neurons, and SGCs (Golding and Cohen, 1997; Maro et al., 2004). SGCs have been reported to express Cdh19, a marker of Schwann precursor cells, which is consistent with our results. Therefore SGCs were regarded as a population of Schwann precursor cells whose development was arrested due to alterations in the microenvironment in developing ganglion (George et al., 2018). Therefore, SGCs, nmSCs, mSCs have certain similarities and differences. Fabp7 and Apoe were the top markers for SGCs in our TG data, which were also used to identify SGCs in DRG (Renthal et al., 2020; Avraham et al., 2021; Wang et al., 2021; Jager et al., 2022), TG (Yang et al., 2022), vagus nerve ganglion (Kupari et al., 2019), and stellate ganglion (van Weperen et al., 2021) in other scRNA-seq studies. Our results showed that Brevican (Bcan), Fibulin 2 (Fbln2), Fibulin 5 (Fbln5) are also the new specific markers for SGCs in TG. Brevican is a CNS-specific chondroitin sulfate proteoglycan expressed by astrocytes and neurons (mainly by astrocytes) and a key component of perineuronal nets, the extracellular matrix enwrapping neurons (Frischknecht and Seidenbecher, 2012; Minta et al., 2021). Fibulin 2 is an extracellular matrix molecule that is abundantly expressed in astrocytes and astrocyte-derived extracellular vesicles promote synapse formation through Fibulin 2 mediated activation of TGF-β signaling (Papon et al., 2020; Patel and Weaver, 2021). Moreover, Fibulin 2 protein levels were revealed to be increased in reactive astrocytes at CNS injury sites and played an important role in regulating axonal growth in the spinal cord (Schaeffer et al., 2018). Fibulin 5, which is involved in extracellular matrix remodeling and elastic fiber assembly (Nakamura, 2018), was upregulated in inflammatory astrocytes by transcriptomic sequencing (Hasel et al., 2021). There is a lack of studies on the function of Fbln5 in central astrocytes or peripheral glial cells. In our TG data, Plp1, Sox10, Mbp were the shared genes for SGCs, nmSCs, and mSCs. In other studies, Plp1 [proteolipid protein (myelin) 1] was the most pertinent gene in Schwann cells of DRG (Avraham et al., 2020), in oligodendrocytes in the spinal cord (Milich et al., 2021), and in the midbrain region (Smajić et al., 2022). S100b and Fabp7 were regarded as the markers for SGCs in stellate ganglion (van Weperen et al., 2021), but our results showed S100b was not specific for SGCs. Furthermore, S100b and Nefh were also used as markers for large neurons in a scRNA-seq study (Wang et al., 2021). The above data suggested that S100b is not a distinctive marker gene for SGCs. We also used Mpz, Ncmap, Prx, Drp2 as specific markers for Schwann cells, which is consistent with other related studies about DRG (Avraham et al., 2020, 2021; Renthal et al., 2020). The establishment of more specific markers for peripheral glial cells will help in labeling these cells, gene knockout, and optogenetic studies in future studies.
In the functional enrichment analysis, both GO and KEGG enrichment of SGCs showed entries related to fatty acid synthesis and metabolism. Astrocytes, which is similar to SGCs, are the main source of cholesterol synthesis, while neurons have insufficient capacity to synthesize cholesterol (Pfrieger and Ungerer, 2011). Fatty acid synthase (FASN), which is abundantly expressed in SGCs, is a key protein controlling endogenous fatty acid synthesis and deletion of FASN in SGCs impaired axon regeneration (Avraham et al., 2020). Other studies (Avraham et al., 2020; Mapps et al., 2022) also suggest that SGCs in sensory ganglia are enriched in the genes related to lipid metabolism. The enrichment of fatty acid-related genes in SGCs may indicate that SGCs are involved in communication with neurons through the regulation of lipid metabolism. Moreover, the enrichment of the PPAR signaling pathway was obtained in SGCs in our results. Peroxisome proliferator-activated receptors (PPARs) are a group of nuclear receptor proteins, including PPARα, PPARβ/δ, and PPARγ, that play key roles as transcription factors in cellular differentiation, development, and carbohydrate, lipid metabolism and tumorigenesis (Lee et al., 2003; Belfiore et al., 2009). PPARα was demonstrated to be expressed in SGCs of DRG and play a role in regeneration after axonal injury (Avraham et al., 2020). Our results further demonstrated the rich expression of PPARs in SGCs of TG, which may have an important role in ganglion functional homeostasis.
We also explored possible pathways for bidirectional cell communication between SGCs and neuronal subtypes in TG under physiological conditions. The close relationship between SGCs and neurons in sensory ganglia leads them to form functional units, and the cellular interactions between the two cell types may play a role in the development of the nervous system, nerve injury, and chronic pain (Costa and Neto, 2015). In physiological and pathological states, some signalings mediated by substance P, CGRP, cytokines, and ATP are involved in the communication between SGCs and neurons (Costa and Neto, 2015). However, little is known about the interactions of different neuron subtypes and SGCs in the ganglion, and more related interaction pathways need to be investigated. Neurons were further classified into different subtypes according to the classification method used in our previously published study (Liu et al., 2022) and other studies about the peripheral ganglion (Nguyen et al., 2017; Hockley et al., 2019; Kupari et al., 2021; Parpaite et al., 2021; Wang et al., 2021; Yang et al., 2022). Chemokines and receptors have been demonstrated to play a role in neuron–glia interaction in the spinal cord (Zhang et al., 2017), which supports the results of interaction between SGCs and neuron subtypes in our studies. CXCL10 is one of the highly upregulated chemokines in the spinal cord after sciatic nerve ligation and is abundantly expressed in astrocytes (Jiang et al., 2016). CXCL10 can activate downstream p38 and ERK to enhance neuronal excitability by acting on CXCR3 (CXC chemokine receptor 3) in neurons of the DRG (Sha et al., 2021), but our results showed that Cxcl10-Ackr1 signaling was enriched in SGCs-neuron in TG. Atypical chemokine receptor 1 encoding by Ackr1 was shown to have the ability to bind and respond to CXC and CC chemokine (Neote et al., 1993). Moreover, ACKR can modulate chemokine concentration gradients and then influence the effect of chemokines on cells via classical chemokine receptors (Chevigné et al., 2021). Our results suggest that CXCL10 may be involved in SGCs-neuron interactions in TG via ACKR1 under physiological conditions, which may be different from pathological conditions such as chronic pain.
Our scRNA-seq data of TG also revealed that BDNF–Trkb was an important signaling pathway in neuron-SGCs interaction. In sensory ganglion, BDNF is mainly synthesized by the soma of neurons affecting surrounding neurons and non-neuronal cells in a paracrine form and is also transported from the soma to axon terminals for action (Pezet and McMahon, 2006). As a high-affinity receptor for BDNF, Trkb was detected in SGCs to ensure the responsiveness of SGCs to BDNF secretion by neurons (Vaegter, 2014; Qiao and Tiwari, 2020). Moreover, the expression of BDNF and Trkb were found to be significantly changed in DRG during inflammatory pain (Lin et al., 2011) and in peripheral nerve injury models (Terada et al., 2018). However, Cellchat is a predictive analysis based on the expression levels of receptors and ligands in cell clusters to explore potential cellular interactions. In the analysis of neurons-SGCs, it is uncertain whether the molecules detected in neurons are released at the cytosol or at the axon terminal. Therefore, the results cannot be directly taken as neuron-SGC interactions pathways, and more experiments are needed for further validation.
Our results and other studies (Li et al., 2016; Hockley et al., 2019; Renthal et al., 2020; Parpaite et al., 2021; Wang et al., 2021) have shown that neurons in the peripheral ganglion have distinct subpopulations that are consistent with neurons of different functions, but there are fewer relevant studies on SGCs subtypes in the peripheral ganglion. Astrocytes, as glial cells similar to SGCs in the CNS, a series of correlative studies based on scRNA-seq have demonstrated the diversity of astrocytes in different regions of the brain and the variation of astrocyte subtypes in different disease (Batiuk et al., 2020; Hasel et al., 2021; Hou et al., 2022; Ma et al., 2022; Sadick et al., 2022). Compared to astrocytes, there are currently fewer studies on single-cell transcription of SGCs subtypes. Our results distinguished four SGCs subtypes at the single-cell transcriptomic level. In addition, SGCs-2 was enriched in immediate early genes. The SGCs with high expression of immediate early genes could also be identified in the scRNA-seq data of DRG (Mapps et al., 2022). External stimuli including axotomy can cause not only neurons but also SGCs in ganglia to express immediate early genes, c-fos (Soares et al., 2001). CGRP can also induce astrocytes to express c-fos at the transcriptional level in vitro (Reddington et al., 1995). However, using single-molecule fluorescence in situ hybridization, the immediate early gene Egr1 was detected to be expressed in SGCs of DRG under physiological conditions (Mapps et al., 2022). Our results further illustrate the presence of an SGCs subtype with high expression of immediate early genes in sensory ganglion including TG. In addition, we identified SGCs-3, the SGCs subtype that was enriched in interferon response-related genes. Similar to our results, there is a subpopulation of SGCs through the specific expression of guanylate-binding proteins and associated interferon-inducible GTPases in the DRG and the sympathetic ganglion (Mapps et al., 2022). Our results showed SGCs-3 was enriched in the interferon inducible proteins and induced transcription factors, STAT1 and BST2, which may reveal that some SGCs are an important part of innate immunity in ganglion. SGCs were demonstrated to have immune-related functions because of their potentially unique leukocyte phenotype and some characteristics of macrophages (van Velzen et al., 2009). Herpes simplex virus (HSV) can be retrogradely transported via axons to sensory ganglion neurons, establishing the latent infection (Milosavljević et al., 2021). In this process, SGCs may play a role in preventing the spread of the virus between adjacent neurons (LaVail et al., 1997). SGCs also exhibit morphological changes during varicella zoster virus (VZV) infection of ganglion (Reichelt et al., 2008). Therefore, SGCs-3 may be a SGCs subtype in TG associated with bacterial, viral and other infections.
The limitation of this study is that although we have comprehensively analyzed the SGCs of TG under physiological states by scRNA-seq, little is known about the single-cell transcriptional alterations of SGCs in some diseases. Therefore, in the future, we need to further investigate the role of SGCs in some pathological states including chronic pain, the changes in the interactions with neurons, and the alterations of subtypes. Moreover, due to the technical conditions and cost limitations of sc-RNA seq, its sequencing depth is not sufficient to detect all expressed genes in single cells of cell clusters in TG. In the heterogeneity analysis of neurons and SGCs, some subtypes such as PRU1, PRU2, and SGCs-4 were slightly deficient in number. Our results show that the distribution of subtypes is consistent in both datasets and we believe the results are stable, but more samples are still needed to further validate the results in the future.
In conclusion, our data provide a new understanding of the function and molecular characteristics of SGCs. To the best of our knowledge, our scRNA-seq results provide the first comprehensive single-cell transcriptome analysis SGCs in mouse TG. This scRNA-seq data can be used to assess not only the heterogeneity of SGCs of TG but also signaling pathways that underlie cellular interactions between SGCs and neurons. Our analysis revealed more specific markers for SGCs in a peripheral ganglion, and the differences among three peripheral glial cells in the transcriptomic profile including receptors, neuropeptides, and ion channels. Our scRNA-seq data of SGCs under physiological conditions can also be used to study the physiological expression levels and cell type localization of pain-related molecules in the TG, as well as to provide a reference and comparison for the study of changes in the intensity and number of neuronal-correctional cell interactions associated with other pathological conditions involved in SGCs (e.g., chronic pain, nerve injury, tumors, etc.) and changes in cell subtype types and changes in gene expression levels.
The datasets presented in this study can be found in online repositories. The names of the repository/repositories and accession number(s) can be found at: https://www.ncbi.nlm.nih.gov/geo/, GSE186421 https://www.ncbi.nlm.nih.gov/geo/, GSE213105.
The animal study was reviewed and approved by the Ethics Committee of Sun Yat-sen University.
YC: conceptualization, methodology, formal analysis, original draft writing. SJ: methodology, formal analysis. KX: software, methodology. QL: review and editing. LM: formal analysis. JL: methodology. WF: conceptualization, review and editing. FH: supervision, methodology, funding acquisition. All authors contributed to the article and approved the submitted version.
This work was supported by the National Natural Science Foundation of China (grant no. 81870737, no. 81771098, no. 82270997), Natural Science Foundation of Guangdong Province (grant no. 2021A1515011779) and Guangdong Financial Fund for High-Caliber Hospital Construction (grant no.174-2018-XMZC-0001-03-0125/D-02).
The authors declare that the research was conducted in the absence of any commercial or financial relationships that could be construed as a potential conflict of interest.
All claims expressed in this article are solely those of the authors and do not necessarily represent those of their affiliated organizations, or those of the publisher, the editors and the reviewers. Any product that may be evaluated in this article, or claim that may be made by its manufacturer, is not guaranteed or endorsed by the publisher.
The Supplementary material for this article can be found online at: https://www.frontiersin.org/articles/10.3389/fnmol.2023.1117065/full#supplementary-material
Afratis, N. A., Nikitovic, D., Multhaupt, H. A. B., Theocharis, A. D., Couchman, J. R., and Karamanos, N. K. (2017). Syndecans – key regulators of cell signaling and biological functions. FEBS J. 284, 27–41. doi: 10.1111/febs.13940
Aldskogius, H., Elfvin, L. G., and Forsman, C. A. (1986). Primary sensory afferents in the inferior mesenteric ganglion and related nerves of the Guinea pig. An experimental study with anterogradely transported wheat germ agglutinin-horseradish peroxidase conjugate. J. Auton. Nerv. Syst. 15, 179–190. doi: 10.1016/0165-1838(86)90013-5
Avey, D., Sankararaman, S., Yim, A. K. Y., Barve, R., Milbrandt, J., and Mitra, R. D. (2018). Single-cell RNA-Seq uncovers a robust transcriptional response to morphine by glia. Cell Rep. 24, 3619–3629.e4. doi: 10.1016/j.celrep.2018.08.080
Avraham, O., Deng, P.-Y., Jones, S., Kuruvilla, R., Semenkovich, C. F., Klyachko, V. A., et al. (2020). Satellite glial cells promote regenerative growth in sensory neurons. Nat. Commun. 11:4891. doi: 10.1038/s41467-020-18642-y
Avraham, O., Feng, R., Ewan, E. E., Rustenhoven, J., Zhao, G., and Cavalli, V. (2021). Profiling sensory neuron microenvironment after peripheral and central axon injury reveals key pathways for neural repair. elife 10, 1–30. doi: 10.7554/eLife.68457
Batiuk, M. Y., Martirosyan, A., Wahis, J., de Vin, F., Marneffe, C., Kusserow, C., et al. (2020). Identification of region-specific astrocyte subtypes at single cell resolution. Nat. Commun. 11, 1220–1215. doi: 10.1038/s41467-019-14198-8
Belfiore, A., Genua, M., and Malaguarnera, R. (2009). PPAR-γ agonists and their effects on IGF-I receptor signaling: implications for cancer. PPAR Res. 2009:830501. doi: 10.1155/2009/830501
Bonecchi, R., and Graham, G. J. (2016). Atypical chemokine receptors and their roles in the resolution of the inflammatory response. Front. Immunol. 7, 1–7. doi: 10.3389/fimmu.2016.00224
Butler, A., Hoffman, P., Smibert, P., Papalexi, E., and Satija, R. (2018). Integrating single-cell transcriptomic data across different conditions, technologies, and species. Nat. Biotechnol. 36, 411–420. doi: 10.1038/nbt.4096
Cappoli, N., Tabolacci, E., Aceto, P., and Dello Russo, C. (2020). The emerging role of the BDNF-Trk B signaling pathway in the modulation of pain perception. J. Neuroimmunol. 349:577406. doi: 10.1016/j.jneuroim.2020.577406
Chen, Y.-L., Feng, X.-L., Cheung, C.-W., and Liu, J. A. (2022). Mode of action of astrocytes in pain: from the spinal cord to the brain. Prog. Neurobiol. 219:102365. doi: 10.1016/j.pneurobio.2022.102365
Chevigné, A., Janji, B., Meyrath, M., Reynders, N., D’Uonnolo, G., Uchański, T., et al. (2021). CXCL10 is an agonist of the CC family chemokine scavenger receptor ACKR2/D6. Cancers (Basel) 13:1054. doi: 10.3390/cancers13051054
Colucci-D’Amato, L., Speranza, L., and Volpicelli, F. (2020). Neurotrophic factor BDNF, physiological functions and therapeutic potential in depression, neurodegeneration and brain cancer. Int. J. Mol. Sci. 21:7777. doi: 10.3390/ijms21207777
Costa, F. A. L., and Neto, F. L. M. (2015). Satellite glial cells in sensory ganglia: its role in pain. Brazilian J. Anesthesiol. English Ed. 65, 73–81. doi: 10.1016/j.bjane.2013.07.013
Ernsberger, U. (2009). Role of neurotrophin signalling in the differentiation of neurons from dorsal root ganglia and sympathetic ganglia. Cell Tissue Res. 336, 349–384. doi: 10.1007/s00441-009-0784-z
Eshed, Y., Feinberg, K., Poliak, S., Sabanay, H., Sarig-Nadir, O., Spiegel, I., et al. (2005). Gliomedin mediates Schwann cell-axon interaction and the molecular assembly of the nodes of Ranvier. Neuron 47, 215–229. doi: 10.1016/j.neuron.2005.06.026
Fan, F., Malvestiti, S., Vallet, S., Lind, J., Garcia-Manteiga, J. M., Morelli, E., et al. (2021). JunB is a key regulator of multiple myeloma bone marrow angiogenesis. Leukemia 35, 3509–3525. doi: 10.1038/s41375-021-01271-9
Fan, W., Zhu, X., He, Y., Zhu, M., Wu, Z., Huang, F., et al. (2019). The role of satellite glial cells in orofacial pain. J. Neurosci. Res. 97, 393–401. doi: 10.1002/jnr.24341
Frischknecht, R., and Seidenbecher, C. I. (2012). Brevican: a key proteoglycan in the perisynaptic extracellular matrix of the brain. Int. J. Biochem. Cell Biol. 44, 1051–1054. doi: 10.1016/j.biocel.2012.03.022
Gallo, F. T., Katche, C., Morici, J. F., Medina, J. H., and Weisstaub, N. V. (2018). Immediate early genes, memory and psychiatric disorders: focus on c-Fos, Egr1 and arc. Front. Behav. Neurosci. 12, 1–16. doi: 10.3389/fnbeh.2018.00079
George, D., Ahrens, P., and Lambert, S. (2018). Satellite glial cells represent a population of developmentally arrested Schwann cells. Glia 66, 1496–1506. doi: 10.1002/glia.23320
Golding, J. P., and Cohen, J. (1997). Border controls at the mammalian spinal cord: late-surviving neural crest boundary cap cells at dorsal root entry sites may regulate sensory afferent ingrowth and entry zone morphogenesis. Mol. Cell. Neurosci. 9, 381–396. doi: 10.1006/mcne.1997.0647
Hanani, M. (2005). Satellite glial cells in sensory ganglia: from form to function. Brain Res. Rev. 48, 457–476. doi: 10.1016/j.brainresrev.2004.09.001
Hanani, M. (2010). Satellite glial cells in sympathetic and parasympathetic ganglia: in search of function. Brain Res. Rev. 64, 304–327. doi: 10.1016/j.brainresrev.2010.04.009
Hasel, P., Rose, I. V. L. L., Sadick, J. S., Kim, R. D., and Liddelow, S. A. (2021). Neuroinflammatory astrocyte subtypes in the mouse brain. Nat. Neurosci. 24, 1475–1487. doi: 10.1038/s41593-021-00905-6
Hill, C., Jain, A., Takemoto, H., Silver, M. D., Nagesh, S. V. S., Ionita, C. N., et al. (2015). Pseudo-temporal ordering of individual cells reveals dynamics and regulators of cell fate decisions. Proc. SPIE. Int. Soc. Opt. Eng. 73, 389–400. doi: 10.1038/nbt.2859
Hillmer, E. J., Zhang, H., Li, H. S., and Watowich, S. S. (2016). STAT3 signaling in immunity. Cytokine Growth Factor Rev. 31, 1–15. doi: 10.1016/j.cytogfr.2016.05.001
Hockley, J. R. F., Taylor, T. S., Callejo, G., Wilbrey, A. L., Gutteridge, A., Bach, K., et al. (2019). Single-cell RNAseq reveals seven classes of colonic sensory neuron. Gut 68, 633–644. doi: 10.1136/gutjnl-2017-315631
Hou, J., Bi, H., Ge, Q., Teng, H., Wan, G., Yu, B., et al. (2022). Heterogeneity analysis of astrocytes following spinal cord injury at single-cell resolution. FASEB J. 36:e22442. doi: 10.1096/fj.202200463R
Huang, L. Y. M., Gu, Y., and Chen, Y. (2013). Communication between neuronal somata and satellite glial cells in sensory ganglia. Glia 61, 1571–1581. doi: 10.1002/glia.22541
Jager, S. E., Pallesen, L. T., Lin, L., Izzi, F., Pinheiro, A. M., Villa-Hernandez, S., et al. (2022). Comparative transcriptional analysis of satellite glial cell injury response. Wellcome Open Res. 7:156. doi: 10.12688/wellcomeopenres.17885.1
Jessen, K. R., and Mirsky, R. (2005). The origin and development of glial cells in peripheral nerves. Nat. Rev. Neurosci. 6, 671–682. doi: 10.1038/nrn1746
Jessen, K. R., and Mirsky, R. (2019). Schwann cell precursors; multipotent glial cells in embryonic nerves. Front. Mol. Neurosci. 12:69. doi: 10.3389/fnmol.2019.00069
Jessen, K. R., Mirsky, R., and Lloyd, A. C. (2015). Schwann cells: development and role in nerve repair. Cold Spring Harb. Perspect. Biol. 7:a020487. doi: 10.1101/cshperspect.a020487
Jiang, B.-C., Cao, D.-L., Zhang, X., Zhang, Z.-J., He, L.-N., Li, C.-H., et al. (2016). CXCL13 drives spinal astrocyte activation and neuropathic pain via CXCR5. J. Clin. Invest. 126, 745–761. doi: 10.1172/JCI81950
Jin, S., Guerrero-Juarez, C. F., Zhang, L., Chang, I., Ramos, R., Kuan, C.-H., et al. (2021). Inference and analysis of cell-cell communication using cell chat. Nat. Commun. 12:1088. doi: 10.1038/s41467-021-21246-9
Katzenell, S., Cabrera, J. R., North, B. J., and Leib, D. A. (2017). Isolation, purification, and culture of primary murine sensory neurons. Methods Mol. Biol. 1656, 229–251. doi: 10.1007/978-1-4939-7237-1_15
Knapska, E., and Kaczmarek, L. (2004). A gene for neuronal plasticity in the mammalian brain: Zif268/Egr-1/NGFI-A/Krox-24/TIS8/ZENK? Prog. Neurobiol. 74, 183–211. doi: 10.1016/j.pneurobio.2004.05.007
Koutsioumpa, M., Drosou, G., Mikelis, C., Theochari, K., Vourtsis, D., Katsoris, P., et al. (2012). Pleiotrophin expression and role in physiological angiogenesis in vivo: potential involvement of nucleolin. Vasc. Cell 4:4. doi: 10.1186/2045-824X-4-4
Kowiański, P., Lietzau, G., Czuba, E., Waśkow, M., Steliga, A., and Moryś, J. (2018). BDNF: a key factor with multipotent impact on brain signaling and synaptic plasticity. Cell. Mol. Neurobiol. 38, 579–593. doi: 10.1007/s10571-017-0510-4
Kupari, J., Häring, M., Agirre, E., Castelo-Branco, G., and Ernfors, P. (2019). An atlas of vagal sensory neurons and their molecular specialization. Cell Rep. 27, 2508–2523.e4. doi: 10.1016/j.celrep.2019.04.096
Kupari, J., Usoskin, D., Parisien, M., Lou, D., Hu, Y., Fatt, M., et al. (2021). Single cell transcriptomics of primate sensory neurons identifies cell types associated with chronic pain. Nat. Commun. 12:1510. doi: 10.1038/s41467-021-21725-z
Kutsch, M., and Coers, J. (2021). Human guanylate binding proteins: nanomachines orchestrating host defense. FEBS J. 288, 5826–5849. doi: 10.1111/febs.15662
LaVail, J. H., Topp, K. S., Giblin, P. A., and Garner, J. A. (1997). Factors that contribute to the transneuronal spread of herpes simplex virus. J. Neurosci. Res. 49, 485–496.
Lee, C.-H., Olson, P., and Evans, R. M. (2003). Minireview: lipid metabolism, metabolic diseases, and peroxisome proliferator-activated receptors. Endocrinology 144, 2201–2207. doi: 10.1210/en.2003-0288
Li, C.-L., Li, K.-C., Wu, D., Chen, Y., Luo, H., Zhao, J.-R., et al. (2016). Somatosensory neuron types identified by high-coverage single-cell RNA-sequencing and functional heterogeneity. Cell Res. 26, 83–102. doi: 10.1038/cr.2015.149
Lin, Y.-T., Ro, L.-S., Wang, H.-L., and Chen, J.-C. (2011). Up-regulation of dorsal root ganglia BDNF and trkB receptor in inflammatory pain: an in vivo and in vitro study. J. Neuroinflammation 8:126. doi: 10.1186/1742-2094-8-126
Liu, Q., Mai, L., Yang, S., Jia, S., Chu, Y., He, H., et al. (2022). Transcriptional alterations of mouse trigeminal ganglion neurons following orofacial inflammation revealed by single-cell analysis. Front. Cell. Neurosci. 16, 1–16. doi: 10.3389/fncel.2022.885569
Liu, B., Mosienko, V., Vaccari Cardoso, B., Prokudina, D., Huentelman, M., Teschemacher, A. G., et al. (2018). Glio-and neuro-protection by prosaposin is mediated by orphan G-protein coupled receptors GPR37L1 and GPR37. Glia 66, 2414–2426. doi: 10.1002/glia.23480
Luster, A. D., Unkeless, J. C., and Ravetch, J. V. (1985). γ-Interferon transcriptionally regulates an early-response gene containing homology to platelet proteins. Nature 315, 672–676. doi: 10.1038/315672a0
Ma, H., Zhou, Y., Li, Z., Zhu, L., Li, H., Zhang, G., et al. (2022). Single-cell RNA-sequencing analyses revealed heterogeneity and dynamic changes of metabolic pathways in astrocytes at the acute phase of ischemic stroke. Oxidative Med. Cell. Longev. 2022, 1817721–1817722. doi: 10.1155/2022/1817721
Makita, S., Takatori, H., and Nakajima, H. (2021). Post-transcriptional regulation of immune responses and inflammatory diseases by RNA-binding ZFP36 family proteins. Front. Immunol. 12:711633. doi: 10.3389/fimmu.2021.711633
Malin, S. A., Davis, B. M., and Molliver, D. C. (2007). Production of dissociated sensory neuron cultures and considerations for their use in studying neuronal function and plasticity. Nat. Protoc. 2, 152–160. doi: 10.1038/nprot.2006.461
Maness, P. F., and Schachner, M. (2007). Neural recognition molecules of the immunoglobulin superfamily: signaling transducers of axon guidance and neuronal migration. Nat. Neurosci. 10, 19–26. doi: 10.1038/nn1827
Mapps, A. A., Thomsen, M. B., Boehm, E., Zhao, H., Hattar, S., and Kuruvilla, R. (2022). Diversity of satellite glia in sympathetic and sensory ganglia. Cell Rep. 38:110328. doi: 10.1016/j.celrep.2022.110328
Maro, G. S., Vermeren, M., Voiculescu, O., Melton, L., Cohen, J., Charnay, P., et al. (2004). Neural crest boundary cap cells constitute a source of neuronal and glial cells of the PNS. Nat. Neurosci. 7, 930–938. doi: 10.1038/nn1299
Messlinger, K., Balcziak, L. K., and Russo, A. F. (2020). Cross-talk signaling in the trigeminal ganglion: role of neuropeptides and other mediators. J. Neural Transm. 127, 431–444. doi: 10.1007/s00702-020-02161-7
Meyer, R. C., Giddens, M. M., Coleman, B. M., and Hall, R. A. (2014). The protective role of prosaposin and its receptors in the nervous system. Brain Res. 1585, 1–12. doi: 10.1016/j.brainres.2014.08.022
Meyer, R. C., Giddens, M. M., Schaefer, S. A., and Hall, R. A. (2013). GPR37 and GPR37L1 are receptors for the neuroprotective and glioprotective factors prosaptide and prosaposin. Proc. Natl. Acad. Sci. 110, 9529–9534. doi: 10.1073/pnas.1219004110
Milde-Langosch, K. (2005). The Fos family of transcription factors and their role in tumourigenesis. Eur. J. Cancer 41, 2449–2461. doi: 10.1016/j.ejca.2005.08.008
Milich, L. M., Choi, J. S., Ryan, C., Cerqueira, S. R., Benavides, S., Yahn, S. L., et al. (2021). Single-cell analysis of the cellular heterogeneity and interactions in the injured mouse spinal cord. J. Exp. Med. 218:e20210040. doi: 10.1084/jem.20210040
Milosavljević, A., Jančić, J., Mirčić, A., Dožić, A., Boljanović, J., Milisavljević, M., et al. (2021). Morphological and functional characteristics of satellite glial cells in the peripheral nervous system. Folia Morphol. (Warsz) 80, 745–755. doi: 10.5603/FM.a2020.0141
Minta, K., Brinkmalm, G., Portelius, E., Johansson, P., Svensson, J., Kettunen, P., et al. (2021). Brevican and Neurocan peptides as potential cerebrospinal fluid biomarkers for differentiation between vascular dementia and Alzheimer’s disease. J. Alzheimers Dis. 79, 729–741. doi: 10.3233/JAD-201039
Moran, M. M. (2018). TRP channels as potential drug targets. Annu. Rev. Pharmacol. Toxicol. 58, 309–330. doi: 10.1146/annurev-pharmtox-010617-052832
Nakamura, T. (2018). Roles of short fibulins, a family of matricellular proteins, in lung matrix assembly and disease. Matrix Biol. 73, 21–33. doi: 10.1016/j.matbio.2018.02.003
Neote, K., Darbonne, W., Ogez, J., Horuk, R., and Schall, T. J. (1993). Identification of a promiscuous inflammatory peptide receptor on the surface of red blood cells. J. Biol. Chem. 268, 12247–12249.
Nguyen, M. Q., Wu, Y., Bonilla, L. S., von Buchholtz, L. J., and Ryba, N. J. P. (2017). Diversity amongst trigeminal neurons revealed by high throughput single cell sequencing. PLoS One 12, e0185543–e0185522. doi: 10.1371/JOURNAL.PONE.0185543
Pannese, E. (1981). The satellite cells of the sensory ganglia. Adv. Anat. Embryol. Cell Biol. 65, 1–111. doi: 10.1007/978-3-642-67750-2
Papon, M. A., Le Feuvre, Y., Barreda-Gómez, G., Favereaux, A., Farrugia, F., Bouali-Benazzouz, R., et al. (2020). Spinal inhibition of GABAB receptors by the extracellular matrix protein Fibulin-2 in neuropathic rats. Front. Cell. Neurosci. 14, 1–20. doi: 10.3389/fncel.2020.00214
Parpaite, T., Brosse, L., Séjourné, N., Laur, A., Mechioukhi, Y., Delmas, P., et al. (2021). Patch-seq of mouse DRG neurons reveals candidate genes for specific mechanosensory functions. Cell Rep. 37:109914. doi: 10.1016/j.celrep.2021.109914
Patel, M. R., and Weaver, A. M. (2021). Astrocyte-derived small extracellular vesicles promote synapse formation via fibulin-2-mediated TGF-β signaling. Cell Rep. 34:108829. doi: 10.1016/j.celrep.2021.108829
Pezet, S., and McMahon, S. B. (2006). Neurotrophins: mediators and modulators of pain. Annu. Rev. Neurosci. 29, 507–538. doi: 10.1146/annurev.neuro.29.051605.112929
Pfrieger, F. W., and Ungerer, N. (2011). Cholesterol metabolism in neurons and astrocytes. Prog. Lipid Res. 50, 357–371. doi: 10.1016/j.plipres.2011.06.002
Qiao, L. Y., and Tiwari, N. (2020). Spinal neuron-glia-immune interaction in cross-organ sensitization. Am. J. Physiol. Gastrointest. Liver Physiol. 319, G748–G760. doi: 10.1152/AJPGI.00323.2020
Reddington, M., Priller, J., Treichel, J., Haas, C., and Kreutzberg, G. W. (1995). Astrocytes and microglia as potential targets for calcitonin gene related peptide in the central nervous system. Can. J. Physiol. Pharmacol. 73, 1047–1049. doi: 10.1139/y95-148
Reichelt, M., Zerboni, L., and Arvin, A. M. (2008). Mechanisms of varicella-zoster virus neuropathogenesis in human dorsal root ganglia. J. Virol. 82, 3971–3983. doi: 10.1128/JVI.02592-07
Renthal, W., Tochitsky, I., Yang, L., Cheng, Y.-C., Li, E., Kawaguchi, R., et al. (2020). Transcriptional reprogramming of distinct peripheral sensory neuron subtypes after axonal injury. Neuron 108, 128–144.e9. doi: 10.1016/j.neuron.2020.07.026
Roskoski, R. (2012). ERK1/2 MAP kinases: structure, function, and regulation. Pharmacol. Res. 66, 105–143. doi: 10.1016/j.phrs.2012.04.005
Sadick, J. S., O’Dea, M. R., Hasel, P., Dykstra, T., Faustin, A., and Liddelow, S. A. (2022). Astrocytes and oligodendrocytes undergo subtype-specific transcriptional changes in Alzheimer’s disease. Neuron 110, 1788–1805.e10. doi: 10.1016/j.neuron.2022.03.008
Said, E. A., Courty, J., Svab, J., Delbe, J., Krust, B., and Hovanessian, A. G. (2005). Pleiotrophin inhibits HIV infection by binding the cell surface-expressed nucleolin. FEBS J. 272, 4646–4659. doi: 10.1111/j.1742-4658.2005.04870.x
Savardi, A., Borgogno, M., De Vivo, M., and Cancedda, L. (2021). Pharmacological tools to target NKCC1 in brain disorders. Trends Pharmacol. Sci. 42, 1009–1034. doi: 10.1016/j.tips.2021.09.005
Sawada, Y., Mashima, E., Saito-Sasaki, N., and Nakamura, M. (2020). The role of cell adhesion molecule 1 (CADM1) in cutaneous malignancies. Int. J. Mol. Sci. 21:9732. doi: 10.3390/ijms21249732
Schaeffer, J., Tannahill, D., Cioni, J. M., Rowlands, D., and Keynes, R. (2018). Identification of the extracellular matrix protein Fibulin-2 as a regulator of spinal nerve organization. Dev. Biol. 442, 101–114. doi: 10.1016/j.ydbio.2018.06.014
Sha, Y. K. W., Zhao, X. W. L., Gao, L. M. Y., Kong, Y. F., Sha, W. L., Wu, X. B., et al. (2021). CXCL10/CXCR3 signaling in the DRG exacerbates neuropathic pain in mice. Neurosci. Bull. 37, 339–352. doi: 10.1007/s12264-020-00608-1
Shibata, Y., Muramatsu, T., Hirai, M., Inui, T., Kimura, T., Saito, H., et al. (2002). Nuclear targeting by the growth factor Midkine. Mol. Cell. Biol. 22, 6788–6796. doi: 10.1128/MCB.22.19.6788-6796.2002
Sinegubov, A., Andreeva, D., Burzak, N., Vasyutina, M., Murashova, L., and Dyachuk, V. (2022). Heterogeneity and potency of peripheral glial cells in embryonic development and adults. Front. Mol. Neurosci. 15:737949. doi: 10.3389/fnmol.2022.737949
Smajić, S., Prada-Medina, C. A., Landoulsi, Z., Ghelfi, J., Delcambre, S., Dietrich, C., et al. (2022). Single-cell sequencing of human midbrain reveals glial activation and a Parkinson-specific neuronal state. Brain 145, 964–978. doi: 10.1093/brain/awab446
Soares, H. D., Chen, S. C., and Morgan, J. I. (2001). Differential and prolonged expression of Fos-lac Z and Jun-lacZ in neurons, glia, and muscle following sciatic nerve damage. Exp. Neurol. 167, 1–14. doi: 10.1006/exnr.2000.7558
Sternini, C. (1997). Organization of the peripheral nervous system: autonomic and sensory ganglia. J. Investig. Dermatol. Symp. Proc. 2, 1–7. doi: 10.1038/jidsymp.1997.2
Sun, J., Song, Y., Chen, Z., Qiu, J., Zhu, S., Wu, L., et al. (2021). Heterogeneity and molecular markers for CNS glial cells revealed by single-cell transcriptomics. Cell. Mol. Neurobiol. 42, 2629–2642. doi: 10.1007/s10571-021-01159-3
Takeda, M., Takahashi, M., and Matsumoto, S. (2009). Contribution of the activation of satellite glia in sensory ganglia to pathological pain. Neurosci. Biobehav. Rev. 33, 784–792. doi: 10.1016/j.neubiorev.2008.12.005
Tasdemir-Yilmaz, O. E., Druckenbrod, N. R., Olukoya, O. O., Dong, W., Yung, A. R., Bastille, I., et al. (2021). Diversity of developing peripheral glia revealed by single-cell RNA sequencing. Dev. Cell 56, 2516–2535.e8. doi: 10.1016/j.devcel.2021.08.005
Terada, Y., Morita-Takemura, S., Isonishi, A., Tanaka, T., Okuda, H., Tatsumi, K., et al. (2018). NGF and BDNF expression in mouse DRG after spared nerve injury. Neurosci. Lett. 686, 67–73. doi: 10.1016/j.neulet.2018.08.051
Vaegter, C. B. (2014). Neurotrophins and their receptors in satellite glial cells following nerve injury. Neural Regen. Res. 9, 2038–2039. doi: 10.4103/1673-5374.147924
van Velzen, M., Laman, J. D., Kleinjan, A., Poot, A., Osterhaus, A. D. M. E., and Verjans, G. M. G. M. (2009). Neuron-interacting satellite glial cells in human trigeminal ganglia have an APC phenotype. J. Immunol. 183, 2456–2461. doi: 10.4049/jimmunol.0900890
van Weperen, V. Y. H., Littman, R. J., Arneson, D. V., Contreras, J., Yang, X., and Ajijola, O. A. (2021). Single-cell transcriptomic profiling of satellite glial cells in stellate ganglia reveals developmental and functional axial dynamics. Glia 69, 1281–1291. doi: 10.1002/glia.23965
Venkatachalam, K., and Montell, C. (2007). TRP Channels. Annu. Rev. Biochem. 76, 387–417. doi: 10.1146/annurev.biochem.75.103004.142819
Vit, J.-P., Jasmin, L., Bhargava, A., and Ohara, P. T. (2006). Satellite glial cells in the trigeminal ganglion as a determinant of orofacial neuropathic pain. Neuron Glia Biol. 2, 247–257. doi: 10.1017/s1740925x07000427
Wang, K., Wang, S., Chen, Y., Wu, D., Hu, X., Lu, Y., et al. (2021). Single-cell transcriptomic analysis of somatosensory neurons uncovers temporal development of neuropathic pain. Cell Res. 31, 904–918. doi: 10.1038/s41422-021-00479-9
Wolbert, J., Li, X., Heming, M., Mausberg, A. K., Akkermann, D., Frydrychowicz, C., et al. (2020). Redefining the heterogeneity of peripheral nerve cells in health and autoimmunity. Proc. Natl. Acad. Sci. U. S. A. 117, 9466–9476. doi: 10.1073/pnas.1912139117
Wu, T., Hu, E., Xu, S., Chen, M., Guo, P., Dai, Z., et al. (2021). clusterProfiler 4.0: a universal enrichment tool for interpreting omics data. Innovation 2:100141. doi: 10.1016/j.xinn.2021.100141
Yamakita, S., Horii, Y., Takemura, H., Matsuoka, Y., Yamashita, A., Yamaguchi, Y., et al. (2018). Synergistic activation of ERK1/2 between A-fiber neurons and glial cells in the DRG contributes to pain hypersensitivity after tissue injury. Mol. Pain 14:1744806918767508. doi: 10.1177/1744806918767508
Yang, L., Xu, M., Bhuiyan, S. A., Li, J., Zhao, J., Cohrs, R. J., et al. (2022). Human and mouse trigeminal ganglia cell atlas implicates multiple cell types in migraine. Neuron 110, 1806–1821.e8. doi: 10.1016/j.neuron.2022.03.003
Ye, Y., Salvo, E., Romero-Reyes, M., Akerman, S., Shimizu, E., Kobayashi, Y., et al. (2021). Glia and orofacial pain: progress and future directions. Int. J. Mol. Sci. 22:5345. doi: 10.3390/ijms22105345
Yu, Y., Huang, X., Di, Y., Qu, L., and Fan, N. (2017). Effect of CXCL12/CXCR4 signaling on neuropathic pain after chronic compression of dorsal root ganglion. Sci. Rep. 7:5707. doi: 10.1038/s41598-017-05954-1
Yu, G., Wang, L.-G., Han, Y., and He, Q.-Y. (2012). clusterProfiler: an R package for comparing biological themes among gene clusters. OMICS 16, 284–287. doi: 10.1089/omi.2011.0118
Zhang, Z. J., Jiang, B. C., and Gao, Y. J. (2017). Chemokines in neuron–glial cell interaction and pathogenesis of neuropathic pain. Cell. Mol. Life Sci. 74, 3275–3291. doi: 10.1007/s00018-017-2513-1
Keywords: single-cell RNA sequencing, trigeminal ganglion, satellite glial cell, cell heterogeneity, neuron-glia communication
Citation: Chu Y, Jia S, Xu K, Liu Q, Mai L, Liu J, Fan W and Huang F (2023) Single-cell transcriptomic profile of satellite glial cells in trigeminal ganglion. Front. Mol. Neurosci. 16:1117065. doi: 10.3389/fnmol.2023.1117065
Edited by:
Robert Blum, University Hospital Würzburg, GermanyReviewed by:
Manuela Simonetti, Heidelberg University, GermanyCopyright © 2023 Chu, Jia, Xu, Liu, Mai, Liu, Fan and Huang. This is an open-access article distributed under the terms of the Creative Commons Attribution License (CC BY). The use, distribution or reproduction in other forums is permitted, provided the original author(s) and the copyright owner(s) are credited and that the original publication in this journal is cited, in accordance with accepted academic practice. No use, distribution or reproduction is permitted which does not comply with these terms.
*Correspondence: Wenguo Fan,  ZmFud2VuZ0BtYWlsLnN5c3UuZWR1LmNu; Fang Huang, aGZhbmdAbWFpbC5zeXN1LmVkdS5jbg==
Disclaimer: All claims expressed in this article are solely those of the authors and do not necessarily represent those of their affiliated organizations, or those of the publisher, the editors and the reviewers. Any product that may be evaluated in this article or claim that may be made by its manufacturer is not guaranteed or endorsed by the publisher.
Research integrity at Frontiers
Learn more about the work of our research integrity team to safeguard the quality of each article we publish.