 Wei Hu1,2†Jian Liu3,4†
 Yaorui Hu2Qingling Xu5
 Tingzhi Deng2Mengna Wei2
 Lu Lu6Jia Mi2
 Jonas Bergquist2,7*
 Fuyi Xu2*
 Geng Tian2*
- 1School of Chemical Engineering and Technology, Tianjin University, Tianjin, China
- 2Shandong Technology Innovation Center of Molecular Targeting and Intelligent Diagnosis and Treatment, School of Pharmacy, Binzhou Medical University, Yantai, Shandong, China
- 3Department of Plastic Surgery, The First Affiliated Hospital of Shandong First Medical University, Shandong Provincial Qianfoshan Hospital, Jinan, Shandong, China
- 4Jinan Clinical Research Center for Tissue Engineering Skin Regeneration and Wound Repair, Jinan, Shandong, China
- 5Department of Ultrasound, Yantai Affiliated Hospital, Binzhou Medical University, Yantai, Shandong, China
- 6Department of Genetics, Genomics, and Informatics, The University of Tennessee Health Science Center, Memphis, TN, United States
- 7Department of Chemistry - BMC, Uppsala University, Uppsala, Sweden
Cholesterol metabolism in the brain plays a crucial role in normal physiological function, and its aberrations are associated with cognitive dysfunction. The present study aimed to determine which cholesterol-related genes play a vital role in cognitive dysfunction and to dissect its underlying molecular mechanisms using a systems genetics approach in the BXD mice family. We first systematically analyzed the association of expression of 280 hippocampal genes related to cholesterol metabolism with cognition-related traits and identified lipoprotein lipase (Lpl) as a critical regulator. This was further confirmed by phenome-wide association studies that indicate Lpl associated with hippocampus volume residuals and anxiety-related traits. By performing expression quantitative trait locus mapping, we demonstrate that Lpl is strongly cis-regulated in the BXD hippocampus. We also identified ∼3,300 genes significantly (p < 0.05) correlated with the Lpl expression. Those genes are mainly involved in the regulation of neuron-related traits through the MAPK signaling pathway, axon guidance, synaptic vesicle cycle, and NF-kappa B signaling pathway. Furthermore, a protein–protein interaction network analysis identified several direct interactors of Lpl, including Rab3a, Akt1, Igf1, Crp, and Lrp1, which indicates that Lpl involves in the regulation of cognitive dysfunction through Rab3a-mediated synaptic vesicle cycle and Akt1/Igf1/Crp/Lrp1-mediated MAPK signaling pathway. Our findings demonstrate the importance of the Lpl, among the cholesterol-related genes, in regulating cognitive dysfunction and highlighting the potential signaling pathways, which may serve as novel therapeutic targets for the treatment of cognitive dysfunction.
Highlights
- This is the first study to systemically assess the associations between cholesterol metabolism-related genes and cognitive functions.
- Among the 280 cholesterol metabolism-related genes, we found that decreased Lpl expression is associated with impaired cognitive function, as well as emotional and anxious behaviors, through modulation of synaptic vesicles and MAPK signaling pathways.
- This finding demonstrates that Lpl is a crucial regulator of cognitive function and may serve as a novel therapeutic target for the treatment of cognitive dysfunction.
Introduction
The cholesterol metabolism maintains crucial physiological functions in the brain (Zhang and Liu, 2015). Dysfunction of this pathway is associated with various neurological and neurodegenerative disorders, including Alzheimer’s, Huntington’s, and Parkinson’s diseases (Pfrieger, 2021). Even though the detailed mechanism remains largely unknown, several recent studies have confirmed the causal relationship between cholesterol metabolism and cognitive function (Djelti et al., 2015). However, cholesterol metabolism is a complicated process including over 200 genes involved in cholesterol synthesis, transportation, uptake, storage, and release (Martín et al., 2014), how these genes are systematically associated with cognitive function is still unknown.
With the development of high throughput sequencing technology, transcriptome-wide association study (TWAS) has become a powerful approach to establishing the association between gene expression and phenotypes at a population level (Wainberg et al., 2019). Establishing a gene–gene and gene–phenotype correlation network makes it possible to identify potential key regulators and mechanisms. Moreover, with the further combination of expression quantitative trait locus (eQTL) analysis, it is even possible to reveal the potential genetic regulation of certain genes. Nevertheless, such analysis in neurological studies requires assessing the gene expression of central nervous system (CNS) tissue, which is not practical in the human population (Li and Auwerx, 2020). The mouse genetic reference population has been extensively used for genetics studies in neurodegenerative disorders (Li, 2019). The BXD mice family contains over 150 recombinant inbred strains, which descended from the hybridization between inbred strains C57BL/6J (B6) and DBA/2J (D2) with stable genetic variations (Ashbrook et al., 2021). In addition, dozens of transcriptomes across various CNS tissues have been generated. Combing these data with the cognition phenotypes makes it a unique resource to perform a TWAS study in neurological study.
This study aimed to explore the cholesterol-related gene expression associated with cognitive dysfunction and its underlying mechanism with a TWAS study based on the BXD population. The result reveals the Lpl expression level in the hippocampus is significantly correlated with the learning and memory function. Moreover, the Lpl expression is strongly genetic cis-regulated, and the potential of the mechanism is discussed.
Materials and methods
Hippocampus transcriptomic data set
The hippocampus is an important and intriguing part of the forebrain that is crucial in memory formation and retrieval and is often affected in epilepsy, Alzheimer’s disease, and schizophrenia. The BXD hippocampus transcriptomic data set used in this study provides estimates of mRNA expression in the adult hippocampus of 67 BXD recombinant inbred strains, two parental strains (C57BL/6J and DBA2/J), and two reciprocal F1 hybrids. The raw microarray data are available on GEO1 under the identifier GSE84767. The normalized data set “hippocampus Consortium” is available on the GeneNetwrok (Mulligan et al., 2017) under the “BXD” group and “hippocampus mRNA” type with the identifier “Hippocampus Consortium M430v2 (June 06) RMA”. Below are brief descriptions of how this data set was generated.
Mice and tissue harvesting
Animals from 71 BXD strains were obtained and housed at the UTHSC under the controlled breeding environment with 40∼60% humanity and 18∼22°C. Mice were euthanized by cervical dislocation at the age of 45–90 days. Brains were removed and placed in RNA later, and the whole hippocampi were dissected. All procedures involving mouse tissue were approved by the Institutional Animal Care and Use Committee at the University of Tennessee Health Science Center.
RNA extraction and evaluation
A pool of dissected tissue, typically from six hippocampi and three naive adults of the same strain, sex, and age, was collected in one session and used to generate cRNA samples. A total of 143 RNA samples were extracted with RNA STAT-60 according to the manufacturer’s instructions. This includes tissue homogenization, RNA extraction, precipitation, and wash. The RNA was further purified with Na4OAc, and its purity and integrity were evaluated using the 260/280 nm absorbance ratio and the Agilent Bioanalyzer 2100, respectively. RNA with 260/280 values greater than 1.8 and RNA integrity numbers greater than 8 are required to run the array.
Microarray and data normalization
Pooled RNA samples from two to three animals were hybridized into a single Affymetrix GeneChip Mouse Expression 430 2.0 short oligomer arrays. Raw microarray data were normalized using the RMA methods (Bolstad et al., 2003) and further transformed with a modified z-score (2z + 8) (Chesler et al., 2005). This analysis was done with R statistical functions. The detailed sample info is listed in Supplementary Table 1.
eQTL mapping
For the analyses presented here, whole genome eQTL mapping was carried out using 71 BXD strains on GeneNetwork with a modified Haley–Knott regression (Haley and Knott, 1992). The resulting likelihood ratio statistic (LRS) was used to evaluate the associations between the genotypes2 and gene expression levels. Genome-wide significant and suggestive thresholds were determined with 1,000 permutation tests. This analysis was done on GeneNetwork.
Sequence variants
Genetic variations between parental strains B6 and D6 were searched with our previous whole genome resequencing data and Mouse Genome Project3 (Keane et al., 2011).
Correlation analysis
The Pearson correlation coefficient analysis was deployed to identify the covariates of the gene of interest and the BXD-published traits/phenotypes. A p-value lower than 0.05 is considered statistically significant. This analysis was done on the GeneNetwork.
Gene function enrichment analysis
A gene function enrichment analysis was done with a hypergeometric test on the WEB-based Gene SeT AnaLysis Toolkit (WebGestalt)4 (Liao et al., 2019). The resulting False Discovery Rate (FDR) lower than 0.05 was used to define the overrepresented terms, including the KEGG pathway and gene ontology (GO).
Phenome-wide association analysis (PheWAS)
We used the SNP genotypes (missense, splice site, and cis-eQTL variants) within the Lpl gene to perform PheWAS against 5,000 clinical phenotypes in the BXD population (Li et al., 2018). The multi-locus mixed-model approach (mlmm) was used to estimate the associations between Lpl and clinical phenotypes. The kinship matrix from BXD strains was applied to account for the population structure. The Bonferroni’s method was used to correct the multiple testing. The clinical phenome is currently split into 13 broad categories based on general biological ontologies. This analysis was done on Systems Genetics and Omics Toolkit5 (Li et al., 2018).
Results
Correlation analysis reveals Lpl is a crucial regulator of cognitive function in BXD mice
To determine which cholesterol-related genes play a pivotal role in cognitive function, we determined the expression levels of 280 genes linked to cholesterol metabolism across the BXD hippocampus. We performed correlation analysis against two cognition-related traits, Morris water maze performance and y-maze performance (Supplementary Table 2 and Figure 1). This gene list was compiled from the gene ontology database AmiGo 26 by searching “cholesterol.” Among the 280 genes, 6 genes (Lpl, Apoa5, Lipe, Cyb5r3, Abcg4, and Mbtps1) were associated with Morris water maze performance (BXD_15171, p < 0.05), 12 genes (Lpcat3, Gnb3, Hsd3b6, Egf, Abca12, Osbp, Lpl, Abcg5, Lipc, Slco1a6, Cln8, and Fdxr) were associated with y-maze performance (BXD_20728, p < 0.05), and only one gene Lpl was significantly correlated with both investigated traits (p < 0.05, Figure 1).
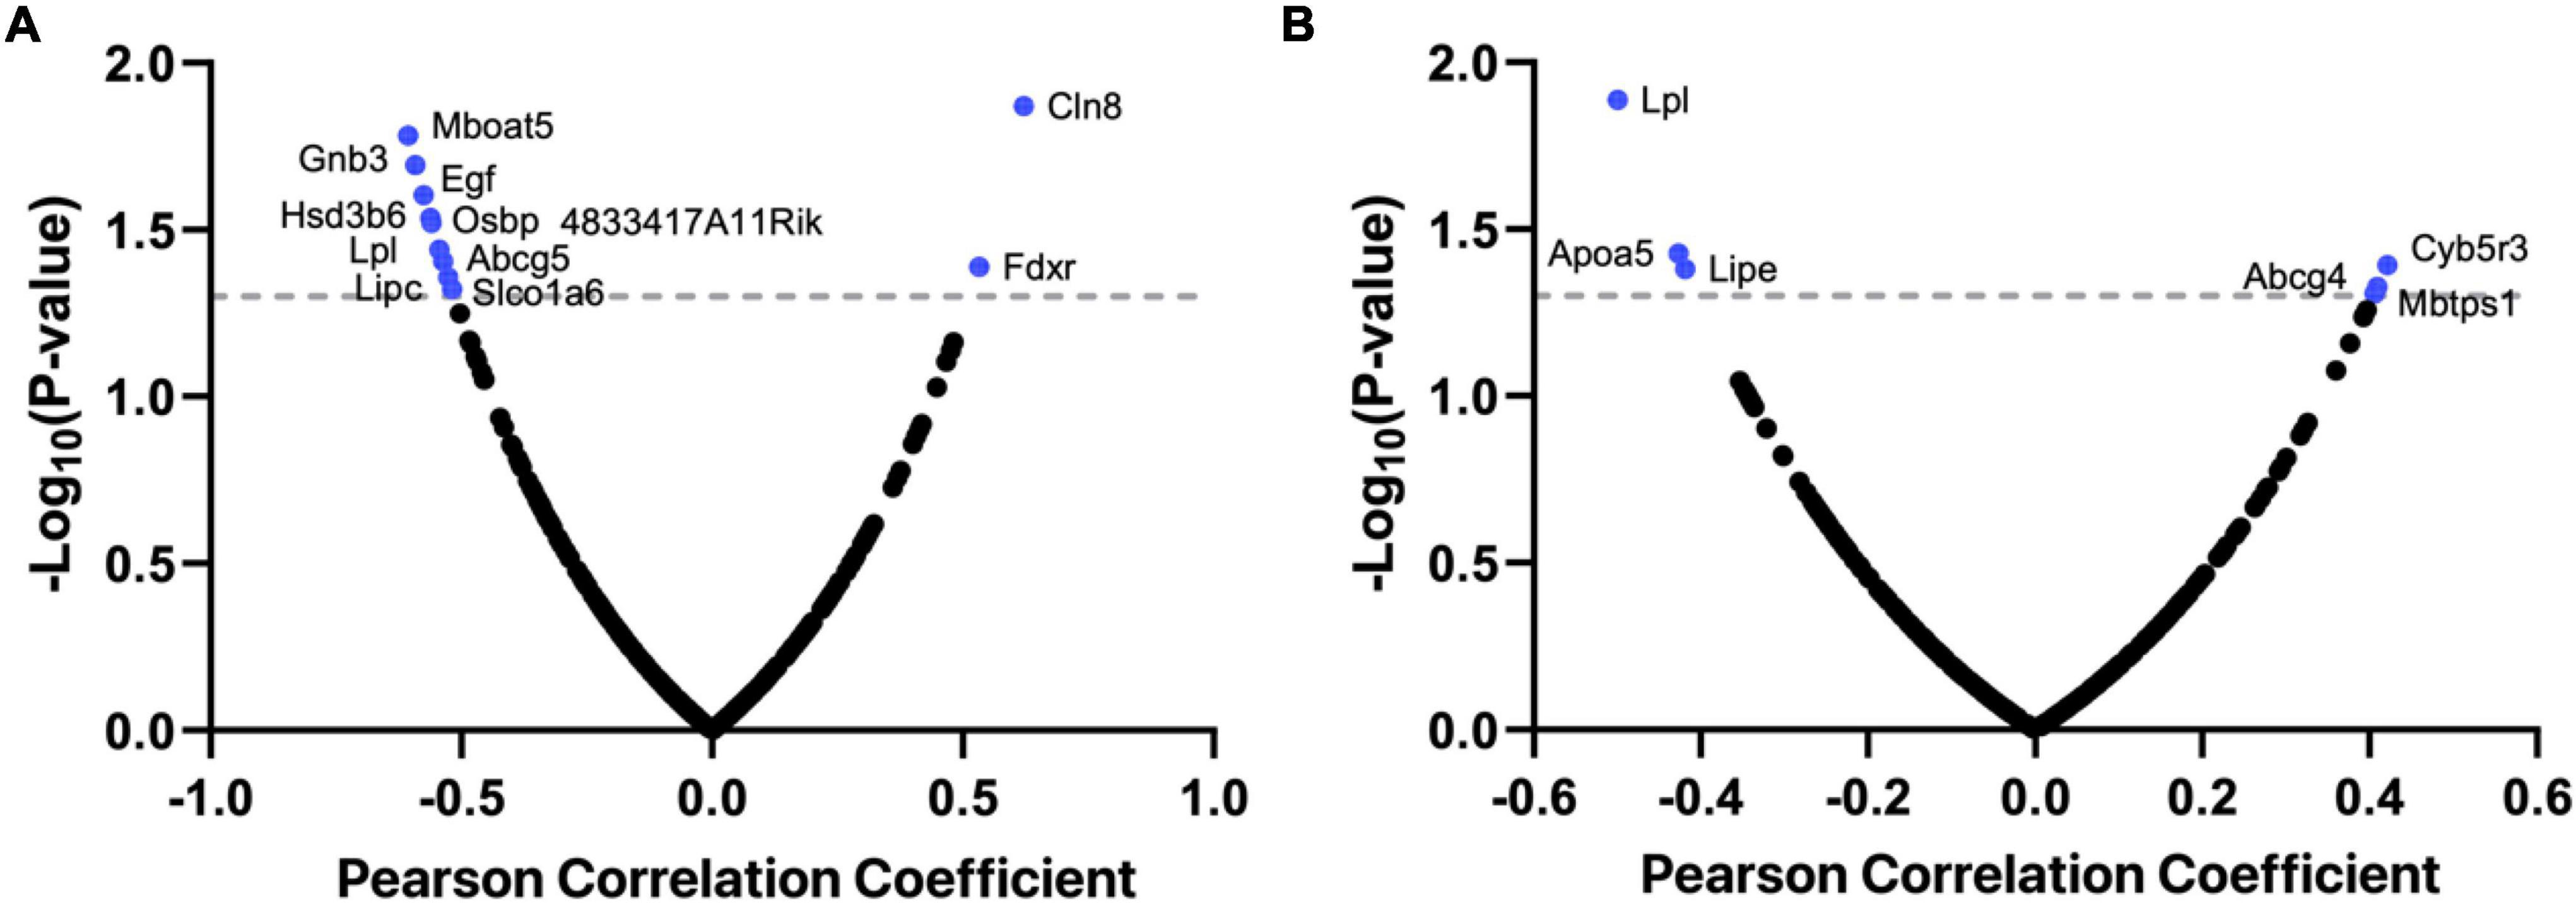
Figure 1. Bubble charts showing Lpl is a crucial regulator of cognitive function in BXD mice. The mRNA levels of 280 cholesterol-related genes in the BXD hippocampus were correlated against two cognition-related traits, Morris water maze performance (A) and y-maze performance (B). Pearson correlation coefficient and -log10 p-value are indicated in the x- and y-axis. This analysis was done on the GeneNetwork (https://www.genenetwork.org/).
Lpl is associated with multiple cognition-related traits from both genotype and intermediate phenotype
In addition to the associations with Morris water maze performance (r = −0.499, p = 0.013) and y-maze performance (r = −0.544, p = 0.036, Figure 1), Lpl mRNA levels were also found to be negatively correlated with extinction learning (r = −0.487, p = 0.029, Figure 2A) and positively related with fear conditioning (r = 0.498, p = 0.042, Figure 2B). Moreover, PheWAS between Lpl genotype and BXD phenome, comprising of ∼5,000 traits, revealed 19 traits showing moderate association (-log10(p) > = 3, Figure 2C and Table 1). This includes ventral hippocampus volume residuals and several anxiety assays, such as the time in open quadrants using an elevated zero maze.
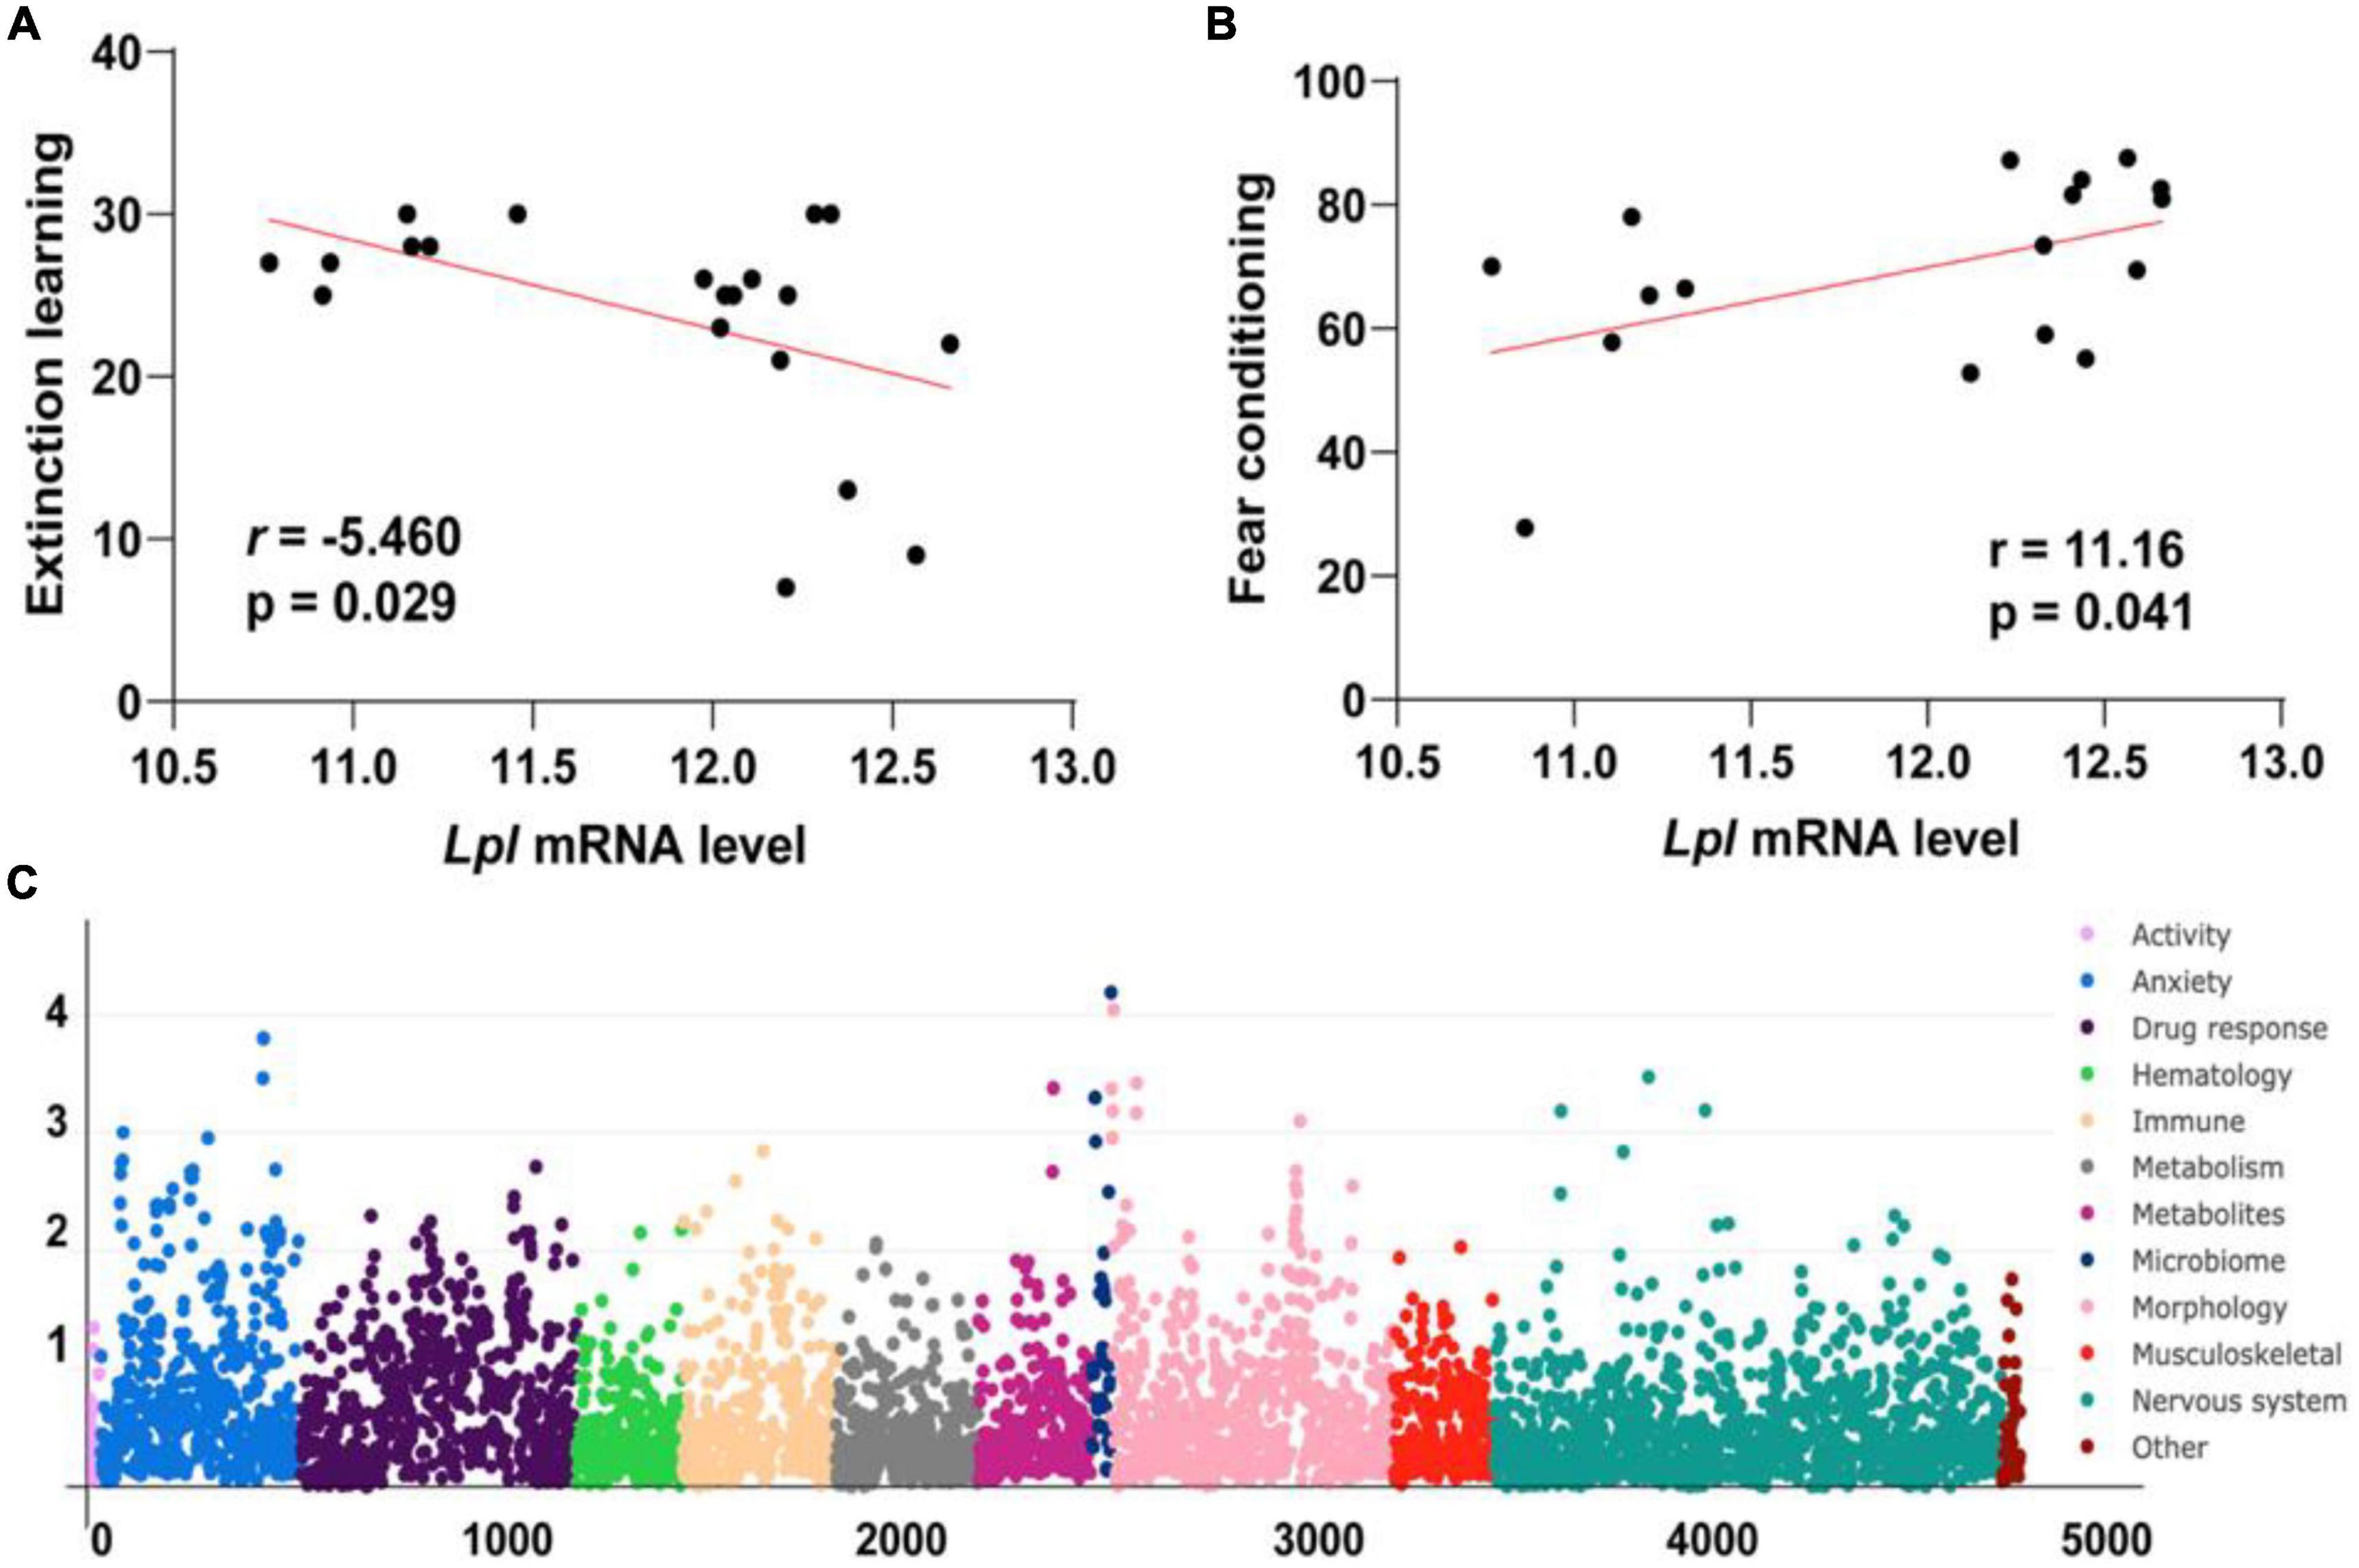
Figure 2. Lpl is associated with multiple cognition-related traits. Scatter plots of the correlations between the expression of Lpl and extinction learning (A) and fear conditioning (B). The Pearson correlation coefficient was used to determine the relationship. Manhattan plots showing the Lpl-associated phenotypes in BXD mice (C). This analysis was done on systems genetics (https://systems-genetics.org/) with the multi-locus mixed-model approach. The clinical phenome was grouped into 11 broad categories based on general biological ontologies, including activity, anxiety, drug response, hematology, immune, metabolism, metabolites, microbiome, morphology, musculoskeletal, and nervous system. P-values were adjusted with the Bonferroni’s method.
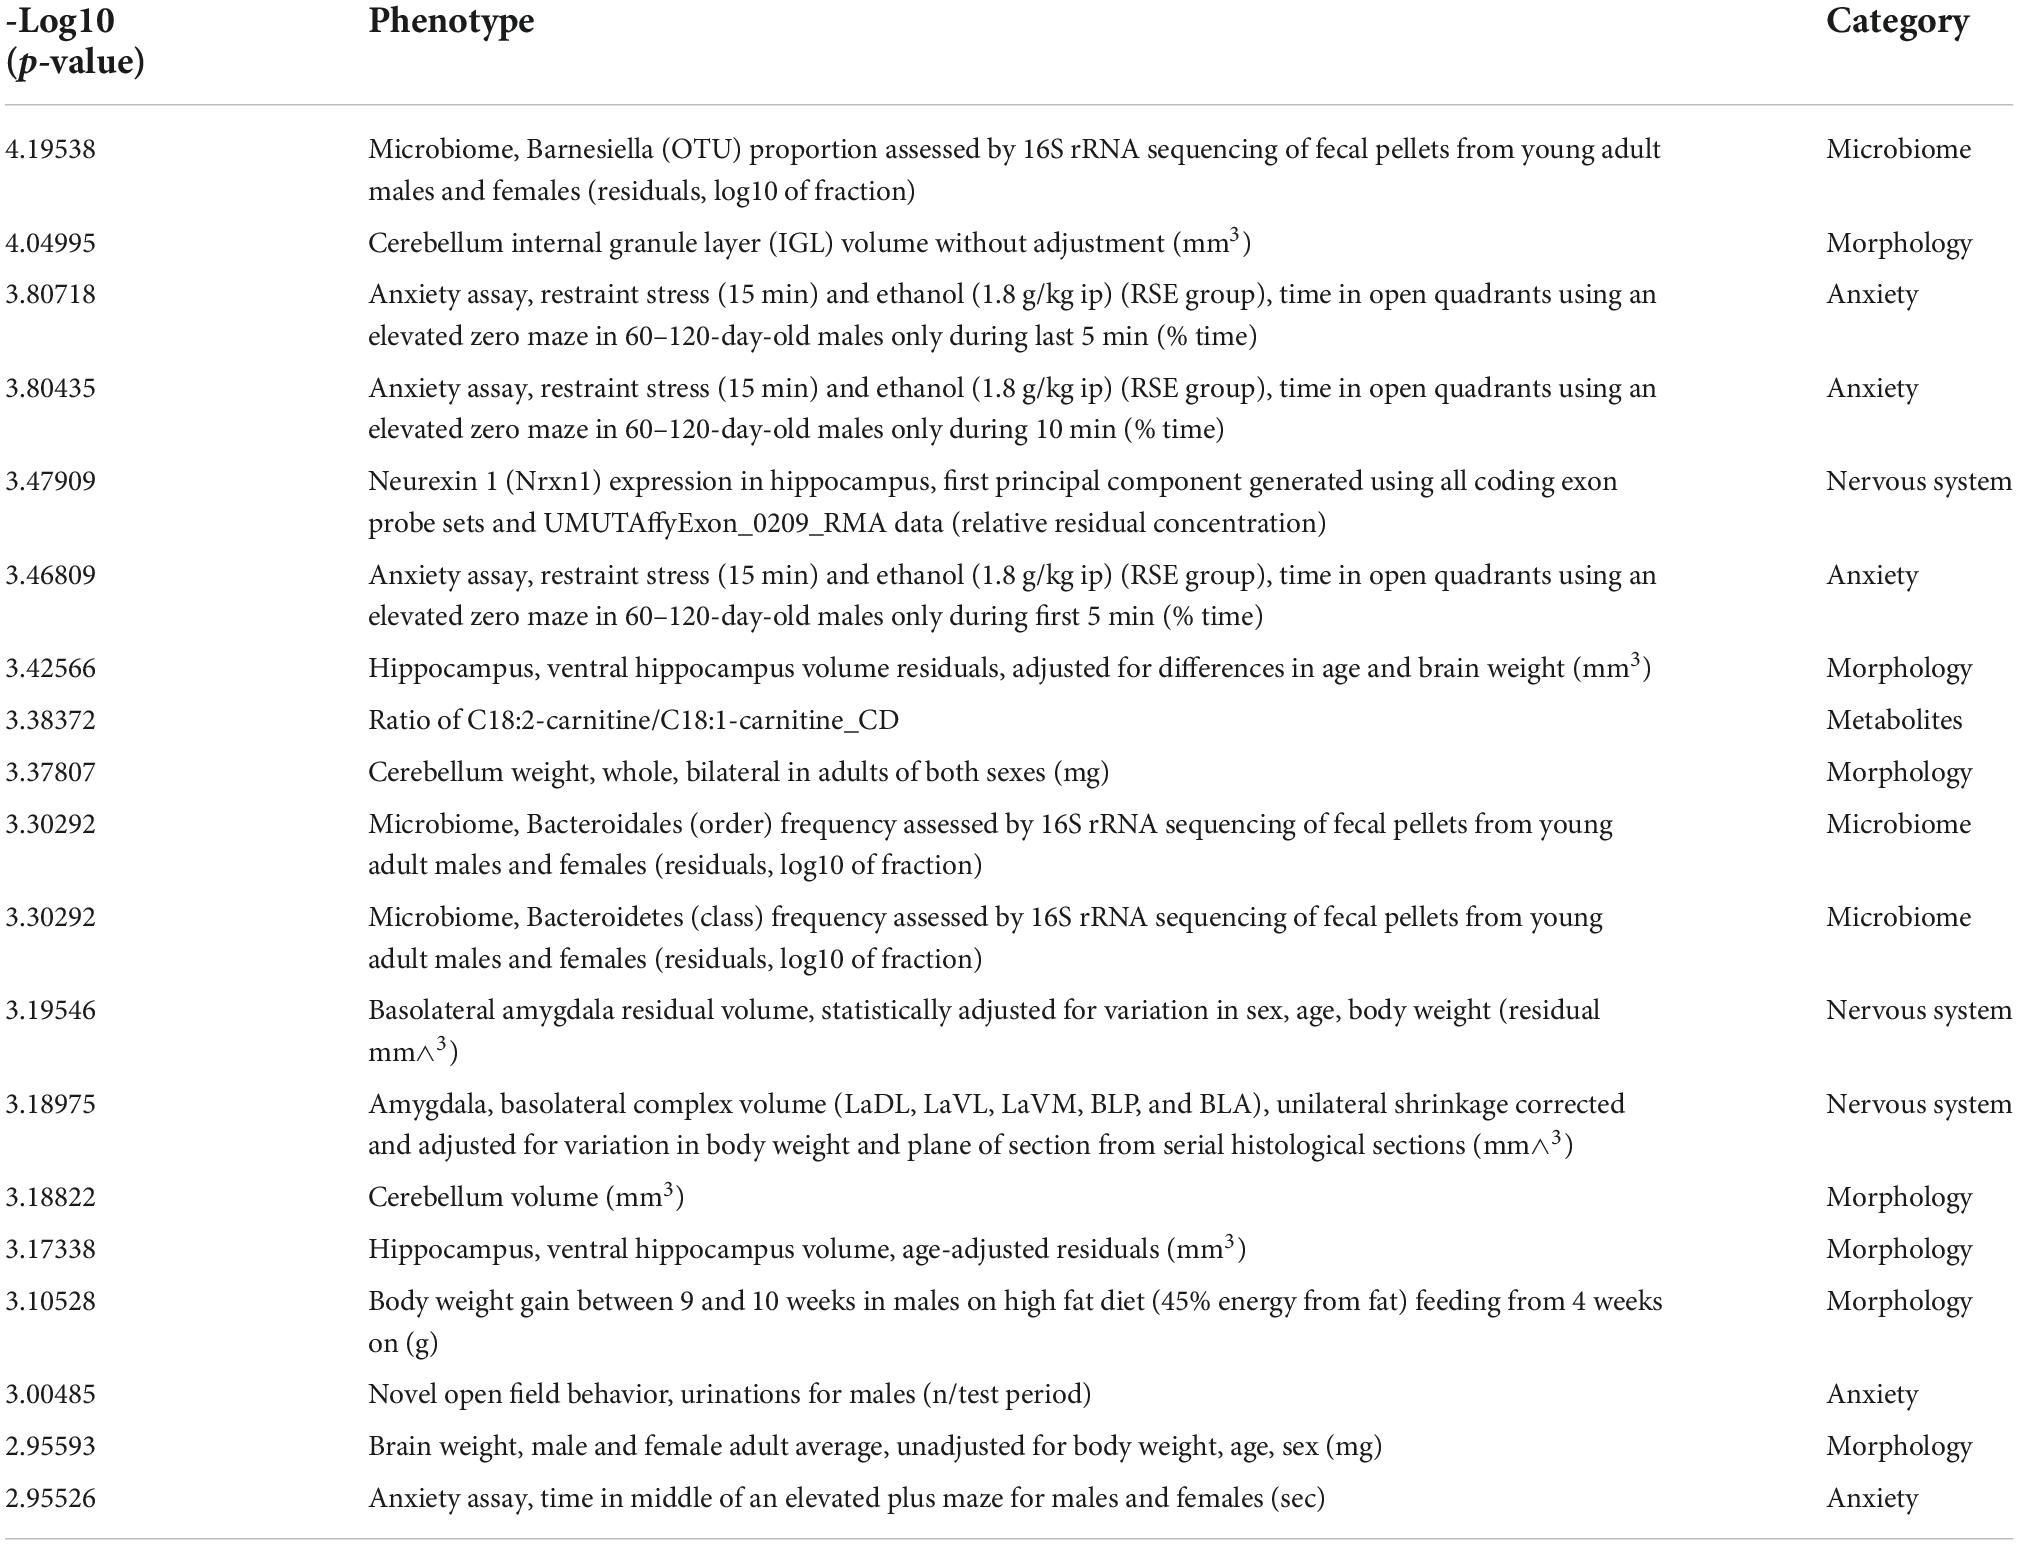
Table 1. Lists of the 19 Lpl-associated phenotypes.
The expression level of Lpl in the BXD hippocampus is strongly cis-regulated
We examined the hippocampus transcriptome across 67 BXD lines plus the two parentals, B6 and D2, and the two F1 hybrids. Two probes target the Lpl gene body, with one probe (1415904_at) at the distal 3′ UTR region and one (1431056_a_at) targeting exons 7, 8, and 9. The average mRNA level of 1415904_at is 11.815 ± 0.612 SD, with the B6 and BXD99 mice having the lowest and highest expression of 10.768 and 12.219 (Figure 3A), respectively. For probe 1431056_a_at, the average mRNA level is 8.798 ± 0.453 SD, with the B6 and BXD99 mice having the lowest and highest expression of 8.079 and 9.994 (Figure 3B), respectively. Those two probes showed consistent expression patterns across the BXD mice, with a Pearson correlation r = 0.943 and p-value < 0.0001.
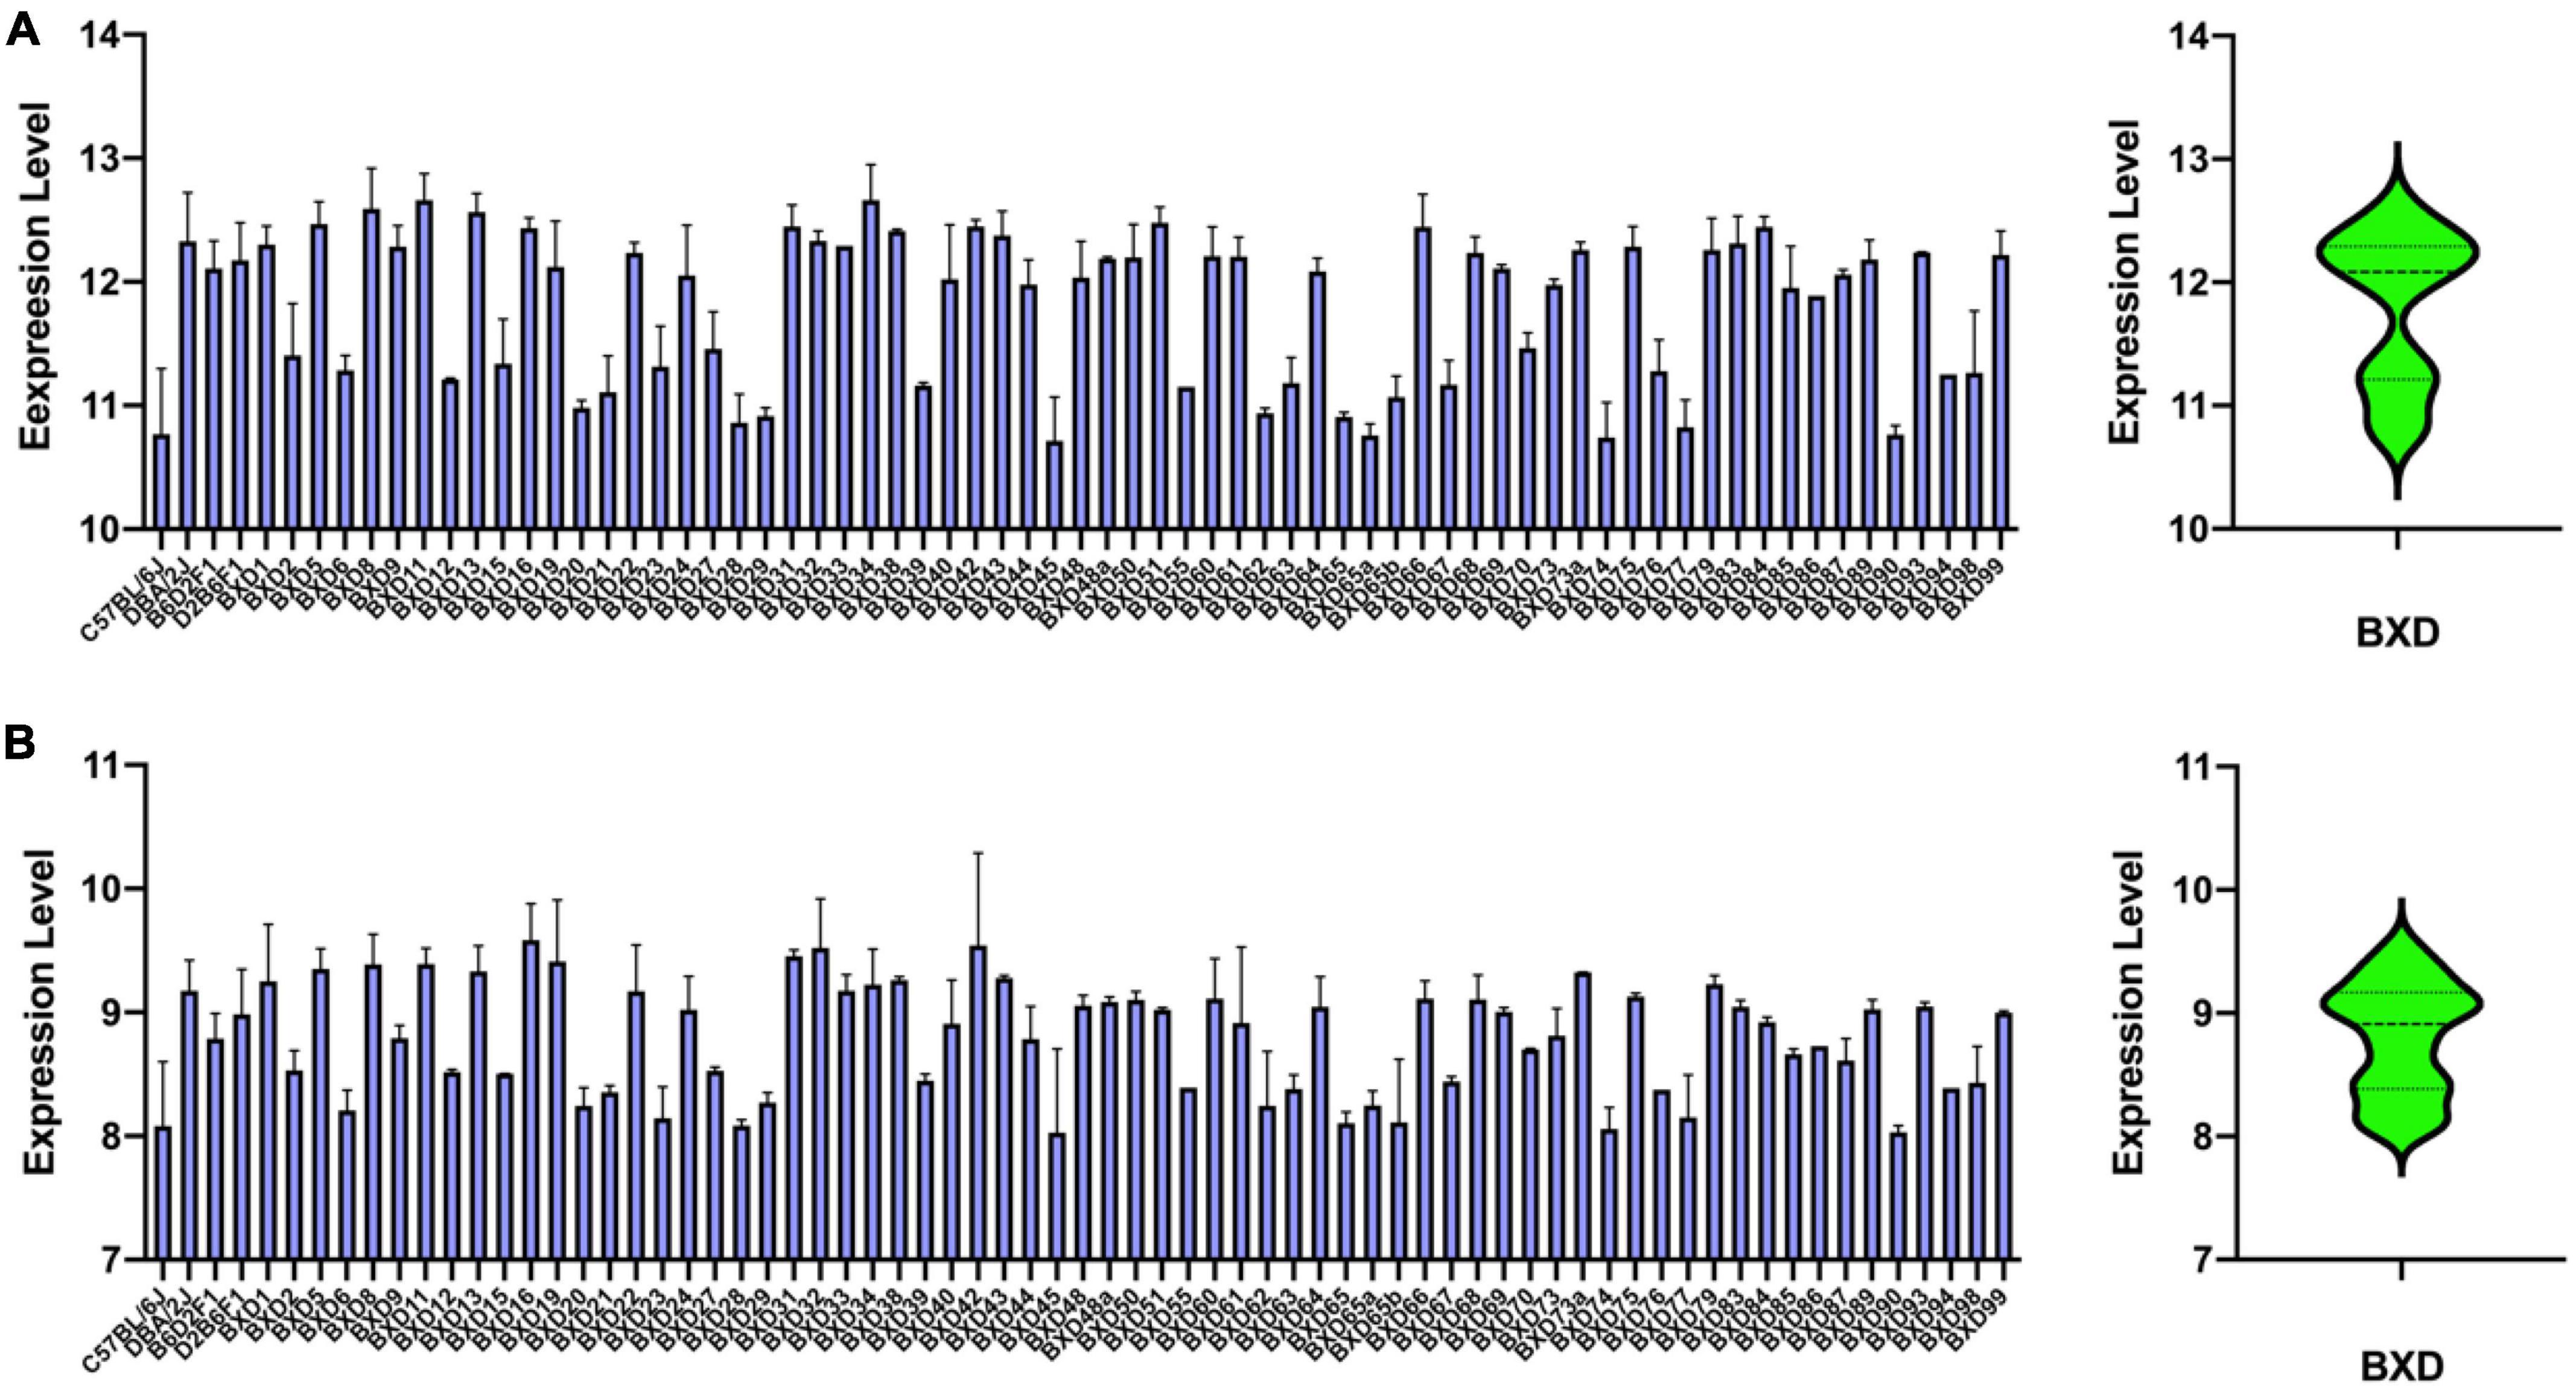
Figure 3. Bar and violin plots showing the Lpl expression variation across the BXD hippocampus. A total of 71 strains were employed for hippocampal transcriptomic profiling, with two probes 1415904_at (A) and 1431056_a_at (B), representing the Lpl expression level. The values are log2 transformed, and mean ± SE was used.
Lpl is located on Chromosome (Chr) 8 at 68.9 Mb. To explore whether genomic loci regulate the Lpl expression variation, we performed a genome-wide eQTL mapping with the “interval mapping” method. Under the suggestive and significant threshold of 11.0 and 17.9 determined by 1,000 permutation tests, one significant eQTL for probe 1415904_at was mapped to Chr 8 at 69.676 Mb (rs48549917) with the peak LRS of 134.15 (Figure 4A). This locus is located at 0.1 Mb of Lpl, suggesting that Lpl is cis-regulated in the BXD hippocampus. The other probe, 1431056_a_at, was also mapped to the same locus (LRS = 99.056, Figure 4B). Moreover, we also found the same cis-QTL in several other BXD tissues, including the amygdala, brain, eye, midbrain, nucleus accumbens, pituitary, prefrontal cortex, spleen, and ventral tegmental area. Statistical analysis between the two cohorts grouped by the genotype at the QTL peak position (rs48549917) demonstrated that BXD mice with the D2 allele showed significantly higher Lpl expression than those mice carrying the B6 allele (p < 0.0001, Figures 4C, D).
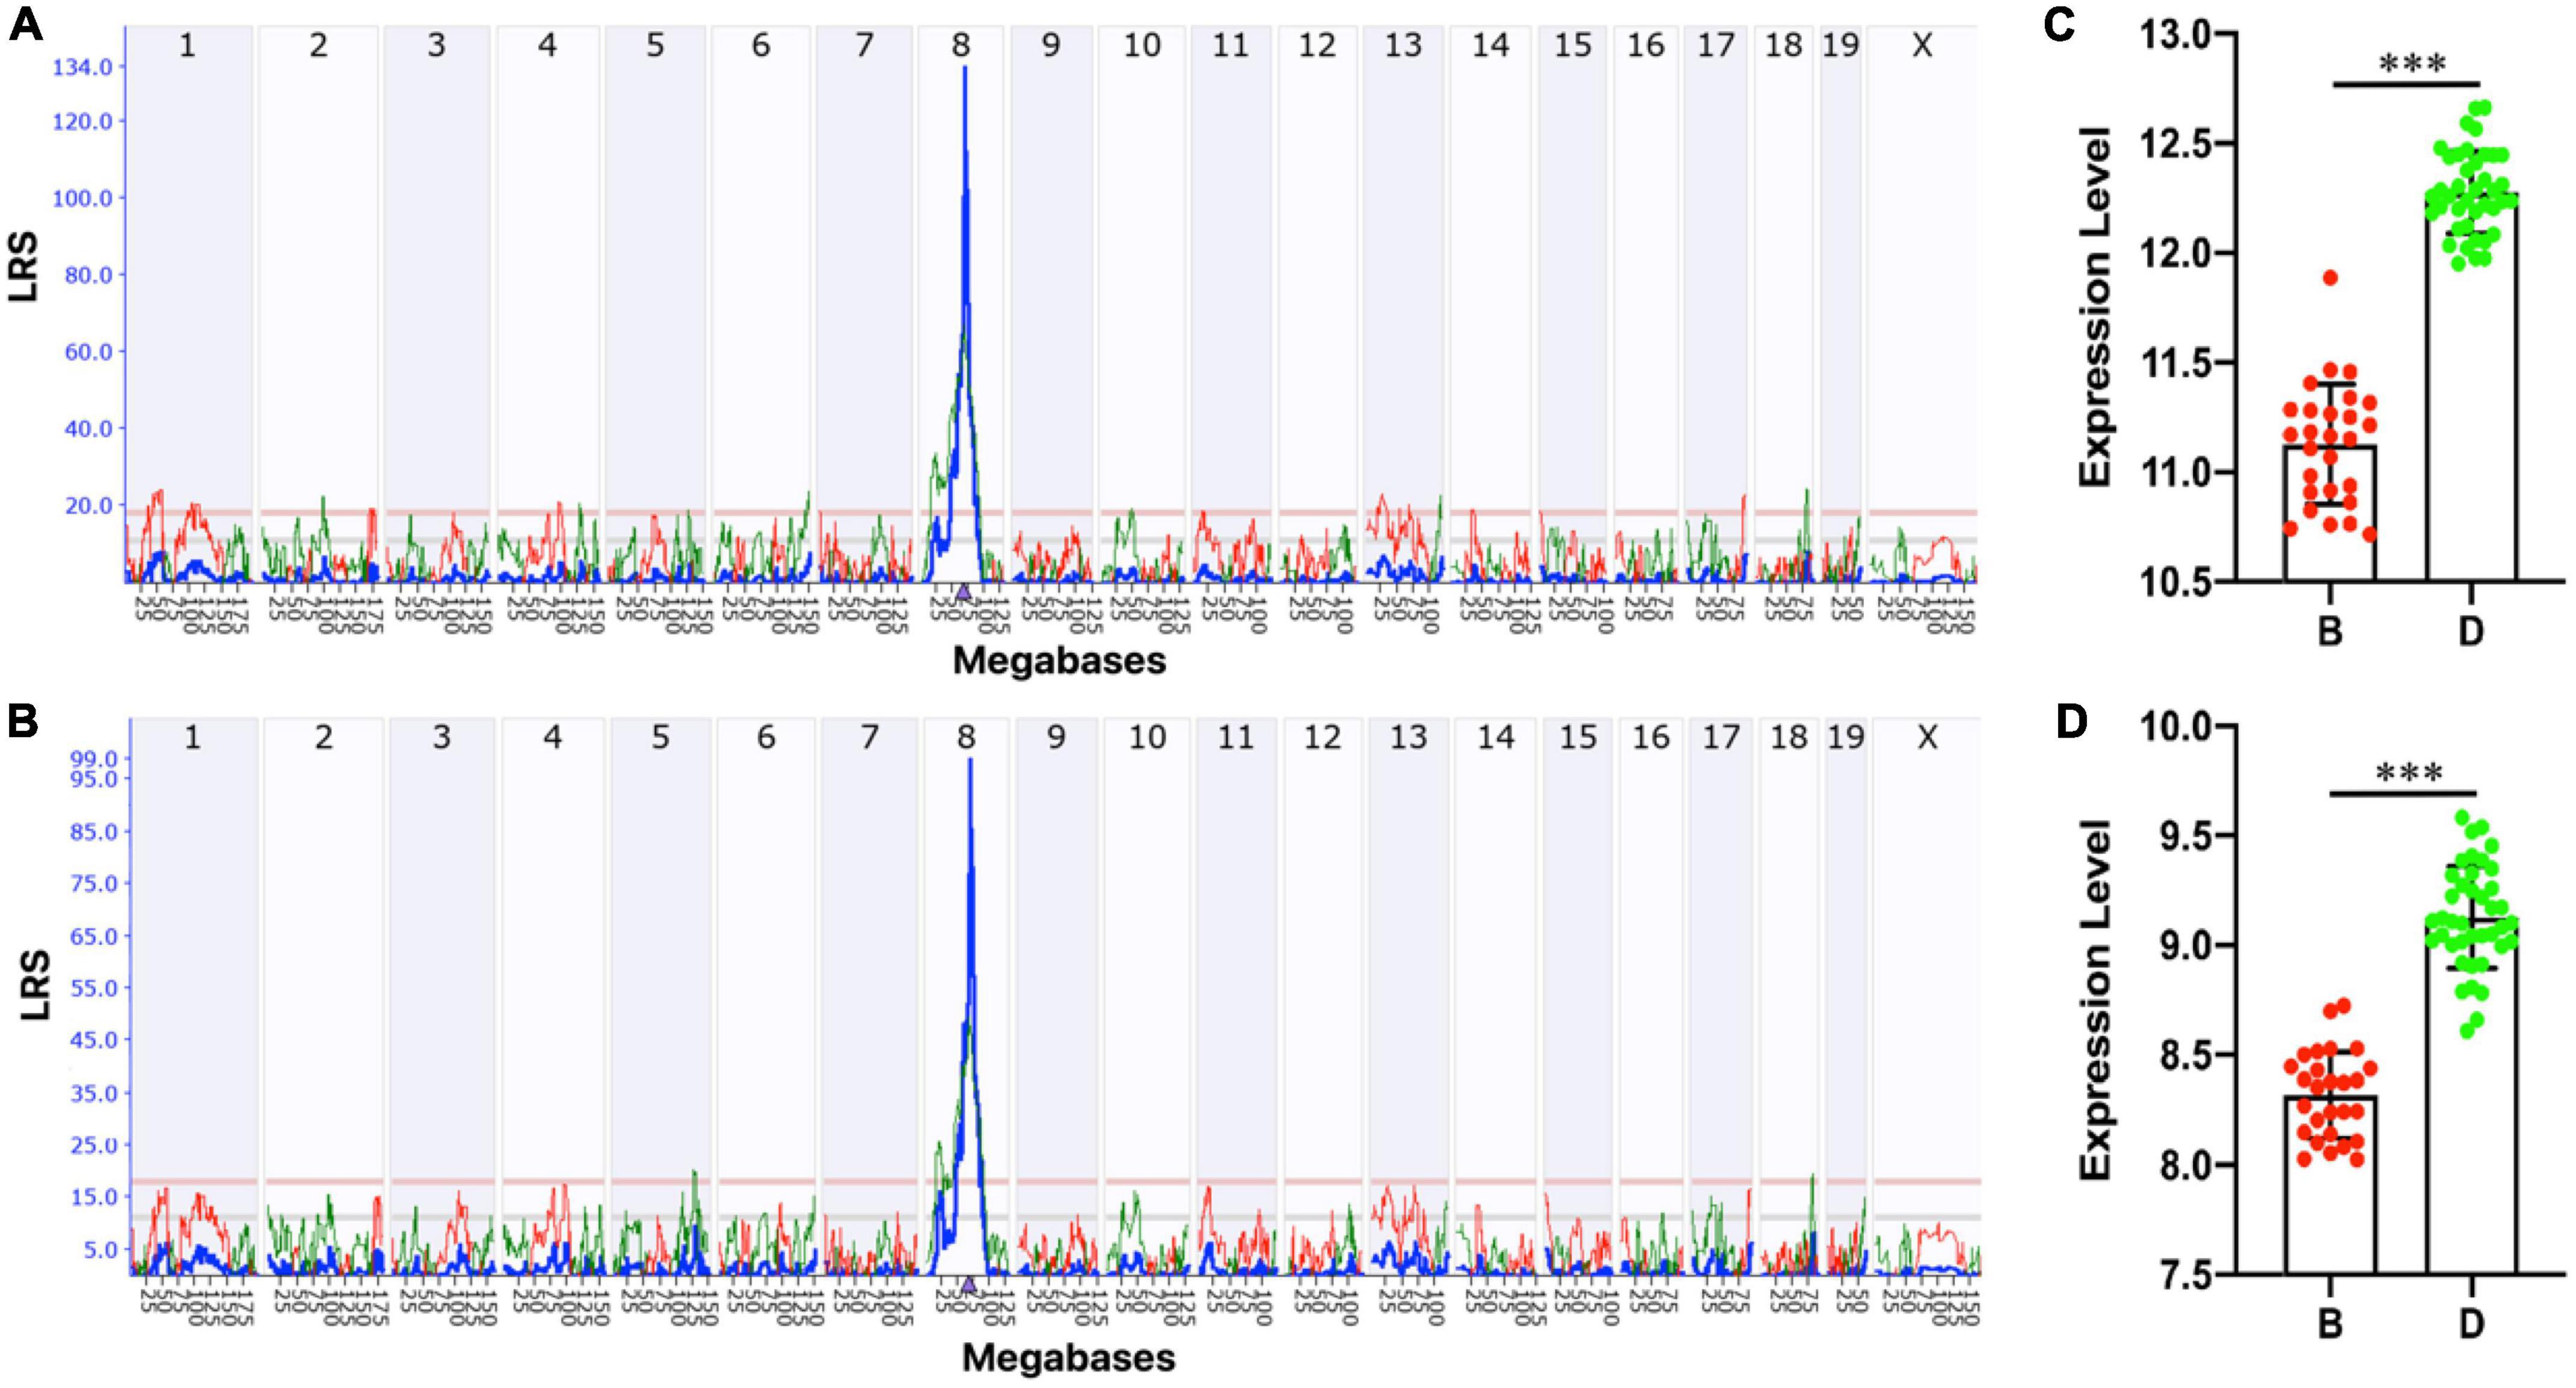
Figure 4. Expression quantitative trait locus (eQTL) mapping for Lpl. Manhattan plots showing the genome-wide regulating locus for probe 1415904_at (A) and 1431056_a_at (B) in the BXD hippocampus. The x-axis denotes a position on the mouse genome in megabases (Mb) and the y-axis indicates the LRS score. This analysis was done on GeneNetwork (https://www.genenetwork.org/) with the “interval mapping” method. The genome-wide suggestive and significant thresholds were determined with 1,000 permutation tests. Bar plots showing the mRNA level of probe 1415904_at (C) and 1431056_a_at (D) between (B,D) alleles at 69.676 Mb on Chr 8 (rs48549917). The values are log2 transformed and ***p < 0.0001.
Identification of genetic variations of Lpl
Lpl is cis-regulated, which means that sequence variants within or nearby Lpl likely affect its expression. Therefore, we explored the genetic variations on the Mouse Genome Project database, in which the whole genome was sequenced over 30 classical inbred strains, including B6 and D2. As shown in Table 2, we identified 27 SNPs at the 3′ UTR region, one SNP at the 5′ UTR region, and three SNPs at the splice region. Besides, eight SNPs were located at the Lpl coding region, with two (rs48623874, rs33121577) defined as missense variants and the other six as synonymous variants.
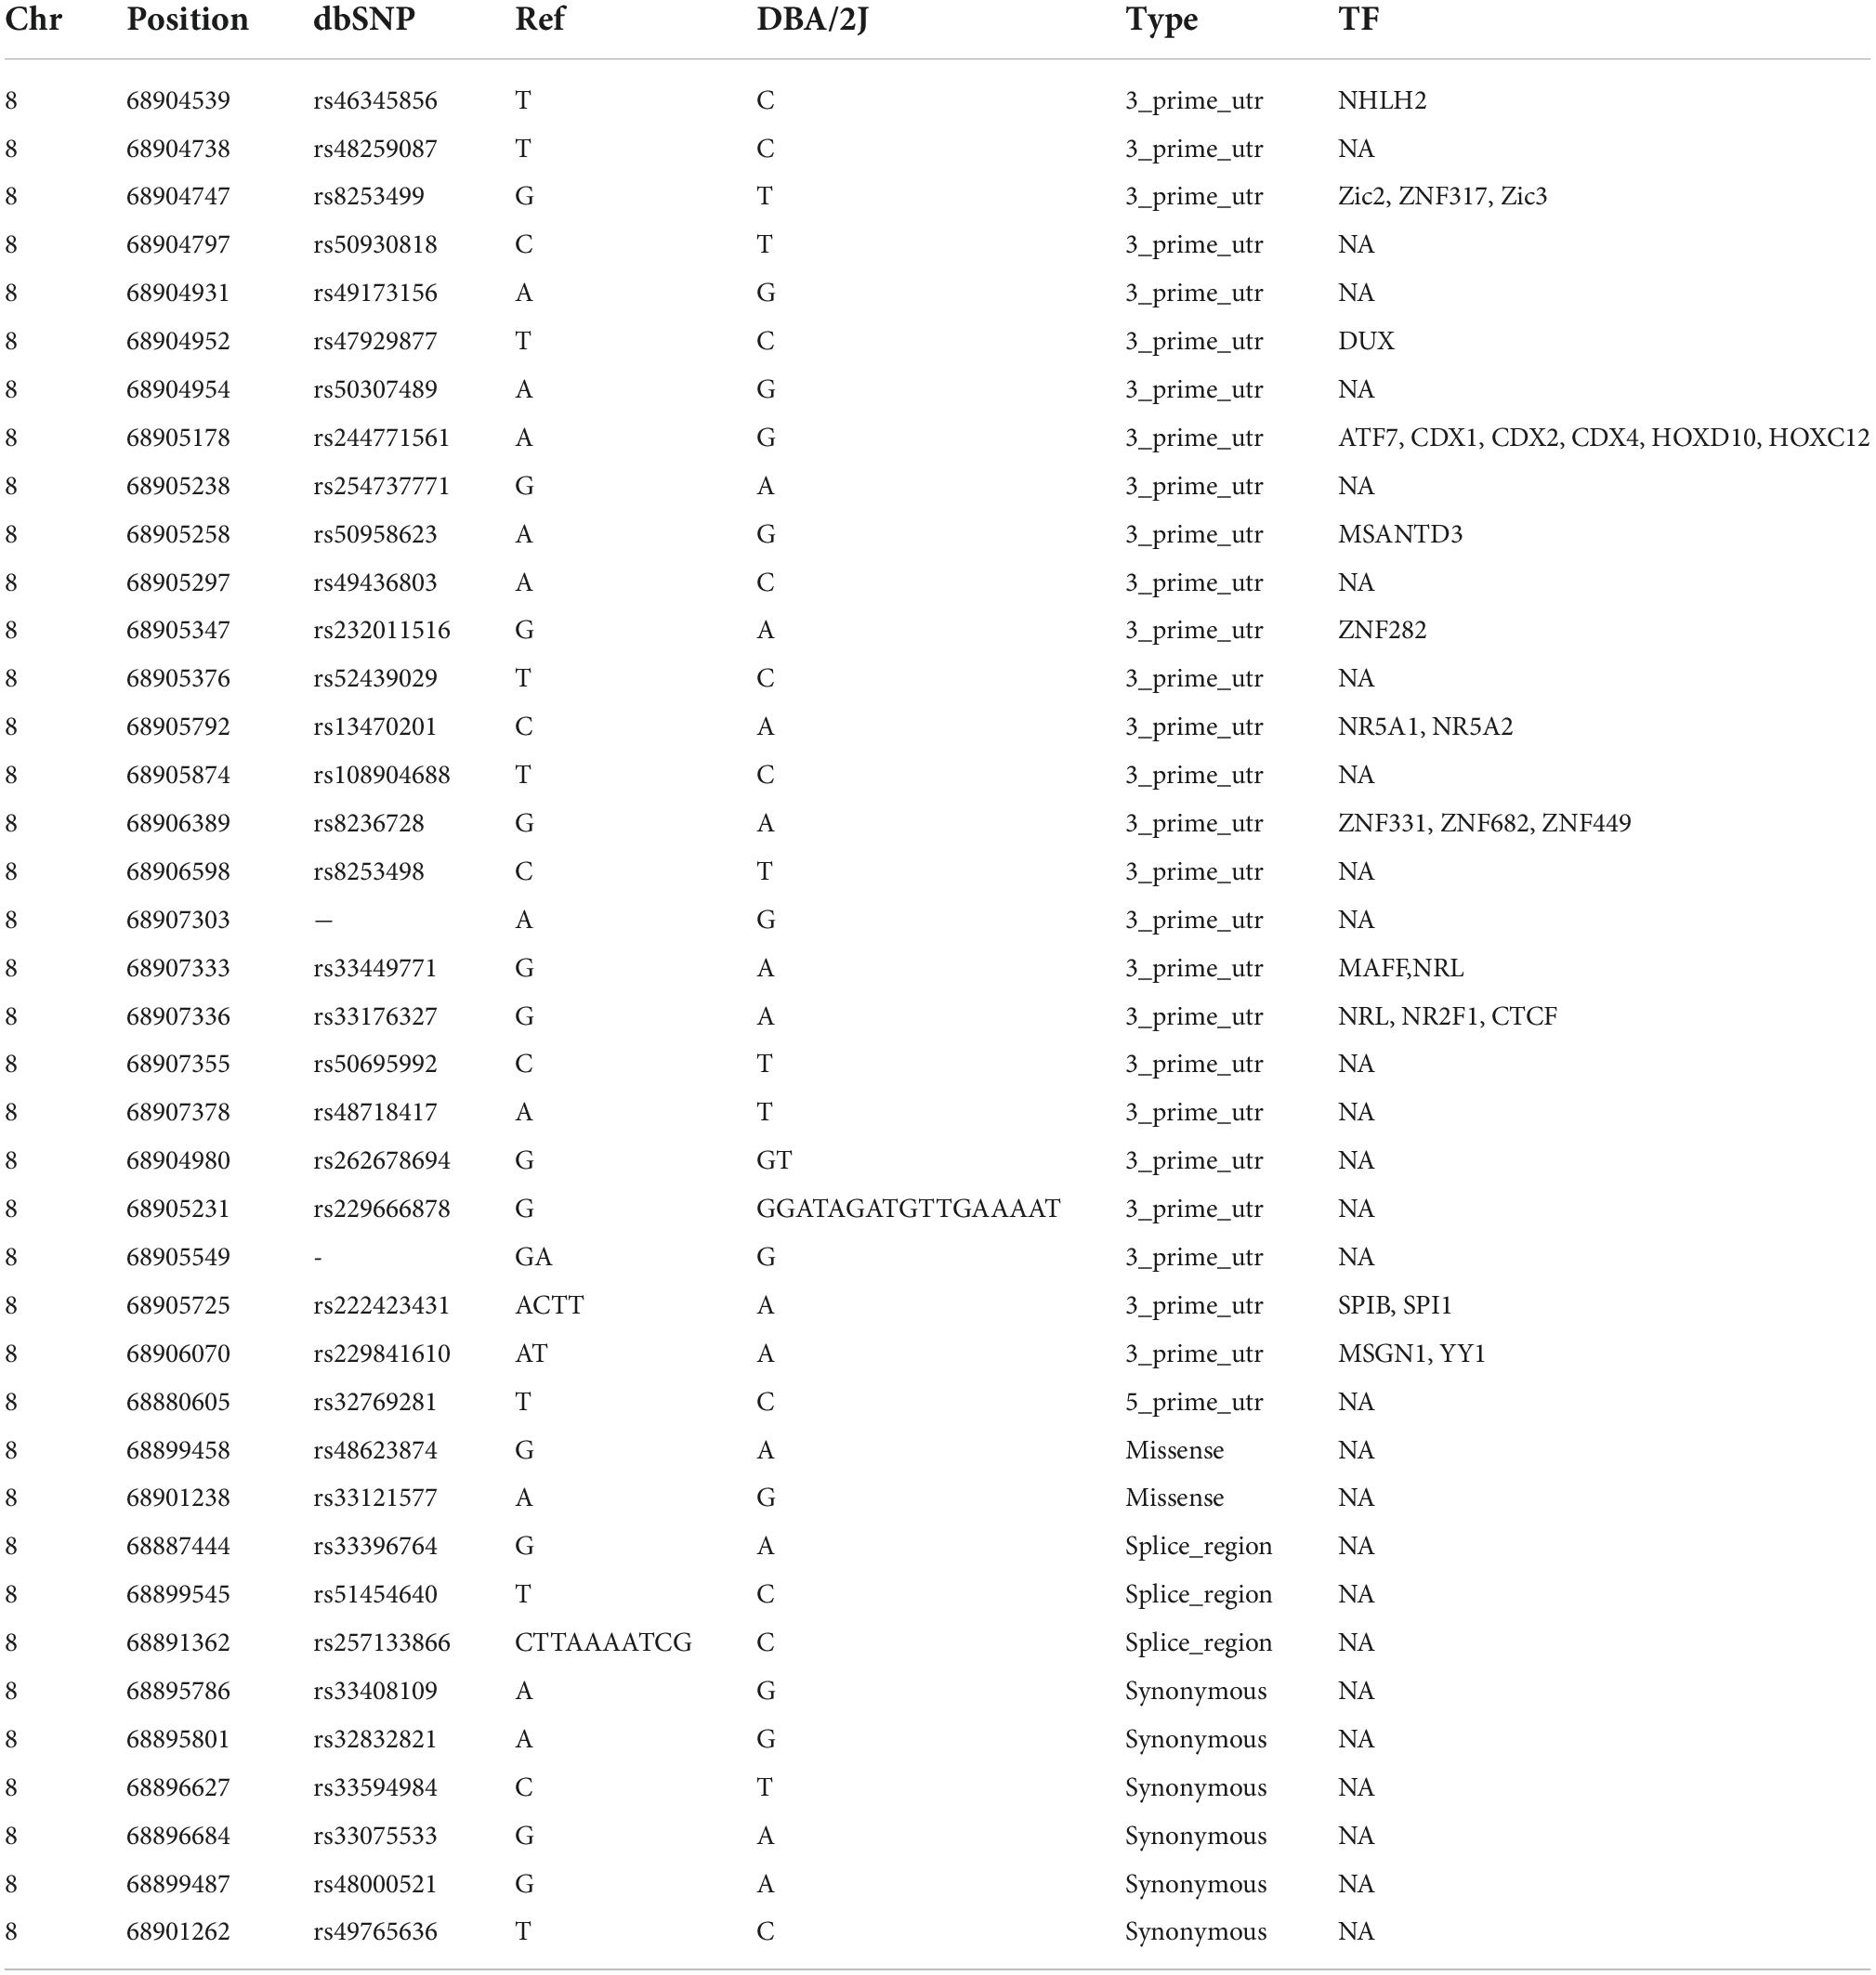
Table 2. Lists of Lpl genetic variants between B6 and D2.
We predicted the two missense variants’ functional effects on protein function with SIFT in Variant Effect Predictor (McLaren et al., 2016) and found that rs33121577 is a deleterious amino acid substitution (c.1492 A > G, p.I410M, SIFT = 0.03). We further speculate that these UTR mutations may be located at transcription factor (TF) binding motifs and affect Lpl gene expression by altering the TF binding capacity. To confirm this, we looked up the variants in the JASPAR, an open-access database storing manually curated TF binding profiles (Castro-Mondragon et al., 2022), and found that several variants hit the TF binding motifs (Table 2), including rs46345856 (NHLH2), rs8253499 (ZIC2, ZNF317, ZIC3), rs47929877 (DUX), rs244771561 (ATF7, CDX1, CDX2, CDX4, HOXD10, HOXC12), rs50958623 (MSANTD3), rs232011516 (ZNF282), rs13470201 (NR5A1, NR5A2), rs8236728 (ZNF331, ZNF682, ZNF449), rs33449771 (MAFF, NRL), rs33176327 (NRL, NR2F1, CTCF), rs222423431 (SPIB, SPI1), and rs229841610 (MSGN1, YY1).
Genetic correlations between Lpl and hippocampal transcriptome
To further understand the underlying biological processes and pathways involved in Lpl, we performed a Pearson correlation analysis between Lpl (1415904_at) and the other hippocampal genes. This resulted in 3,758 probes (corresponding to 3,364 transcripts) that are significantly (p < 0.05) correlated with the Lpl expression. The gene set enrichment analysis showed that those genes were significantly (FDR < 0.05) enriched in the GO biological processes of cell proliferation (291 genes), generation of neurons (243 genes), neurogenesis (254 genes), neuron differentiation (220 genes), and neuron development (185 genes) (Figure 5). For KEGG pathways, those genes were significantly (FDR < 0.05) involved in the MAPK signaling pathway (59 genes), axon guidance (39 genes), synaptic vesicle cycle (17 genes), and NF-kappa B signaling pathway (24 genes) (Figure 5).
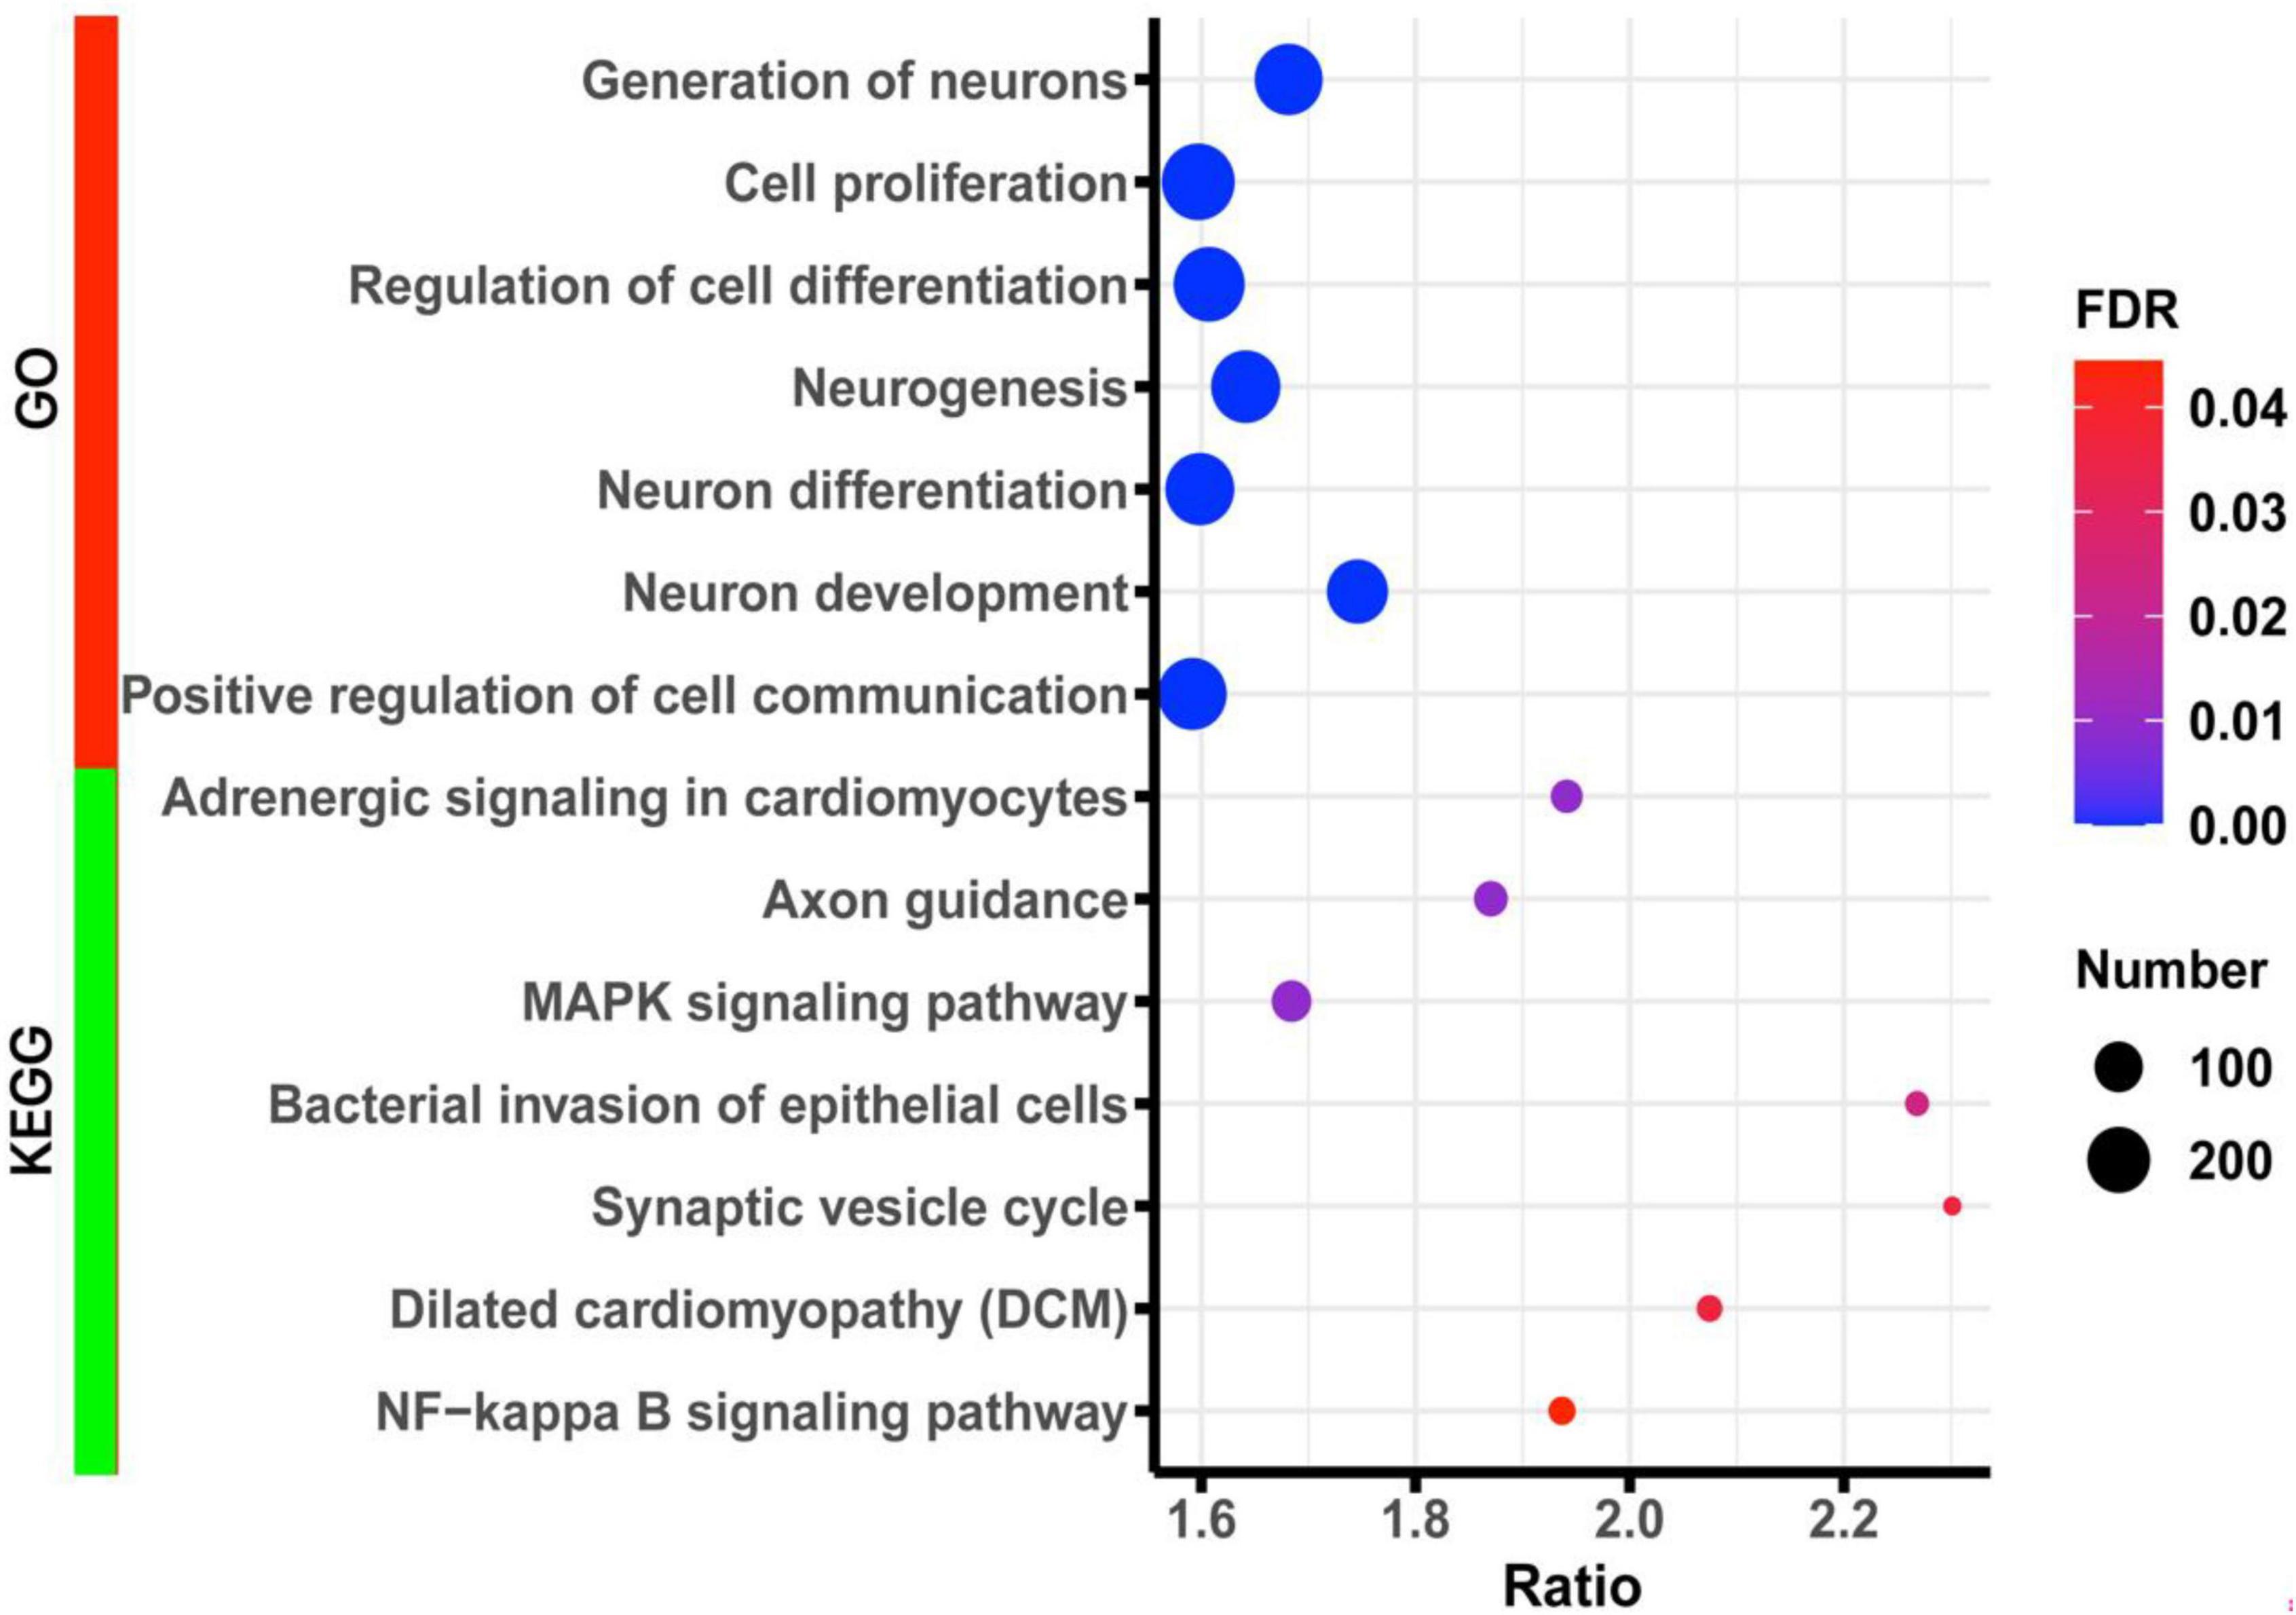
Figure 5. Bubble charts of the enrichment results of GO and KEGG terms for the Lpl correlated genes. The x-axis represents an enriched ratio, and the y-axis represents enriched terms. The size of the dots represents the number of genes, and the color indicates the FDR value. An enriched ratio is defined as the number of observed divided by the number of expected genes from the annotation category in the gene list.
Previous results have demonstrated that the synaptic vesicle cycle could be mediated by memory impairment and presynaptic dysfunction in the Lpl-deficient mice. Therefore, we further explored those 17 Lpl-correlated genes involved in the synaptic vesicle cycle. Among these, Atp6v1b2 (r = 0.550 and p = 7.69 E-07) and Rab3a (r = −0.374 and p = 0.002) show the most positive and negative correlation with Lpl, respectively.
To narrow down the Lpl potentially directly interacted genes, we searched those genes in the string website, a database of known and predicted protein–protein interactions. We identified 11 genes (Akt1, Apoh, Cebpa, Crp, Dgki, Itpkb, Lrp1, Mgll, Pcsk5, and Ppard) directly connected to Lpl (Figures 6A, B), especially for Igf1, Akt1, and Lrp1. In neurons, Lpl binds to Igf1 and activates the MAPK signaling pathway along with the PI3K/AKT1 signaling pathway, leading to amyloid β (Aβ) toxicity, increased RAGE expression, tau hyperphosphorylation, induction of apoptosis, and autophagy (Figure 6C). LRP1 regulates Aβ binding and uptake in neurons and interacts with Lpl to regulate energy homeostasis and cognitive function (Figure 6C).
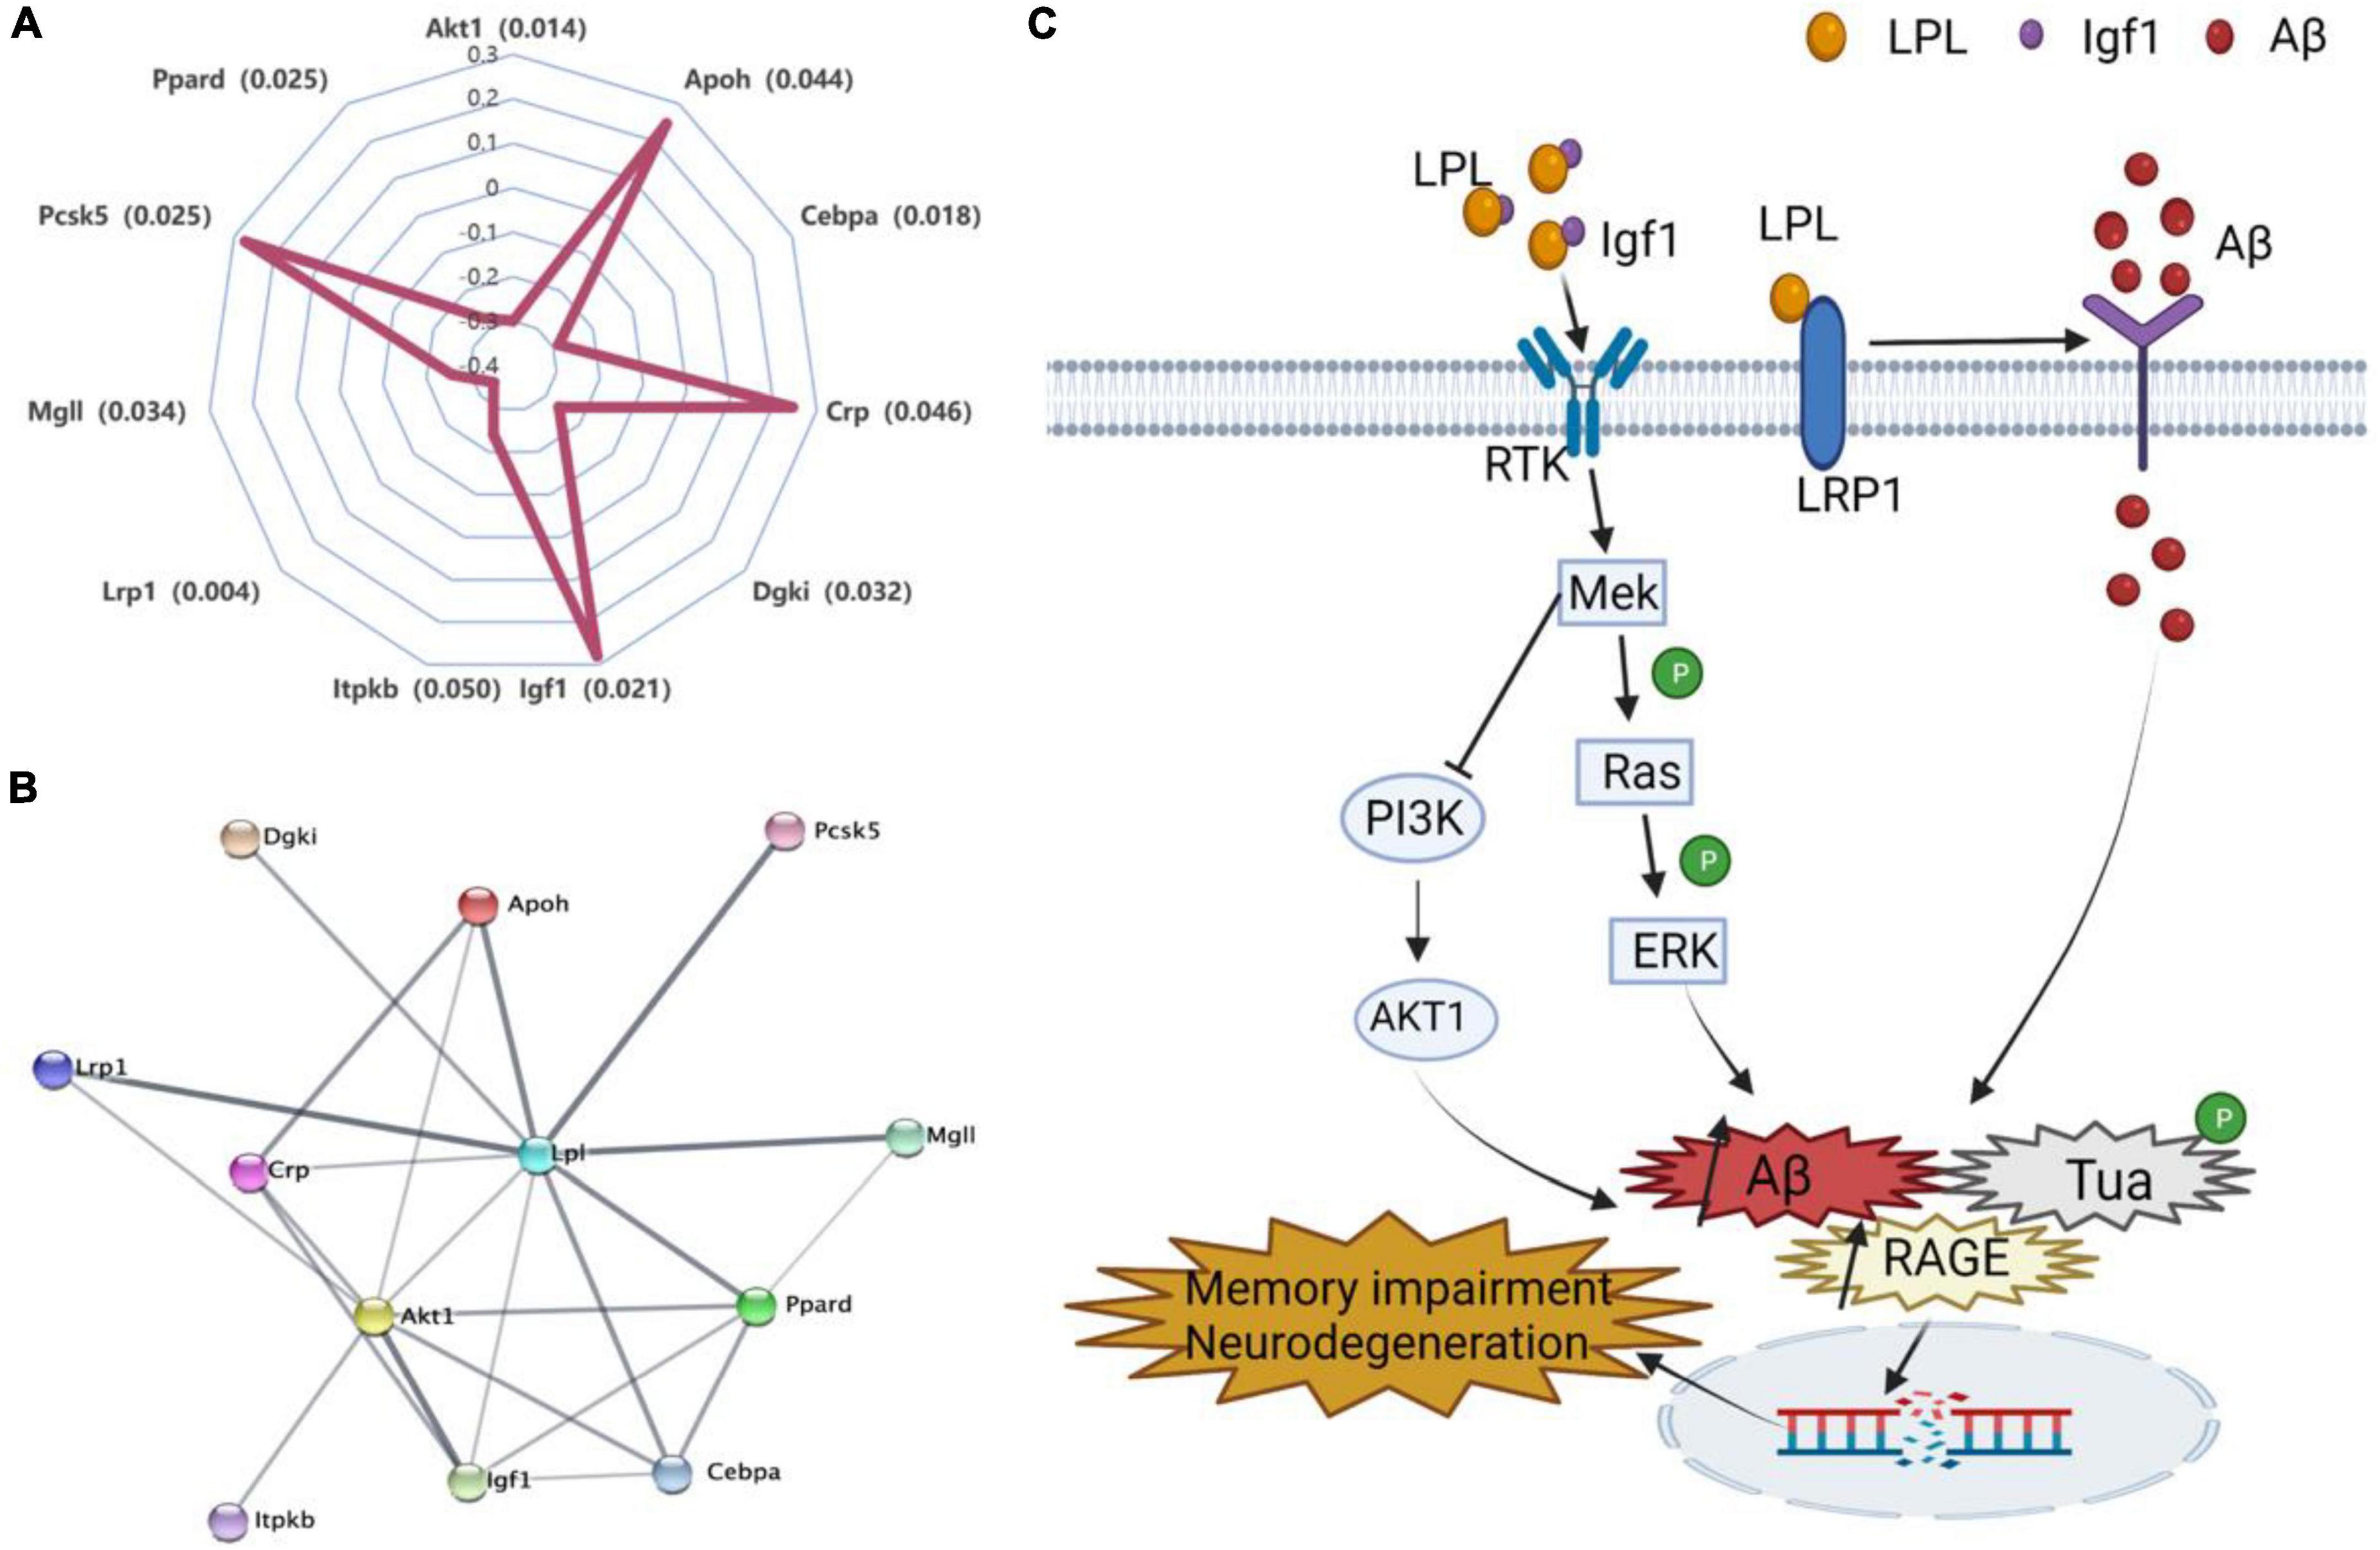
Figure 6. Molecular mechanisms of Lpl involved in the regulation of cognitive dysfunction. (A) Correlations between the expression of Lpl and its directly interacted genes. The Pearson correlation coefficient was used to determine the relationship. (B) The Lpl PPI interaction network. The network was created and evaluated with the 11 Lpl directly interacted genes using string (https://www.string-db.org/). (C) Lpl interacts with Igf1 to activate the MAPK signaling pathway while blocking the PI3K/AKT1 signaling pathway, leading to amyloidβ (Aβ) toxicity, increased RAGE expression, tau hyperphosphorylation, induction of apoptosis, and autophagy. Lrp1 regulates Aβ binding and uptake in neurons and interacts with Lpl to activate the MAPK signaling pathway, inducing neuronal damage that leads to cognitive dysfunction.
Discussion
In this study, we demonstrate, among the 280 genes related to lipid metabolism, that the Lpl plays a pivotal role in regulating cognitive function, as evidenced by the significant correlations with all four cognition-related traits. Specifically, we found a negative correlation between Lpl expression and latency to reach a hidden platform, indicating impaired cognitive function with a lower level of Lpl expression. Supporting our results, cognitive decline was observed in an Lpl deficiency mouse model, including increased latency to an escape platform and increased mistake frequency in a water maze test, and decreased latency to a platform in the step-down inhibitory avoidance test (Xian et al., 2009). In addition, our PheWAS also indicated the association of Lpl genetic polymorphisms with ventral hippocampus volume residuals and several anxiety-related behavioral traits. These findings align with the ventral hippocampus function that is involved in the control of emotional and anxious behaviors (Gulyaeva, 2015). Thus, our gene–phenotype correlation and genotype–phenotype association analysis demonstrated that Lpl is associated with cognitive dysfunction as well as emotional and anxious behaviors through modulation of hippocampus functions.
As a lipoprotein metabolism risk gene, Lpl plays a critical role in breaking down fat in the form of triglycerides, which are carried from various organs to the blood via lipoprotein molecules. LPL mRNA is found predominantly in the hippocampus and is 2.5-fold higher than in other brain regions (Wang and Eckel, 2012). A recent study has reported that AD is highly associated with LPL featuring on CNS microglia linked with phagocytosis and protection of AD (Hemonnot et al., 2019). In addition, Lpl-deficient mice displayed some degree of memory impairment and presynaptic dysfunction (Liu et al., 2014). In humans, LPL is strongly cis-regulated in whole blood, lung, spleen, thyroid, adipose, testis, and brain (GTEx Consortium, 2020). Moreover, dozens of pathogenic variants have been identified in its gene body (Landrum et al., 2020). Genetic mutations in LPL have been associated with AD risk (Bruce et al., 2020), especially clustered with other cholesterol-related gene mutations (Papassotiropoulos et al., 2005). In the current study, we systemically analyzed the Lpl expression and genetic regulation in the hippocampus in the BXD family mice. Consistent with the previous findings, Lpl is highly expressed in the hippocampus and shown 2.7–3.7-fold change among the strains (Figure 3). By performing eQTL analysis, we confirmed that this variation is regulated by the local genetic variants (Table 2), in which BXD mice with the D2 allele showed significantly higher Lpl expression than those mice carrying the B6 allele (Figure 4). In addition, we also found the same cis-eQTL in several other tissues, demonstrating the robustness of this cis-regulation in the BXD family.
A gene set enrichment analysis was performed to evaluate Lpl pathways in the hippocampus. We observed that Lpl covariates are mainly involved in neuron development, neurogenesis, and neuron differentiation, as well as in several signaling pathways, including MAPK signaling pathway, axon guidance, synaptic vesicle cycle, and NF-kappa B signaling pathway (Figure 5). In neurons, synaptic vesicles are a class of small, electron-lucent vesicles that store various neurotransmitters released at the synapse, and are involved in the impairment of learning and memory function (Kennedy, 2016). A previous study showed that disruption of the synaptic vesicle cycle leads to presynaptic dysfunction and plasticity damage in LPL-deficient neurons (Liu et al., 2014). In the current study, we identified 17 Lpl covariates related to the synaptic vesicle cycle, with Rab3a showing the most negative correlation with Lpl, suggesting that Rab3a may mediate the negative regulation of synaptic vesicle cycles by Lpl. Ras-associated binding protein 3A (Rab3a) is a neuronal guanosine triphosphate binding protein that binds synaptic vesicles and regulates synaptic transmission. In relation to our findings, increased hippocampal Lpl expression was observed in Rab3a–/– mice (Yang et al., 2007). As an important transmitter of extracellular information from the cell surface to the intracellular space, MAPK signaling has been implicated in AD with various mechanisms, including amyloid beta (Aβ) toxicity, increasing RAGE expression, tau hyperphosphorylation, induction of apoptosis, and deregulated autophagy (Kheiri et al., 2018). In this study, we identified serine/threonine kinase 1 (Akt1) and insulin-like growth factor-1 (Igf1), part of the enriched MAPK pathway, that directly interacted with Lpl through PPI network analysis. Studies have shown that impaired insulin signaling pathways regulate amyloid precursor protein processing (Adlerz et al., 2007) and Aβ clearance by blocking PI3K/AKT pathway, which may partially explain why diabetic patients are susceptible to AD (Sun et al., 2020).
The resulting PPI network also showed that several direct interactors of Lpl were involved in neuron-related functions, such as Crp and Lrp1 (Figure 6). CRP has been reported to have an essential clinical significance in cardiovascular disease and AD (Luan and Yao, 2018). In addition, CRP has also been linked with the activation of the MAPK signaling pathway in AD (Cargnello and Roux, 2011). In neurons, LRP1 can regulate cellular Aβ binding and uptake (Liu et al., 2017). Furthermore, LRP1 deficiency in forebrain neurons leads to disturbances in brain lipid metabolism, progressive and age-dependent synaptic loss, memory loss, and neurodegeneration (Liu et al., 2010). These phenotypes are similar to those in LPL-deficient mice (Xian et al., 2009). In the hypothalamus, LRP1–/– mice exhibit obesity associated with hyperlipidemia, glucose intolerance, and insulin resistance (Liu et al., 2011), with similar phenotypes observed in neuronal LPL-deficient mice (Wang et al., 2011). These results suggest that LPL and LRP1 interact in some way in brain to regulate energy homeostasis and cognitive function.
In summary, by taking advantage of the BXD family mice for genomic, phenomic, and hippocampal transcriptomic data, our results indicate that Lpl is associated with cognitive dysfunction-related phenotypes. The co-expression and PPI network analysis revealed that Lpl participates in cognition function through the MAPK signaling pathway and synaptic vesicle cycle, and by directly interacting with the neuron function-related gene Rab3a, Akt1, Igf1, Crp, and Lrp1 (Figure 6). Our findings demonstrate the importance of the Lpl, among the cholesterol-related genes, in regulating cognitive dysfunction, which may serve as a novel therapeutic target for treating cognitive dysfunction.
Data availability statement
The datasets presented in this study can be found in online repositories. The names of the repository/repositories and accession number(s) can be found below: https://www.ncbi.nlm.nih.gov/geo/, GSE84767.
Ethics statement
All procedures involving mouse tissue were approved by the Institutional Animal Care and Use Committee at the University of Tennessee Health Science Center.
Author contributions
FX and GT conceived the study. WH and JL conducted and performed the data analysis. WH, JL, JM, and FX wrote the manuscript. YH, QX, TD, and MW prepared the figures and tables. JB, LL, and GT edited the manuscript. All authors read and approved the final version of the manuscript for publication.
Funding
This research was funded by the Taishan Scholars Construction Engineering to GT and JB, the Special Project of Central Government for Local Science and Technology Development of Shandong Province (YDZX20203700001291), the Major Basic Research Project of Shandong Provincial Natural Science Foundation (ZR2019ZD27), the Shandong Province Higher Educational Youth Innovation Science and Technology Program (2019KJE013), the National Natural Science Foundation of China (32170989) to JM, and Shandong medical and health science and technology development plan (2018WS532) to QX.
Conflict of interest
The authors declare that the research was conducted in the absence of any commercial or financial relationships that could be construed as a potential conflict of interest.
Publisher’s note
All claims expressed in this article are solely those of the authors and do not necessarily represent those of their affiliated organizations, or those of the publisher, the editors and the reviewers. Any product that may be evaluated in this article, or claim that may be made by its manufacturer, is not guaranteed or endorsed by the publisher.
Supplementary material
The Supplementary Material for this article can be found online at: https://www.frontiersin.org/articles/10.3389/fnmol.2022.1044022/full#supplementary-material
Footnotes
- ^ https://www.ncbi.nlm.nih.gov/geo/
- ^ http://gn1.genenetwork.org/webqtl/main.py?FormID=sharinginfo and GN_AccessionId=600 and InfoPageName=BXDGeno
- ^ https://www.sanger.ac.uk/data/mouse-genomes-project/
- ^ http://www.webgestalt.org/
- ^ https://systems-genetics.org/
- ^ http://amigo.geneontology.org/amigo
References
Adlerz, L., Holback, S., Multhaup, G., and Iverfeldt, K. (2007). IGF-1-induced processing of the amyloid precursor protein family is mediated by different signaling pathways. J. Biol. Chem. 282, 10203–10209. doi: 10.1074/jbc.M611183200
Ashbrook, D. G., Arends, D., Prins, P., Mulligan, M., Roy, S., Williams, E., et al. (2021). A platform for experimental precision medicine: The extended BXD mouse family. Cell Syst. 12, 235–247.e9. doi: 10.1016/j.cels.2020.12.002
Bolstad, B. M., Irizarry, R. A., Astrand, M., and Speed, T. P. (2003). A comparison of normalization methods for high density oligonucleotide array data based on variance and bias. Bioinformatics 19, 185–193. doi: 10.1093/bioinformatics/19.2.185
Bruce, D. K., Tang, M., Reigan, P., and Eckel, H. R. (2020). Genetic variants of lipoprotein lipase and regulatory factors associated with Alzheimer’s disease risk. Int. J. Mol. Sci. 21:8338. doi: 10.3390/ijms21218338
Cargnello, M., and Roux, P. P. (2011). Activation and function of the MAPKs and their substrates, the MAPK-activated protein kinases. Microbiol. Mol. Biol. Rev. 75, 50–83. doi: 10.1128/MMBR.00031-10
Castro-Mondragon, J. A., Riudavets-Puig, R., Rauluseviciute, I., Lemma, R., Turchi, L., Blanc-Mathieu, R., et al. (2022). JASPAR 2022: The 9th release of the open-access database of transcription factor binding profiles. Nucleic Acids Res. 50, D165–D173. doi: 10.1093/nar/gkab1113
Chesler, E. J., Lu, L., Shou, S., Qu, Y., Gu, J., Wang, J., et al. (2005). Complex trait analysis of gene expression uncovers polygenic and pleiotropic networks that modulate nervous system function. Nat. Genet. 37, 233–242. doi: 10.1038/ng1518
Djelti, F., Braudeau, J., Hudry, E., Dhenain, M., Varin, J., Bièche, I., et al. (2015). CYP46A1 inhibition, brain cholesterol accumulation and neurodegeneration pave the way for Alzheimer’s disease. Brain 138, 2383–2398. doi: 10.1093/brain/awv166
GTEx Consortium (2020). The GTEx Consortium atlas of genetic regulatory effects across human tissues. Science 369, 1318–1330. doi: 10.1126/science.aaz1776
Gulyaeva, N. (2015). Ventral hippocampus, stress and psychopathology: Translational implications. Neurochem. J. 9, 85–94. doi: 10.1134/S1819712415020075
Haley, C. S., and Knott, S. A. (1992). A simple regression method for mapping quantitative trait loci in line crosses using flanking markers. Heredity 69, 315–324. doi: 10.1038/hdy.1992.131
Hemonnot, A., Hua, J., Ulmann, L., and Hirbec, H. (2019). Microglia in Alzheimer disease: Well-known targets and new opportunities. Front. Aging Neurosci. 11:233. doi: 10.3389/fnagi.2019.00233
Keane, T. M., Goodstadt, L., Danecek, P., White, M. A., Wong, K., Yalcin, B., et al. (2011). Mouse genomic variation and its effect on phenotypes and gene regulation. Nature 477, 289–294. doi: 10.1038/nature10413
Kennedy, M. B. (2016). Synaptic signaling in learning and memory. Cold Spring Harb. Perspect. Biol. 8:a016824. doi: 10.1101/cshperspect.a016824
Kheiri, G., Dolatshahi, M., Rahmani, F., and Rezaei, N. (2018). Role of p38/MAPKs in Alzheimer’s disease: Implications for amyloid beta toxicity targeted therapy. Rev. Neurosci. 30, 9–30. doi: 10.1515/revneuro-2018-0008
Landrum, M. J., Chitipiralla, S., Brown, G., Chen, C., Gu, B., Hart, J., et al. (2020). ClinVar: Improvements to accessing data. Nucleic Acids Res. 48, D835–D844. doi: 10.1093/nar/gkz972
Li, H., and Auwerx, J. (2020). Mouse systems genetics as a prelude to precision medicine. Trends Genet. 36, 259–272. doi: 10.1016/j.tig.2020.01.004
Li, H., Wang, X., Rukina, D., Huang, Q., Lin, T., Sorrentino, V., et al. (2018). An integrated systems genetics and omics toolkit to probe gene function. Cell Syst. 6, 90–102.e4. doi: 10.1016/j.cels.2017.10.016
Li, K. (2019). Systems genetics of Alzheimer’s disease: From GWAS to disease pathways. Curr. Alzheimer Res. 16, 1161–1162. doi: 10.2174/156720501613200110142010
Liao, Y., Wang, J., Jaehnig, E., Shi, Z., and Zhang, B. (2019). WebGestalt 2019: Gene set analysis toolkit with revamped UIs and APIs. Nucleic Acids Res. 47, W199–W205. doi: 10.1093/nar/gkz401
Liu, C., Hu, J., Zhao, N., Wang, J., Wang, N., Cirrito, J. R., et al. (2017). Astrocytic LRP1 mediates brain abeta clearance and impacts amyloid deposition. J. Neurosci. 37, 4023–4031. doi: 10.1523/JNEUROSCI.3442-16.2017
Liu, Q., Trotter, J., Zhang, J., Peters, M. M., Cheng, H., Bao, J., et al. (2010). Neuronal LRP1 knockout in adult mice leads to impaired brain lipid metabolism and progressive, age-dependent synapse loss and neurodegeneration. J. Neurosci. 30, 17068–17078. doi: 10.1523/JNEUROSCI.4067-10.2010
Liu, Q., Zhang, J., Zerbinatti, C., Zhan, Y., Kolber, B. J., Herz, J., et al. (2011). Lipoprotein receptor LRP1 regulates leptin signaling and energy homeostasis in the adult central nervous system. PLoS Biol. 9:e1000575. doi: 10.1371/journal.pbio.1000575
Liu, X., Zhang, B., Yang, H., Wang, H., Liu, Y., Huang, A., et al. (2014). Impaired synaptic vesicle recycling contributes to presynaptic dysfunction in lipoprotein lipase-deficient mice. Neuroscience 280, 275–281. doi: 10.1016/j.neuroscience.2014.07.080
Luan, Y. Y., and Yao, Y. M. (2018). The clinical significance and potential role of c-reactive protein in chronic inflammatory and neurodegenerative diseases. Front. Immunol. 9:1302. doi: 10.3389/fimmu.2018.01302
Martín, M. G., Pfrieger, F., and Dotti, C. G. (2014). Cholesterol in brain disease: Sometimes determinant and frequently implicated. EMBO Rep. 15, 1036–1052. doi: 10.15252/embr.201439225
McLaren, W., Gil, L., Hunt, S. E., Riat, H. S., Ritchie, G. R., Thormann, A., et al. (2016). The ensembl variant effect predictor. Genome Biol. 17:122. doi: 10.1186/s13059-016-0974-4
Mulligan, M. K., Mozhui, K., Prins, P., and Williams, R. W. (2017). GeneNetwork: A toolbox for systems genetics. Methods Mol. Biol. 1488, 75–120. doi: 10.1007/978-1-4939-6427-7_4
Papassotiropoulos, A., Wollmer, M. A., Tsolaki, M., Brunner, F., Molyva, D., Lütjohann, D., et al. (2005). A cluster of cholesterol-related genes confers susceptibility for Alzheimer’s disease. J. Clin. Psychiatry 66:940. doi: 10.4088/JCP.v66n0720
Pfrieger, F. W. (2021). Neurodegenerative diseases and cholesterol: Seeing the field through the players. Front. Aging Neurosci. 13:766587. doi: 10.3389/fnagi.2021.766587
Sun, Y., Ma, C., Sun, H., Wang, H., Peng, W., Zhou, Z., et al. (2020). Metabolism: A novel shared link between diabetes mellitus and Alzheimer’s disease. J. Diabetes Res. 2020:4981814. doi: 10.1155/2020/4981814
Wainberg, M., Sinnott-Armstrong, N., Mancuso, N., Barbeira, A., Knowles, D., Golan, D., et al. (2019). Opportunities and challenges for transcriptome-wide association studies. Nat. Genet. 51, 592–599. doi: 10.1038/s41588-019-0385-z
Wang, H., and Eckel, R. H. (2012). Lipoprotein lipase in the brain and nervous system. Annu. Rev. Nutr. 32:147. doi: 10.1146/annurev-nutr-071811-150703
Wang, H., Astarita, G., Taussig, M. D., Bharadwaj, K. G., DiPatrizio, N. V., Nave, K., et al. (2011). Deficiency of lipoprotein lipase in neurons modifies the regulation of energy balance and leads to obesity. Cell Metab. 13, 105–113. doi: 10.1016/j.cmet.2010.12.006
Xian, X., Liu, T., Yu, J., Wang, Y., Miao, Y., Zhang, J., et al. (2009). Presynaptic defects underlying impaired learning and memory function in lipoprotein lipase-deficient mice. J. Neurosci. 29, 4681–4685. doi: 10.1523/JNEUROSCI.0297-09.2009
Yang, S., Farias, M., Kapfhamer, D., Tobias, J., Grant, G., Abel, T., et al. (2007). Biochemical, molecular and behavioral phenotypes of Rab3A mutations in the mouse. Genes Brain Behav. 6, 77–96. doi: 10.1111/j.1601-183X.2006.00235.x
Keywords: BXD mice, cognitive dysfunction, Lpl, genetic regulation, hippocampus
Citation: Hu W, Liu J, Hu Y, Xu Q, Deng T, Wei M, Lu L, Mi J, Bergquist J, Xu F and Tian G (2022) Transcriptome-wide association study reveals cholesterol metabolism gene Lpl is a key regulator of cognitive dysfunction. Front. Mol. Neurosci. 15:1044022. doi: 10.3389/fnmol.2022.1044022
Received: 14 September 2022; Accepted: 16 November 2022;
Published: 15 December 2022.
Edited by:
Chun Yang, Nanjing Medical University, ChinaReviewed by:
Maria Bullido, Autonomous University of Madrid, SpainYongqiang Xing, Inner Mongolia University of Science and Technology, China
Copyright © 2022 Hu, Liu, Hu, Xu, Deng, Wei, Lu, Mi, Bergquist, Xu and Tian. This is an open-access article distributed under the terms of the Creative Commons Attribution License (CC BY). The use, distribution or reproduction in other forums is permitted, provided the original author(s) and the copyright owner(s) are credited and that the original publication in this journal is cited, in accordance with accepted academic practice. No use, distribution or reproduction is permitted which does not comply with these terms.
*Correspondence: Jonas Bergquist, Sm9uYXMuQmVyZ3F1aXN0QGtlbWkudXUuc2U=; Fuyi Xu, eHVmdXlpcGhkQGdtYWlsLmNvbQ==; Geng Tian, dGlhbmdlbmdAbGl2ZS5zZQ==
†These authors have contributed equally to this work