 Chan-Yen Kuo1,2†
 Tsu-Yi Chen3,4†
 Pei-Hsiu Kao5‡
 Winifred Huang6‡
 Chun-Ruei Cho5
 Ya-Syuan Lai5
 Giou-Teng Yiang3,4
 Chung-Feng Kao5,7*
- 1Department of Research, Taipei Tzu Chi Hospital, Buddhist Tzu Chi Medical Foundation, New Taipei, Taiwan
- 2Department of Nursing, Cardinal Tien College of Healthcare and Management, New Taipei, Taiwan
- 3Department of Emergency Medicine, Taipei Tzu Chi Hospital, Buddhist Tzu Chi Medical Foundation, New Taipei, Taiwan
- 4Department of Emergency Medicine, School of Medicine, Tzu Chi University, Hualien, Taiwan
- 5Department of Agronomy, College of Agriculture and Natural Resources, National Chung Hsing University, Taichung, Taiwan
- 6School of Management, University of Bath, Bath, United Kingdom
- 7Advanced Plant Biotechnology Center, National Chung Hsing University, Taichung, Taiwan
Bipolar disorder is a complex psychiatric trait that is also recognized as a high substantial heritability from a worldwide distribution. The success in identifying susceptibility loci for bipolar disorder (BPD) has been limited due to its complex genetic architecture. Growing evidence from association studies including genome-wide association (GWA) studies points to the need of improved analytic strategies to pinpoint the missing heritability for BPD. More importantly, many studies indicate that BPD has a strong association with dementia. We conducted advanced pathway analytics strategies to investigate synergistic effects of multilocus within biologically functional pathways, and further demonstrated functional effects among proteins in subnetworks to examine mechanisms underlying the complex nature of bipolarity using a GWA dataset for BPD. We allowed bipolar susceptible loci to play a role that takes larger weights in pathway-based analytic approaches. Having significantly informative genes identified from enriched pathways, we further built function-specific subnetworks of protein interactions using MetaCore. The gene-wise scores (i.e., minimum p-value) were corrected for the gene-length, and the results were corrected for multiple tests using Benjamini and Hochberg’s method. We found 87 enriched pathways that are significant for BPD; of which 36 pathways were reported. Most of them are involved with several metabolic processes, neural systems, immune system, molecular transport, cellular communication, and signal transduction. Three significant and function-related subnetworks with multiple hotspots were reported to link with several Gene Ontology processes for BPD. Our comprehensive pathway-network frameworks demonstrated that the use of prior knowledge is promising to facilitate our understanding between complex psychiatric disorders (e.g., BPD) and dementia for the access to the connection and clinical implications, along with the development and progression of dementia.
Introduction
Many studies have suggested that there is a strong link between bipolar disorder (BPD) and dementia. BPD could increase the risk of developing some specific syndromes of dementia, especially for older adults (Masouy et al., 2011; Wu et al., 2013; Chen et al., 2015; Almeida et al., 2016; Diniz et al., 2017). Furthermore, Kessing and Andersen (2004) suggested that the rate of dementia is 6% higher for the patients with BPD who get admission to hospital with every episode than for those without BPD. BPD comes from a number of causes, such as ages, the duration of illness, polypharmacy, the presence of clinical comorbidity and so on (Borges et al., 2019). According to the Anatomical evidences, the gray matter volume and prefrontal cortex are both affected as people are suffered from BPD, and both of these two regions in the brain also have an influence on causing dementia (Pavlovic et al., 2011). On the one hand, the reduction of gray matter volume in the left cerebellar hemisphere and vermis volume increases the risk of dementia (Baldaçara et al., 2012). On the other hand, volumes of both hemispheres and the vermis are reduced when people suffered from BPD. Relatedly, Pavlovic et al. (2011) indicated that the dementia associated with BPD has a lot to do with psychosocial and functional impairment. Thus, dementia seems to be serious and inevitable. The significant symptom overlapping between dementia and psychiatric disorders like BPD is particularly an important therapeutic target with diagnostic challenges. Although clinical perspectives and implications with BPD and dementia were discussed previously (Lopes and Fernandes, 2012), the potential biologically functional pathways and molecular mechanisms still remains unclear.
Psychiatric traits are generally complex and multifactorial. Over the last decade, numerous genome-wide association (GWA) studies were conducted to search for susceptibility genes for complex human traits (Hindorffa et al., 2009). More than half or a few million markers in hundreds or thousands of subjects were conducted to increase the explanatory power of the disease heritability. A large number of low-risk genetic variants (usually odds ratios < 1.5) were identified to be involved in the etiology of complex traits (Manolio et al., 2008). However, the associated single-nucleotide polymorphisms (SNPs) and genes in total only account for a small proportion of the heritability for most of complex traits including BPD (Manolio et al., 2009). For instance, the effects of genes identified by linkage scans and association tests can only account for ∼2% of the ∼80% heritability of BPD (Crow, 2011). Many replication studies further demonstrated no replicable support for bipolar candidates (Crow, 2007). The failure in detecting true associations for heritable diseases like BPD might be involved with the “common-disease common-variant” hypothesis and the noise that is inherent in GWA studies and others (Maher, 2008; Gershon et al., 2011). We conducted allelic association tests for each SNP of three GWA datasets of BPD including the Wellcome Trust Consortium (WTCCC), the Genetic Association Information Network (GAIN), and the National Institute of Mental Health (NIMH). Again, only a few markers (ATMIN, CENPN, HTR3B, and UBR1) reached the commonly used genome-wide significance threshold level (p < 5 × 10⁻⁸) in the WTCCC GWA data, indicating the fact of potential noise inherent in genome-wide approaches. The noise may come from several sources such as small effect sizes at individual SNP level, causal variants (in particular when their minor allele frequency lower than genotyped SNPs) that are not in a complete linkage disequilibrium (LD) with SNPs, no power in inappropriate statistical methods, and others (Yang et al., 2010; Lee et al., 2011). In addition, due to the complexity of BPD, it is a challenge to identify which particular gene markers are the true causes of disease as noises may potentially be introduced due to technical or biological errors in nature (Ideker et al., 2011). This study aims to overcome these problems, in a gene-gene interaction sense, through identifying and finding the missing heritability.
In a GWA study, p-values are usually used to represent the statistical significance in the association, and the most significant SNP (min-p) of a gene region is selected to represent the significance level of a gene. However, the “min-p” approach is biased toward genes saturated with SNPs. Typically, large genes may have a higher gene-wise statistic, and in fact, we have previously observed a negative relationship between p-values and gene length (Yang et al., 2011; Kao et al., 2014). Introducing such bias into a subsequent pathway analysis may result in favoring pathways with larger genes. There are several Sidak’s correction based methods proposed to correct for a gene-size bias (Sidak, 1967; Saccone et al., 2007; Peng et al., 2010). In particular, a simple method based on the first order statistic (FOSCO) can well correct the gene-size bias by obtaining a gene-level significance for individual genes (Mirina et al., 2012). Although the FOSCO method does not deal with LD structures, its performance is as well as other methods such as GATES and VEGAS, whose computation is based on the LD structure (Mirina et al., 2012).
Bipolar disorder is a complex mental disorder with lifetime prevalence ranging from 8 to 5% in the general population and with a high probability of heritability around 80% (McGuffin et al., 2003; Kessler et al., 2005; Kato, 2007; Merikangas et al., 2008). Previous studies have also suggested the involvement of polygenic and multifactorial features in the pathology of BPD, along with the complex interactions among genes (G × G) and environmental (G × E) factors (Holmans et al., 2009; Pregelj, 2011; Chuang et al., 2013). Recently, we identified and prioritized candidate genes for BPD from multi-dimensional evidence-based data sources, which provide us an opportunity to explore an advanced pathway and network for BPD (Kao et al., 2014). With the combined scores obtained from the prior knowledge of BPD, each of the GWA genes was weighted by the magnitude of association to reduce noise (e.g., false-positive results and publication bias) and increase the effect size in pathway analysis (Pedroso et al., 2012). This hypothesis allows BPD candidates to play a larger role in pathways. The stronger the prior knowledge for BPD of a gene, the larger role the gene plays in pathways. Thus, these genes were regarded as “key genes.”
Genes normally cooperate with others having similar or related functions or characteristics to form a complex network of functional interactions to affect diseases, particularly for complex psychiatric traits. Genome-wide association studies provide the potential to account for such complexity. Thus, the pathway analytic strategy provides a basis of a gene-gene interaction to account for the biological relevance of genes and has the potential to detect the synergetic effects of multiple genes that might have been missed in the traditional single-marker association (Holmans, 2010; Fridley and Biernacka, 2011). The network analysis further provides a dynamic interrelationship among proteins to interconnect biological functions and molecular mechanisms, for instance, our previous work in major depressive disorder (Jia et al., 2011a). Most importantly, we want to know how genes aggregated into clusters of similar or related functions and how these components interconnect and function biologically in pathways and networks underlying the BPD. Therefore, pathway-based and network-based analyses are powerful approaches that summarize genetic information from sets of genes. Using such framework has the potential to interpret genes and pathways biologically. Thus, the objective of the present study uses the systems biology strategy to identify the missing heritability of BPD, which provides additional insights into the nature of complex genetic architecture underlying BPD.
Our current study intends to investigate enriched pathways and functional networks for BPD using a large-scale GWA dataset. We first conducted FOSCO method to correct for the gene-size bias by calculating the gene-level statistical significance. Second, we performed a pathway-based analysis using weighted competitive and self-contained methods with a minimum p-value approach to extract SNP information at a gene level. Third, we applied the subnetwork analysis to construct molecular networks. More importantly, the strategies used to conduct pathway or network-based analyses in the current study for bipolar potentially boosted our explanatory power to obtain meaningful results for studying the biological functions and molecular mechanisms of bipolar. For a more detailed study framework, please refer to Figure 1.
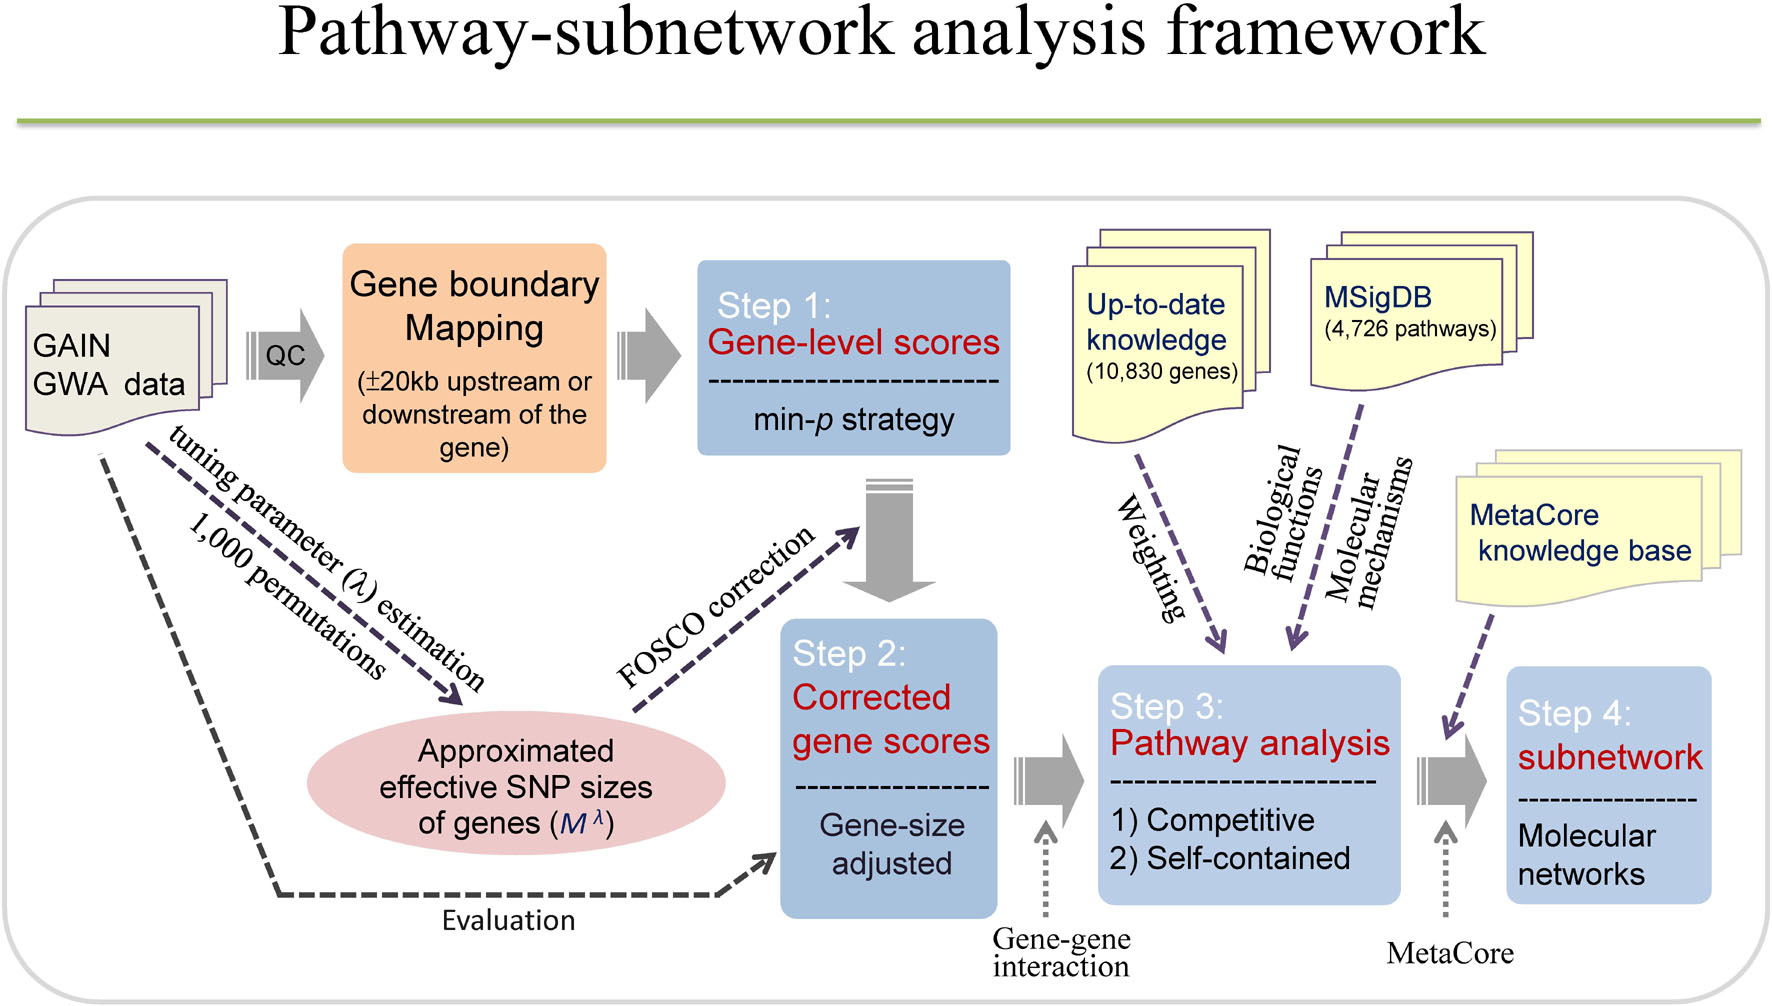
Figure 1. The study framework. The study consists of four steps, including calculation of gene-level scores, gene scores corrections, pathway analysis, and subnetwork analysis. Each gene was assigned a gene-level score using minimal p-value of association test among SNPs in a gene. Corrected gene scores can be obtained by calculating gene-size adjusted p-values based on FOSCO correction. Pathway analysis was conducted using competitive method (hypergeometric test, GSEA) and self-contained method (sum-statistic) with and without weighting scheme. Subnetwork analysis was performed to construct molecular networks using MetaCore.
Materials and Methods
Genome-Wide Association Dataset
The BPD GWA dataset was accessed through the GAIN database of Genotypes and Phenotypes for bipolar disorders.1 A total of 1,001 bipolar cases and 1,034 healthy controls of Americans with European ancestry were included in this dataset. The genotyping platform was Affymetrix Genome-Wide Human SNP Array 6.0. After conducting quality control procedures (Manolio et al., 2007), a total of 698,227 SNPs were retained. We assigned a SNP to a gene if it was located within the gene or 20kb upstream or downstream of the gene. Therefore, a total of 416,371 SNPs were mapped into 15,213 protein-coding genes after dealing with aliases in the GAIN GWA dataset of BPD to perform pathway and network analyses. A basic allelic association test was used to calculate the genomic inflation factor for this GWA dataset, which was 1.03. The quantile-quantile plot for all analyzed SNPs can be found in Supplementary Figure 2, indicating a good quality of this GWA dataset.
Bipolar Candidate Genes
We prioritized a list of 10,830 susceptible genes (Supplementary Data 1) that were collected from several lines of evidence-based datasets for BPD, including GWA study, association studies, linkage scans, gene expression (including human and animal studies), literature search, and biological regulatory pathways. For each gene, a dataset-specific score (CSj) was assigned in each data source according to the magnitude of association. All data types were combined using an optimized weighting vector to indicate the priority of the association of a gene with BPD. More detailed information of this gene prioritization procedure can be found in Kao et al. (2014).
Pathway Annotations
To map genes into biological pathways, we used the Molecule Signature Database (MSigDB)2 annotations. The MSigDB consists of several open public sources of pathway annotations, including Gene Ontology (GO) terms, Kyoto Encyclopedia of Genes and Genomes (KEGG), BioCarta, Reactome, and gene sets compiled from published biomedical literature (Subramanian et al., 2005), which listed 4,726 pathways and 22,429 genes. Pathways with extreme numbers of genes (i.e., 10th percentile of pathway-size distribution, <10 or >380 genes) were removed from analyses to avoid stochastic bias or testing any over-general biological process. This procedure resulted in a total of 4,120 pathways left in the GAIN GWA dataset.
Gene-Wise Statistical Significance Correction of Gene-Size Bias
To obtain a gene-level statistical significance, we first mapped SNPs to a gene (using NCBI build 36) if SNPs were located within the gene region or 20 kb upstream or downstream of the gene, which was suggested as a good gene boundary (Jia et al., 2011b). We used a commonly adopted method to select the most significant SNP (min-p, denoted as pmin) among M SNPs in a gene region in association tests to represent the significance level of a gene. Because the p-values are biased toward to a gene-length, we utilized padj = 1 − (1 − pmin)Meff to adjust it to the gene-wise statistical significance. We approximated the effective number, or alternatively adjusted number, of SNPs (Meff) using Mλ to correct for the actual number of SNPs (M), where the tuning parameter λ satisfies the correlation between adjusted p-values (padj) and M is minimal; that is, min|corr(padj, M)|. The value of the tuning parameter λ can be optimized empirically on permuted genotype data under the null through randomly permuting case/control status of subjects, keeping the genotypes remain the same. If padj are well corrected for the gene-size, they would be uniformly distributed from [0,1]. For a detailed method, please refer to Mirina et al. (2012).
Statistical Methods for Pathway Enrichment Analysis
We applied three statistical methods to test the enrichment of significant pathways for BPD. According to prior studies, we extended two permutation-based approaches, the Gene Set Enrichment Analysis (GSEA, a competitive method) and the sum-statistic method (a self-contained method), by taking into account prior knowledge on BPD (Wang et al., 2010, 2011). We denoted D as the disease of interest (here is BPD), and rj(D) as the gene-wise statistic value that defined as the logarithm of adjusted gene-wise p-values of the corresponding to the most significant SNP in gene j(j = 1, …, N). Here we allowed bipolar candidate genes to play a larger role in pathway analyses. A weight (≥1), , proportional to the prior knowledge (i.e., magnitude of association) is particularly assigned to gene j, where represents the mean of combined scores of all bipolar candidate genes. Thus, a weighted GSEA (wGSEA) was generalized. A set of genes (g) was first ordered according to the weighted gene-wise statistic values [wjrj(D)] so that genes with a stronger significance (or small p-values) are ranked on the top. For each tested pathway (S), an enrichment score (ES) was calculated based on p-values of a gene-set in each pathway. The ES can be written as which consists of two parts, namely, gain (if gene is in a pathway) and loss (if gene is not in a pathway), where NH represents the number of genes in a pathway S and NR = ∑g ∈ S|wjrj(D)|p is the total gain with p = 1. The ES was used to evaluate association signals for each annotated pathway. Then, for each pathway, the ES was normalized to compute NES by subtracting the mean of the ES in the permutated data sets, ES(Sperm), and divided by the standard deviation of ES(Sperm). We calculated empirical p-values for all pathways using 5,000 permutations to compare the original ES score from the GWA dataset and the permutation datasets (denoted as Sperm) by computing the fraction of the numbers of {ES(Sperm) > ES(S)} divided by the total number of permutations. In a weighted sum-statistic (wSS) method, only genes in a specific pathway were considered, while part of those genes may play a larger role in the pathway. The wSS method calculates the sum of the weighted gene-wise statistic values over the set of genes . Alternatively, a statistical probability hypergeometric model was applied. In the hypergeometric test, we used a cutoff p-value of 0.05 to define significant genes using their gene-wise statistics (i.e., p-values). A p-value based on a hypergeometric distribution for each pathway was computed to describe the probability of interest genes (i.e., significant genes) in a specific pathway without a replacement from the whole GWA genes. We performed the hypergeometric test for all annotated pathways using the GWA dataset for BPD.
Biologically Functional Subnetwork Analysis
To perform the biologically functional subnetwork analysis, we selected genes from 15,213 GAIN GWA genes only if the gene contains at least one SNP having gene-wise statistic padj < 0.05 and the gene provides prior knowledge (i.e., having combined score greater than the total mean of combined scores) as these genes were denoted as seed genes for a further subnetwork analysis. We applied the AUTO expand algorithm in software, MetaCore3, to these seed genes. A large network was constructed to the initial list of seed nodes (i.e., seed genes). Then, we cut the large network into several subnetworks according to the following procedures. Firstly, we expanded edges from the most relevant nodes (i.e., proximity of a node and traffic/flow through the node) for the outgoing (•→) path direction. Secondly, a flow value was calculated for each of seed nodes, with the flow through it equal to 1, according to algorithm. For example, a node has three incoming flows (each with flow value of ¼), and then the node receives a flow value of ¾. On the contrast, if the sum of incoming flows exceeds 1, the resulting flow value will be reduced to 1. Thirdly, we only considered the most connected node and selected the nodes that have the highest flow values. Fourthly, we iterated the process until the included nodes exceeded a default limit of 50. Fifthly, we applied the above steps for ingoing (←•) path direction and merged them into one subnetwork. Sixthly, the nodes selected for the subnetwork from the large network were deleted. Finally, a new subnetwork was reconstructed until no more subnetworks can be generated.
Each subnetwork provides a Z-score that ranks the subnetworks according to their saturation with genes from the initial list of seed nodes. The formula for the Z-score is
where rnode and nnode represent the number of nodes and the total number of nodes in each subnetwork generated from the seed nodes, respectively, Robject represents the number of network objects corresponding to the genes and proteins in the seed nodes, and Nnode represents the total number of nodes in MetaCoreTM database. A high Z-score exhibits that the network is highly saturated with genes from the seed genes. Similar to Z-score, we compared the genes in the subnetwork versus the genes not in the subnetwork within the full set of all genes (i.e., MetaCore base knowledge) on maps, and calculated a p-value based on the hypergeometric distribution for each subnetwork to estimate the probability for a particular mapping to a subnetwork.
Multiple Testing Corrections
To account for multiple testing problems in the pathway and network analyses, we used the method proposed by Benjamini and Hochberg (1995) to control for the false discovery rate (FDR). We ordered all the p-values of pathways and compared each p-value p(i) with a threshold of (i/m)q∗, where m represents the total number of pathways, and q∗ represents the significance level. Thus, the procedure controls for the FDR at q∗ = 0.05 level in this current study, assuming p-values are independently distributed under null hypotheses.
Results
A total of 416,371 SNPs were annotated and mapped into 15,213 protein-coding genes in the GAIN GWA study of BPD, which were then mapped to 4,726 annotated pathways in the gene-pathway mapping process. We computationally optimized the tuning parameter λ in the gene-wise statistical significance correction step, and the value 0.85 was estimated iteratively to approximate the effective number of SNPs (see Supplementary Figure 2) for calculating gene-size corrected p-values using the GAIN GWA study for BPD. Figure 2 displays the distribution of minimal p-values and quantile-quantile plots before and after the gene-size correction. We used 50% quantile of SNP numbers (i.e., >13 SNPs) and median of gene lengths (i.e., >23.15mb) to define a large gene. The distribution of logarithm of minimal p-values was skewed to the right (Figure 2A) and the quantile-quantile plots were far away from the 45° line (i.e., under null hypothesis of no correlation), which showed a significant correlation (p = 2.2 × 10⁻¹⁶) between minimal p-values and the gene-size (Figures 2B,C). After adjusted for the gene-length, the corrected p-values approximated uniformly distributed from [0,1] (Figure 2D) and their quantile-quantile plots followed the 45° line, which exhibit no any correlation (p = 0.13) between corrected p-values and the gene-size (Figures 2E,F).
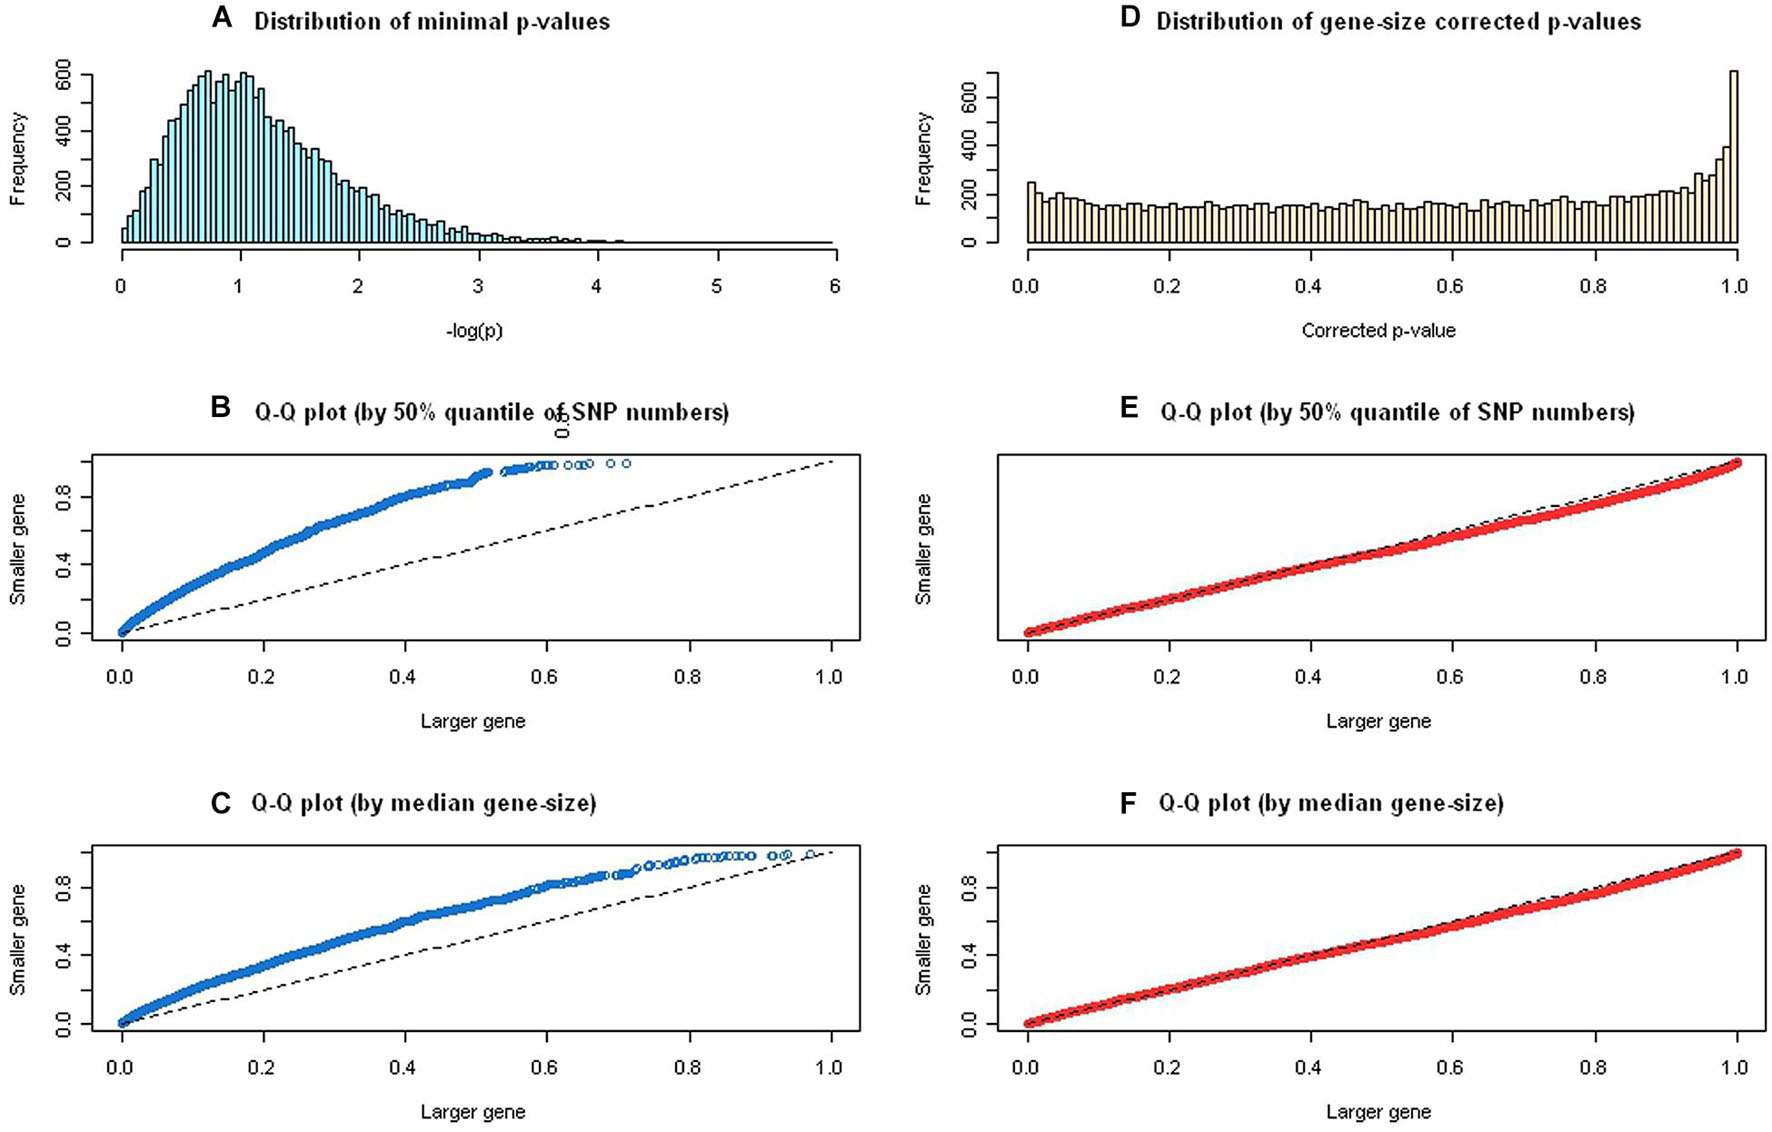
Figure 2. The distribution of minimal p-values and quantile-quantile plots before and after gene-size correction. (A) Distribution of logarithm of minimal p-values was skewed to the right. (B) The quantile-quantile plot, using 50% quantile of single-nucleotide polymorphism (SNP) numbers, showed a significant correlation between minimal p-values and the gene-size. (C) The quantile-quantile plot, using median gene size, showed a significant correlation between minimal p-values and the gene size. (D) Distribution of logarithm of gene-size corrected p-values demonstrated uniformly distributed from [0,1]. (E) The quantile-quantile plot, using 50% quantile of SNP numbers, showed no significant correlation between gene-size corrected p-values and the gene-size. (F) The quantile-quantile plot, using median gene size, showed no significant correlation between gene-size corrected p-values and the gene size.
In total, 87 enriched pathways (see Supplementary Table 1) were identified for their biological relevance in BPD using the GAIN GWA dataset after controlling the FDR at the 0.05 level. Table 1 summarizes 36 significant pathways that were simultaneously enriched in both with or without weighting schemes under competitive methods (wGSEA and hypergeometric test) and self-contained method (wSS). Of which, 26 pathways were identified in permutation-based approaches (i.e., 22 out of 80 were identified in GSEA and 12 were identified in Sum-statistic, with 8 overlaps). The eight overlapping pathways (six from KEGG and two from Reactome) are drug metabolisms of other enzymes, pentose and glucuronate interconversions, starch and sucrose metabolism, ascorbate and aldarate metabolism, retinol metabolism, porphyrin and chlorophyll metabolism, glucuronidation, and phase II conjugation, which related to drug metabolism, carbohydrate metabolism, metabolism in cofactors and vitamins, xenobiotic metabolism, immune system, cell differentiation, cellular communication, cellular signal transduction, and growth factors. The remaining 18 pathways (3 from KEGG, 6 from GO, 2 from Reactome, and 7 from Curated gene sets) are mainly involved with lipid metabolism, xenobiotics biodegradation and metabolism, ion transport, molecular transport, cellular component, cellular communication, cell differentiation, immune system, growth factors, and oncogenes and translocate cancer genes. From a statistical and probabilistic point of view, 10 enriched pathways (7 from GO and 3 from Curated gene sets) were found significant using the hypergeometric test. Those pathways were structurally mapped to channel activities (i.e., voltage-gated channel activity, gated channel activity, voltage-gated cation channel activity and cation channel activity), molecular transport activities (i.e., cation or ion transmembrane transporter activity and metal ion transmembrane transporter activity), immune system, cell differentiation, cellular communication, cellular signal transduction, transcription factor, and growth factor.
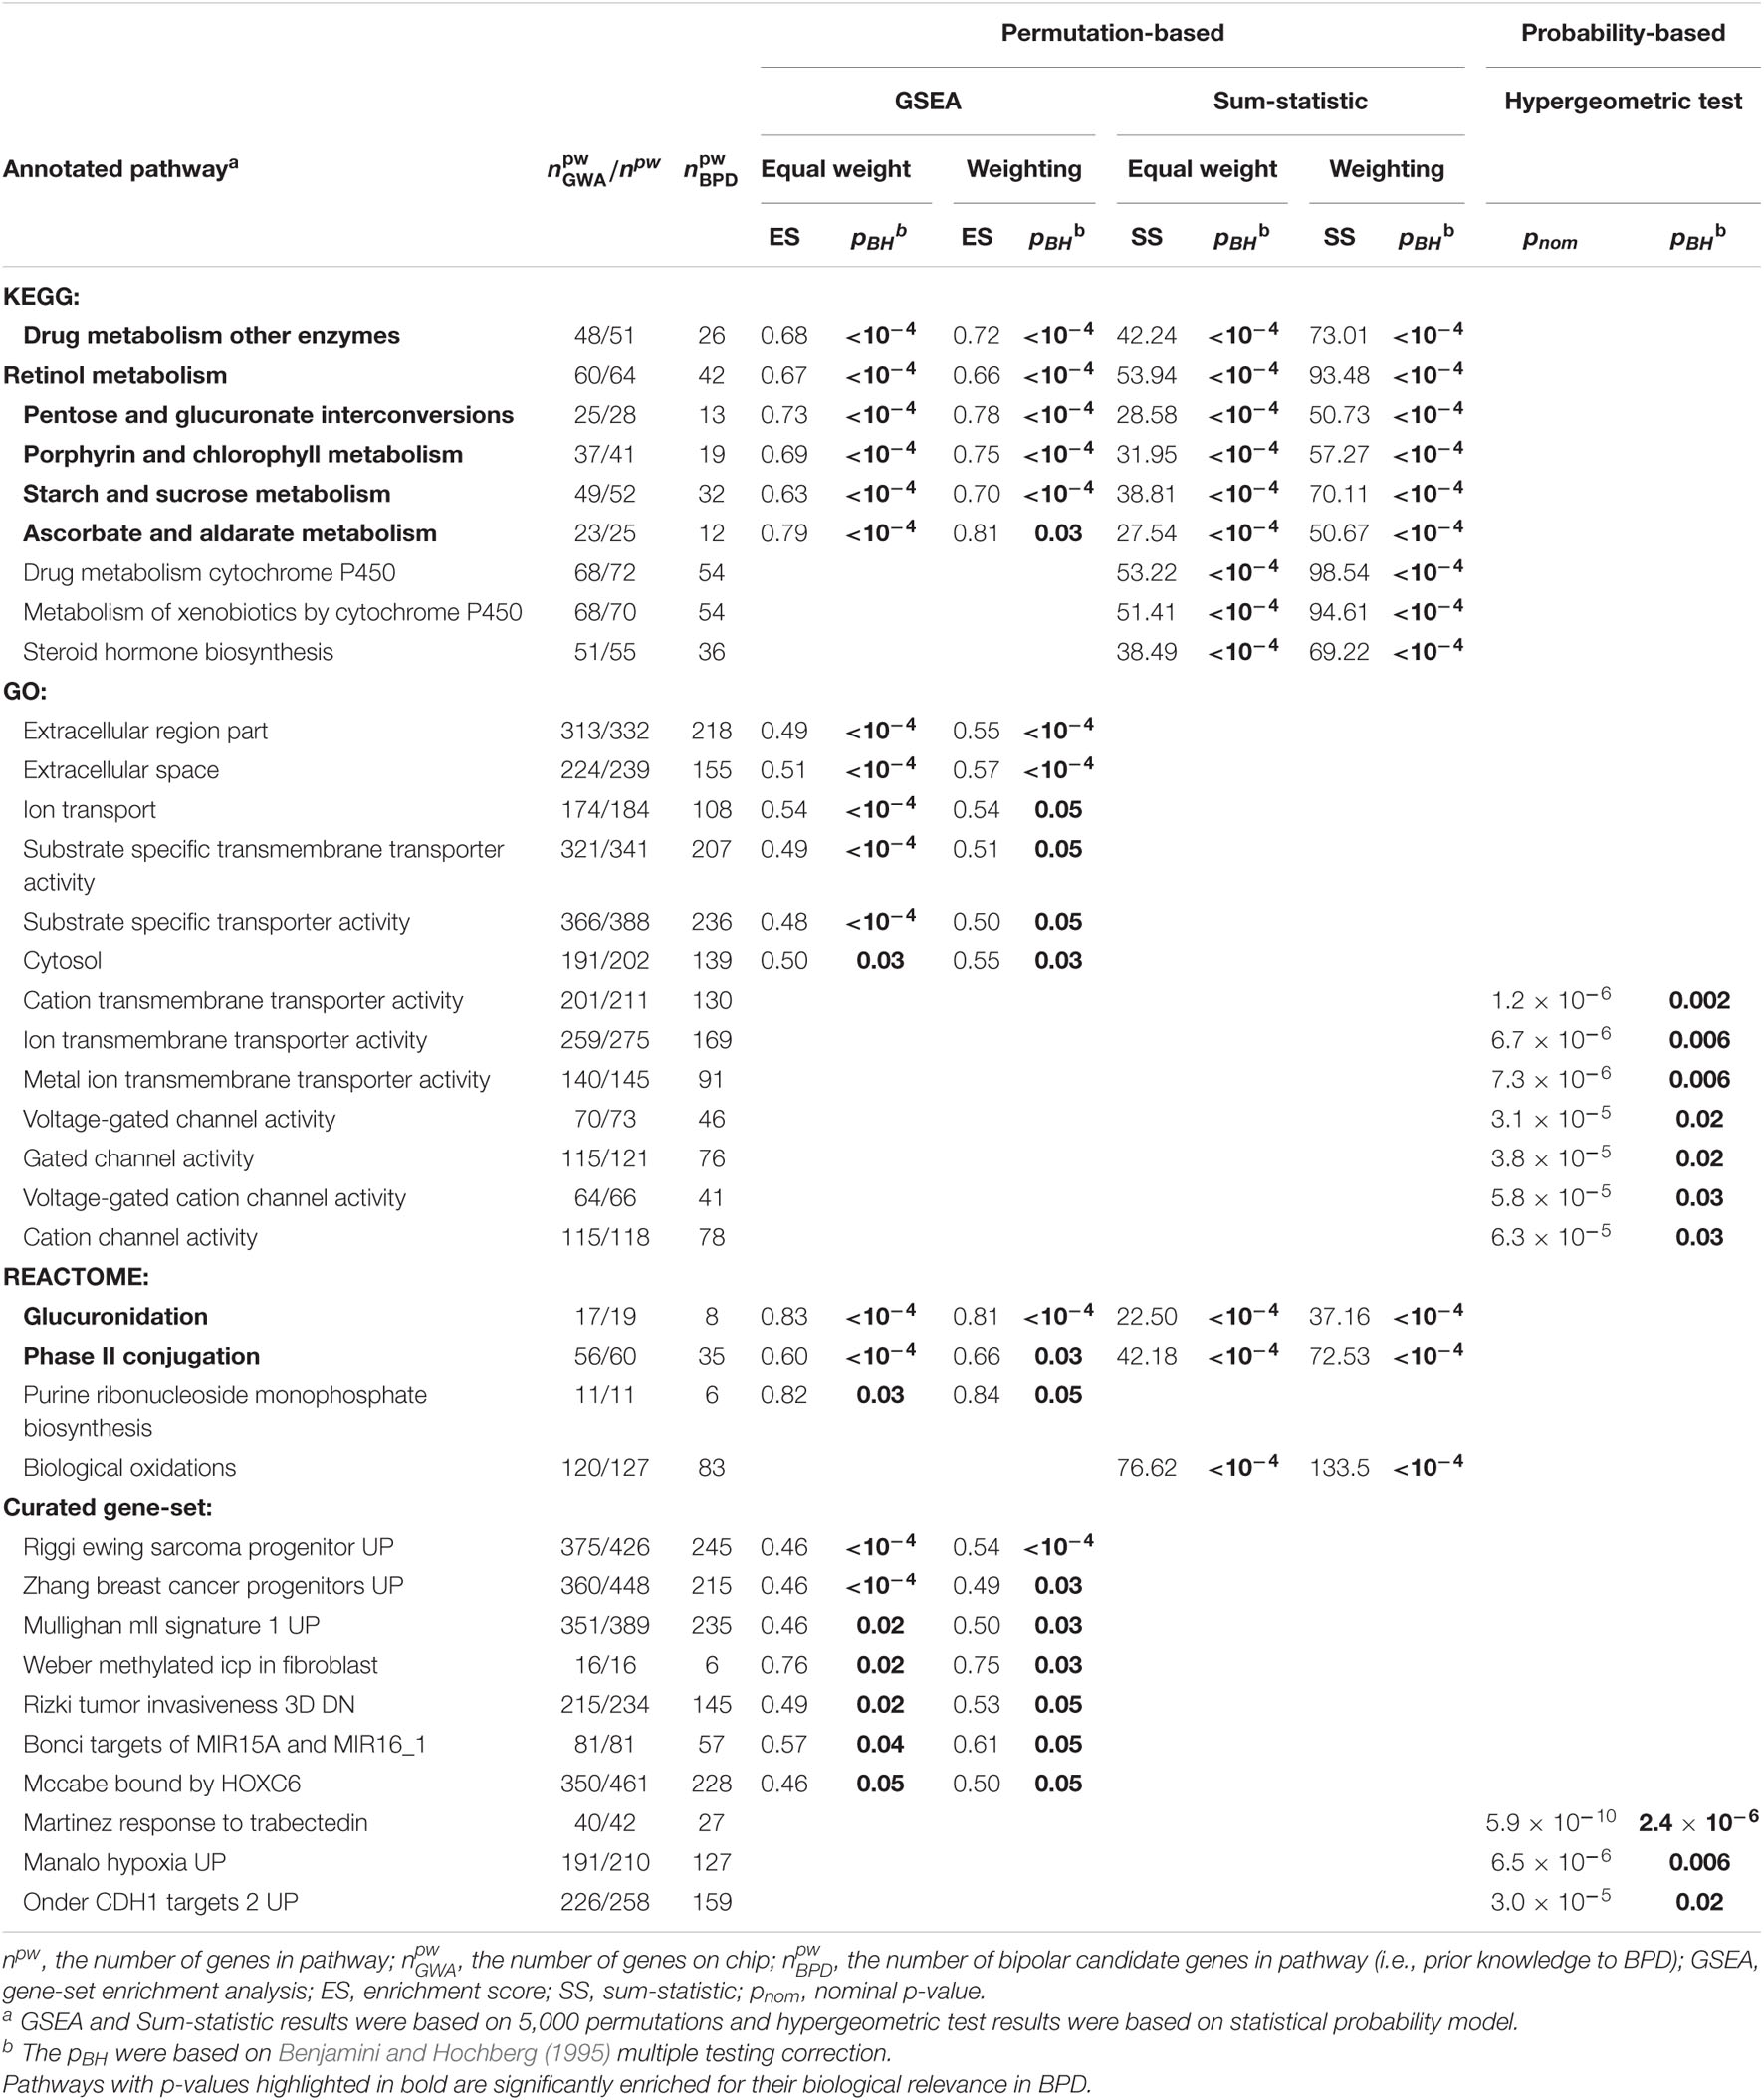
Table 1. Significantly enriched pathways in the Genetic Association Information Network (GAIN) genome-wide association (GWA) study for bipolar disorder (BPD) using competitive and self-contained methods with and without weighting scheme.
We selected 274 genes (denoted as seed nodes) that show a high chance to associate with BPD (see our selection criteria in Materials and methods) from 15,213 GAIN GWA genes further for a functional subnetwork analysis. The selection of the 274 seed nodes was unlikely to be affected by large genes (correlation coefficient = −0.045, p = 0.46). The type and location of the 274 seed nodes were summarized in Table 2. These genes were mainly allocated to G-protein coupled receptor (e.g., GRM1 and ADRA1B in plasma membrane), growth factor (e.g., FGF5 and TGFA in extracellular space), ion channel (e.g., KCNB1 and CACNA2D in plasma membrane; ITPR2 and NOX5 in cytoplasm), ligand-dependent nuclear receptor (e.g., NR3C2 in nucleus), transcription regulator (e.g., PAX in nucleus; WHAH in cytoplasm), transmembrane receptor (e.g., IL17RA in plasma membrane; TSPO in cytoplasm), transporter (e.g., ATP6V1B2 in cytoplasm; SLC16A4 in plasma membrane), and others.
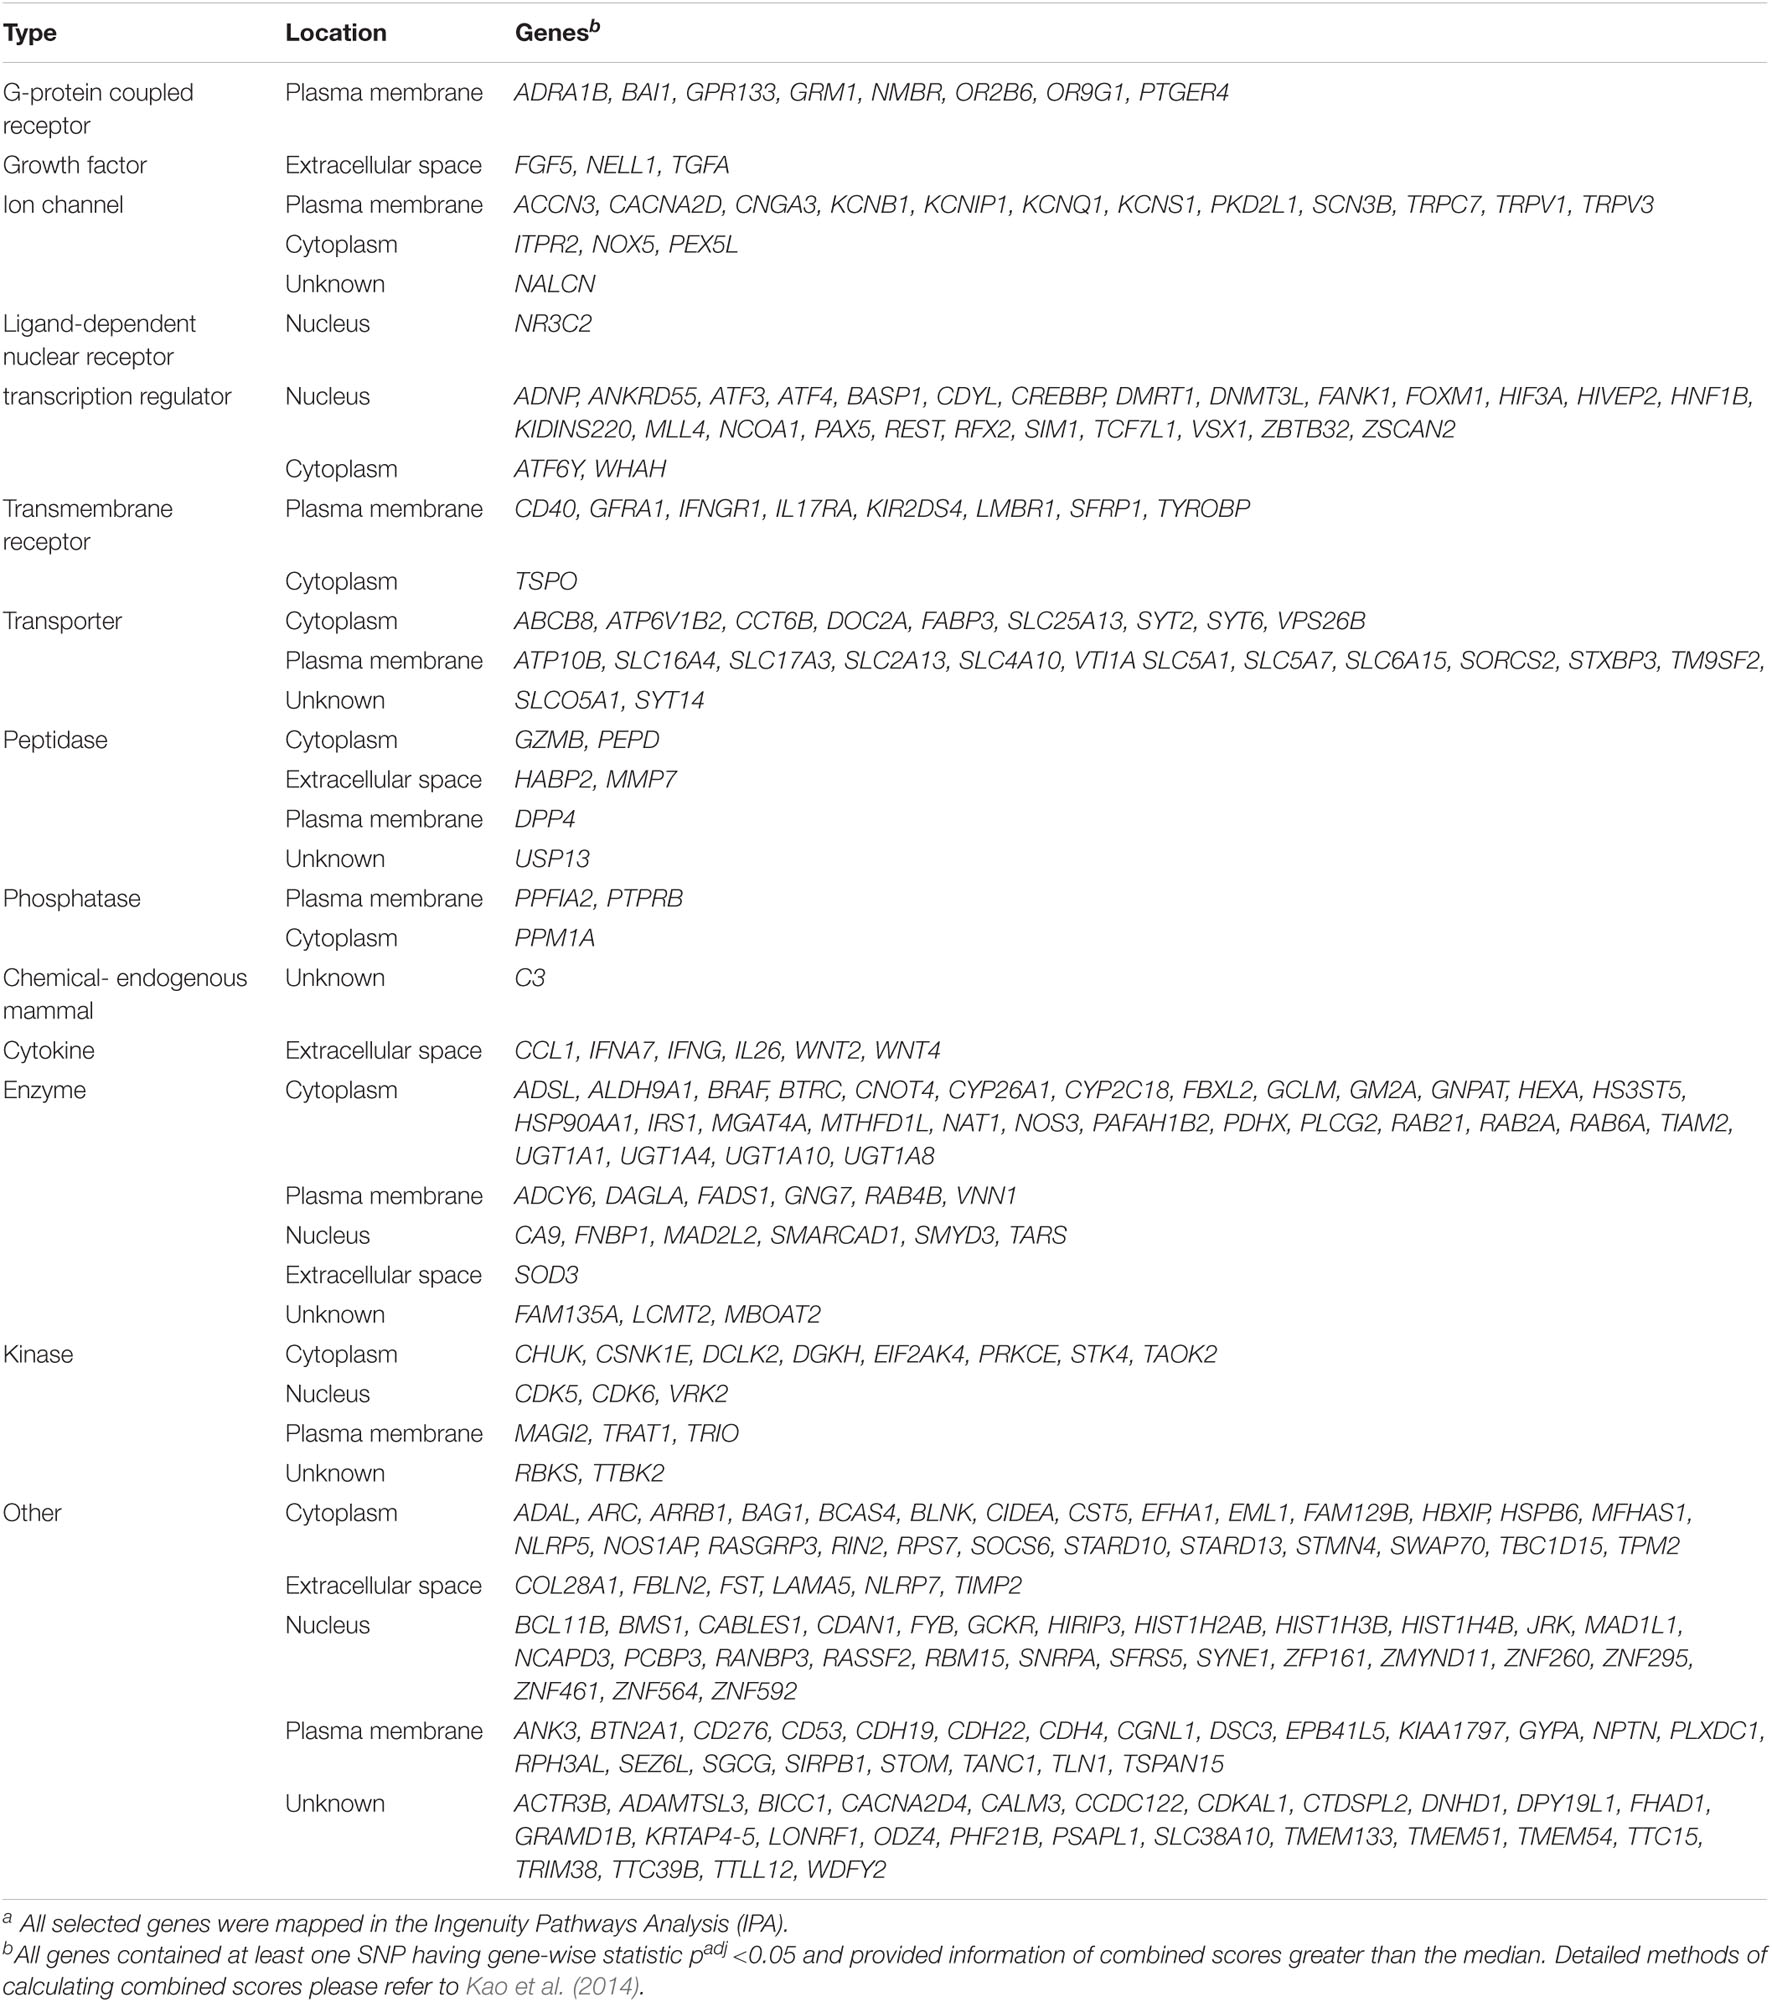
Table 2. Type and location of the 274 seed nodesa selected from the GAIN GWA genes.
A total of 26 subnetworks were constructed in MetaCore using these 274 seed nodes. The crosstalk information and statistical tests for network saturation of the top three function-related biological subnetworks were listed in Table 3 and the remaining subnetworks in Supplementary Table 2. The top one functional subnetwork (Figure 3) was saturated with 22 objects (spanned by 15 seed nodes) and 39 interactions (33 were activation and 6 were inhibition), which has a hub in transcription factor SP1 with 10 activation interactions (p = 2.33 × 10⁻²⁰, Z-score = 24.35). This subnetwork was involved with several GO processes such as de novo posttranslational protein folding, de novo protein folding, protein folding, cellular protein complex assembly, and protein polymerization (p = 9.6 × 10⁻³³∼4.4 × 10⁻²²). The top two functional subnetworks (Figure 4) were centered around six hubs, including three transcription factors (SMAD3, PAX6, UBF), two generic binding proteins (BLNK, MTS1) and one generic enzyme (HDC), in a high range of crosstalk (ranging from 5 to 14 interactions) with other genes (p = 3.25 × 10⁻¹⁸, Z-score = 21.93). These subnetworks contained 15 objects (spanned by 14 seed nodes) and 83 interactions (58 were activation and 25 were inhibition), which mainly involve in GO processes of positive regulation of biological process, cellular process, signal transduction, response to stimulus and macromolecule metabolic process (p = 3.7 × 10⁻²⁹–8.8 × 10⁻²²). In addition, 16 canonical pathways were presented on the subnetwork. The top three functional subnetworks (Figure 5) contained 16 objects (spanned by 14 seed nodes) and 64 interactions (49 were activation and 15 were inhibition), which have two hubs in a transcription factor (EGR1) and a GPCR receptor (FZD7) with a range from 5 to 18 interactions (p = 3.25 × 10⁻¹⁸, Z-score = 21.93). These subnetworks were involved with several GO processes including canonical and non-canonical Wnt receptor signaling pathways, a positive regulation of biological process and cellular process, and a signal transduction (p = 3.3 × 10⁻³⁵–1.6 × 10⁻²⁹). In addition, six canonical pathways were presented on the subnetwork.

Table 3. The top three biologically enriched subnetworksa.
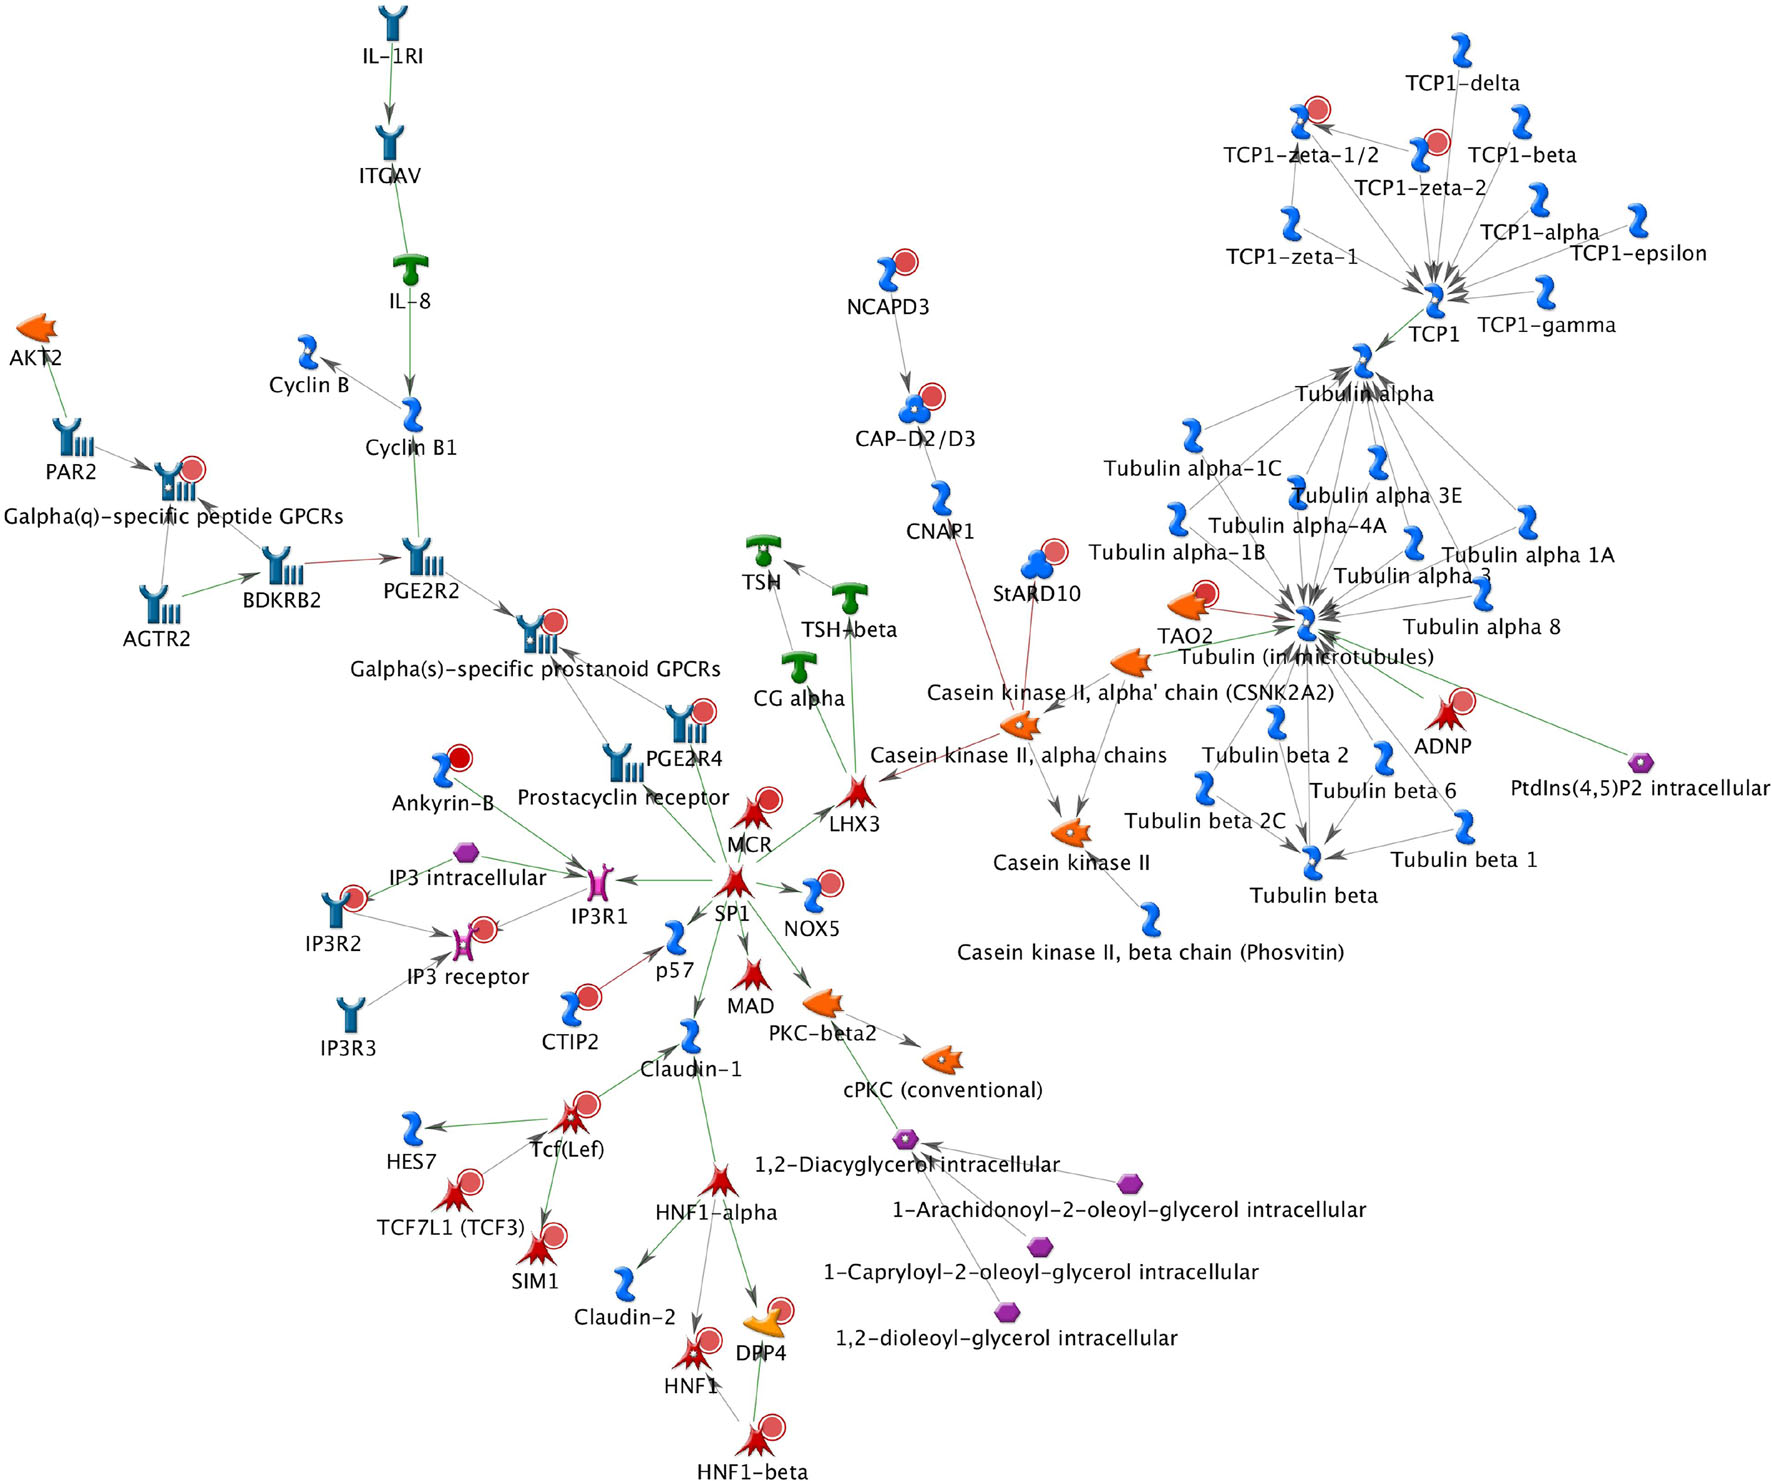
Figure 3. The top one functional subnetwork. This subnetwork was saturated with 22 objects and 39 interactions, with a hub in transcription factor SP1 with 10 activation interactions. Thick cyan lines indicate the fragments of canonical pathways. Upregulated genes are marked with red circles and downregulated with blue circles. Green and red arrows indicate activation and inhibition effect, respectively.
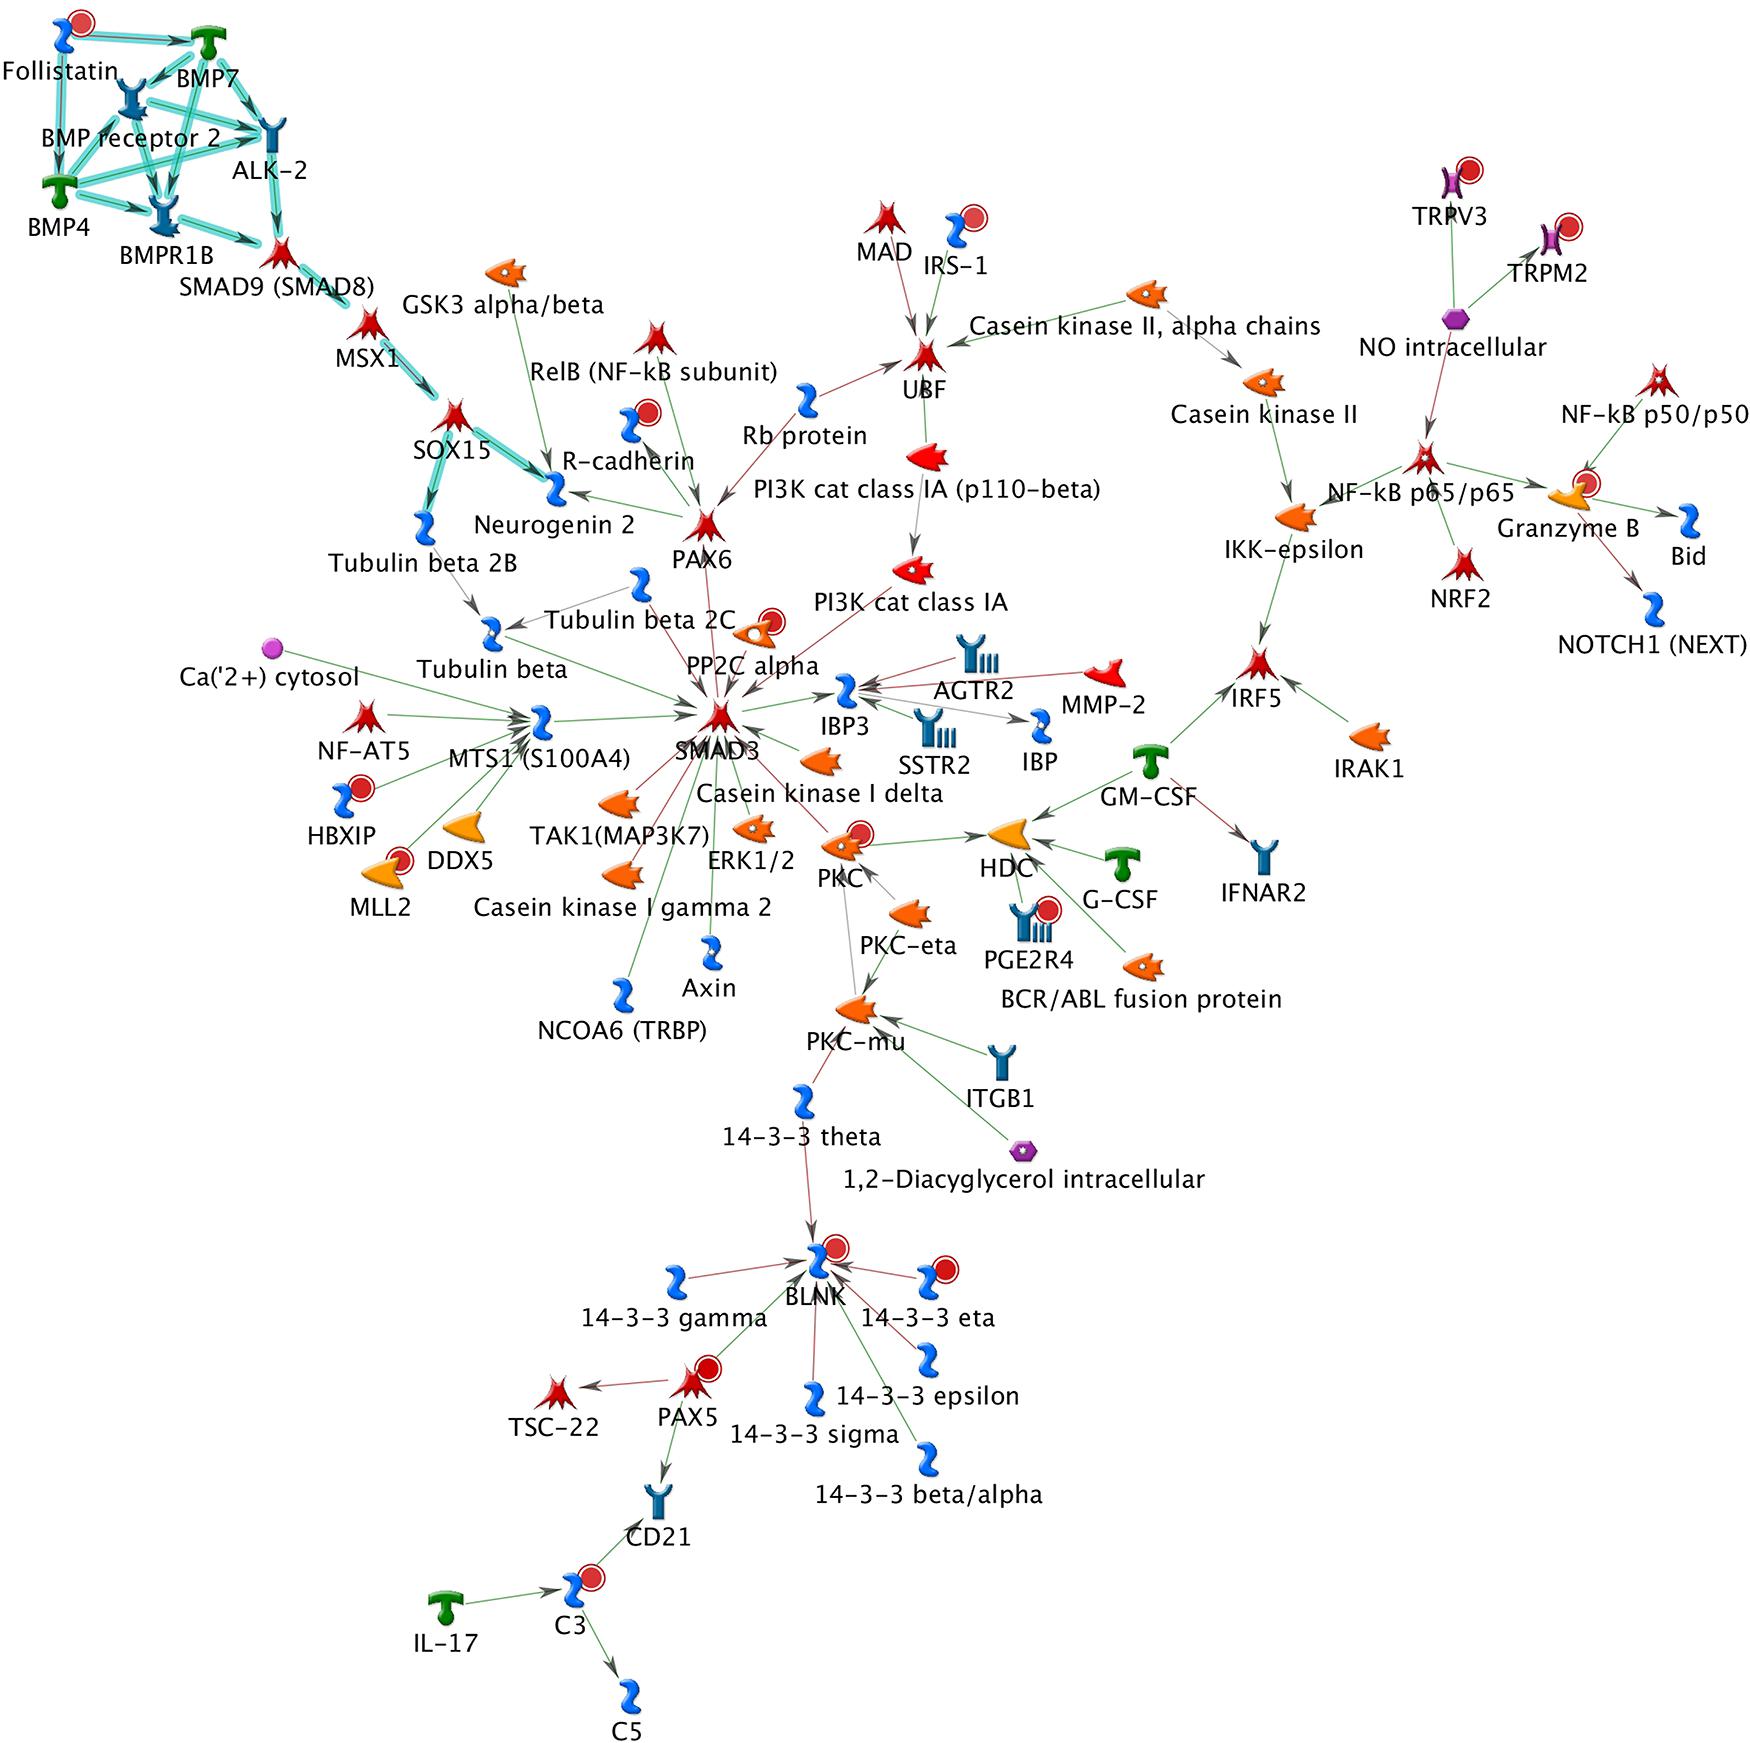
Figure 4. The top two functional subnetwork. This subnetwork contained 15 objects and 83 interactions, which centered around six hubs, including three transcription factors (SMAD3, PAX6, and UBF), two generic binding proteins (BLNK and MTS1), and one generic enzyme (HDC). Thick cyan lines indicate the fragments of canonical pathways. Upregulated genes are marked with red circles and downregulated with blue circles. Green and red arrows indicate activation and inhibition effect, respectively.
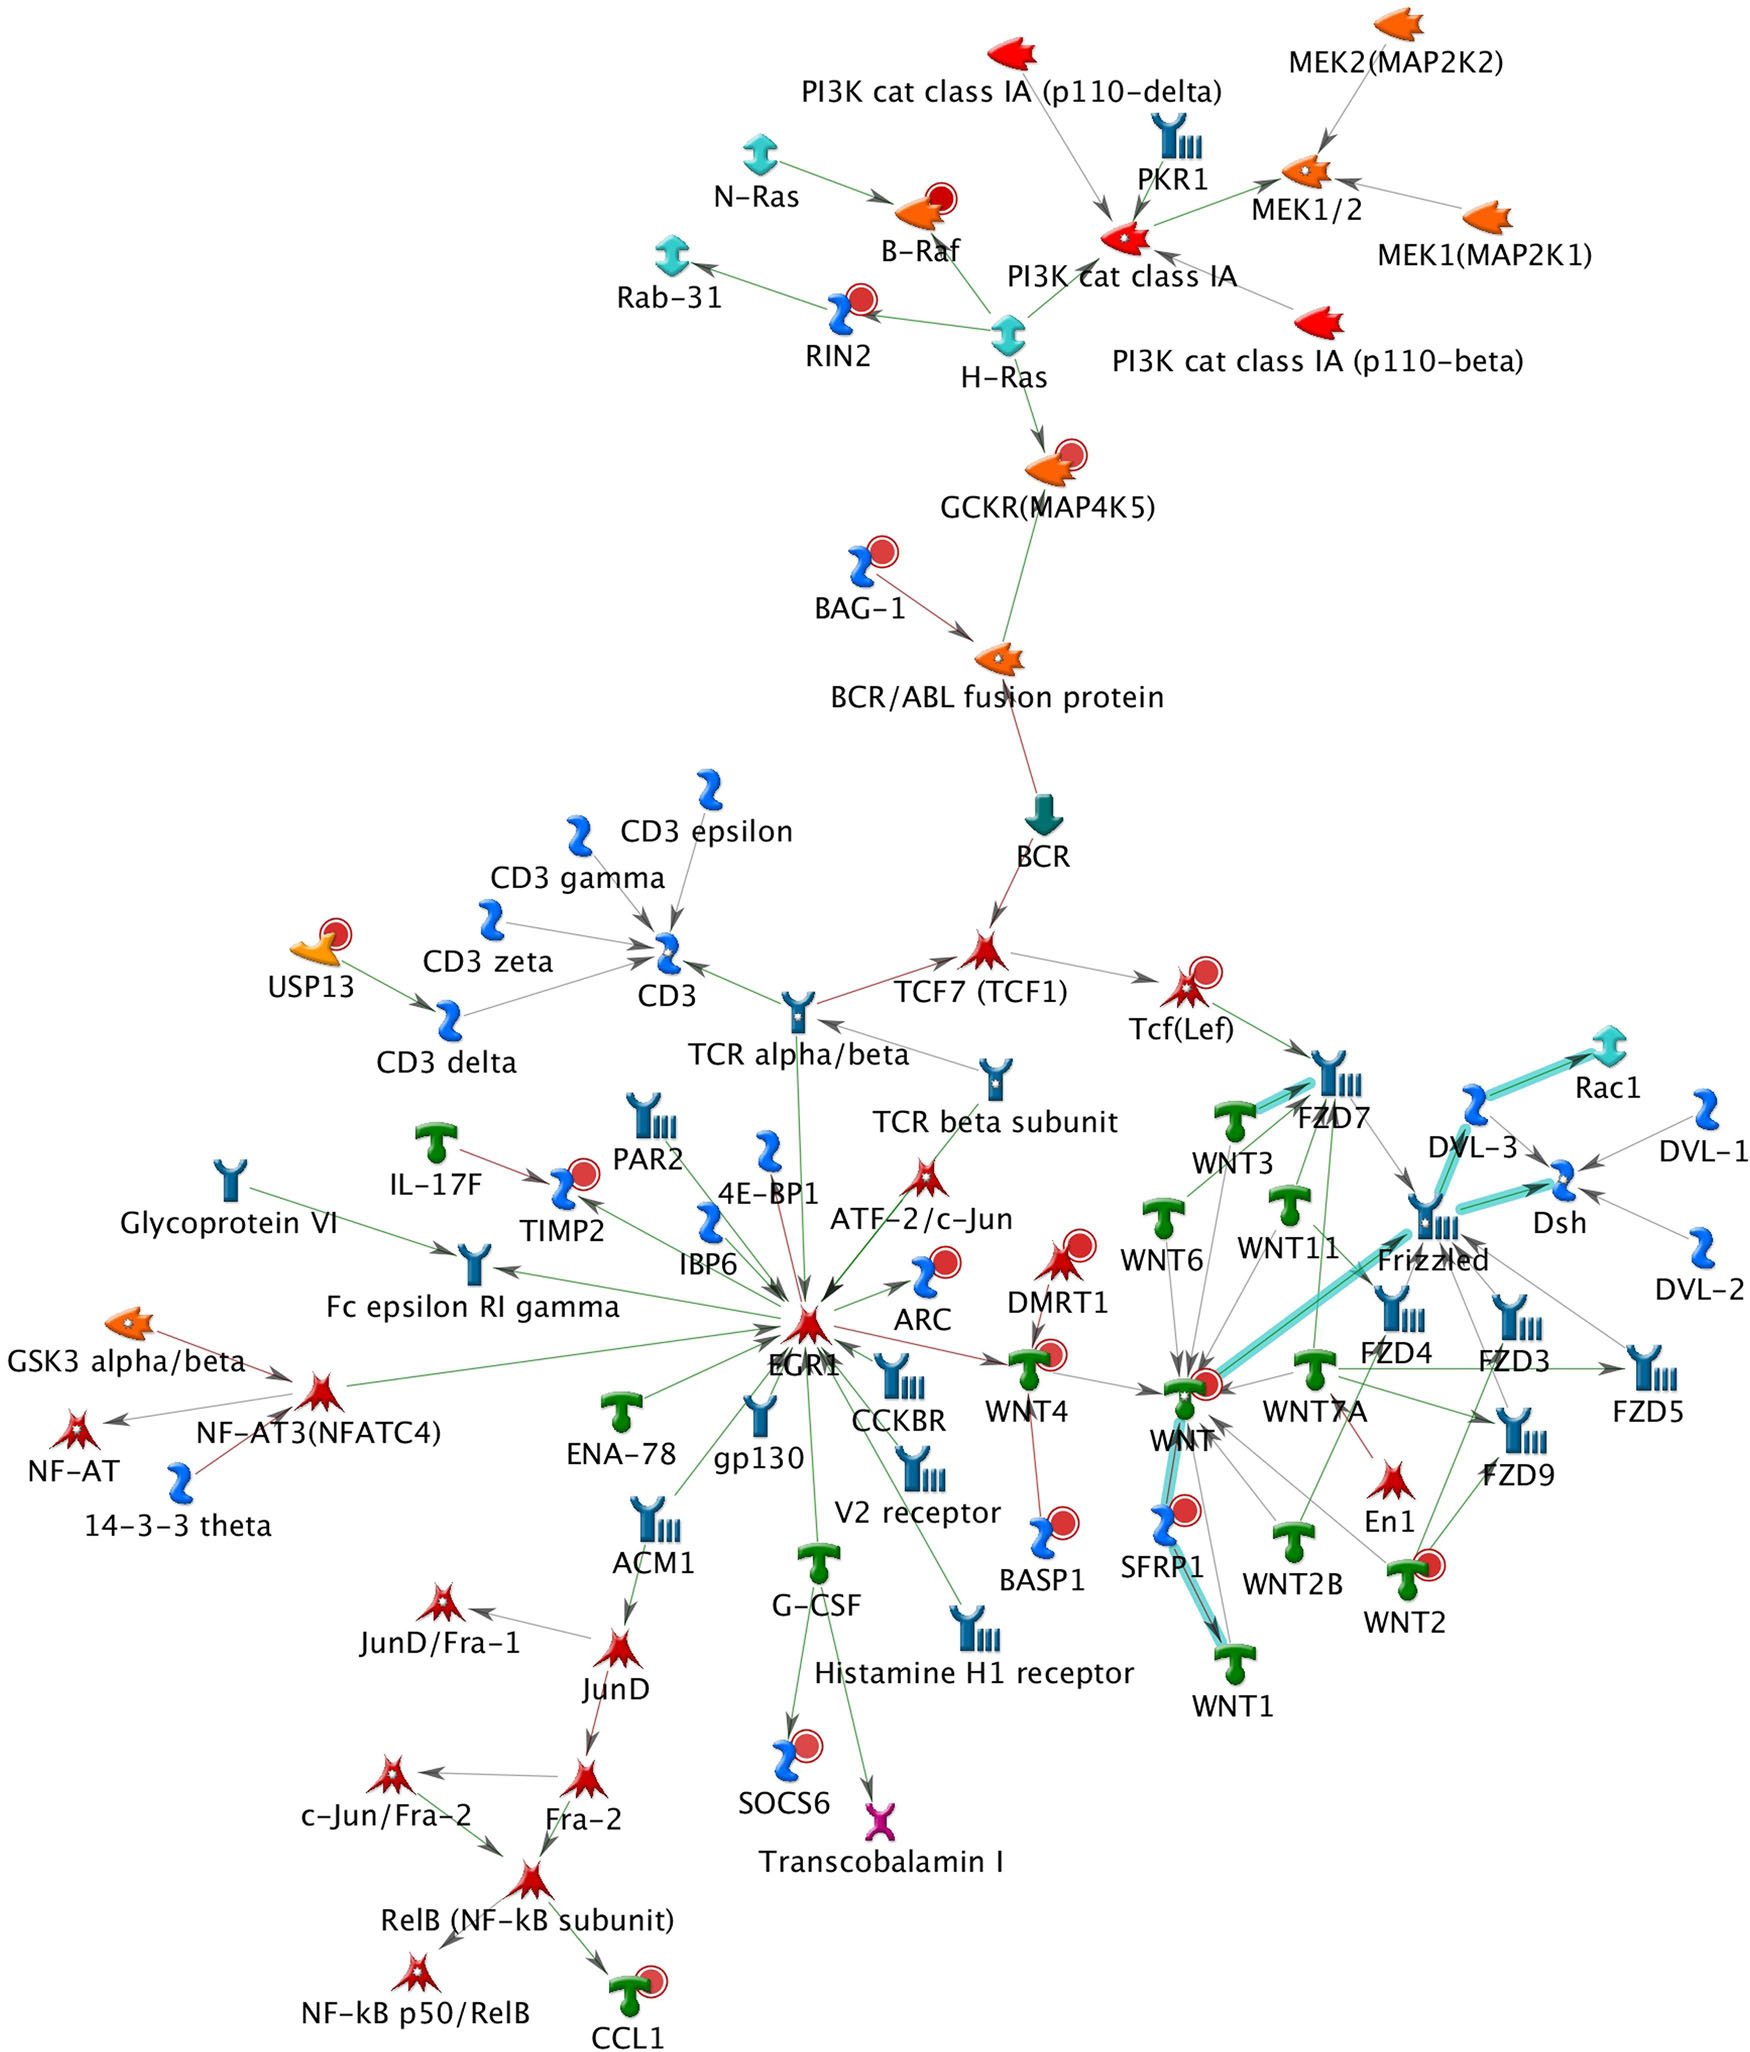
Figure 5. The top three functional subnetwork. This subnetwork contained 16 objects and 64 interactions, with two hubs in a transcription factor (EGR1) and a GPCR receptor (FZD7) with ranging from 5 to 18 interactions. Thick cyan lines indicate the fragments of canonical pathways. Upregulated genes are marked with red circles and downregulated with blue circles. Green and red arrows indicate activation and inhibition effect, respectively.
Discussion
A rich and large-scale GWA data has been produced over past few years to document complex traits like BPD. The pathway-based analytics strategy provides an opportunity to uncover enriched pathways that are involved with the etiology of BPD based on prior knowledge of gene functions and molecular mechanisms. In this study, we reported 36 overrepresented pathways using a GWA dataset for BPD in GAIN, where genes in the same pathway were jointly associated with BPD. It is worth noting that many of these genes did not reach significant associations in GWA studies of BPD at a gene-level but reveal their potential roles in pathway-based analyses. In gene-level association analyses of the GAIN GWA study for BPD, the most genome-wide significant loci were found in GRAMD1B (rs4936819, p = 1.2 × 10⁻⁶), although it did not reach genome-wide significance threshold level at 5 × 10⁻⁸. Not surprisingly, we observed that many genes were included in multiple pathways to increase the risk of BPD but not reported in the GAIN GWA study for BPD. For example, HTR3B and CACNA1C (the top 6th and 12th in BPD genes) were included in substrate specific transmembrane transporter activity, substrate specific transporter activity, cation transmembrane transporter activity, ion transmembrane transporter activity, metal ion transmembrane transporter activity, gated channel activity, and cation channel activity (Kao et al., 2014). Evidence also supported that HTR3B encodes the subunit B of type 3 receptor for 5-hydroxytryptamine (serotonin). It was also found to be a susceptible gene for the development of BPD while CACNA1C was reported to be associated with the involvement of calcium channels in the biological mechanisms of BPD (Frank et al., 2004; Kloiber et al., 2012).
Among the 36 enriched pathways, we examined the degree of overlapping for significant genes (p < 0.05) in these pathways to evaluate their crosstalk. The resulting number and proportion of overlapping genes were shown in Supplementary Table 3. The proportion of significant genes (i.e., contain at least one SNP having p < 0.05) among all pathways was between 12 and 88% (average = 49.4%). This demonstrated that these significant pathways were dominated by many genes rather than one single gene. Our results exhibited a low to intermediate level of overlapping across pathways, indicating some crosstalk of molecules in enriched pathways. Among all pair-wise pathway comparisons, 48.4% did not have any significant genes overlapping, 33.6% had a low degree of overlapping (less than 20%), 8.6% had a moderate degree of overlapping (20–70%), and only 9.4% pathways had a high degree of overlapping (more than 70%). The fact that only a few genes were commonly identified in significant pathways for BPD further reflects the difficulty we faced in identifying “the genes” for complex diseases.
Many disease traits are usually caused by the dysfunction of several susceptible gene loci with small main and interaction effects. In fact, there may exist some (or even a few) key genes to dominate particular functions within a specific biological pathway. To capture this, we allowed such genes to play important roles relevant to BPD in the pathway. Thus, a weighting algorithm linking to prior biological knowledge was introduced into our analytic strategies for the pathway analysis. Genes with stronger prior information contributed majorly to the significance of the pathway. We found the number of enriched pathways increased with the proportion of significant genes (i.e., prior information) of a pathway. The development of pathway-based approaches that incorporate prior biological knowledge can identify novel disease susceptibility pathways along with “the key genes,” which will greatly facilitate the interpretation of GWA data biologically. Therefore, without highlighting the effects of these key genes in the pathway analysis, it is difficult to interpret their biological mechanisms correctly.
The min-p is a commonly used approach to assess association evidence at the gene-level in the pathway-based analysis. However, using the min-p statistic to represent the significance of a gene may be limited. For instance, if a number of markers within a gene region are moderately associated with a disease trait, the signal of such gene may be downweighed by not having “one” particular significant signal. Thus, combining all information of SNPs (i.e., combined-p) in a gene can aggregate the overall evidence that the gene-set association and SNPs with moderate effects can be included. Different strategies of defining the gene-level statistic may have substantial influences on results. This seems to be reasonable and also supported by observations evidence (Kao et al., 2012). One possible future direction in defining gene-level statistic is to adopt a mixed approach of using min-p and combined-p. With the mixed algorithm, an appropriate gene-level statistic will be computed to represent each gene properly.
In this current study, we found several BPD-susceptibility pathways were significantly related to metabolism that is not reported in previous studies using GWA SNPs data. However, there is overwhelming evidence to suggest that many metabolic pathways have been reported to be linked to complex traits, particularly psychiatric disorders (Saxena, 2009; Wood and Wood, 2013). In the past, a meta-analysis of metabolic abnormalities in BPD reported that bipolar patients, particularly patients of older age, are at a high risk for metabolic syndrome (Vancampfort et al., 2013). Priebe et al. (2012) used genome-wide SNP data to search for the presence of copy number variations in 291 early-onset bipolar patients and 872 healthy controls to implement pathways and biological processes. They found many pathways were significantly enriched in drug metabolism, lipid metabolism, and molecular transport, which were in line with our findings. Our results were also consistent with other studies based on using information from allele-specific gene methylation and incorporating information of microRNAs into the pathway analysis in the GAIN GWA study for BPD (Chuang et al., 2013; Shih et al., 2013). Besides, schizophrenia patients were found to be associated with thiol metabolism. In addition, abnormalities in metabolic cascades and metabolic disturbances were further observed in schizophrenia patients (Thakore, 2004; Kirkpatrick et al., 2008). Overall, the above evidence suggests that metabolic syndromes and complex psychiatric disorders like BPD appear to share some common in genetic factors, and may contribute to medical co-morbidity, including endocrine disturbances, dysregulation of sympathetic nervous system, and behavior patterns in these patients (Fagiolini et al., 2008). Our results identified nine enriched metabolic pathways that were significantly associated with BPD. These pathways were involved with human metabolic profiles, including drug, cofactors and vitamins, carbohydrate, lipid, and xenobiotics biodegradation. Importantly, human metabolizing systems act as a role of detoxification and transport through specialized enzymatic systems to aid excretion of xenobiotics, including drugs.
The BPD-related subnetworks (Figures 3–5 and Table 3) are complex and sophisticated, involving with several biological processes, cellular processes, signal transduction, metabolic processes, neuronal activities, immune system, and inflammation processes. The most significant subnetwork (Figure 3) is primarily related to the activation mechanism of transcription regulation between effects of SP1 and many proteins (e.g., MAD, Prostacyclin receptor, NOX5, LHX3, PGE2R4, PKC-beta2, MCR, Claudin-1, p57 and IP3R1). This subnetwork plays a role in cell growth and apoptosis (e.g., NOX5), cell differentiation (e.g., TCF7L1, also known as TCF3), major transcript (e.g., Ankyrin-B), and ion or water transport (e.g., MCR). The second significant subnetwork (Figure 4) plays a role in regulating B-cell function and development (e.g., BLNK), B-cell differentiation and neural development (e.g., PAX5), immune system and inflammatory response (e.g., Granzyme B, C3), cellular proliferation and differentiation (e.g., Follistatin), and mediation of the control of cellular processes including cell cycle, neuron growth, ion channel regulation, and immune response (e.g., PKC). The third significant subnetwork (Figure 5) is central with two hubs (EGR1 and FZD7). EGR1 plays a critical role in animal models of maternal behavior on stress responses in the offspring (Weaver et al., 2004). The mechanism underlying the effect of early maternal behavior involves the EGR-mediated regulation of glucocorticoid receptor that may influence psychiatric illness susceptibility and abnormal anxiety-related behaviors later in life (Fish et al., 2004). McGowan et al. (2009) conducted a study in postmortem brains and suggested that similar mechanisms may occur in humans. FZD7 was also identified to be associated with psychiatric or neurological disorders (Hoseth et al., 2018). This subnetwork plays a role in the response to environmental stress [e.g., GCKR (MAP4K5)], long-term memory (ARC), hippocampal neuron (B-Raf), and in regulating cell growth and differentiation (SFRP1). In this study, we identified 26 BPD-related functional subnetworks, which provide us an opportunity to facilitate future follow-up and functional studies for bipolar.
Many enriched pathways and selected genes were significantly associated with BPD in this study. Of which several genes and pathways were discussed and found to be consistent with previous studies. Particularly, six metabolic pathways (drug metabolism, retinol metabolism, pentose and glucuronate interconversions, porphyrin and chlorophyll metabolism, starch and sucrose metabolism, ascorbate and aldarate metabolism) were connected to dementia. A metabolic-caused dementia is a loss of function in the brain, e.g., cognitive changes and memory loss, that often occurs with certain psychiatric disorders like BPD. For instance, drugs are frequently a cause of dementia, which may impair cognition indirectly through metabolic effects (Starr and Whalley, 1994). Retinol metabolism was connected to an increased risk of dementia development. Retinol hypofunction and impaired transport may contribute to patients with memory impairment in Alzheimer’s disease (AD) and dementia (Goodman and Pardee, 2003). Two metabolic pathways, pentose and glucuronate interconversions (Zheng et al., 2019), and starch and sucrose metabolism (Ling et al., 2021) may play roles in learning and cognitive impairment that are caused by abnormal nitric oxide production and monoaminergic neurotransmitters in AD, BPD, and/or dementia patients. Other metabolisms, including porphyrin and chlorophyll metabolism (Wang et al., 2015), and ascorbate and aldarate metabolism (Chen et al., 2011) were biologically or molecularly connected with psychiatric disorders (e.g., AD, BPD) and dementia. We noticed that some of enriched network pathways that were not reported previously suggest that there may be potential links between BPD and the risk of dementia or possibly a chance association.
There are some limitations in our study. First, our pathway analysis relied on the accuracy and completeness of pathway annotation databases (e.g., MSigDB). Some genes may have potential impacts on BPD but not annotated in pathway databases, and they may be excluded from our analyses. Other datasets, such as IPA knowledge base,4 that provides detail-rich, highly structured knowledge for over 1,582,000 biological and chemical concepts in 19,635 humans, 15,194 mice, and 8,190 rat genes may be helpful to be considered in future analyses though their annotations need to be carefully selected. Second, it is possible that some genes might be falsely reported as significant loci in the literature. Thus, the accuracy of prior information is subjective to the completeness of data sources from the literature and current knowledge. We integrated gene information from different platforms or data sources to construct a combined score for each gene, followed by weighted pathway analysis to obtain more value-added pathway results using all existing genomic evidence and knowledge for BPD. Third, different strategies of defining the gene-level statistic may result in different outcomes in the pathway analysis. Some genes may be dominated by one (or a few) SNP(s) with a strong effect while other genes may be dominated by several SNPs with moderate effects. In this study, we only used the min-p statistic to extract information of SNPs for a gene. An advanced approach in calculating gene-level statistics for each gene is to extract SNPs information using both the min-p and the combined-p (e.g., random effects model or Bayesian statistical methods according to the structure of SNPs in a gene region (Stephens and Balding, 2009). Fourth, our study uses the signals of genetic association, while other genomic information (such as gene expression, gene regulation, etc.) has not been used yet. Concerning other useful genomic datasets, a possible utilization approach is to incorporate all possible genomic information into the pathway analysis. Finally, we only focused on Caucasian populations, using one GWA dataset for the pathway analysis and other for prior information collection (Kao et al., 2014). To generalize the results to the Eastern countries, a meta-analysis (or mega-analysis) of combining different populations (Caucasian and Han Chinese) of GWA data is underway to increase power to uncover the underlying biological mechanisms for BPD.
Conclusion
Applying our comprehensive framework for the pathway and functional subnetwork analyses is useful for uncovering the underlying mechanisms and networks for complex traits. The evidence-based collection of prior information could benefit from quick accumulated data information and evidence from different aspects, which provides valuable information to quantify the contribution of genes in pathways for complex traits of interest. A number of novel genes that did not show significant associtions with BPD in the original single marker or gene analysis of GWA dataset were found to participate in several pathways, which, jointly with other genes, play roles in the pathogenesis of BPD. Although it remains largely unclear how the defect of pathways is specifically linked to the development of BPD, our identified pathways provided important biological insights into the interpretation of genome-wide association data for BPD. These findings are anticipated to facilitate future follow-up and functional studies for the connection and clinical implications between BPD and dementia.
Data Availability Statement
The GWA data set was accessed through the Genetic Association Information Network (GAIN), database of Genotypes and Phenotypes (dbGaP) accession number phs000017.v3.p1 (http://www.ncbi.nlm.nih.gov/).
Author Contributions
C-FK: study conception and design and acquisition of data. C-FK and WH: analysis and interpretation of data. C-FK, C-YK, T-YC, P-HK, WH, C-RC, Y-SL, and G-TY: draft and revise manuscript. All authors read and approved the final manuscript.
Funding
This work was supported by grant MOST 109-2320-B-303-004-MY3 from Taiwan Ministry of Science and Technology and grant TCRD-TPE-MOST-109-15 from the Taipei Tzu Chi Hospital, Buddhist Tzu Chi Medical Foundation, New Taipei City, Taiwan. This work was financially supported (in part) by the Advanced Plant Biotechnology Center from The Featured Areas Research Center Program within the framework of the Higher Education Sprout Project by the Ministry of Education (MOE) in Taiwan.
Conflict of Interest
The authors declare that the research was conducted in the absence of any commercial or financial relationships that could be construed as a potential conflict of interest.
Publisher’s Note
All claims expressed in this article are solely those of the authors and do not necessarily represent those of their affiliated organizations, or those of the publisher, the editors and the reviewers. Any product that may be evaluated in this article, or claim that may be made by its manufacturer, is not guaranteed or endorsed by the publisher.
Acknowledgments
We thank Li-Chung Chuang and Po-Hsiu Kuo for collecting the GWA data and being in charge of data management.
Supplementary Material
The Supplementary Material for this article can be found online at: https://www.frontiersin.org/articles/10.3389/fnmol.2021.772584/full#supplementary-material
Footnotes
- ^ http://www.ncbi.nlm.nih.gov/
- ^ http://www.broadinstitute.org/gsea/msigdb/index.jsp
- ^ http://thomsonreuters.com/products_services/science/systems-biology/
- ^ http://www.ingenuity.com/products/ipa#/
References
Almeida, O. P., Mccaul, K., Hankey, G. J., Yeap, B. B., Golledge, J., and Flicker, L. (2016). Risk of dementia and death in community-dwelling older men with bipolar disorder. Br. J. Psychiatry 209, 121–126. doi: 10.1192/bjp.bp.115.180059
Baldaçara, L., Borgio, J. G. F., Araújo, C., Nery-Fernandes, F., Lacerda, A. L. T., Moraes, W. A. D. S., et al. (2012). Relationship between structural abnormalities in the cerebellum and dementia, posttraumatic stress disorder and bipolar disorder. Dement. Neuropsychol. 6, 203–211. doi: 10.1590/S1980-57642012DN06040003
Benjamini, Y., and Hochberg, Y. (1995). Controlling the false discovery rate: a practical and powerful approach to multiple testing. J. R. Stat. Soc. Ser. B Methodol. 57, 289–300. doi: 10.1111/j.2517-6161.1995.tb02031.x
Borges, S. Q., Corrêa, T. X., Trindade, I. O. A., Amorim, R. F. B., and Toledo, M. A. D. V. (2019). Cognitive impairment in bipolar disorder neuroprogression or behavioral variant frontotemporal dementia? Dement. Neuropsychol. 13, 475–480. doi: 10.1590/1980-57642018dn13-040016
Chen, K.-D., Chang, P.-T., Ping, Y.-H., Lee, H.-C., Yeh, C.-W., and Wang, P.-N. (2011). Gene expression profiling of peripheral blood leukocytes identifies and validates ABCB1 as a novel biomarker for Alzheimer’s disease. Neurobiol. Dis. 43, 698–705. doi: 10.1016/j.nbd.2011.05.023
Chen, M.-H., Li, C.-T., Tsai, C.-F., Lin, W.-C., Chang, W.-H., Chen, T.-J., et al. (2015). Risk of subsequent dementia among patients with bipolar disorder or major depression: a nationwide longitudinal study in Taiwan. J. Am. Med. Dir. Assoc. 16, 504–508. doi: 10.1016/j.jamda.2015.01.084
Chuang, L.-C., Kao, C.-F., Shih, W.-L., and Kuo, P.-H. (2013). Pathway analysis using information from allele-specific gene methylation in genome-wide association studies for bipolar disorder. PLoS One 8:e53092. doi: 10.1371/journal.pone.0053092
Crow, T. (2011). The missing genes: what happened to the heritability of psychiatric disorders? Mol. Psychiatry 16, 362–364. doi: 10.1038/mp.2010.92
Crow, T. J. (2007). How and why genetic linkage has not solved the problem of psychosis: review and hypothesis. Am. J. Psychiatry 164, 13–21. doi: 10.1176/ajp.2007.164.1.13
Diniz, B. S., Teixeira, A. L., Cao, F., Gildengers, A., Soares, J. C., Butters, M. A., et al. (2017). History of bipolar disorder and the risk of dementia: a systematic review and meta-analysis. Am. J. Geriatr. Psychiatry 25, 357–362. doi: 10.1016/j.jagp.2016.11.014
Fagiolini, A., Chengappa, K. N. R., Soreca, I., and Chang, J. (2008). Bipolar disorder and the metabolic syndrome: causal factors, psychiatric outcomes and economic burden. CNS Drugs 22, 655–669. doi: 10.2165/00023210-200822080-00004
Fish, E. W., Shahrokh, D., Bagot, R., Caldji, C., Bredy, T., Szyf, M., et al. (2004). Epigenetic programming of stress responses through variations in maternal care. Ann. N. Y. Acad. Sci. 1036, 167–180. doi: 10.1196/annals.1330.011
Frank, B., Niesler, B., Nothen, M. M., Neidt, H., Propping, P., Bondy, B., et al. (2004). Investigation of the human serotonin receptor gene HTR3B in bipolar affective and schizophrenic patients. Am. J. Med. Genet. B Neuropsychiatr. 131B, 1–5. doi: 10.1002/ajmg.b.30070
Fridley, B. L., and Biernacka, J. M. (2011). Gene set analysis of SNP data: benefits, challenges, and future directions. Eur. J. Hum. Genet. 19, 837–843. doi: 10.1038/ejhg.2011.57
Gershon, E. S., Alliey-Rodriguez, N., and Liu, C. (2011). After GWAS: searching for genetic risk for schizophrenia and bipolar disorder. Am. J. Psychiatry 168, 253–256. doi: 10.1176/appi.ajp.2010.10091340
Goodman, A. B., and Pardee, A. B. (2003). Evidence for defective retinoid transport and function in late onset Alzheimer’s disease. Proc. Natl. Acad. Sci. U.S.A. 100, 2901–2905. doi: 10.1073/pnas.0437937100
Hindorffa, L. A., Sethupathy, P., Junkins, H. A., Ramos, E. M., Mehta, J. P., Collins, F. S., et al. (2009). Potential etiologic and functional implications of genome-wide association loci for human diseases and traits. Proc. Natl. Acad. Sci. U.S.A. 106, 9362–9367. doi: 10.1073/pnas.0903103106
Holmans, P. (2010). Statistical methods for pathway analysis of genome-wide data for association with complex genetic traits. Adv. Genet. 72, 141–179. doi: 10.1016/B978-0-12-380862-2.00007-2
Holmans, P., Green, E. K., Pahwa, J. S., Ferreira, M. A. R., Purcell, S. M., Sklar, P., et al. (2009). Gene ontology analysis of GWA study data sets provides insights into the biology of bipolar disorder. Am. J. Hum. Genet. 85, 13–24. doi: 10.1016/j.ajhg.2009.05.011
Hoseth, E. Z., Krull, F., Dieset, I., Mørch, R. H., Hope, S., Gardsjord, E. S., et al. (2018). Exploring the Wnt signaling pathway in schizophrenia and bipolar disorder. Transl. Psychiatry 8, 1–10. doi: 10.1038/s41398-018-0102-1
Ideker, T., Dutkowski, J., and Hood, L. (2011). Boosting signal-to-noise in complex biology: prior knowledge is power. Cell 144, 860–863. doi: 10.1016/j.cell.2011.03.007
Jia, P., Kao, C.-F., Kuo, P.-H., and Zhao, Z. (2011a). A comprehensive network and pathway analysis of candidate genes in major depressive disorder. BMC Syst. Biol. 5:S12. doi: 10.1186/1752-0509-5-S3-S12
Jia, P., Wang, L., Meltzer, H. Y., and Zhao, Z. (2011b). Pathway-based analysis of GWAS datasets: effective but caution required. Int. J. Neuropsychopharmacol. 14, 567–572. doi: 10.1017/S1461145710001446
Kao, C. F., Chuang, L. C., and Kuo, P. H. (2014). Risk and information evaluation of prioritized genes for complex traits: application to bipolar disorder. Am. J. Med. Genet. B Neuropsychiatr. Genet. 165, 596–606. doi: 10.1002/ajmg.b.32263
Kao, C.-F., Jia, P., Zhao, Z., and Kuo, P.-H. (2012). Enriched pathways for major depressive disorder identified from a genome-wide association study. Int. J. Neuropsychopharmacol. 15, 1401–1411. doi: 10.1017/S1461145711001891
Kato, T. (2007). Molecular genetics of bipolar disorder and depression. Psychiatry Clin. Neurosci. 61, 3–19. doi: 10.1111/j.1440-1819.2007.01604.x
Kessing, L., and Andersen, P. (2004). Does the risk of developing dementia increase with the number of episodes in patients with depressive disorder and in patients with bipolar disorder? J. Neurol. Neurosurg. Psychiatry 75, 1662–1666. doi: 10.1136/jnnp.2003.031773
Kessler, R. C., Berglund, P., Demler, O., Jin, R., Merikangas, K. R., and Walters, E. E. (2005). Lifetime prevalence and age-of-onset distributions of DSM-IV disorders in the national comorbidity survey replication. Arch. Gen. Psychiatry 62, 593–602. doi: 10.1001/archpsyc.62.6.593
Kirkpatrick, B., Fernandez-Egea, E., Garcia-Rizo, C., and Bernardo, M. (2008). Differences in glucose tolerance between deficit and nondeficit schizophrenia. Schizophr. Res. 107, 122–127. doi: 10.1016/j.schres.2008.09.023
Kloiber, S., Czamara, D., Karbalai, N., Müller-Myhsok, B., Hennings, J., Holsboer, F., et al. (2012). ANK3 and CACNA1C – missing genetic link for bipolar disorder and major depressive disorder in two German case-control samples. J. Psychiatr. Res. 46, 973–979. doi: 10.1016/j.jpsychires.2012.04.017
Lee, S. H., Wray, N. R., Goddard, M. E., and Visscher, P. M. (2011). Estimating missing heritability for disease from genome-wide association studies. Am. J. Hum. Genet. 88, 294–305. doi: 10.1016/j.ajhg.2011.02.002
Ling, Z., Zhu, M., Liu, X., Shao, L., Cheng, Y., Yan, X., et al. (2021). Fecal fungal dysbiosis in chinese patients with Alzheimer’s disease. Front. Cell Dev. Biol. 8:1920. doi: 10.3389/fcell.2020.631460
Lopes, R., and Fernandes, L. (2012). Bipolar disorder: clinical perspectives and implications with cognitive dysfunction and dementia. Depress. Res. Treat. 2012:275957. doi: 10.1155/2012/275957
Maher, B. (2008). Personal genomes: the case of the missing heritability. Nature 456, 18–21. doi: 10.1038/456018a
Manolio, T. A., Brooks, L. D., and Collins, F. S. (2008). A HapMap harvest of insights into the genetics of common disease. J. Clin. Investig. 118, 1590–1605. doi: 10.1172/JCI34772
Manolio, T. A., Collins, F. S., Cox, N. J., Goldstein, D. B., Hindorff, L. A., Hunter, D. J., et al. (2009). Finding the missing heritability of complex diseases. Nature 461, 747–753. doi: 10.1038/nature08494
Manolio, T. A., Rodriguez, L. L., Brooks, L., Abecasis, G., Psoriasis, T. C. A. S. O., Ballinger, D., et al. (2007). New models of collaboration in genomewide association studies: the genetic association information network. Nat. Genet. 39, 1045–1051. doi: 10.1038/ng2127
Masouy, A., Chopard, G., Vandel, P., Magnin, E., Rumbach, L., Sechter, D., et al. (2011). Bipolar disorder and dementia: where is the link? Psychogeriatrics 11, 60–67.
McGowan, P. O., Sasaki, A., D’alessio, A. C., Dymov, S., Labonté, B., Szyf, M., et al. (2009). Epigenetic regulation of the glucocorticoid receptor in human brain associates with childhood abuse. Nat. Neurosci. 12, 342–348. doi: 10.1038/nn.2270
McGuffin, P., Rijsdijk, F., Andrew, M., Sham, P., Katz, R., and Cardno, A. (2003). The heritability of bipolar affective disorder and the genetic relationship to unipolar depression. Arch. Gen. Psychiatry 60, 497–502. doi: 10.1001/archpsyc.60.5.497
Merikangas, K. R., Herrell, R., Swendsen, J., Rossler, W., Ajdacic-Gross, V., and Angst, J. (2008). Specificity of bipolar spectrum conditions in the comorbidity of mood and substance use disorders: results from the Zurich cohort study. Arch. Gen. Psychiatry 65, 47–52. doi: 10.1001/archgenpsychiatry.2007.18
Mirina, A., Atzmon, G., Ye, K., and Bergman, A. (2012). Gene size matters. PLoS One 7:e49093. doi: 10.1371/journal.pone.0049093
Pavlovic, A., Marley, J., and Sivakumar, V. (2011). Development of frontotemporal dementia in a case of bipolar affective disorder: is there a link? BMJ Case Rep. 2011:bcr0920103303. doi: 10.1136/bcr.09.2010.3303
Pedroso, I., Lourdusamy, A., Rietschel, M., Nöthen, M. M., Cichon, S., Mcguffin, P., et al. (2012). Common genetic variants and gene-expression changes associated with bipolar disorder are over-represented in brain signaling pathway genes. Biol. Psychiatry 72, 311–317. doi: 10.1016/j.biopsych.2011.12.031
Peng, G., Luo, L., Siu, H., Zhu, Y., Hu, P., Hong, S., et al. (2010). Gene and pathway-based second-wave analysis of genome-wide association studies. Eur. J. Hum. Genet. 18, 111–117. doi: 10.1038/ejhg.2009.115
Pregelj, P. (2011). Gene environment interactions in bipolar disorder. Psychiatr. Danub. 23, S91–S93.
Priebe, L., Degenhardt, F., Herms, S., Haenisch, B., Mattheisen, M., Nieratschker, V., et al. (2012). Genome-wide survey implicates the influence of copy number variants (CNVs) in the development of early-onset bipolar disorder. Mol. Psychiatry 17, 421–432. doi: 10.1038/mp.2011.8
Saccone, S. F., Hinrichs, A. L., Saccone, N. L., Chase, G. A., Konvicka, K., Madden, P. A. F., et al. (2007). Cholinergic nicotinic receptor genes implicated in a nicotine dependence association study targeting 348 candidate genes with 3713 SNPs. Hum. Mol. Genet. 16, 36–49. doi: 10.1093/hmg/ddl438
Saxena, U. (2009). Lipid metabolism and Alzheimer’s disease: pathways and possibilities. Expert Opin. Ther. Targets 13, 331–338. doi: 10.1517/14728220902738720
Shih, W.-L., Kao, C.-F., Chuang, L.-C., and Kuo, P.-H. (2013). Incorporating information of microRNAs into pathway analysis in a genome-wide association study of bipolar disorder. Front. Genet. 3:293. doi: 10.3389/fgene.2012.00293
Sidak, Z. (1967). Rectangular confidence regions for the means of multivariate normal distributions. J. Am. Stat. Assoc. 62, 626–633. doi: 10.2307/2283989
Starr, J. M., and Whalley, L. J. (1994). Drug-induced dementia. Drug Saf. 11, 310–317. doi: 10.2165/00002018-199411050-00003
Stephens, M., and Balding, D. J. (2009). Bayesian statistical methods for genetic association studies. Nat. Rev. Genet. 10, 681–690. doi: 10.1016/j.gene.2018.10.057
Subramanian, A., Tamayo, P., Mootha, V. K., Mukherjee, S., Ebert, B. L., Gillette, M. A., et al. (2005). Gene set enrichment analysis: a knowledge-based approach for interpreting genome-wide expression profiles. Proc. Natl. Acad. Sci. U.S.A. 102, 15545–15550. doi: 10.1073/pnas.0506580102
Thakore, J. H. (2004). Metabolic disturbance in first-episode schizophrenia. Br. J. Psychiatry 184, s76–s79. doi: 10.1192/bjp.184.47.s76
Vancampfort, D., Vansteelandt, K., Correll, C. U., Mitchell, A. J., De Herdt, A., Sienaert, P., et al. (2013). Metabolic syndrome and metabolic abnormalities in bipolar disorder: a meta-analysis of prevalence rates and moderators. Am. J. Psychiatry 170, 265–274. doi: 10.1176/appi.ajp.2012.12050620
Wang, C., Zhao, J., Xu, R., Zhao, J., and Duan, S. (2015). Identification of pivotal markers in vascular dementia based on proteomics data. Dement. Geriatr. Cogn. Disord. 39, 312–320. doi: 10.1159/000375296
Wang, K., Li, M., and Hakonarson, H. (2010). Analysing biological pathways in genome-wide association studies. Nat. Rev. Genet. 11, 843–854. doi: 10.1038/nrg2884
Wang, L., Jia, P., Wolfinger, R. D., Chen, X., and Zhao, Z. (2011). Gene set analysis of genome-wide association studies: methodological issues and perspectives. Genomics 98, 1–8. doi: 10.1016/j.ygeno.2011.04.006
Weaver, I. C. G., Cervoni, N., Champagne, F. A., D’alessio, A. C., Sharma, S., Seckl, J. R., et al. (2004). Epigenetic programming by maternal behavior. Nat. Neurosci. 7, 847–854. doi: 10.1038/nn1276
Wood, P. L., and Wood, J. A. (2013). Thiol metabolism in schizophrenia: current status. Curr. Psychiatry Rev. 9, 136–147. doi: 10.2174/1573400511309020008
Wu, K. Y., Chang, C. M., Liang, H. Y., Wu, C. S., Chia−Hsuan Wu, E., Chen, C. H., et al. (2013). Increased risk of developing dementia in patients with bipolar disorder: a nested matched case–control study. Bipolar Disord. 15, 787–794. doi: 10.1111/bdi.12116
Yang, J., Benyamin, B., Mcevoy, B. P., Gordon, S., Henders, A. K., Nyholt, D. R., et al. (2010). Common SNPs explain a large proportion of the heritability for human height. Nat. Genet. 142, 565–571. doi: 10.1375/twin.13.6.517
Yang, W., De Las Fuentes, L., Davila-Roman, V. G., and Gu, C. C. (2011). Variable set enrichment analysis in genome-wide association studies. Eur. J. Hum. Genet. 19, 893–900. doi: 10.1038/ejhg.2011.46
Keywords: genome-wide association study, pathway analysis, functional subnetwork, prior knowledge, bipolar, dementia
Citation: Kuo C-Y, Chen T-Y, Kao P-H, Huang W, Cho C-R, Lai Y-S, Yiang G-T and Kao C-F (2021) Genetic Pathways and Functional Subnetworks for the Complex Nature of Bipolar Disorder in Genome-Wide Association Study. Front. Mol. Neurosci. 14:772584. doi: 10.3389/fnmol.2021.772584
Received: 08 September 2021; Accepted: 08 October 2021;
Published: 22 November 2021.
Edited by:
Jiehui Jiang, Shanghai University, ChinaReviewed by:
Can Sheng, Capital Medical University, ChinaLalu Muhammad Irham, Ahmad Dahlan University, Indonesia
Suleman Atique, University of Hail, Saudi Arabia
Copyright © 2021 Kuo, Chen, Kao, Huang, Cho, Lai, Yiang and Kao. This is an open-access article distributed under the terms of the Creative Commons Attribution License (CC BY). The use, distribution or reproduction in other forums is permitted, provided the original author(s) and the copyright owner(s) are credited and that the original publication in this journal is cited, in accordance with accepted academic practice. No use, distribution or reproduction is permitted which does not comply with these terms.
*Correspondence: Chung-Feng Kao, a2FvY0BuY2h1LmVkdS50dw==; Z2NmNkBob3RtYWlsLmNvbQ==
†These authors have contributed equally to this work and share first authorship
‡These authors have contributed equally to this work