 Oswald Steward1,2,3,4*
 Kelly Matsudaira Yee1,2
 Shannon Farris1,2†
 Patricia S. Pirbhoy1,3
 Paul Worley5
 Kohji Okamura6
 Hiroyuki Okuno7
 Haruhiko Bito8
- 1Reeve-Irvine Research Center, University of California, Irvine, Irvine, CA, United States
- 2Department of Anatomy and Neurobiology, University of California, Irvine, Irvine, CA, United States
- 3Department of Neurobiology and Behavior, University of California, Irvine, Irvine, CA, United States
- 4Center for the Neurobiology of Learning and Memory, University of California, Irvine, Irvine, CA, United States
- 5Johns Hopkins School of Medicine, Baltimore, MD, United States
- 6Department of Systems BioMedicine, National Research Institute for Child Health and Development, Tokyo, Japan
- 7Medical Innovation Center, Kyoto University Graduate School of Medicine, Kyoto, Japan
- 8Department of Neurochemistry, University of Tokyo Graduate School of Medicine, Tokyo, Japan
Arc is a unique immediate early gene (IEG) whose expression is induced as synapses are modified during learning. Newly-synthesized Arc mRNA is rapidly transported throughout dendrites and localizes near recently activated synapses. Arc mRNA levels are regulated by rapid degradation, which is accelerated by synaptic activity in a translation-dependent process. One possible mechanism is nonsense-mediated mRNA decay (NMD), which depends on the presence of a splice junction in the 3′UTR. Here, we test this hypothesis using transgenic mice that express EGFP-Arc. Because the transgene was constructed from Arc cDNA, it lacks intron structures in the 3′UTR that are present in the endogenous Arc gene. NMD depends on the presence of proteins of the exon junction complex (EJC) downstream of a stop codon, so EGFP-Arc mRNA should not undergo NMD. Assessment of Arc mRNA rundown in the presence of the transcription inhibitor actinomycin-D confirmed delayed degradation of EGFP-Arc mRNA. EGFP-Arc mRNA and protein are expressed at much higher levels in transgenic mice under basal and activated conditions but EGFP-Arc mRNA does not enter dendrites efficiently. In a physiological assay in which cycloheximide (CHX) was infused after induction of Arc by seizures, there were increases in endogenous Arc mRNA levels consistent with translation-dependent Arc mRNA decay but this was not seen with EGFP-Arc mRNA. Taken together, our results indicate: (1) Arc mRNA degradation occurs via a mechanism with characteristics of NMD; (2) rapid dendritic delivery of newly synthesized Arc mRNA after induction may depend in part on prior splicing of the 3′UTR.
Significance
Studies of the immediate early gene Arc have revealed fundamental cell biological mechanisms of mRNA transport into dendrites and localization at active synapses and mechanisms of Arc mRNA transcription and degradation. Here, we show that two key aspects of Arc mRNA dynamics are dependent on introns in the 3′UTR of Arc mRNA. In transgenic mice expressing an EGFP-Arc transgene with the Arc-EGFP coding regions and Arc 3′UTR that lacks introns, degradation of EGFP-Arc mRNA is delayed and dendritic transport is impaired in comparison to endogenous Arc mRNA. Our findings elucidate features of Arc mRNA turnover and dendritic transport and highlight the usefulness of EGFP-Arc transgenic mice for studies of the functional significance of Arc expression dynamics and dendritic transport.
Introduction
The immediate early gene Arc (Lyford et al., 1995), also known as Arg 3.1 (Link et al., 1995), has been implicated in synaptic modifications that underlie memory storage (Steward et al., 2014). Arc transcription is induced by learning experiences or strong synaptic activity, and Arc is unique amongst IEGs in that newly-synthesized Arc mRNA is rapidly transported throughout dendrites (Link et al., 1995; Lyford et al., 1995). If synapses are strongly activated as Arc mRNA moves into dendrites, Arc mRNA localizes selectively near the active synapses (Steward et al., 1998). Patterns of synaptic activation that induce Arc transcription simultaneously trigger Arc mRNA degradation (Farris et al., 2014). Indeed, it is a combination of selective docking of newly-synthesized Arc mRNA near active synapses and activity-dependent Arc mRNA degradation that sharpens the selectivity of Arc localization in activated dendritic domains (Farris et al., 2014).
An important, but poorly-understood aspect of Arc is its expression dynamics. Rapid activity-dependent induction is consistent with Arc's putative role in synaptic plasticity. Arc protein is subject to ubiquitination and proteosomal degradation (Mabb et al., 2014), but mechanisms underlying rapid degradation of Arc mRNA are not worked out. A possible mechanism for Arc mRNA decay is nonsense-mediated mRNA decay (NMD), which is triggered when a translating ribosome reaches the stop codon and interacts with the exon junction complex (EJC) at a downstream splice site (Giorgi et al., 2007). The Arc gene consists of a single open-reading frame exon and two introns in its 3′UTR. After pre-mRNA processing, EJC proteins remain bound to Arc mRNA as it moves into the cytoplasm, and the presence of a splice site with EJC's more than about 70 nt downstream of a stop codon is the canonical signal for NMD. It is not clear, however, whether activity-driven degradation of Arc mRNA occurs via this mechanism.
A pivotal test of the hypothesis is to determine if Arc transcripts that were never spliced (and thus do not have associated EJC proteins) are degraded in the same way as endogenous Arc mRNA. To test this, the present study uses a line of transgenic mice in which an EGFP-Arc fusion gene that includes the 3′ and 5′UTRs of Arc is expressed under the control of the 7kb Arc promoter, which recapitulates the activity-dependent expression of Arc (Kawashima et al., 2009; Okuno et al., 2012). Importantly, the transgene was created from Arc cDNA, which lacks any introns, thus, the transcript is not spliced.
If Arc mRNA is degraded by NMD, then: (1) Endogenous Arc mRNA should be degraded more quickly than EGFP-Arc mRNA; (2) Inhibition of protein synthesis should lead to increases in endogenous Arc mRNA (Farris et al., 2014), but not EGFP-Arc mRNA levels; and (3) EGFP-Arc mRNA should not undergo activity-dependent degradation. Consistent with these predictions, we show here that EGFP-Arc mRNA transcription is induced by the same stimuli that induce endogenous Arc expression but EGFP-Arc mRNA has a longer half-life than endogenous Arc mRNA. Unexpectedly, we found that EGFP-Arc mRNA was not delivered into dendrites to the same degree as endogenous Arc mRNA after induction, suggesting that rapid dendritic delivery of newly synthesized Arc mRNA may depend on or be facilitated by prior splicing of the 3′UTR. Although experiments to assess translation-dependence of Arc mRNA decay were complicated by the fact that consequences of inhibiting protein synthesis were less striking in mice than previously seen in rats, overall results supported the conclusion that unlike endogenous Arc mRNA, EGFP-Arc mRNA degradation is not accelerated by mRNA translation. We also found that EGFP-Arc protein also is not degraded with the rapid kinetics of endogenous Arc protein resulting in higher levels of total Arc protein in EGFP-Arc-transgenic mice than in wildtype controls.
Methods
Experimental Animals
Most experiments were carried out using adult male and female mice from our breeding colony that was established using founders derived from frozen embryos of EGFP-Arc mice from Okuno and Bito (Okuno et al., 2012). Founder mice were crossed with C57Bl/6 mice to expand the colony and hemizygous mice were then set up in breeding pairs to obtain hemizygous and homozygous transgenic EGFP-Arc mice, and controls with only wild type (WT) Arc. Some of the neurophysiology experiments used C57Bl/6/J mice obtained from Jackson Labs as detailed in the Results. All procedures involving live animals were approved by the Institutional Animal Care and Use Committees of the University of California Irvine, Kyoto University, and the University of Tokyo.
Mice were genotyped by a commercial vendor (Transnetyx) by TaqMan® qPCR with forward primer: CGTCGTCCTTGAAGAAGATGGT, Reverse Primer: CACATGAAGCAGCACGACTT and an internal oligo with a fluorescent probe (CATGCCCGAAGGCTAC). As noted in the Results, we also found that genotype could be easily determined by in situ hybridization.
Novel Enriched Environment
To assess Arc induction due to a brief learning experience, mice were allowed to explore a novel toy-filled environment for 1 h, which we previously referred to as “unsupervised learning” (Farris et al., 2014). The environment was a 24 × 24 in square plexiglass box with various small items that mice could climb, crawl under, or that moved when touched.
To test whether Arc and EGFP-Arc mRNA levels depended on ongoing translation as predicted by NMD-dependent mRNA degradation, we tested whether inhibition of protein synthesis with cycloheximide (CHX; 20 mg/kg i.p.) led to increases in mRNA levels as previously reported in rats (Farris et al., 2014). To assess effects of CHX on Arc mRNA levels under basal conditions, mice were gently removed from their home cage, received CHX or saline and were returned to their home cage for 1 h. To assess whether CHX led to increased mRNA levels following a learning experience, pairs of mice were allowed to explore the novel environment for 1 h. One mouse in each pair received CHX (20 mg/kg i.p.); the other received saline. Brains from mice that received CHX or saline were mounted together on microscope slides and hybridized or immunostained in the same solutions. This strategy allowed direct comparisons of mRNA and protein levels in brains from mice of the same genotype and with very similar experience with and without CHX.
Electroconvulsive Seizures
A single electroconvulsive seizure (ECS) was induced as described previously (Wallace et al., 1998). Current was passed transcranially (10 mA for 0.5 s) via ear clip electrodes resulting in a generalized tonic/clonic seizure that lasted approximately 15 s.
Neurophysiology
Mice were anesthetized via intraperitoneal injections of 20% urethane (500 mg/kg body weight) with supplemental doses given approximately every 10 min until the animal was unresponsive to tail pinch. Mice were positioned in a stereotaxic apparatus and burr holes were placed in the skull to allow placement of stimulating and recording electrodes. An insulated monopolar stimulating electrode was positioned stereotaxically at 3.0 mm lateral to the midline at the transverse sinus. The depth of the stimulating electrode was adjusted so as to optimally activate the medial perforant path (MPP) originating from the medial entorhinal cortex (EC)—usually about 3 mm below the cortical surface. Glass recording electrodes filled with 0.9% saline were positioned at 1.5–1.8 mm lateral to the midline, and 2.0 mm posterior to bregma. Electrodes were positioned in the dorsal blade of the dentate gyrus so as to record field potentials from the cell body layer.
Stimulation Paradigm
After positioning the stimulating and recording electrodes, stimulus intensity was set so as to evoke a population spike of 3–6 mV. Single test pulses were delivered at a rate of 1/10 s at the same intensity for 10 min in order to determine baseline response amplitude; measures were the slope of the population EPSP and amplitude of the population spike. Following baseline recordings, 3 rounds of high frequency stimulation was delivered, with each round consisting of ten trains of eight pulses at 400 Hz and each train given at a rate of 1/10 s. After each bout of HFS, a round of ten test pulses was given to determine the extent of LTP. Then, HFS was continued at a rate of one 400 hz train per 10 s for 1 h.
Assessment of mRNA Half-Life in Vivo
To assess the half-life of EGFP-Arc mRNA vs. endogenous Arc mRNA in vivo, we assessed rundown of mRNA levels after transcriptional block with actinomycin-D (Act-D). Arc transcription was induced in transgenic and WT mice by delivering an electroconvulsive seizure (ECS) and time was allowed for mRNA levels to ramp up. Mice received injections of anesthetic (urethane) about 45 min post-ECS and were placed in a stereotaxic device. A recording micropipette containing 2 mg/ml Act-D mannitol in saline was stereotaxically positioned in the dentate gyrus at approximately 1 h post-ECS and a monopolar stimulating electrode was placed in the entorhinal cortex as above. The final position of the Act-D-containing micropipette was adjusted by monitoring evoked responses generated by stimulation of the entorhinal cortex. Micropipettes containing Act-D were left in place for 30 or 60 min (3–4 mice per group at each time point except for 30 min WT where n = 2), after which brains were harvested for fluorescent in situ hybridization (FISH).
Tissue Preparation
Mice were killed by a lethal injection of the anesthetic Euthasol or Fatal Plus® depending on the IACUC protocol in effect on the date of the experiment. Un-fixed brains were removed and rapidly frozen. For chromogen-based in situ hybridization, mice were perfused with 4% paraformaldehyde in phosphate buffered saline (PBS, pH 7.4). Brains were cryoprotected by placing in 25% sucrose overnight and sectioned at 20 μm on a cryostat and slides with sections were stored at −80°C until use.
In Situ Hybridization
The cRNA probe for Arc/Arg3.1 was generated as described previously (Steward et al., 1998). The EGFP gene from EGFP-N1 was cloned into the BamHI-NotI site of Bluescript KS(+). For transcribing cRNA probes, the Bluescript vector was linearized with BamHI.
Fluorescent in situ hybridization (FISH) was performed on 20 μm coronal sections prepared from flash-frozen brains as described by Guzowski et al. (1999). cRNA riboprobes were generated using the Ambion MaxiScript kit and a premixed RNA labeling nucleotide mix containing digoxigenin-labeled UTP (Roche Molecular Biochemicals). Sections were incubated with the digoxigenin-labeled Arc antisense riboprobe (1–2 ng/ml) for 16–20 h. Subsequent to washes of various stringencies, slides were incubated with a horseradish peroxidase (HRP)-conjugated antibody to digoxigenin. HRP was detected using the Tyramide Signal Amplification fluorescence (TSA-CY3) kit from Perkin Elmer or from tyramide-FITC synthesized in lab as described (Hopman et al., 1998). In some experiments, sections were also stained with DAPI to mark nuclei. Slides were coverslipped using Vectashield® mounting medium (Vector Laboratories). Comparisons of patterns of labeling and quantitative analyses were done using slides that were hybridized or immunostained in the same run to control for variability in the extent of hybridization/immunostaining.
For chromagen-based in situ hybridization slide-mounted sections were post-fixed with 4% paraformaldehyde in 0.1 M PBS for 30 min, then rinsed with 0.5x saline-sodium citrate buffer (0.5xSSC, 0.1%DEPC treated) for 5 min. Sections were treated with Proteinase K (1.25 mg/L) for 30 min, rinsed again with 0.5xSSC (0.1%DEPC treated) for 10 min and air-dried. The sections were covered with 75 μl prehybridization buffer (2xSSC, 25% formamide, 1% Denhardt's reagent, 10% dextran sulfate, 0.5 mg/mL heparin, 0.5 mg/ml yeast tRNA and 0.25 mg/mL of denatured salmon sperm DNA) and incubated at 42°C for 2 h. After the prehybridization, about 0.5 μg of Dig-cRNA probe in 75 μl hybridization buffer was added to each section. The sections were covered with a baked coverslip, and incubated overnight at 55°C in a humidified box with 25% formamide/2xSSC. The next day, the coverslips were removed and sections were washed with 2xSSC/10 mM EDTA twice (10 min each). The sections were treated with RNAse-A for 30 min, and then washed twice with 2xSSC/EDTA (10 min per wash). The stringency wash was 0.5xSSC/10 mMEDTA at 55°C for 2 h. Sections were washed with 0.5xSSC twice (10 min each at room temperature). Alkaline phosphatase conjugated anti-digoxigenin Fab fragment (1:5,000) was used to detect the probes. NBT/BCIP solution was applied overnight at 4°C to detect the alkaline phosphatase. Sections were washed with 100 mM Tris-HCl (pH 8.5)/1 mM EDTA 3 times, 10 min each. Then slides were briefly rinsed with nanopure water twice and covered with Kaiser's glycerol jelly.
Quantification of FISH
Quantification of FISH was done using NIH ImageJ. For the experiments involving treatment with CHX vs. saline, images were taken at 20X of an area in the CA1 subfield of the dorsal hippocampus extending from stratum oriens through stratum radiatum (2 different sections, 2 images per section in each animal). All images from a given experiment were taken at the same exposure and imported into a single Tiff file using Adobe Photoshop. The tiff image was opened in ImageJ, and a measuring box was positioned over the CA1 cell body layer. Mean fluorescence intensity over the cell layer of each individual image was assessed using the “Measure” function of NIH ImageJ, and the values were then averaged for each individual animal. Statistical comparisons were done using Prism Version 6 with n = number of animals.
Counts of mRNA Puncta in Dendritic Laminae
Counts of mRNA puncta in dendritic laminae were done by imaging sections using confocal microscopy in order to resolve individual fluorescent puncta. Image stacks were collected at 63X from stratum radiatum of area CA1 using a Zeiss LSM700 confocal microscope keeping acquisition parameters constant. The total area of the image was 204.8 μm2. Four image stacks taken at an interval of 0.55 μm (total range of 1.65 μm) were collapsed into a maximum intensity image using the Z project function. The image was converted to 8-bit, inverted, and the threshold was adjusted to highlight individual Arc puncta. Particles were counted using NIH ImageJ “particle analysis.”
To assess fluorescence intensity across the cell body and molecular layers, 20X images were acquired at the same exposure and converted to 8-bit gray scale images in ImageJ. Using the ImageJ line function, a region of interest (ROI) line was defined as the length of the cell body layer and the dendritic laminae (250–300 μm in length). This ROI was saved and used for each case and was aligned perpendicular to the cell body layer so that the middle molecular layer was positioned in the middle of the line at 150 μm for 300 μm ROIs and 125 μm for 250 μm ROIs, this ensured that despite differences in the widths of cell body layers, that the region of stimulation (the middle molecular layer) was aligned across cases. Images from chromogen-based in situ hybridization acquired in bright field were inverted so that higher density equated to a greater intensity value. Intensities were measured across the line every 10 μm along the length of the 20X image (usually about 10 line measurements per image). Line measurements were averaged across each point in the line to obtain an average value for each point along the line ROI for each case. These average line ROI values were averaged across animals to generate an “average fluorescence intensity (or optical density) vs. distance” graph with average values ± SEM.
Immunohistochemistry (IHC)
For IHC, slide-mounted sections were fixed in 4% paraformaldehyde, washed, treated with 3% hydrogen peroxide to block endogenous peroxidase and incubated for 1 h in at room temperature in 5% Blocking Reagent from Perkin Elmer (FP1012) before overnight incubation with the primary antibodies. For Arc, we used an antibody from Synaptic Systems (156-003, 1:1,000 dilution). EGFP-Arc fusion protein contains the full length Arc protein, so Arc antibodies detect both endogenous Arc and EGFP-Arc in transgenic mice. To detect EGFP, sections were incubated with an antibody to GFP from Invitrogen (A-11122, 1:1,500).
After incubation in primary antibodies, slides were washed in TBS, incubated for 2 h with HRP-conjugated donkey anti-rabbit IgG secondary antibody (Jackson ImmunoResearch, 711-036-152, 1:500 dilution). HRP was detected using Catalyzed Reporter Deposition (CARD) amplification as described (Hopman et al., 1998). In some cases, sections were stained with Hoechst 33258 (1 μg/ml) to stain nuclei. Slides were then washed with TBS, mounted and coverslipped using Vectashield® (Vector Laboratories).
SDS-PAGE and Western Blotting
EGFP-Arc tg/tg (N = 5) and WT controls from the breeding colony (N = 4;10–32 weeks of age) were taken directly from their home cage and euthanized with Fatal Plus (0.5 mL). The left forebrain (cortex and hippocampus) was rapidly dissected on ice and homogenized in 250 μL of Lysis Buffer (50 mM Tris-HCL, pH 7.4, 150 mM NaCl, 5 mM EDTA, 0.05% Triton X-100, 1 mM PMSF, PhosStop phosphatase inhibitor (Roche, cat. 04 906 837 001) and Complete Mini Protease Inhibitor® (Roche, cat. 04 693 124 001). Homogenates were centrifuged at 15,000 × g for 15 min at 4°C. Protein concentrations were determined with the BioRad Protein Assay Kit (cat. 500-0006).
For SDS-PAGE, samples were diluted to 1 μg/ml in 1X Laemmli sample buffer, boiled, and 20 μg of protein were loaded per well and resolved on a 4–20% gradient SDS-PAGE mini-gel (BioRad, cat. 4561095). Proteins were transferred to Immobilon-FL polyvinylidene fluoride membranes (PVDF, cat. IPFL00010) and blocked with Odyssey Blocking buffer (LI-COR, cat. 927-40100 PBS blocking buffer); membranes were incubated with antibodies at a dilution of 1:2,000 rabbit anti-Arc (Synaptic Systems, cat. 156-003) or 1:10,000 mouse anti-β-actin (Sigma, cat. A-5441) followed by incubation in goat anti-rabbit IR dye 800CW (LI-COR, cat. 926-32211) or goat anti-mouse 680CW (LI-COR, cat. 926-68070) at a dilution of 1:15,000. The blots were scanned using the LI-COR system and imaged using Odyssey Fc imagining system. Quantification of fluorescent signal band intensity was done using LI-COR image studio ver.3.1. Values were normalized to the beta-actin loading control.
Quantitative PCR to Determine Transgene Copy Number in the Mouse Genome
Genomic DNA was extracted from Proteinase K-digested liver lysates of wildtype, hemizygous, or homozygous EGFP-Arc Tg mice. The genomic DNA was then purified through Phenol/Chloroform extraction and ethanol precipitation, and analyzed by SYBR green-based qPCR (SYBR Premix Ex Taq II, Takara Bio, Japan) to determine copy numbers of Arc ORF and internal control gapdh genes. The primers used are follows:
For ArcORF:
Forward, 5′-AGCTGGACCATATGACCACCGG-3′
Reverse, 5′-CAGGATCACATTGGGTTTGGCG-3′
For gapdh
Forward, 5′-TCTTCACCACCATGGAGAAGGCC-3′
Reverse, 5′-GGCAGAAGGGGCGGAGATGA-3′
The copy number of Arc ORF was normalized with that of gapdh for each genomic DNA sample.
Whole-Genome Sequencing to Identify the Transgene Integration Site
A DNA library was constructed from genomic DNA of a homozygous Tg mouse using the TruSeq DNA PCR-Free Library Prep Kit (Illumina) to perform whole-genome sequencing of the sample. The library was sequenced on the HiSeq 2500 sequencer (Illumina), yielding 150-bp paired-end reads. The library adapter sequences at 3′ ends were removed with cutadapt 1.7.1 (Martin, 2011) and low-quality bases (q-score < 16) at both ends were then trimmed using a custom script. Pairs containing a read that was shorter than 36 nt were eliminated. As a result, we obtained 124,547,964 read pairs consisting of 36,875,791,529 bases. The 13.5 × FASTQ data were mapped to the mouse reference sequence GRCm38 or mm10 using the MEM algorithm of BWA 0.7.12 (Li and Durbin, 2009). We added the 11,829-bp transgenic sequence (i.e., Arc 7k promoter, 5′UTR, GFP-Arc, and 3′UTR; Kawashima et al., 2009) to the reference data in advance. If a read was mapped to either the transgene sequence or the Arc locus (Chr15:74,669,000–74,682,000), the paired sequences, i.e., along with its counterpart, were extracted to prepare a BAM file. Using SAMtools 1.2 (Li et al., 2009) and Integrative Genomics Viewer 2.3.66 (Robinson et al., 2011), we found many of the counterpart reads were mapped to a region around Chr12:78,138,000. Then, read pairs in which at least one of mates was mapped to an 8-kb region, Chr12:78,134,000–78,142,000, were extracted to prepare another BAM file. Due to apparent lack of mapped reads, a 1.8-kb homozygous deletion was easily detected along with 16 informative read pairs that might span the deletion breakpoints. By aligning these 16 × 2 sequences, two breakpoint sites were determined at single-base resolution. At both sites, sequences of chromosome 12 and the EGFP-Arc transgene were connected using 4- and 5-bp shared fragments, respectively. Other integrations were not detected in the whole-genome data. Custom programs, which are available upon request to K.O., were written in Perl and C.
PCR-Based Confirmation of the Transgene Integration Site
The transgene integration was detected by PCR using tail DNA with the following specific primers:
Chr12_78M WT primer set 1:
Forward, 5′-AAAGCAATTGTTCACCTGATCTCTGGG-3′
Reverse, 5′-GGTTTCTGTAGGACCTTCACCCACAAG-3′
Chr12_78M WT primer set 2:
Forward, 5′-AGCATCCCTCCAAGGATCATCCCAGTG-3′
Reverse, 5′-TTGGTGGGGGGAGGAAGAGTTCTC-3
Tg junction primer set 1:
Forward, 5′-AAAGCAATTGTTCACCTGATCTCTGGG-3′
Reverse, 5′-CAGGTATCAAGGTGAGTCAGGTCTCCC-3′
Tg junction primer set 2:
Forward, 5′-AGGTTAACCAAGGTCCTACGCCATG-3′
Reverse, 5′-TTGGTGGGGGGAGGAAGAGTTCTC-3
Experimental Design and Statistical Analysis
Comparisons between genotypes were done using mice from the breeding colony (mostly male mice with a few females as noted below based on availability at the time of the experiment). Data were analyzed using Prism Version 6.
Comparisons of levels of Arc mRNA by genotype (Figure 1L)
Brain sections from WT, hemizygous and homozygous EGFP-Arc mice (n = 3 males per group) were mounted together on microscope slides and prepared for FISH. Fluorescence intensity was measured over the pyramidal cell layer of CA1. Data were analyzed by one-way ANOVA.
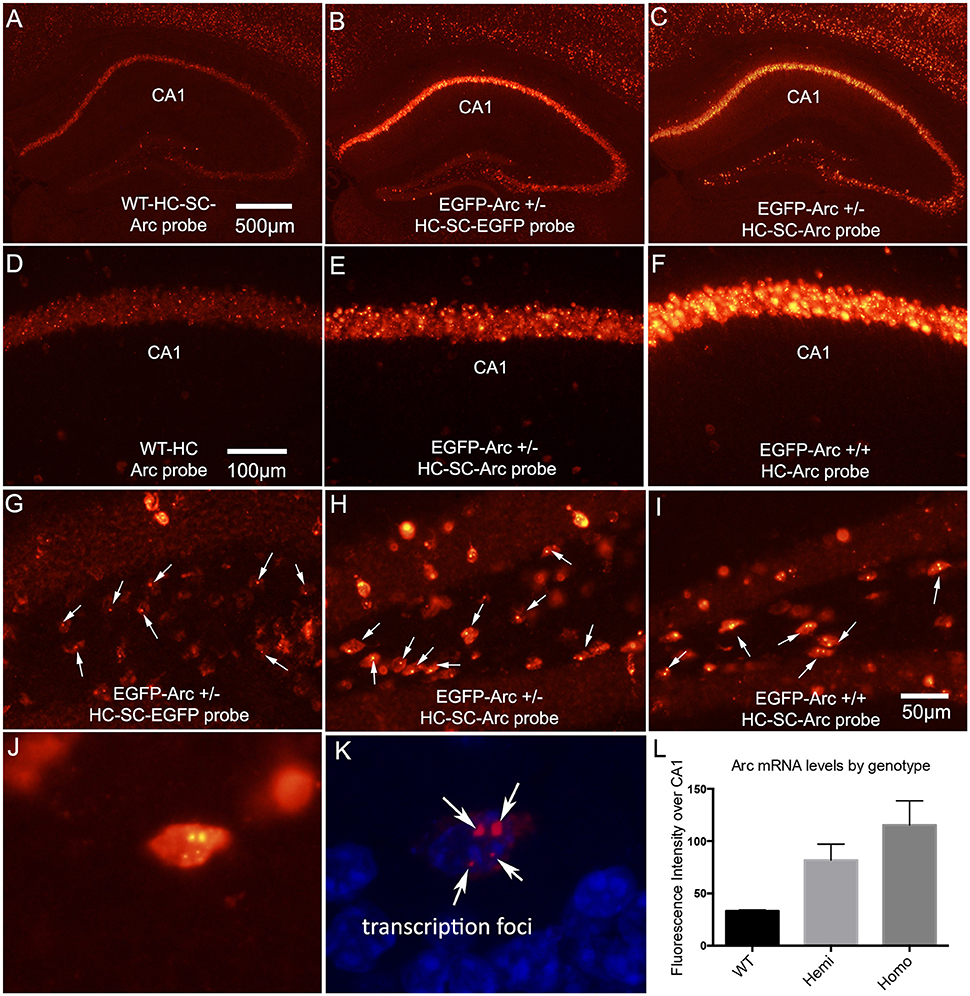
Figure 1. Patterns of expression of endogenous Arc vs. EGFP-Arc mRNAs. (A) Fluorescence in situ hybridization (FISH) for Arc mRNA in a WT mouse that received I.P. saline and was returned to its home cage for 1 h. HC-SC = home cage, saline control. Arc mRNA is detectable in some neurons in the CA1 region of the hippocampus and a few dentate granule cells express Arc at moderate levels. (B) Hemizygous EGFP-Arc mouse (home cage saline control) hybridized with the EGFP probe; (C) Hemizygous EGFP-Arc mouse (home cage saline control) hybridized with the Arc probe; (D–F) Higher magnification views of the CA1 region from WT, hemizygous and homozygous transgenic mice. (G) Hilar region of the dentate gyrus from hemizygous EGFP-Arc mouse (home cage saline control) hybridized with the EGFP probe. Arrows indicate fluorescent foci in nuclei; (H) Hilar region of the dentate gyrus from hemizygous EGFP-Arc mouse (home cage saline control) hybridized with the Arc probe; (I) Hilar region of the dentate gyrus from homozygous EGFP-Arc mouse (home cage saline control) hybridized with the Arc probe; (J) High magnification view of a neuron in the hilar region from homozygous EGFP-Arc mouse (home cage saline control) hybridized with the Arc probe. Note two large and two small fluorescent foci in the nucleus. (K) Same neuron viewed by confocal microscopy with DAPI shown in blue fluorescence. (L) Quantification of fluorescence intensity over CA1 region in mice of different genotypes hybridized with the Arc probe. One-way ANOVA [F(2, 6) = 19.83, p = 0.0023]; pairwise comparisons by Holm-Sidak multiple comparisons test: WT vs. Hemi, t = 3.7, p < 0.05; WT vs. Homo, t = 6.3, p < 0.01; Hemi vs. Homo, t = 2.6, p < 0.05 Calibration bar in (A) = 500 μm and applies to (A–C). Calibration bar in (D) = 100 μm and applies to (D–F). Scale bar in (I) = 50 μm and applies to (G–I).
Quantitative PCR to determine transgene copy number in different genotypes (Figure 2B)
Four WT, 4 hemizygous and 8 homozygous mice were used for PCR. Data were analyzed by one-way ANOVA comparing groups.
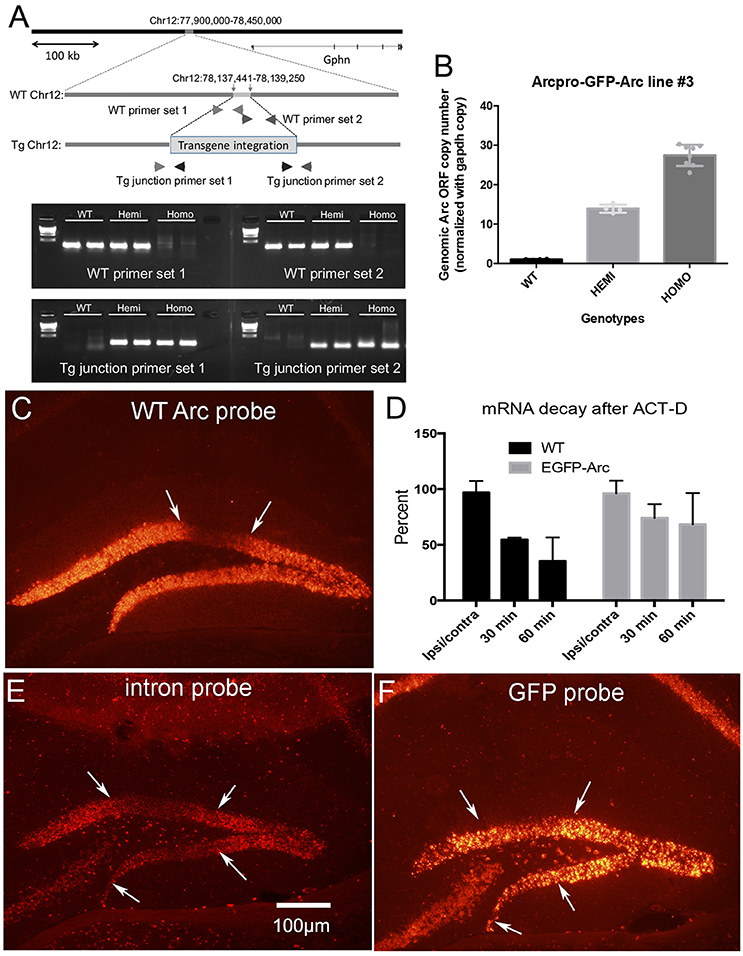
Figure 2. Transgene characterization and assessment of degradation of Arc vs. EGFP-Arc mRNA following infusion of Act-D into the dentate gyrus. (A) Schematic diagram illustrating the genomic integration site of the EGFP-Arc transgene at Chromosome 12 of the mouse genome. The most upper panel represents a 550 kb region of mouse Chr12 around the integration site (78,137,4411–78,139,250), showing that the insertion point is 87.4 kb upstream of the nearest gene, Gephyrin (Gphn: 78,226,655–78,684,769). Representative agarose gel patterns at the bottom show PCR-based confirmation of the transgene integration. Locations of the primers are shown in the schematic genomic structures in the middle. (B) Quantification of the copy number of the transgene. The copy numbers of Arc ORF sequences were estimated in WT, hemizygous, and homozygous mice using qPCR. In (C–F) Arc transcription was induced by ECS and about 45 min post ECS, Act-D was infused via micropipette positioned in the dentate gyrus. (C) Arc mRNA levels in wildtype (WT) mice 1 h post-Act-D as revealed by FISH; Act-D injection site is between the white arrows. (D) Quantitative assessment of decreases in mRNA levels over time in WT and EGFP-Arc transgenic mice. Bars illustrate average fluorescence intensity in the area of the injection as a percent of surrounding areas outside the region of blockade (n = 3 mice per time point except for 30 min WT and 60 min EGFP-Arc where n = 2). (E) Pattern of labeling for Arc mRNA intron probe in EGFP-Arc mouse 1 h. post-Act-D. Note absence of labeling in the area of the Act-D injection site between the white arrows. (F) Near-adjacent section from the same mouse shown in (C) hybridized with the probe for GFP. Note preservation of labeling in the area between the white arrows indicating abrogation of EGFP-Arc mRNA decay. Scale bar = 100 μm.
Assessment of mRNA rundown after actinomycin-D infusion in vivo (Figure 2D)
The ratio of fluorescence intensity over the granule cell layer of the dentate gyrus in the area of actinomycin-D infusion vs. the contralateral side of the same section was determined in WT vs. homozygous EGFP-Arc mice (n = 4 of each genotype without ACT-D infusion, n = 2 WT female mice and 4 EGFP-Arc male mice at 30 min and n = 3 male mice of each genotype at 60 min). Data were analyzed by two-way ANOVA comparing groups vs. time post-ACT-D.
Counts of fluorescent puncta in dendritic laminae after ECS (Figure 3E)
Fluorescent puncta were quantified in the molecular layer following ECS in WT vs. EGFP-Arc transgenic mice (n = 3 mice per group) at 3 locations (outer, middle, and inner molecular layer). Data were analyzed by two-way ANOVA comparing groups and layers.
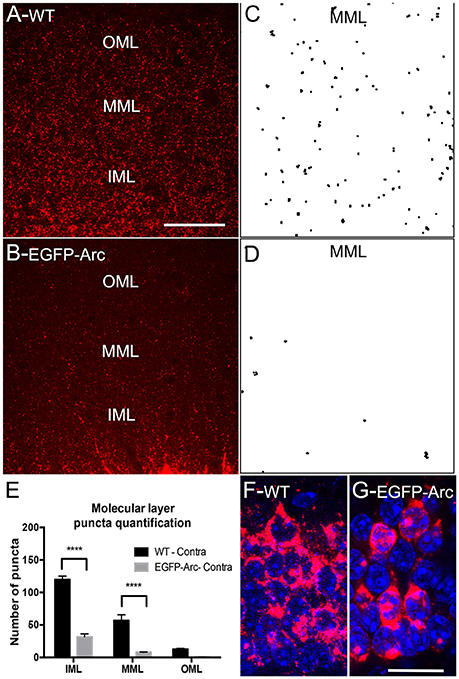
Figure 3. Deficient/delayed dendritic transport of EGFP-Arc mRNA after induction by ECS. (A) Arc mRNA distribution as revealed by FISH following ECS. Note punctate labeling in the dendritic lamina. IML, MML, and OML indicate inner, middle and outer molecular layer, respectively. (B) EGFP-Arc mRNA distribution in the same case as revealed by FISH for GFP mRNA. Note the absence of punctate labeling in the dendritic lamina. (C) Collapsed confocal stacks illustrating individual Arc mRNA fluorescent puncta from FISH preparations in the middle molecular layer (dendritic laminae of the dentate gyrus). (D) Confocal stacks of EGFP-Arc mRNA. (E) Counts of Arc and EGFP-Arc mRNA puncta from the inner, middle, and outer molecular layer (IML, MML, and OML, respectively N = 3 mice per group at 90–120 min post ECS). Asterisks indicate p < 0.0004. (F) Confocal stack illustrating Arc mRNA fluorescence in granule cell bodies of WT mice; nuclei are stained with DAPI-stained nuclei. (G) Confocal stack illustrating EGFP-Arc mRNA fluorescence in granule cell bodies of transgenic mice. Scale bar in (A) =50 μm and applies to (A,B). Scale bar in (G) = 25 μm and applies to (H,G).
Quantification of mRNA levels in home cage controls vs. after exploration of a novel environment (Figure 4E)
Groups were: (1) WT-home cage saline, n = 2 males; (2) WT-EE saline: n = 5 males; (3) EGFP-Arc-home cage, n = 4 males; (4) EGFP-Arc-EE n = 5 males. Data on fluorescence intensity over the CA1 pyramidal cell layer were analyzed separately for WT and EGFP-Arc by t-test.
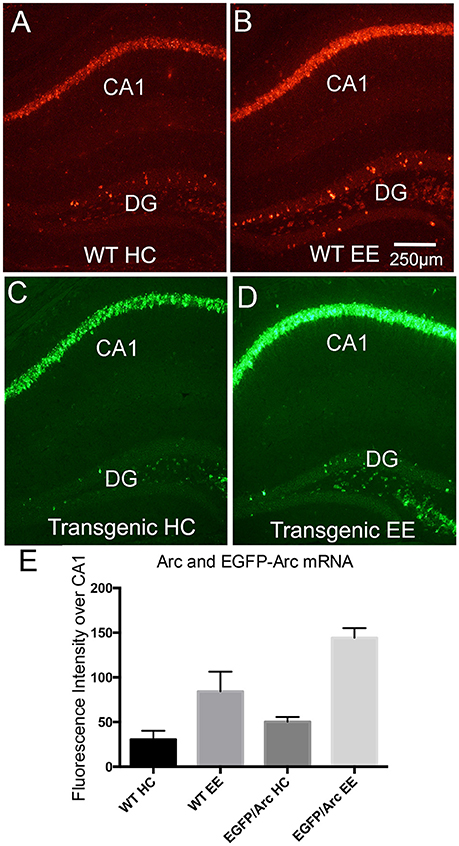
Figure 4. Induction of Arc and EGFP-Arc mRNAs by exploration of a novel environment. (A) Fluorescence in situ hybridization (FISH) for Arc mRNA in a WT mouse that was anesthetized immediately after being removed from its home cage (WT HC). (B) FISH labeling for Arc mRNA in a WT mouse that was allowed to explore a novel enriched environment for 1 h (WT EE). (C) FISH for EGFP-Arc mRNA (FITC detection) in an EGFP-Arc hemizygous mouse that was anesthetized immediately after being removed from its home cage (Transgenic HC). (D) FISH for EGFP-Arc mRNA (FITC detection) in an EGFP-Arc hemizygous mouse that was allowed to explore a novel enriched environment for 1 h (Transgenic EE). (E) Quantification of Arc and EGFP-Arc mRNAs as a result of experience. Sections from all mice were hybridized at the same time for either Arc or GFP mRNA, and levels of fluorescence over the pyramidal cell layer of CA1 were quantified (as in Figure 1L). Scale bar in (B) = 250 μm.
Quantification of Western blot (Figure 5H)
Samples from EGFP-Arc tg/tg (n = 4 females and 1 male) and WT controls (n = 3 females and 1 male) were run on the same Western blot and fluorescence signal intensity in Arc and Arc-GFP bands was normalized to the beta actin loading control. Data were analyzed by one-way ANOVA.
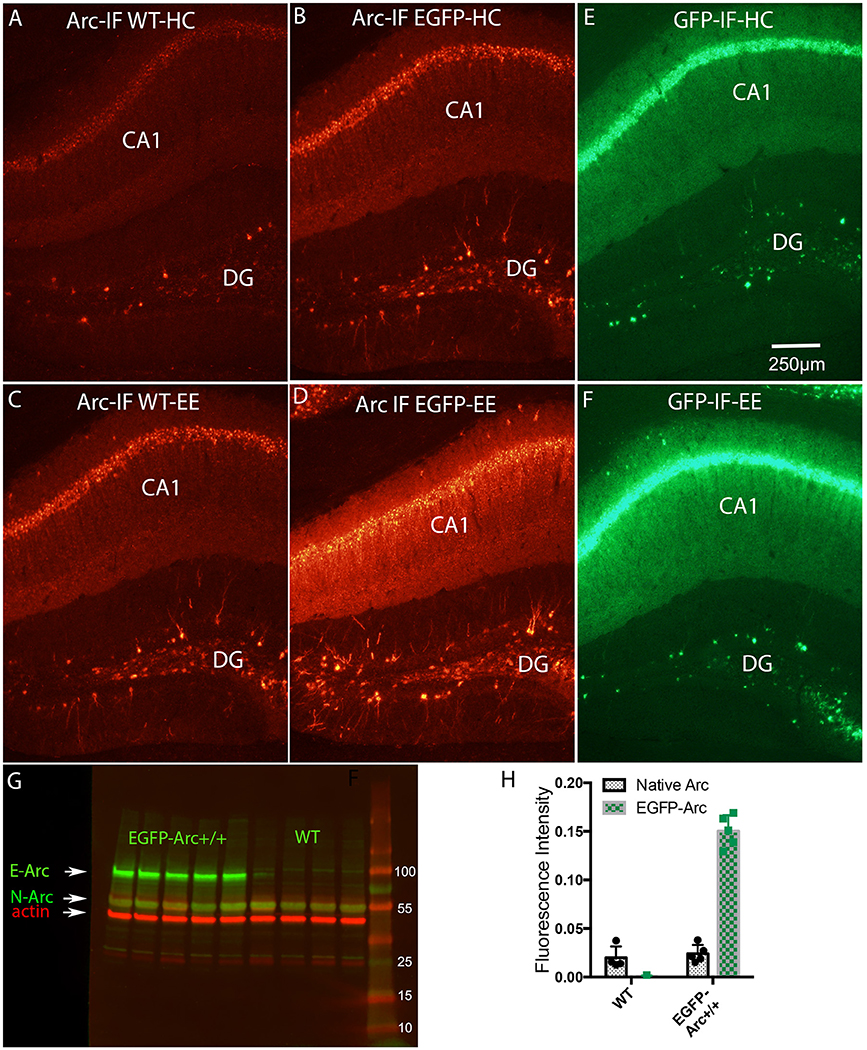
Figure 5. Induction of expression of Arc and EGFP-Arc mRNAs by exploration of a novel environment is accompanied by increased expression of Arc and EGFP-Arc proteins. (A) Immunofluorescence for Arc protein in a WT mouse that was anesthetized immediately after being removed from its home cage (Arc-IF WT-HC). (B) Immunofluorescence for Arc protein in an EGFP-Arc transgenic mouse that was that was anesthetized immediately after being removed from its home cage (Arc-IF EGFP-HC). Note higher levels of labeling for Arc protein in the EGFP-Arc transgenic mouse (Arc-IF EGFP-HC). (C) Immunofluorescence for Arc protein in a WT mouse that was allowed to explore a novel enriched environment for 1 h (Arc-IF WT-EE). Note substantial induction Arc protein expression. (D) Immunofluorescence for Arc protein in an EGFP-Arc transgenic mouse that was allowed to explore a novel enriched environment for 1 h (Arc-IF EGFP-EE). (E) Immunofluorescence for GFP in an EGFP transgenic mouse that was that was anesthetized immediately after being removed from its home cage (GFP-IF-HC). (F) Immunofluorescence for GFP in an EGFP-Arc transgenic mouse that was allowed to explore a novel enriched environment for 1 h (GFP-IF-EE). (G) Western Blot analysis of Arc protein in WT (n = 4 mice) and EGFP-Arc transgenic mice (n = 5). Green fluorescence: Arc protein ß-actin: red fluorescence. E-ARC: band of fluorescence for EGFP-Arc in the transgenic. N-Arc: band of fluorescence for endogenous Arc protein. (H) Quantification of the levels of fluorescence in the N-Arc and E-Arc bands (two-way ANOVA, p < 0.0001). Scale bar in (E) = 250 μm.
Neurophysiology (Figures 6, 7)
As noted in the Results, localization of Arc at activated synapses in the ECS-ECStim paradigm, which is highly reliable in rats, occurs less reliably in mice. Accordingly, data on Arc mRNA distribution across the molecular layer are quantified for individual mice, but are not analyzed statistically.
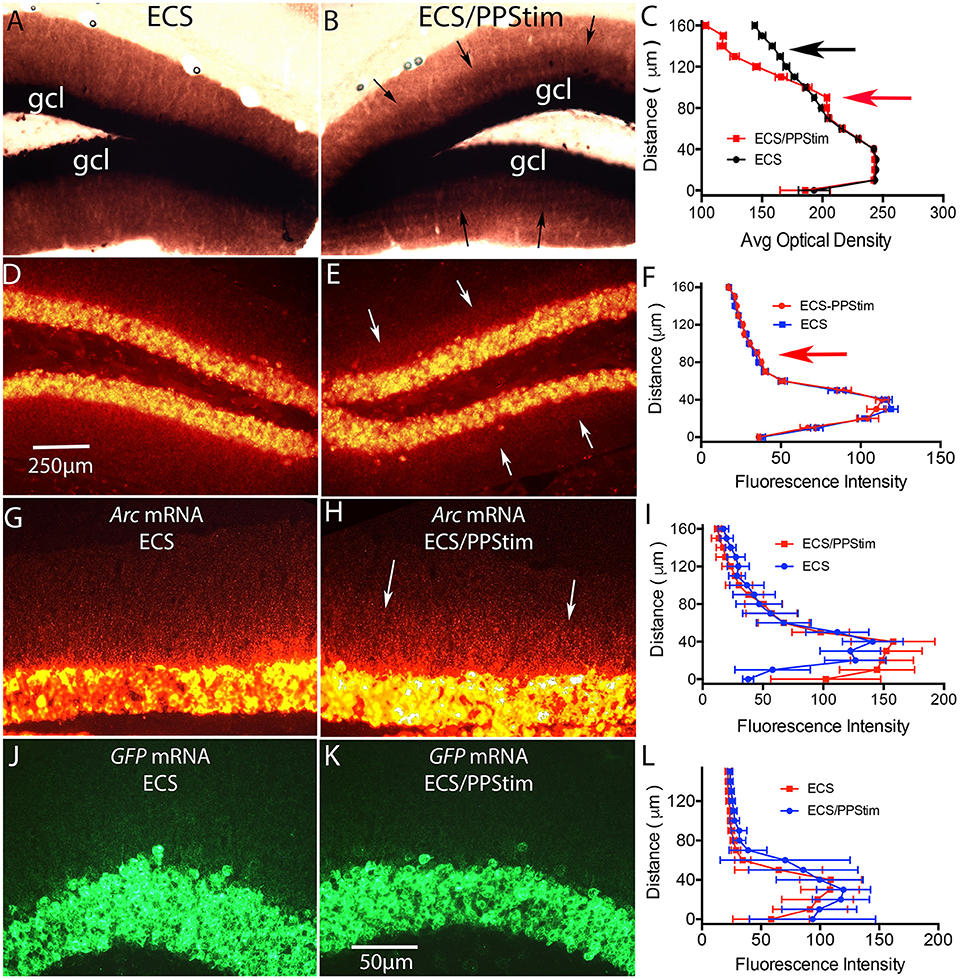
Figure 6. Assessment of localization of Arc and EGFP-Arc mRNA at active synapses: ECS-Perforant Path stimulation paradigm (termed ECS/PPStim). Mice received a single ECS to induce Arc time is allowed for the mRNA to move throughout dendrites (1 h), then high frequency stimulation (HFS) is delivered to the perforant path, which causes newly-synthesized Arc mRNA to localize selectively in the activated dendritic lamina (Steward and Worley, 2001). Accumulation of Arc mRNA in the activated dendritic lamina is accompanied by disappearance from non-activated portions of the dendrite leading to a selective band of labeling in the activated lamina. (A) Chromogen-based ISH for Arc mRNA after ECS; WT C57Bl/6 mouse. (B) Distinctive laminar pattern of labeling on the side that received perforant path stimulation. Arrows indicate the distinctive boundary between the activated lamina and the outer molecular layer. (C) Quantification of optical density (OD) across the granule cell layer (GCL) and dendritic laminae. The red arrow indicates the higher level of labeling in the activated zone; the black arrow indicates the outer molecular layer where levels of labeling are decreased on the stimulated side. (D) FISH for Arc mRNA after ECS in WT mouse. (E) Distinctive laminar pattern of labeling on the side that received perforant path stimulation. Arrows indicate the boundary between the activated lamina and the outer molecular layer. (F) Quantification of fluorescence intensity across the granule cell layer (GCL) and dendritic laminae. (G) Arc mRNA distribution in a tg/tg transgenic mouse after ECS as revealed by FISH for Arc mRNA. (H) Arc mRNA distribution on the side that received perforant path stimulation (PPStim). (I) Quantification of fluorescence intensity across the granule cell layer and dendritic laminae from panels (G,H). (J,K) EGFP-Arc mRNA distribution in the same EGFP-Arc transgenic mouse after ECS as revealed by FISH for GFP mRNA. (L) Quantification of fluorescence intensity across the granule cell layer and dendritic laminae from panels (J,K). Scale bar in (D) = 250 μm and applies to (A,B,D,E). Scale bar in (K) = 50 μm and applies to (G,H,J,K).
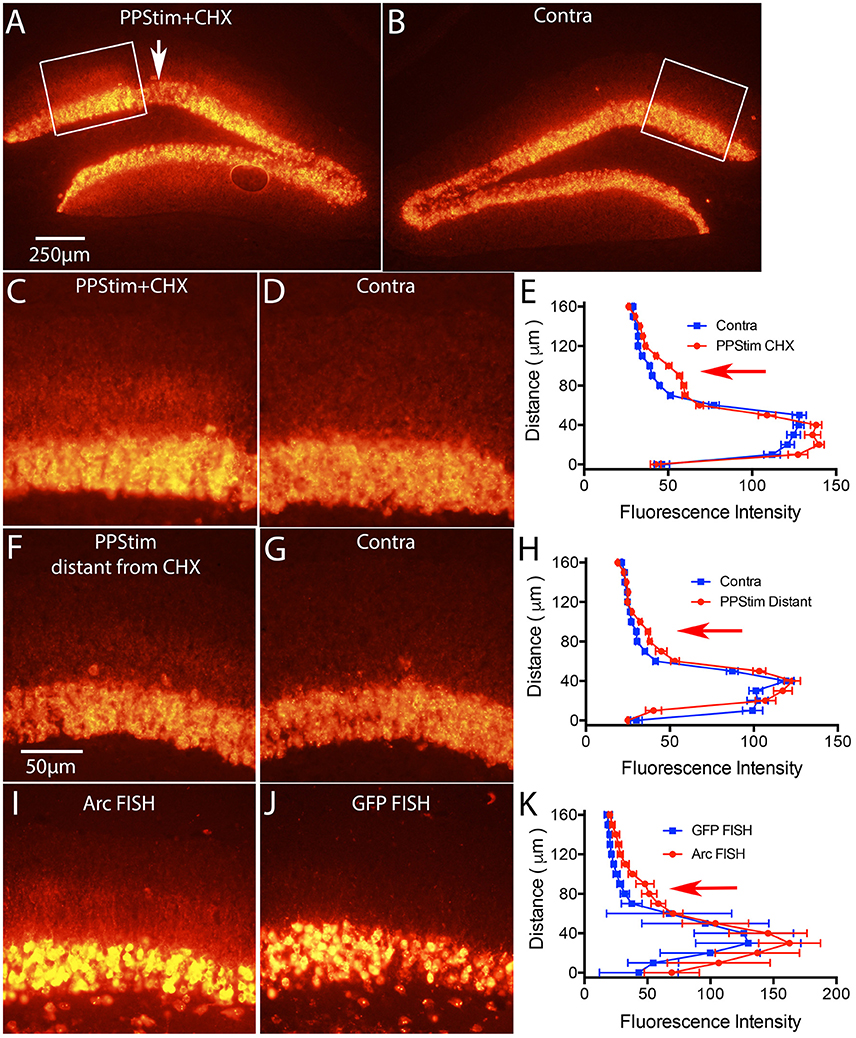
Figure 7. Local infusion of CHX leads to increases in Arc mRNA levels in the area of protein synthesis blockade, consistent with translation-dependent mRNA decay. Mice received a single ECS to induce Arc and 1 h later were prepared for neurophysiology with a recording micropipette filled with CHX. Then high frequency stimulation (HFS) was delivered to the perforant path. (A) Arc mRNA distribution as revealed by FISH in the area of CHX infusion with perforant path stimulation (PPStim). Arrow indicates path of CHX-containing micropipette. (B) Arc mRNA distribution on the contralateral side (ECS only). White boxes indicate the areas illustrated in (C,D). (C,D) Higher magnification views of Arc mRNA distribution across the cell layer and dendritic layers in the area of CHX infusion and on the contralateral side of the same section. (E) Graph of fluorescence intensity across the cell layers and dendritic layers from images in (C,D). Red arrow indicates the band of Arc mRNA in the activated dendritic lamina. (F,G) Arc mRNA distribution across the cell layer and dendritic layers in a section distant from area of CHX infusion and on the contralateral side of the same section. (H) Graph of fluorescence intensity across the cell layers and dendritic layers from images in (F,G). (I,J) illustrate the distribution of Arc mRNA and GFP mRNA, respectively from an experiment in which mice received a single ECS to induce Arc and were prepared for neurophysiology immediately with a recording micropipette filled with CHX. Then high frequency stimulation (HFS) was delivered to the perforant path. Note accumulation of Arc mRNA in the activated lamina in (I) and the absence of GFP mRNA in dendrites in (J). (K) Graph of fluorescence intensity across the cell layers and dendritic layers from images in (I,J). Scale bar in (A) = 250 μm and applies to (A,B). Scale bar in (F) = 50 μm and applies to (C,D), (F,G), and (I,J).
Quantification of mRNA levels in home cage controls vs. after 1 h exploration of a novel environment with and without CHX treatment (Figures 8M,N)
Groups were: (1) WT-home cage saline, n = 2 males; (2) WT-home cage CHX, n = 4 males, (3) WT-EE saline: n = 5 males; (4) WT-EE CHX: n = 3 males, 2 females; (5) EGFP-Arc-home cage saline, n = 4 males; (6) EGFP-Arc-home cage CHX, n = 4 males; (7) EGFP-Arc-EE saline n = 5 males; (8) EGFP-Arc-EE CHX n = 5 males. Data on fluorescence intensity over the CA1 pyramidal cell layer were analyzed by two-way ANOVA comparing treatment (saline vs. CHX) and experience (home cage vs. EE). Data from saline-treated control mice are from Figure 4.
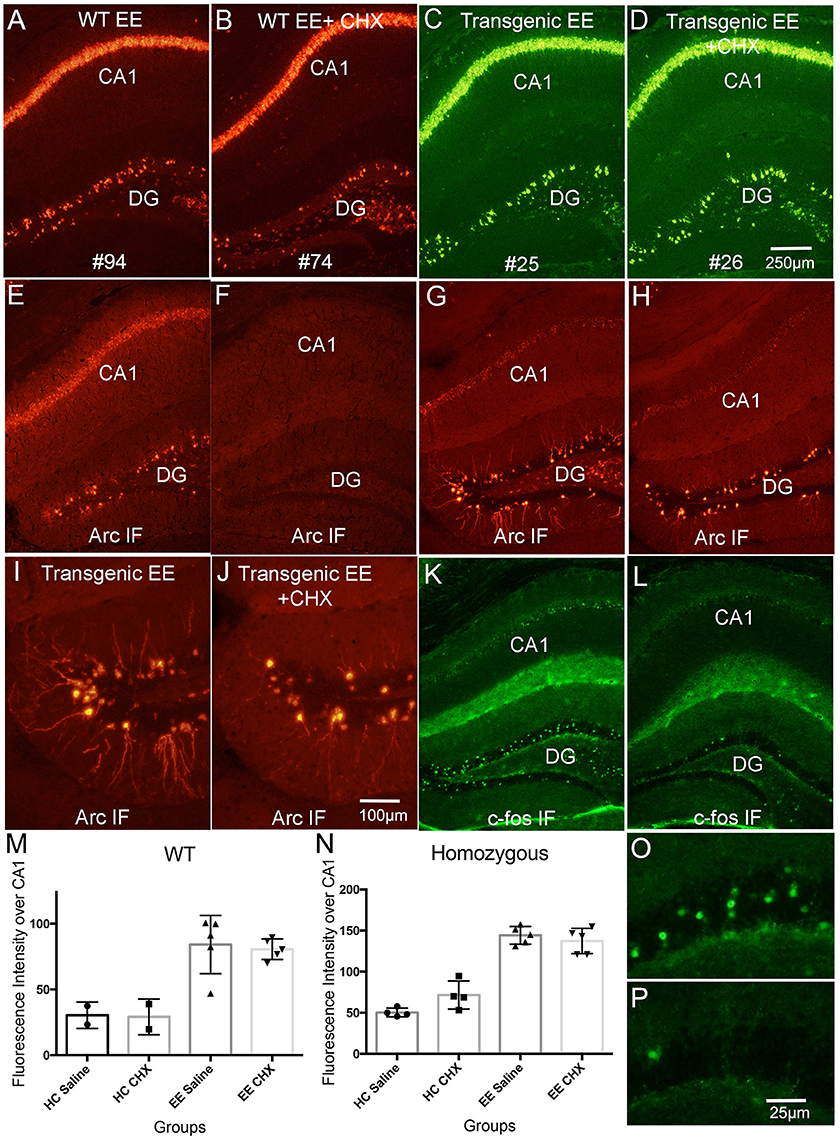
Figure 8. Systemic delivery of CHX does not lead to increases in Arc mRNA in awake behaving mice. WT and Transgenic mice were allowed to explore a novel enriched environment with and without CHX treatment to inhibit protein synthesis. (A) Fluorescence in situ hybridization (FISH) for Arc mRNA in a WT mouse that received saline (WT EE). (B) Fluorescence in situ hybridization (FISH) for Arc mRNA in a WT mouse that received CHX (WT EE+CHX). (C) Fluorescence in situ hybridization (FISH) for Arc mRNA for EGFP-Arc mRNA (FITC detection) in a tg/tg transgenic mouse that received saline (Transgenic EE). (D) Fluorescence in situ hybridization (FISH) for Arc mRNA (FITC detection) in a tg/tg transgenic mouse that received CHX (Transgenic EE+CHX). (E,F) Immunofluorescence for Arc protein in the WT mice illustrated in (A,B). Note absence of Arc IF in the WT mouse treated with CHX (F). (G,H) Immunofluorescence for Arc protein in the tg/tg transgenic mice illustrated in (C,D). Note persistence of Arc IF in the EGFP-Arc transgenic mouse treated with CHX (H). (I,J) Higher magnification views of Arc positive granule cells in the dentate gyrus from the sections shown in (G,H). Note some decrease in immunofluorescence of dendrites in (J). (K,L) Immunofluorescence for c-Fos protein in the transgenic mice illustrated in (G,H) to confirm rundown of c-Fos protein in transgenic mice after CHX treatment. (M) Quantification of fluorescence intensity for Arc mRNA over CA1 for the different groups of WT mice. (N) Quantification of fluorescence intensity for Arc mRNA over CA1 for the different groups of tg/tg transgenic mice. EGFP-Arc mRNA levels were somewhat elevated in transgenic mice that received CHX vs. saline and were returned to their home cage, but differences were not statistically significant (t = 2.71, df = 6, p = 0.412). (O,P) Higher magnification views of c-Fos positive granule cells in the dentate gyrus from the sections shown in (G,H). Scale bar in (D) = 250 μm and applies to (A–L). Scale bar in (J) = 100 μm and applies to (I,J). Scale bar in P = 25 μm and applies to (O,P).
Results
Total Arc mRNA (EGFP-Arc + Endogenous Arc mRNA) Is Overexpressed in EGFP-Arc Transgenic Mice
Arc is expressed as an immediate early gene (IEG); under resting conditions, mRNA levels are low or non-detectable in most neurons in the cortex and hippocampus, whereas transcription is strongly induced by learning experiences or other events that cause strong synaptic activation. Although Arc is expressed in neurons throughout the forebrain, we focus here on patterns of Arc expression in the hippocampus and dentate gyrus because these illustrate general rules regarding regulation of Arc expression. Figure 1A illustrates fluorescence in situ hybridization (FISH) for Arc mRNA in a WT mouse that was one of the “saline controls” for the study described below involving injections of cycloheximide (CHX); as such, this mouse received an intra-peritoneal (IP) injection of saline and was returned to its home cage for 1 h before being anesthetized. Arc mRNA is detectable in some neurons in the CA1 region of the hippocampus and a few dentate granule cells express Arc at moderate levels. As will be seen below, this extent of expression is somewhat higher than seen in mice that were anesthetized immediately upon removal from their home cage without prior saline injections, reflecting some activation as a result of the handling and IP injection 1 h prior to euthanasia.
To assess whether expression of EGFP-Arc is expressed in a similar way as endogenous Arc, we used hemizygous mice with one allele of EGFP-Arc transgene, and assessed transgene expression using cRNA probes specific for EGFP-Arc mRNA. As illustrated in Figure 1B, the overall pattern of expression in the hippocampus was comparable to endogenous Arc mRNA. If EGFP-Arc mRNA is not subject to the same decay mechanisms as endogenous Arc mRNA, then overall levels of labeling for EGFP-Arc should be higher than for endogenous Arc in WT mice. Consistent with this prediction, when sections from hemizygous mice were also hybridized using the probe for endogenous Arc, which recognizes both Arc and EGFP-Arc mRNAs because the full-length coding sequence of Arc is present in the transgene, levels of labeling were much higher than for endogenous Arc in WT mice (Figure 1C). It is important to note that the images in Figures 1A,C are from sections from WT and hemizygous mice that were processed together in the same in situ hybridization run using the same cRNA probe.
Comparisons of levels of Arc mRNA in WT, hemizygous and homozygous EGFP-Arc mice revealed that levels of labeling for Arc mRNA were higher in homozygous EGFP-Arc than in hemizygous, and both were higher than WT. This can be appreciated by comparing levels of labeling in the CA1 region in WT (Figure 1D), hemizygous (Figure 1E), and homozygous EGFP-Arc mice (Figure 1F). Differences in labeling by genotype were confirmed by measuring fluorescence intensity over the CA1 region in 3 mice per genotype (Figure 1L). One-way ANOVA, revealed overall significance [F(2, 6) = 19.83, p = 0.0023] and pairwise post-hoc comparisons by the Holm-Sidak multiple comparisons test indicated significant differences between all 3 genotypes (for details on statistics, see figure legend). Although elevated levels of EGFP/Arc mRNA are consistent with impaired mRNA decay, it is important to note that overall Arc transcription is also elevated due to the presence of both native and EGFP-Arc and the fact that there are multiple copies of the transgene (see below).
We note here that there is little detectable labeling for EGFP-Arc mRNA in dendritic lamina in CA1 despite high levels of labeling over pyramidal cell bodies. We initially suspected that this might be due to the fact that dendritic labeling is most prominent after Arc is induced by some stimulus. As documented below, however, there is little detectable dendritic labeling for EGFP-Arc mRNA when Arc is massively induced in dentate granule cells by ECS.
Visualization of EGFP-Arc mRNA Transcription Foci
With fluorescence in situ hybridization, mRNAs appear as discrete fluorescent puncta, and active transcription foci appear as distinct spots in neuronal nuclei. For example, transcription foci are evident in neurons in the CA1 region in the image from WT mice in Figure 1D. We noticed that when using a probe specific for EGFP-Arc in hemizygous EGFP-Arc mice, there were single distinct fluorescent foci in the nuclei of many neurons (Figure 1G). This is a higher magnification view of the hilar region of the dentate gyrus in the section shown in Figure 1B. We interpret these foci as transcription sites for EGFP-Arc, and simple face validation of this interpretation is that two foci are evident in nuclei of neurons in sections from tg/tg mice that were hybridized with the probe for EGFP-Arc (not shown, but see next). Interestingly, when sections from hemizygous EGFP-Arc mice were hybridized with the probe for endogenous Arc, which recognizes both EGFP-Arc and endogenous Arc, single fluorescent foci were evident in the nucleus of many neurons (Figure 1H; each arrow points to a neuron with a single focus). In contrast, 2 foci were evident in the nuclei of homozygous EGFP-Arc mice hybridized with the probe for endogenous Arc (Figure 1I; each arrow points to a neuron with two foci).
The fact that there is one large labeled focus in nuclei per allele of the transgene suggests higher levels of labeling of the EGFP-Arc transcription site vs. the two transcription sites for WT Arc. Support for this interpretation comes from the fact that in homozygous transgenic mice, neurons could be seen with two large and two small fluorescent nuclear foci. This can be seen with regular fluorescence microscopy (Figure 1J), but is even more evident by confocal microscopy (Figure 1K). Because the number of large foci varies by genotype, it is highly likely that the two large foci are transcription foci for EGFP-Arc mRNA and the two small foci are transcription foci for WT Arc mRNA.
Four spatially-separate loci are consistent with the fact that whole-genome sequencing in the transgenic line used in this study revealed that the endogenous Arc gene and EGFP-Arc transgene are on different chromosomes; the endogenous Arc gene is present on Chr 15 while the EGFP-Arc transgene is integrated at Chr 12. The exact integration site of the transgene was identified at Chr12:78,137,441 and 78,139,250, resulting in a deletion of 1,808 bp. Analyses with UCSC-Genome Browser and PCR revealed that there are no disrupted genes by the integration of transgene at this site (Figure 2A).
One possible explanation for the higher levels of labeling at EGFP-Arc transcription sites is that multiple copies of the transgene integrate in tandem into the locus. To assess this, we used quantitative PCR to estimate copy number (see section Methods), which revealed that that there are approximately 15 copies of the transgene per locus [Figure 2B, One-way ANOVA F(2, 13) = 233.7, p < 0.0001]. Thus, the higher levels of labeling at the EGFP-Arc transcription foci is most likely due to integration of multiple copies of the transgene. Other contributions cannot be excluded, including: (1) EGFP-Arc may be transcribed at a higher level than endogenous Arc in the same individual nucleus driven by its own 7 kb Arc promoter. (2) EGFP-Arc pre-mRNA does not contain the introns present in endogenous Arc pre-mRNA, and thus may be retained at transcription foci for longer than endogenous Arc that undergoes splicing. (3) The presence of the coding sequence of EGFP in tandem with the coding sequence of Arc may interfere with intra-nuclear processing, causing the EGFP-Arc transcript to be retained near the transcription site. Whatever the explanation, the large foci provide a convenient and reliable means to genotype mice by in situ hybridization.
EGFP-Arc mRNA Is Degraded More Slowly than Endogenous Arc mRNA
To determine the time course of degradation of EGFP-Arc mRNA vs. endogenous Arc mRNA, we assessed rundown of mRNA levels after transcriptional block with Act-D. Arc transcription was induced in homozygous transgenic and WT mice by delivering an electroconvulsive seizure (ECS), mice were prepared for in vivo neurophysiology and a recording micropipette containing Act-D was stereotaxically positioned in the dentate gyrus at approximately 1 h post-ECS. After 30 and 60 min, brains were harvested for FISH.
After a single ECS, Arc transcription is strongly induced in dentate granule cells and transcriptional activation persists for hours. This is evidenced by continued high levels of labeling for Arc mRNA in dentate granule cells. In WT mice, local infusion of Act-D led to progressive decreases in Arc mRNA levels in an area about 300–500 μm in diameter surrounding the micropipette (Figure 2C; area of blockade is between the arrows). To quantify the time course of mRNA decay, we analyzed Arc mRNA fluorescence intensity in the region of Act-D infusion and in the surrounding regions of the dentate gyrus and expressed this as a ratio (2 mice at 30 min and 3 mice at 60 min). At each time point, Arc mRNA levels decreased to about half of the level 30 min prior (Figure 2D). This is consistent with previous determinations of the time course of Arc mRNA decay after Act-D treatment of neurons in culture, which indicate a half life for Arc mRNA of about 45 min (Rao et al., 2006).
When the same experiment was done with homozygous EGFP-Arc mice and sections were hybridized for EGFP mRNA, it was difficult to locate an area of diminished labeling due to Act-D. To define the area of transcriptional blockade, sections from EGFP-Arc mice were hybridized with a probe specific for the intron in endogenous Arc mRNA. As expected, the area of transcriptional blockade was revealed by absence of labeling for the intron probe in an area surrounding the Act-D filled micropipette (Figure 2E). Based on this identification of the region of transcriptional blockade, we hybridized nearby sections (usually adjacent sections) for EGFP mRNA (Figure 2F), and quantified levels of labeling in the area of transcriptional blockade vs. nearby regions (4 mice at 30 min; 3 mice at 60 min). This analysis confirmed delayed rundown of EGFP-Arc mRNA levels with Act-D (Figure 2D, two-way ANOVA Group difference [F(1, 14) = 5.289, p = 0.0374], effect of time [F(1, 14) = 14.12, p = 0.0004]; by 60 min, levels of labeling for EGFP-Arc mRNA remained about 75% of the levels at sites outside the area of blockade.
Impaired Dendritic Delivery of EGFP-Arc mRNA after Induction by Seizures
In our assessment of Arc vs. EGFP-Arc mRNA levels after ECS, it was again evident that levels of labeling in dendrites appeared lower for EGFP-Arc mRNA than for endogenous Arc mRNA (compare Figure 3A: Arc WT with Figure 3B: EGFP-Arc). To assess this, sections were imaged by confocal microscopy in order to resolve individual fluorescent puncta in the dendritic laminae of the dentate gyrus (Figures 3C,D). We then counted the number of puncta in the inner, middle, and outer molecular layer (IML, MML, and OML, respectively n = 3 mice per group at 90–120 min post ECS). Quantitative analyses confirmed that despite strong induction of transcription, there were far fewer dendritic EGFP-Arc mRNA puncta than Arc mRNA puncta in WT mice [Figure 3E, 2-way ANOVA, difference between groups: F(1, 4) = 119.9, p = 0.0004, difference between layers: F(2, 8) = 130.7, p < 0.0001]. These results indicate impaired dendritic delivery of EGFP-Arc mRNA to distal dendritic regions, even when Arc mRNA transcription is strongly induced.
One possible explanation for impaired dendritic delivery is impaired nucleocytoplasmic transport of newly-synthesized EGFP-Arc mRNA. To explore this possibility, we used confocal microscopy to image fluorescence from FISH and nuclei of dentate granule cells stained with DAPI to assess whether newly-synthesized EGFP-Arc mRNA entered the cytoplasm. Confocal images in in WT mice revealed high levels of cytoplasmic labeling for Arc mRNA consistent with efficient nucleocytoplasmic transport (Figure 3F). In transgenic mice, EGFP-Arc mRNA was also clearly present in cytoplasm (Figure 3G). It is noteworthy that Arc mRNA in WT mice is present in discrete granules whereas EGFP-Arc mRNA appears in globs, inviting the speculation that there may be a deficiency in packaging EGFP-Arc mRNA into granules or in granule trafficking.
EGFP-Arc Transcription Is Regulated by Experience in a Manner Similar to Endogenous Arc
Arc mRNA transcription is induced by learning experiences, and a simple paradigm to demonstrate this is to allow animals to explore a novel toy-filled enriched environment (EE), which in WT mice is accompanied by robust induction of Arc transcription (Farris et al., 2014). Figure 4A illustrates fluorescence in situ hybridization for Arc mRNA in a WT mouse that was anesthetized immediately after being removed from its home cage and Figure 4B illustrates the labeling for Arc in a WT mouse that was allowed to explore a novel environment for 1 h. As previously described in rats (Farris et al., 2014), this learning experience led to increases in Arc mRNA levels in neurons in the CA1 region of the hippocampus, and increases in the number of Arc-positive dentate granule cells. For quantitative analyses, fluorescence levels were quantified over the pyramidal cell layer of CA1 as in Figure 1L (Figure 4E). Endogenous Arc mRNA levels were about 3-fold higher after 1 h of exploration (n = 2HC, 5EE, t = 3.169, p = 0.0248). EGFP-Arc mRNA was expressed with similar dynamics; Figure 4C illustrates the pattern of expression of EGFP-Arc mRNA in a home cage control hemizygous mouse and Figure 4D illustrates striking increases in EGFP-Arc mRNA levels in a hemizygous mouse that was allowed to explore a novel environment for 1 h. In Figures 4C,D, EGFP-Arc mRNA was detected using FITC, which provides a convenient color code for illustrating EGFP-Arc vs. Arc mRNAs. Levels of fluorescence for EGFP-Arc mRNA as assessed by hybridization using the probe for GFP was elevated to about the same extent as endogenous Arc mRNA (n = 4HC, 5EE, t = 15.78, p < 0.0001).
It should be noted that the “home cage controls” illustrated in Figure 4A were transported in their home cage from the vivarium to the testing room along with the mice that were exposed to the novel environment, which included transport in an elevator, and then the mice were euthanized. Probably because of this experience, levels of labeling are higher over the pyramidal cell layers and there are more Arc-positive granule cells in the mouse illustrated in Figure 4A than in the mouse illustrated in Figure 1A, which was euthanized immediately after removal from its home cage in the vivarium.
Total Arc Protein Levels (Endogenous Arc + EGFP-Arc) Are Elevated in Transgenic Mice and Increase Further as a Result of a Learning Experience
To assess whether differences in levels of expression of Arc and EGFP-Arc mRNAs were paralleled by differences in the levels of the respective proteins, sections were immunostained using antibodies against Arc. In WT mice, immunofluorescence for Arc protein in home cage controls revealed patterns of expression that were similar to what has been described in previous studies (Figure 5A). Levels of labeling were low over the cell body laminae of the hippocampus. Most dentate granule cells were unstained, but there were a few labeled granule cells scattered through the granule cell layer, especially in the dorsal blade. As noted above, EGFP-Arc protein contains the full Arc sequence, so antibodies against Arc also recognize EGFP-Arc protein, so immunofluorescence indicates expression of total Arc protein (endogenous Arc + EGFP-Arc). As with the mRNAs, levels of expression of Arc and EGFP-Arc proteins were much higher under basal (home cage) conditions in EGFP-Arc transgenic mice (Figure 5B). Especially noteworthy was the high level of immunofluorescence throughout the dendritic laminae of CA1 and prominent staining of dendrites of dentate granule cells.
In WT mice, 1 h of exploration in an enriched environment led to robust increases in Arc immunofluorescence in hippocampal subfields, especially in CA1, and increases in the number of Arc-positive granule cells (Compare Figure 5C with Figure 5A). There was also strong induction of expression of total Arc protein (endogenous Arc + EGFP-Arc) in transgenic mice (Compare Figure 5D with Figure 5B). It was noteworthy that by the end of the 1 h in the enriched environment, total Arc protein levels increased in both cell bodies and throughout dendrites. This was especially evident in CA1, where increases in immunofluorescence were seen even in the zone containing the most distal dendrites of CA1 pyramidal cells (stratum oriens and stratum lacunosum-moleculare).
Sections from the same transgenic mice were also immunostained using the antibody for GFP so as to detect the level and distribution of EGFP-Arc protein only. Overall, patterns of labeling for EGFP mirrored the patterns for total Arc protein; especially noteworthy was that levels of immunofluorescence for GFP were high over the dendritic laminae of the hippocampus under resting conditions (Figure 5E) and increased further after 1 h in the enriched environment (Figure 5F).
In order to estimate the extent to which total Arc protein was elevated in EGFP-Arc transgenic mice, cortical tissue from WT (n = 4) and homozygous transgenic (n = 5) mice was prepared for Western Blot analysis using an antibody against Arc (green fluorescence in Figure 5G) and an antibody against ß-actin as a loading control (red fluorescence). A band of fluorescence for endogenous Arc protein (N-Arc) is evident at around 50 kDa and a band of fluorescence for EGFP-Arc is evident at approximately 90 kDa in the transgenic mice, consistent with the predicted MW of the EGFP-Arc fusion protein (EGFP 32.7 kDa + Arc 55 kDa = 87.7 kDa). Quantification of the levels of fluorescence in the bands revealed that average levels of endogenous Arc were comparable in WT vs. EGFP-Arc +/+ mice, whereas levels of fluorescence for EGFP-Arc were about 7.6-fold higher than endogenous Arc. Thus, total Arc (endogenous + EGFP-Arc protein) is about 9-fold higher in the transgenic mice (two way ANOVA, p < 0.0001).
High basal levels of EGFP-Arc expression could reflect enhanced transcription, but this could occlude activity-dependent transcriptional activation; however, levels of EGFP-Arc mRNA were robustly elevated as a result of experience in the novel environment. The fact that transcription of EGFP-Arc mRNA in transgenic mice can be activated in a manner similar to endogenous Arc indicates that transcriptional activity is not saturated. Moreover, as we show below, EGFP-Arc protein is also not degraded as quickly as endogenous Arc, contributing to the net overexpression in the transgenic mice.
Assessing Activity- and Protein Synthesis-Dependence of Arc mRNA Degradation
We previously characterized activity- and protein synthesis-dependent Arc mRNA degradation in physiological experiments in rats (Farris et al., 2014). For this, we used the ECS-Perforant Path stimulation paradigm in which Arc is induced by an electroconvulsive seizure (ECS) and time is allowed for the mRNA to move throughout dendrites (1 h). In the absence of synaptic stimulation, Arc mRNA levels are high throughout the dendritic lamina (molecular layer) of the dentate gyrus. Following high frequency synaptic stimulation (HFS) of the perforant path, Arc mRNA localizes selectively in the activated dendritic lamina (Steward and Worley, 2001) and is depleted from non-activated portions of the dendrite due to activity-driven protein synthesis-dependent mRNA degradation (Farris et al., 2014).
Figures 6A–C illustrate these phenomena in WT mice using chromogen-based in situ hybridization. Following ECS, Arc mRNA is delivered throughout dendrites (Figure 6A). Perforant path stimulation then produced a distinct laminar pattern of labeling with higher levels of labeling in the zone of termination of the medial perforant path and lower levels of labeling in the outer molecular layer; arrows in Figure 6B indicate a distinct boundary between the two zones. Figure 6C illustrates a quantitative analysis of optical density (OD) across the granule cell layer and molecular layer with ECS only vs. ECS/PPStim.
A similar laminar pattern of labeling could be seen when WT mice were subjected to the ECS/PPStim paradigm and Arc mRNA levels were assessed by FISH. For example, Figure 6E illustrates the pattern of labeling for Arc mRNA in a WT mouse after ECS and 1 h of PPStim. However, the phenomenon was not seen as reliably in mice as in previous studies involving rats. For example, a distinct laminar pattern such as shown in Figure 6E was evident in 8/12 experiments in WT mice, whereas we observe striking lamination in every experiment in rats. This may be due to differences in the physiology of perforant path synapses in mice. For example, perforant path LTP itself is less reliable in mice than in rats (Steward et al., 2007). Also, although Arc mRNA transcription is strongly induced by ECS in WT mice, high frequency stimulation (HFS) of the perforant path alone typically does not strongly activate Arc transcription in large numbers of dentate granule cells (Steward et al., 2007).
In our previous study (Farris et al., 2014) the ECS-Perforant Path stimulation paradigm provided strong evidence for activity- and translation-dependent Arc mRNA degradation. If this degradation depends on splicing, it should not occur for EGFP-Arc mRNA. We tested this in a total of 7 EGFP-Arc mice that received ECS followed by HFS of the perforant path. When sections from EGFP-Arc mice were hybridized for Arc mRNA, Arc mRNA was present in a gradient in dendrites on the ECS only side (Figure 6G) and the laminar pattern of labeling was seen in some mice (Figure 6H), although quantitative assessments revealed that the effect was modest (Figure 6I). In contrast, hybridization with the probe for EGFP mRNA revealed intense labeling in cell bodies but very little labeling in the dendritic lamina on either the ECS only side (Figure 6J) or ECS-PPStim side (Figure 6K; and for quantification, see Figure 6L). Thus, the impairment of dendritic delivery of EGFP-Arc mRNA seen with ECS alone is also evident with ECS-PPStim. Because EGFP-Arc mRNA does not traffic out to dendrites in the time frame of the experiment, no inference can be drawn from the ECS-PPStim experiment in the Arc-EGFP +/+ mice about whether EGFP-Arc mRNA in dendrites is subject to activity-driven decay.
Translation-Dependence of Arc mRNA Degradation
In our previous study in rats, we showed that activity-driven Arc mRNA degradation is abrogated in the presence of protein synthesis inhibitors, consistent with an NMD-like process (Farris et al., 2014). The first test was to locally-infuse cycloheximide (CHX) via a recording microelectrode during the stimulation phase of the ECS/PPStim paradigm. As predicted by the hypothesis that Arc mRNA degradation is via NMD, Arc mRNA levels were increased in the area of protein synthesis blockade. Although the largest percent increase was in the activated dendritic lamina, increases were also seen in the cell body lamina, so this experiment is not compromised by the fact that delivery of EGFP-Arc mRNA is impaired.
We used the same paradigm in mice and found similar results for endogenous Arc mRNA. Figures 7A,C illustrate Arc mRNA levels in the area of CHX infusion in a WT mouse; Figures 7B,D illustrate the contralateral side of the same section (ECS only); and Figures 7F,G illustrate Arc mRNA levels on the stimulated side in areas distant from the CHX infusion. The graphs in Figures 7E,H plot fluorescence intensity across the cell body and molecular layers. As previously documented in rats (Farris et al., 2014) Arc mRNA levels were elevated in the area of CHX blockade that extends for a diameter of about 1mm around the infusion site, especially in the activated dendritic lamina. Note that labeling is decreased in an area about 150 μm in diameter at the center of the infusion due to damage produced by the micropipette.
To test whether EGFP-Arc mRNA levels would also increase with CHX blockade, we carried out the same experiment as above in EGFP-Arc transgenic mice with one variation; rather than waiting 1 h after ECS before preparing mice for neurophysiology, we induced ECS and then immediately prepared mice for neurophysiology placing the CHX-filled micropipette as soon as possible. The time from ECS to placement of the CHX-filled micropipette was about 15min. Then we delivered HFS to the perforant path for 1 h. The rationale was to prevent translation of newly-transcribed Arc mRNA, which would prevent any translation dependent degradation. As illustrated in Figure 7I, hybridization with the probe for Arc mRNA revealed dendritic labeling with localization in the activated lamina (Figure 7I). However, hybridization of nearby sections with the probe for GFP mRNA revealed induction of expression due to ECS, but no labeling in the dendritic lamina (Figure 7J). It's important to reiterate that the probe for Arc mRNA recognizes both endogenous Arc and EGFP-Arc mRNAs. Because EGFP-Arc mRNA did not move into dendrites (Figure 7J) the labeling in the dendritic lamina with probes for Arc mRNA must reflect endogenous Arc mRNA.
The fact that dendritic delivery of EGFP-Arc mRNA is impaired even when translation of newly-transcribed mRNA is blocked (Figure 7J) is strong evidence against the possibility that dendritic delivery is impeded because of translation of the EGFP-Arc fusion protein per se. This points to the interpretation that deficient delivery is related to the fact that EGFP-Arc mRNA is not spliced and thus would not retain EJC proteins that otherwise might facilitate the shuttling of an EGFP-Arc mRNA complex out of the nucleus into the cytoplasm. A much less likely possibility that we cannot fully exclude is that dendritic delivery is impeded because of some sequestration signal in the GFP coding sequence that causes the mRNA to be largely retained in the cell body, thus over-riding the dendritic transport signal(s) that would otherwise mediate dendritic delivery of endogenous Arc mRNA.
Inhibition of Protein Synthesis in Awake-Behaving Mice Does Not Lead to Increases in Arc mRNA Levels
The second way we tested protein synthesis-dependence of Arc mRNA in Farris et al. (2014) was to block protein synthesis during a learning experience (1 h exploration of a novel toy-filled environment). As predicted by translation-dependent decay, Arc mRNA levels were higher in rats treated with CHX in both the home cage and EE condition. Increases were qualitatively evident over both cell body and dendritic laminae of the hippocampus.
Here, we used the same basic approach in WT and EGFP-Arc transgenic mice. Mice were gently removed from their home cage and received injections of either CHX or saline, and were then either immediately returned to their home cage for 1 h, or were allowed to explore a novel environment for 1 h.
To our surprise, and in striking contrast to what we documented in rats, CHX did not lead to increased Arc mRNA levels in WT mice in either the home cage or after exploration of the novel environment (EE in figure panels). Arc mRNA levels are not noticeably higher in the mouse that received CHX (Compare Figure 8A, control, with Figure 8B, CHX); this is confirmed by quantitative analysis of fluorescence intensity over the CA1 pyramidal layer (Figure 8M; values for saline-treated HC and EE mice are the same as shown in Figure 1L. Values for individuals are shown along with bar graphs to indicate numbers of animals per condition). Although Arc mRNA levels were induced in WT mice that explored the novel environment [two-way ANOVA for home cage vs. EE: F(1, 10) = 31.76, p = 0.0002], there were no differences between mice that received saline vs. CHX [two-way ANOVA: F(1, 10) = 0.064, p = 0.805]. Arc mRNA levels were also comparable with and without CHX in the home cage (HC) group (Figure 8M). Similar results were seen in homozygous EGFP-Arc transgenic mice [Figure 8N, two-way ANOVA for home cage vs. EE: F(1, 14) = 166.3, p < 0.0001], with no differences between saline vs. CHX groups [two-way ANOVA: F(1, 14) = 1.333, p = 0.2676].
In our previous study (Farris et al., 2014), differences in Arc mRNA levels were qualitatively evident over both cell body and dendritic laminae but the quantitative analyses assessed the number of Arc mRNA puncta in the dendritic layer. Accordingly, we wondered whether we were missing an effect by measuring fluorescence intensity over the cell body lamina. Thus, we analyzed the number of Arc mRNA puncta per unit area of stratum radiatum in WT-EE mice using confocal stacks as in Figure 3. Again, there were the expected differences in Arc mRNA puncta between HC and EE groups, but no differences with and without CHX. Puncta counts were: WT-HC saline-535 ± 91, WT-HC CHX-587 ± 31, WT-EE saline-1559 ± 515, WT-EE CHX-1490 ± 693.
Given the absence of an effect of CHX in WT mice, it is not surprising that blockade of protein synthesis also did not lead to increases in EGFP-Arc mRNA levels in homozygous EGFP-Arc transgenic mice that were allowed to explore the enriched environment. Figures 8C,D illustrate levels of EGFP-Arc mRNA following hybridization with probes for GFP (see Figure 8N for quantification). EGFP-Arc mRNA levels were somewhat elevated in homozygous EGFP-Arc transgenic mice that received CHX and were returned to their home cage (Figure 8N), but differences were not statistically significant (t = 2.71, df = 6, p = 0.412).
Persistence of EGFP-Arc Protein Following CHX-Treatment
In WT mice, blockade of protein synthesis with CHX prevents the increases in Arc protein that are otherwise seen with exploration of an enriched environment and also leads to loss of immunostaining, so that the Arc-positive dentate granule cells that are normally present are no longer evident (Compare Figure 8E, saline with Figure 8F, CHX-treated). This run-down of Arc protein is a convenient way to confirm the effectiveness of CHX treatment. Surprisingly, EGFP-Arc protein did not run down with CHX treatment in the same way as endogenous Arc. In EGFP-Arc transgenic mice, although CHX treatment did block the increases in immunostaining that otherwise occur after exploration of a novel environment, this did not lead to the complete disappearance of Arc-positive neurons as in wildtype mice (compare Figure 8G with Figure 8H and Figure 8I with Figure 8J). It was noteworthy in the high magnification views in Figures 8I,J that CHX did block the increases in Arc protein in the dendrites of dentate granule cells. This suggests that the appearance of EGFP-Arc protein in dendrites occurs with kinetics similar to that of endogenous Arc protein in the wildtype mice. The relative absence of EGFP-Arc mRNA means that this occurs via a mechanism other than local protein synthesis.
To exclude the possibility that protein degradation machineries were overwhelmed by induced overexpression of EGFP-Arc proteins, we tested whether CHX caused a rundown of other IEG proteins in EGFP-Arc transgenic mice. For this, sections adjacent to those taken from the mice shown in Figures 8G,H were immunostained for c-Fos (Figures 8K,L). There were the expected number of c-Fos positive granule cells in the mouse that received saline before exploration of the novel environment (Figure 8K; higher power views of dentate granule cells are shown in Figure 8O), and only a few c-Fos labeled granule cells were present in the mouse that received CHX (Figures 8L,P). Thus, degradation of endogenous Arc and c-Fos proteins was intact and unaffected 1 h following CHX-treatment whereas EGFP-Arc protein persisted, at least within the cell bodies of the dentate gyrus granule cells. The apparent persistence of EGFP-Arc protein may reflect a quantitative difference (near 8-fold overexpression), a qualitative difference (delayed turnover due to slower local decay kinetics), or both. One possible explanation for the latter is that the presence of EGFP in the EGFP-Arc recombinant protein alters degradation kinetics.
Discussion
The original goal of this study was to test the hypothesis that activity- and translation-dependent degradation of Arc mRNA occurs via NMD, which depends on the presence of EJC protein binding in the 3′UTR. The approach used transgenic mice carrying an EGFP-Arc transgene constructed from Arc cDNA, which lacks two introns in the 3′UTR that are present in the endogenous Arc gene. The canonical signal for NMD is an EJC downstream of a stop codon, so EGFP-Arc mRNA should not be susceptible to NMD. Our findings were consistent with the NMD hypothesis: (1) EGFP-Arc mRNA decayed more slowly following transcriptional blockade than endogenous Arc mRNA indicating impaired mRNA degradation; (2) Local infusion of CHX in the ECS/PPStim paradigm led to increases in endogenous Arc mRNA in the area of protein synthesis blockade, consistent with translation-dependent Arc mRNA degradation.
Our results also revealed an unexpected and striking impairment of dendritic delivery of EGFP-Arc mRNA. This suggests the intriguing possibility that the presence of an intact splice junction and accompanying EJC proteins might provide an additional activity-regulated mechanism to enhance delivery of Arc mRNA into dendrites. In what follows, we discuss the caveats of the experiments and un-expected findings that provide new insights into Arc mRNA dynamics.
Role of Nonsense Mediated Decay (NMD) in Arc mRNA Turnover
Previous studies have documented that Arc mRNA is a canonical candidate for NMD because of the presence of splice junction sites in the 3′UTR downstream of the stop codon (Giorgi et al., 2007). Proteins of the exon junction complex (EJC) remain bound to Arc mRNA as it moves into the cytoplasm and EJC's downstream of a stop codon are the canonical signal for triggering NMD when a translating ribosome reaches the stop codon. In support of the NMD hypothesis, our previous studies in rats (Farris et al., 2014) showed that Arc mRNA degradation is attenuated by protein synthesis inhibitors and accelerated by synaptic stimulation.
The EGFP-Arc transgene was created by inserting a monomeric EGFP cDNA into mouse Arc cDNA with its 5′ and 3′ UTRs under the control of the Arc7000 promoter (pGL4.11-Arc7000-mEGFP-Arc-UTRs). Arc cDNA lacks the introns in the 3′UTR so the transcript never undergoes splicing. If Arc mRNA turnover is via an NMD-like mechanism, then: (1) EGFP-Arc mRNA should be degraded more slowly than endogenous Arc mRNA; (2) Inhibition of protein synthesis should not lead to increases in EGFP-Arc mRNA levels seen with endogenous Arc mRNA (Farris et al., 2014). Our results confirmed the first prediction; assessment of rundown of induced Arc mRNA levels after blockade with the transcription inhibitor actinomycin-D revealed that EGFP-Arc mRNA is degraded more slowly than endogenous Arc mRNA.
The test of the second prediction was compromised for two reasons. First, local infusion of CHX in the ECS/PPStim paradigm did lead to increases in endogenous Arc mRNA in the activated dendritic lamina; however, EGFP-Arc mRNA did not enter dendrites even in the presence of CHX, so it was not possible to asses for increases in dendrites due to protein synthesis inhibition. Second, inhibition of protein synthesis with CHX in awake behaving mice did not lead to increases in endogenous Arc mRNA, so this test of translation-dependence was not relevant in mice. It is unknown why Arc mRNA turnover in mice is less translation-dependent than is the case in rats.
Although the tests of the hypothesis yielded results that were more complicated than expected, the evidence does support the hypothesis that Arc mRNA decay is either regulated by splicing of the 3′UTR (perhaps by EJC proteins that accompany Arc mRNA into the cytoplasm) or that insertion of the coding sequence for EGFP disrupts some signal in the coding region that regulates mRNA decay. Thus, a mechanism with NMD-like characteristics contributes to Arc mRNA degradation, and this mechanism is disrupted in EGFP-Arc transgenic mice, disrupting normal IEG dynamics.
Although our results indicate that the presence of introns plays a role in regulating mRNA decay, EGFP-Arc mRNA is degraded, albeit with a slower time course, indicating that mechanisms other than NMD also contribute. In this regard, it is noteworthy that a recent study reports that the presence of the 3′UTR sequence called the “dendritic targeting element (DTE)” in fusion transcripts also confers destabilizing activity independent of NMD (Ninomiya et al., 2016).
Impaired Dendritic Delivery of Newly-Synthesized EGFP-Arc mRNA
An unexpected discovery was the striking difference in the delivery of endogenous Arc mRNA vs. EGFP-Arc mRNA into dendrites even after massive induction by ECS. This suggests a deficiency in steps leading to dendritic transport of newly-synthesized EGFP-Arc mRNA. Dendritic transport of many mRNAs is thought to depend on sequences in the 3′UTR, but after splicing of endogenous Arc mRNA, the sequence of the UTR would be identical to that of EGFP-Arc mRNA; thus, 3′UTR sequence alone is not sufficient to mediate efficient dendritic transport of EGFP-Arc mRNA. Possible explanations include: (1) Rapid dendritic delivery after induction may depend on one or more EJC proteins that are retained with endogenous Arc mRNA after 3′UTR splicing; (2) Efficient dendritic delivery may be disrupted by the presence of the sequence for EGFP in the coding region.
The fact that EGFP-Arc mRNA is not delivered into dendrites even when translation of newly-transcribed EGFP-Arc mRNA is blocked (Figure 7J) argues against the possibility that dendritic delivery is impeded because of translation of the EGFP-Arc fusion protein. It is also unlikely that dendritic delivery is impeded because the EGFP coding sequence contains some signal that causes the mRNA to be retained in the cell body because EGFP was previously used with success as a reporter for characterizing the dendritic targeting sequence in the fully spliced 3′UTR of Arc mRNA (Kobayashi et al., 2005). Thus, the most likely interpretation is that impaired delivery is related to the fact that EGFP-Arc mRNA is not spliced and thus would not retain EJC proteins. It is noteworthy that localization of oskar mRNA in the posterior pole of the Drosophila oocyte also depends on splicing and presumably deposition of EJC proteins upstream of the exon-exon junction (Hachet and Ephrussi, 2004). The authors propose that splicing is important for regulating ribonucleoprotein complex assembly and organization for cytoplasmic localization. In this regard, the fact that EGFP-Arc mRNA is present in globs in the perinuclear cytoplasm rather than discrete puncta is consistent with the idea that splicing plays a role in packaging the RNA into granules or in granule trafficking thereafter. It may be that splicing and deposition of EJC proteins is a more general mechanism that is critical for mRNA localization in both developing systems and mature neurons.
Our previous studies using live cell imaging document that fusion transcripts with the Arc 3′UTR and MS2 binding sites are transported in dendrites (Dynes and Steward, 2008) and localize with a high degree of precision at the base of dendritic spines (Dynes and Steward, 2012). The DNA constructs for these fusion transcripts were also made from Arc cDNA, and so would not undergo splicing. Thus, splicing and/or the presence of EJC proteins at the splice site are not absolutely required for dendritic transport of transcripts containing the Arc 3′UTR or selective localization at spines.
Selective Localization of Newly-Synthesized Arc mRNA at Active Synapses
Arc mRNA localizes selectively in dendritic domains contacted by active synapses (Steward et al., 1998), due mainly to selective accumulation of newly-synthesized Arc mRNA (Farris et al., 2014). However, there was no hint of accumulation of newly-synthesized EGFP-Arc mRNA in the activated dendritic lamina in any of the transgenic mice tested. Thus, signals induced by strong synaptic activation that enhance dendritic delivery of endogenous Arc mRNA are not sufficient to overcome the impaired dendritic transport of newly-synthesized EGFP-Arc mRNA.
Levels of EGFP-Arc Protein Are High throughout Dendrites Despite Low Levels of EGFP-Arc mRNA
It is often assumed that high levels of Arc protein in dendrites depend on the presence and local translation of Arc mRNA. Despite impaired dendritic delivery of EGFP-Arc mRNA, however, EGFP-Arc protein levels were very high in the dendrites of some neuron types under resting conditions, particularly neurons in the CA1 region of the hippocampus (Figure 5E). EGFP-Arc protein does not run down as quickly after protein synthesis inhibition as endogenous Arc, so high levels of expression of EGFP/Arc protein may be due to a combination of delayed degradation of EGFP-Arc mRNA and delayed degradation of EGFP-Arc protein.
It is noteworthy that increases in EGFP-Arc protein levels with ECS- or repetitive PP stimulation were mainly in the cell body and proximal dendritic regions (for example, Figure 5F). These results suggest two independent, yet not mutually exclusive possibilities: (1) In hippocampal neurons that express EGFP-Arc at high levels under resting conditions, EGFP-Arc protein can reach the distal tips of dendrites even with only a small contribution of local translation of dendritically delivered EGFP-Arc mRNA. (2) However, activity-dependent increases with seizures, synaptic stimulation or learning occur mainly in subcellular domains in which EGFP-Arc mRNA is localized. This may be because such activity regimes favor local protein translation.
Implications for Previous Studies Involving EGFP-Arc Transgenic Mice
The EGFP-Arc transgenic mice used here express an EGFP-Arc fusion protein, and thus differ from other Arc-GFP reporter transgenic mouse lines. In one other line, the coding region of Arc is entirely replaced with a GFP gene, thus causing an Arc knockout (Wang et al., 2006). In another series of mouse lines, destabilized GFP was driven by an Arc promoter in a bacterial artificial chromosome (BAC) (Grinevich et al., 2009) or as a transgene (Eguchi and Yamaguchi, 2009; Vousden et al., 2015), with variable amounts of activity-dependent inducibility and background expression. These lines have subsequently been used to identify neurons in which Arc expression has been induced, e.g., Jakkamsetti et al. (2013) but the reporter is not an Arc-GFP fusion protein and thus would not be germane to elucidating the role of different sequences in affecting dendritic transport. In contrast, the Arc transgenic line used here has both copies of the endogenous Arc gene as well as multiple copies of the EGFP-Arc transgene, and over-expresses total Arc mRNA and protein (endogenous Arc + EGFP-Arc). Accordingly, the EGFP-Arc tg/tg transgenic mice will be useful models for studies of the physiological and behavioral consequences of Arc over-expression coupled with alterations in dendritic transport. In this regard, a recent study has reported that one type of ocular dominance plasticity persists in adult mice from an mCherry-Arc Tg line with approximately 8-fold overexpression of Arc in comparison to WT (Jenks et al., 2017).
Ethics Statement
Ethics Statement Involving Animal Subjects. This study was carried out in accordance with the recommendations of IACUC Protocol Number 1999-2092: Mechanisms Underlying mRNA Transport to Synapses. The protocol was approved by The University of California, Irvine Office of Research, Institutional Animal Care and Use Committee (IACUC). The University of California, Irvine has an approved Animal Welfare Assurance (#A3416.01) on file with the NIH Office of Laboratory Animal Welfare. Part of the live animal experiments were performed at Kyoto University and at the University of Tokyo, with permits from the Institutional Animal Care and Use Committees of Kyoto University and of the University of Tokyo.
Author Contributions
OS: Responsible for overall design of the study, carried out experiments, wrote the manuscript with input from all authors. KMY: Carried out in situ hybridization, immunohistochemistry, Western blot, analyzed data. SF: Developed techniques, contributed to writing of the manuscript. PSP: Confocal microscopy, quantitative analyses of images. PW: Contributed to the design of the study. KO: Determined chromosomal location of transgene and copy number. HO: Created transgenic mice, provided data, contributed to writing of the manuscript. HB: Created transgenic mice, provided data, contributed to writing of the manuscript.
Conflict of Interest Statement
The authors declare that the research was conducted in the absence of any commercial or financial relationships that could be construed as a potential conflict of interest.
Acknowledgments
Grant support: R01NS12333 to OS, R35NS097966 to PW, JSPS-KAKENHI grants 15H02358 and 17H06312 (to HB) and 15H04258 (to HO). PSP was the recipient of fellowship support from NIH MBRS-IMSD GM055246, NIH 5T32 NS045540, NIH NINDS F31 NS083349.
References
Dynes, J. L., and Steward, O. (2008). “Dendritic transport of mRNA, the IEG Arc, and synaptic modifications involved in memory consolidation,” in Molecular Basis of Memory, vol. 4. ed J. D. Sweatt (Oxford: Elsevier), 587–610.
Dynes, J. L., and Steward, O. (2012). Arc mRNA docks precisely at the base of individual dendritic spines indicating the existence of a specialized microdomain for synapse-specific mRNA translation. J. Compar. Neurol. 520, 3105–3119. doi: 10.1002/cne.23073
Eguchi, M., and Yamaguchi, S. (2009). In vivo and in vitro visualization of gene expression dynamics over extensive areas of the brain. Neuroimage 44, 1274–1283. doi: 10.1016/j.neuroimage.2008.10.046
Farris, S., Lewandowski, G., Cox, C. D., and Steward, O. (2014). Selective localization of arc mRNA in dendrites involves activity- and translation-dependent mRNA degradation. J. Neurosci. 34, 4481–4493. doi: 10.1523/JNEUROSCI.4944-13.2014
Giorgi, C., Yeo, G. W., Stone, M. E., Katz, D. B., Burge, C., Turrigiano, G., et al. (2007). The EJC factor eIF4AIII modulates synaptic strength and neuronal protein expression. Cell 130, 179–191. doi: 10.1016/j.cell.2007.05.028
Grinevich, V., Kolleker, A., Eliava, M., Takada, N., Takuma, H., Fukazawa, Y., et al. (2009). Fluorescent Arc/Arg3.1 indicator mice: a versatile tool to study brain activity changes in vitro and in vivo. J. Neurosci. Methods 184, 25–36. doi: 10.1016/j.jneumeth.2009.07.015
Guzowski, J. F., McNaughton, B. L., Barnes, C. A., and Worley, P. F. (1999). Environment-specific induction of the immediate early gene Arc in hippocampal neuronal ensembles. Nat. Neurosci. 2, 1120–1124. doi: 10.1038/16046
Hachet, O., and Ephrussi, A. (2004). Splicing of oskar RNA in the nucleus is coupled to its cytoplasmic localization. Nature 428, 959–963. doi: 10.1038/nature02521
Hopman, A. H., Ramaekers, F. C., and Speel, E. J. (1998). Rapid synthesis of biotin-, digoxigenin-, trinitrophenyl-, and fluorochrome-labeled tyramides and their application for in situ hybridization using CARD amplification. J. Histochem. Cytochem. 46, 771–777. doi: 10.1177/002215549804600611
Jakkamsetti, V., Tsai, N. P., Gross, C., Molinaro, G., Collins, K. A., Nicoletti, F., et al. (2013). Experience-induced Arc/Arg3.1 primes CA1 pyramidal neurons for metabotropic glutamate receptor-dependent long-term synaptic depression. Neuron. 80, 72–79. doi: 10.1016/j.neuron.2013.07.020
Jenks, K. R., Kim, T., Pastuzyn, E. D., Okuno, H., Taibi, A. V., Bito, H., et al. (2017). Arc restores juvenile plasticity in adult mouse visual cortex. Proc. Natl. Acad. Sci. U.S.A. 114, 9182–9187 doi: 10.1073/pnas.1700866114
Kawashima, T., Okuno, H., Nonaka, M., Adachi-Morishima, A., Kyo, N., Okamura, M., et al. (2009). Synaptic activity-responsive element in the Arc/Arg3.1 promoter essential for synapse-to-nucleus signaling in activated neurons. Proc. Natl. Acad. Sci. U.S.A. 106, 316–321. doi: 10.1073/pnas.0806518106
Kobayashi, H., Yamamoto, S., Maruo, T., and Murakami, F. (2005). Identification of a cis-acting element required for dendritic targeting of activity-regulated cytoskeleton-associated protein mRNA. Eur. J. Neurosci. 22, 2977–2984. doi: 10.1111/j.1460-9568.2005.04508.x
Li, H., and Durbin, R. (2009). Fast and accurate short read alignment with Burrows-Wheeler transform. Bioinformatics 25, 1754–1760. doi: 10.1093/bioinformatics/btp324
Li, H., Wysoker, B., Fennell, A., Ruan, T., Homer, J., Marth, N., et al. (2009). 1000 genome project data processing subgroup, the sequence alignment/map format and SAMtools. Bioinformatics 25, 2078–2079. doi: 10.1093/bioinformatics/btp352
Link, W., Konietzko, U., Kauselmann, G., Krug, M., Schwanke, B., Frey, U., et al. (1995). Somatodendritic expression of an immediate early gene is regulated by synaptic activity. Proc. Natl. Acad. Sci. U.S.A. 92, 5734–5738. doi: 10.1073/pnas.92.12.5734
Lyford, G. L., Yamagata, K., Kaufmann, W. E., Barnes, C. A., Sanders, L. K., Copeland, N. G., et al. (1995). Arc, a growth factor and activity-regulated gene, encodes a novel cytoskeleton-associated protein that is enriched in neuronal dendrites. Neuron 14, 433–445. doi: 10.1016/0896-6273(95)90299-6
Mabb, A. M., Je, H. S., Wall, M. J., Robinson, C. G., Larsen, R. S., Qiang, Y., et al. (2014). Triad3A regulates synaptic strength by ubiquitination of Arc. Neuron 82, 1299–1316. doi: 10.1016/j.neuron.2014.05.016
Martin, M. (2011). Cutadapt removes adapter sequences from high-throughput sequencing reads. EMBnet.journal 17, 10–12. doi: 10.14806/ej.17.1.200
Ninomiya, K., Ohno, M., and Kataoka, N. (2016). Dendritic transport element of human arc mRNA confers RNA degradation activity in a translation-dependent manner. Genes Cells 21, 1263–1269. doi: 10.1111/gtc.12439
Okuno, H., Akashi, K., Ishii, Y., Yagishita-Kyo, N., Suzuki, K., Nonaka, M., et al. (2012). Inverse synaptic tagging of inactive synapses via dynamic interaction of Arc/Arg3.1 with CaMKIIbeta. Cell 149, 886–898. doi: 10.1016/j.cell.2012.02.062
Rao, V. R., Pintchovski, S. A., Chin, J., Peebles, C. L., Mitra, S., and Finkbeiner, S. (2006). AMPA receptors regulate transcription of the plasticity-related immediate-early gene Arc. Nat. Neurosci. 9, 887–895. doi: 10.1038/nn1708
Robinson, J. T., Thorvaldsdóttir, H., Winckler, W., Guttman, M., Lander, E. S., Getz, G., et al. (2011). Integrative genomics viewer. Nat. Biotechnol. 29, 24–26. doi: 10.1038/nbt.1754
Steward, O., Farris, S., Pirbhoy, P. S., Darnell, J., and Driesche, S. J. (2014). Localization and local translation of Arc/Arg3.1 mRNA at synapses: some observations and paradoxes. Front. Mol. Neurosci. 7:101. doi: 10.3389/fnmol.2014.00101
Steward, O., Huang, F., and Guzowski, J. F. (2007). A form of perforant path LTP can occur without ERK1/2 phosphorylation or immediate early gene induction. Learn. Mem. 14, 433–445. doi: 10.1101/lm.554607
Steward, O., Wallace, C. S., Lyford, G. L., and Worley, P. F. (1998). Synaptic activation causes the mRNA for the IEG Arc to localize selectively near activated postsynaptic sites on dendrites. Neuron 21, 741–751.
Steward, O., and Worley, P. F. (2001). Selective targeting of newly synthesized Arc mRNA to active synapses requires NMDA receptor activation. Neuron 30, 227–240. doi: 10.1016/S0896-6273(01)00275-6
Vousden, D. A., Epp, J., Okuno, H., Nieman, B. J., van Eede, M., Dazai, J., et al. (2015). Whole-brain mapping of behaviourally induced neural activation in mice. Brain Struct. Funct. 220, 2043–2057. doi: 10.1007/s00429-014-0774-0
Wallace, C. S., Lyford, G. L., Worley, P. F., and Steward, O. (1998). Differential intracellular sorting of immediate early gene mRNAs depends on signals in the mRNA sequence. J. Neurosci. 18, 26–35.
Keywords: LTP, synaptic plasticity, protein synthesis, dendrite, dendritic mRNA, dendritic spines, immediate early gene, nonsense-mediated decay
Citation: Steward O, Matsudaira Yee K, Farris S, Pirbhoy PS, Worley P, Okamura K, Okuno H and Bito H (2018) Delayed Degradation and Impaired Dendritic Delivery of Intron-Lacking EGFP-Arc/Arg3.1 mRNA in EGFP-Arc Transgenic Mice. Front. Mol. Neurosci. 10:435. doi: 10.3389/fnmol.2017.00435
Received: 18 August 2017; Accepted: 18 December 2017;
Published: 31 January 2018.
Edited by:
Sulagna Das, Albert Einstein College of Medicine, United StatesReviewed by:
Claudia Bagni, KU Leuven, BelgiumAlmira Vazdarjanova, Augusta University, United States
Copyright © 2018 Steward, Matsudaira Yee, Farris, Pirbhoy, Worley, Okamura, Okuno and Bito. This is an open-access article distributed under the terms of the Creative Commons Attribution License (CC BY). The use, distribution or reproduction in other forums is permitted, provided the original author(s) and the copyright owner are credited and that the original publication in this journal is cited, in accordance with accepted academic practice. No use, distribution or reproduction is permitted which does not comply with these terms.
*Correspondence: Oswald Steward, b3N0ZXdhcmRAdWNpLmVkdQ==
†Present Address: Shannon Farris, NIH/NIEHS, Durham, NC, United States