- School of Biosciences, Cardiff University, Cardiff, Wales, UK
Neuronal expression of the early growth response-1 (EGR-1; NGFI-A/Zif268) transcription factor has been extensively studied in the adult mammalian brain and linked to aspects of mature physiological/behavioral function. In contrast, this factor has not been studied in detail in the embryonic brain. Here, we used a fluorescent protein-encoding Egr-1 transgene to map the cellular distribution of Egr-1 transcription in embryonic rat brain. We identified a novel, widely distributed population of GFP+ cells, characterized as a precursor/stem cell phenotype by co-localization with SOX2/nestin/vimentin/S-100β and exclusion from other known cellular markers including DCX/BLBP/TBR2/NURR1. At both E18 and E20, these cells were located across the developing brain but concentrated in the subplate and intermediate zones. The transgene was also highly expressed in developing (NeuN+) striatal neurons. The authentic expression pattern that we observed for the rEgr-1 transgene sequence indicates that restriction to neuronal/precursor cells is largely driven by proximal 5′ sequence. Deletion of conserved Egr-1 silencer (neuron restrictive silencer factor) elements did not markedly alter transcriptional activity in transfected cells; this is consistent with a dominant role for positive factors in the control of cell-specific Egr-1 expression. Induction of Egr-1 in a population of SOX2+ cells indicates a co-incidence of extrinsic (EGR-1) and cell-intrinsic (SOX2) cellular signals that may form a novel level of progenitor cell regulation. The wide distribution of EGR-1 signaling in SOX2+ cells suggests an organizational role during late embryonic brain development.
Introduction
The early growth response-1 (EGR-1) transcription factor (TF) is expressed in many regions of the adult brain, providing for a variety of functional associations and roles, including cognition (see Poirier et al., 2008). Egr-1 is considered an immediate early gene (IEG), that is a gene induced independently of prior protein synthesis and thereby capable of effecting rapid adaptive changes in cellular function following reception of an extrinsic signal (Milbrandt, 1987). Our current understanding of these factors therefore entails cellular activation by an extrinsic stimulus. In previous studies we have sought to understand the regulation of brain Egr-1 expression and consequent functional roles via a transgenic approach in which rat Egr-1 genomic sequences were used to direct expression of a fluorescent protein reporter in rats (Man et al., 2007, 2008; Man and Carter, 2008). This experimental approach has double value because in addition to providing information on cis-regulatory sequence function, the reporter molecule (d2EGFP) is not confined to the nucleus (like EGR-1 protein) and therefore enables definitive cell-type identification in the brain through a combination of morphological definition and immunohistochemical co-localization with cell process markers.
Adult brain Egr-1 gene expression is quite extensively documented but embryonic expression of this factor is poorly understood, and was even discounted in early reviews (Beckmann and Wilce, 1997). A propensity for embryonic expression is indicated by Egr-1 induction in both primary neuronal (McKee et al., 2006) and glial (Brinton et al., 1998) cultures derived from embryonic brain and also in progenitor-type cell lines (Milbrandt, 1987; Cacci et al., 2003). In addition, there are reports of Egr-1 mRNA in the embryonic head region (Watson and Milbrandt, 1990) and E20 rat striatum (Jung and Bennett, 1996). However, the extent of expression and cellular localization of Egr-1 protein in embryonic brain is entirely undefined. We have now sought to address this deficiency using our transgenic rat model (Man et al., 2007) in which we are able to localize and identify embryonic cell-types expressing the Egr-driven transgene. Because we have established techniques for immunohistochemical co-localization of GFP and endogenous (nuclear) EGR-1 protein (Holter et al., 2008) we can also accurately determine the authenticity of transgene expression.
Perinatal expression of Egr-1 is of current interest because of recent evidence of this factor acting in epigenetic programming of brain organization and behavioral traits, effected through changes in the methylation status of EGR-1 binding sites in gene promoters (Weaver et al., 2007; Oberlander et al., 2008; McGowan et al., 2009). By identifying the distribution of Egr-1 expression in embryonic brain, it will therefore be possible to gain an understanding of the cellular substrates of perinatal epigenetic mechanisms involving this TF.
Materials and Methods
Animal Procedures
Rat models were used under license in accordance with both UK Home Office regulations, and specifically approved by local ethical review. Rats were maintained in standard laboratory conditions (14:10 light:dark cycle, lights on: 05.00 hours; ad libitum access to food and water). Timed matings between transgenic males (Z27B and Z16 Egr-1-d2EGFP lines; Man et al., 2007) and wild-type females were conducted by pairing the animals for a single night (16.00–09.00 hours) following the detection of a proestrus vaginal smear. Following mating, the females were housed individually and for the purposes of this study, where late embryonic development was examined, pregnancy was verified by visual inspection. Embryonic brain samples were taken using the dating system of Altman and Bayer (1995) where embryonic day 1 (E1), the first day of gestation, was taken to be the day on which the breeding pair were separated. On the day of sampling (E18–E20), dams and fetuses were killed and fetal heads were rapidly dissected prior to fixation in 4% PFA (24 h, 4°C) and cryoprotection in 20% sucrose in 0.1 M phosphate buffer (24 h, 4°C). Postnatal day 2 (P2) brains were sampled and fixed similarly. During these procedures, transgenic and non-transgenic fetuses were identified by PCR analysis of extracted tail tips as described (Man et al., 2007). Brains were stored briefly at −70°C prior to sectioning.
Immunohistochemical Analysis
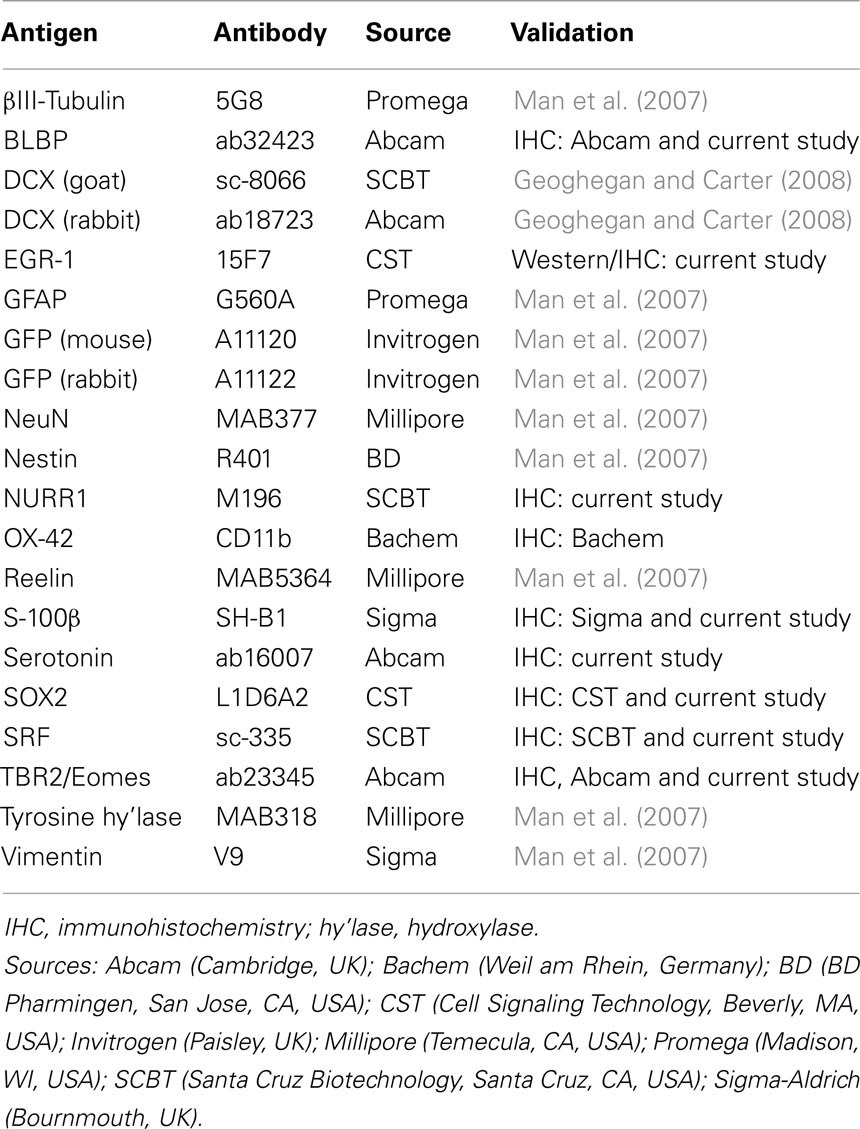
Tissues were positioned in embedding medium (Cryo-M-Bed, Bright Instrument Company Ltd., Huntingdon, UK), and 12 μm sections were cut using a Leica CM1900 cryostat (Leica Imaging Solutions Ltd., Cambridge, UK) and mounted on glass slides (SuperFrost Plus, VWR International, Poole, Dorset, UK). Slides were dried briefly, and stored at −70°C prior to immunohistochemistry. GFP and various endogenous proteins were detected by standard fluorescence immunohistochemistry using procedures and controls established in our laboratory (Man et al., 2007; Holter et al., 2008). In an initial control experiment for the present study, we demonstrated absence of GFP antigen in non-transgenic embryonic rat brain sections (not shown). A total of 20 different primary antisera were used (Table 1). Each antibody was validated with respect to accurate antigen detection by verifying appropriate fluorescence distribution at both sub-cellular (e.g., nuclear vs. whole-cell distribution) and cell population (e.g., restriction to subplate) levels. Some antibodies have also been validated in both our previous studies and through previous use as described by the commercial suppliers (see Table 1). For one antisera (anti-EGR-1, 15F7) that we have used for the first time in the current study, we confirmed specific detection of the target protein on a western blot (see Results). In some cases, the tyramide signal amplification (TSA; PerkinElmer, Waltham, MA, USA) method was employed as described previously (Man et al., 2007).
The primary antisera were used in combination with the appropriate species-specific, fluorophore-tagged, secondary antisera: Alexa Fluor 488-conjugated goat anti-rabbit IgG, Molecular Probes Inc., Eugene, OR, USA; Alexa Fluor 488-conjugated donkey anti-mouse IgG, Molecular Probes; Cy3-conjugated donkey anti-mouse IgG, Jackson Immunoresearch Laboratories Inc., West Grove, PA, USA; Cy3-conjugated sheep anti-rabbit IgG, Sigma-Aldrich, UK). Following washing, sections were mounted under coverslips using Vectashield with DAPI (Vector Laboratories, Burlingame, CA, USA).
Brain sections were viewed using either an epifluorescence microscope (Leica DM-LB, Leica) or a laser confocal microscope (Leica TCS-SP2-AOBS). Images were captured with, respectively, a Leica DFC-300FX digital camera and Leica QWin software (V3) or Leica Confocal Software, and montaged in Photoshop (CS2, Adobe Systems Inc., San Jose, CA, USA). Brain regions were identified using a rat brain atlas (Altman and Bayer, 1995). The QWin software was also used to obtain approximations of cell numbers per unit area by defining rectangles of appropriate size within particular regions (marginal zone/cortical area 1 [1.5 mm2], cortical plate [5 mm2], subplate [2 mm2]), and then cell counts were obtained manually, adopting hemocytometer conventions (n = 6 fields/area). Immunohistochemical analyses were conducted on a minimum of three brain sections each sampled from two different animals of the Z27B Egr-1-d2EGFP line; the general distribution of GFP/EGR-1 expression was also confirmed in two animals of the Z16 Egr-1-d2EGFP line.
Western Blotting
Western blotting was conducted in order to validate the new Egr-1 antiserum (#4153, 15F7, Rabbit mAb, Cell Signalling Technology, Beverly, MA, USA) using standard laboratory procedures (Holter et al., 2008). The primary antibody was used at 1:1000 dilution (overnight incubation, 4°C) as recommended by the manufacturer. A brain tissue extraction procedure was used to provide relative enrichment of cytoplasmic and nuclear fractions of rat cerebral cortex as described and validated previously (Humphries et al., 2004).
Egr-1 Promoter Construct Analysis
The Egr1 promoter function was investigated in 3T3 cells using methods established in our laboratory (Davies et al., 2011). The 3T3 cell line was selected on the basis of expressing REST/NRSF (Ching and Liem, 2009). The promoter constructs used were based on the Egr-1-d2EGFP transgene (Man et al., 2007); novel plasmids derived from the transgene sequence were constructed by ligating rat Egr-1 promoter fragments into the pGL4.11 MCS. These fragments were amplified (Extract N’Amp, Sigma) from transgene plasmid DNA using the following oligonucleotides as primers for PCR:
EgrF1: atatgagctcgcgccttggcagtggcggttc
EgrR1:gtataagcttccgtggtggacgcagggctgc
EgrF2: atatgagctctcagctctacgcgcctggcgc
EgrR2: gcataagcttctgcgcgctgggatctctcgc
These oligonucleotides were designed to amplify extended (F1 and R1; −1380 to +107 bp from the TSS) and truncated promoter constructs that respectively omit proximal (F1 and R2; −1380 to +5), distal (F2R1; −535 to +107) and both (F2R2; −535 to +5) REST/NRSF Position Weight Matrix sequences (PWMs; see Figure 8). Amplified products were cut with SacI and HindIII and ligated into SacI/HindIII-cut pGl4.11 using T4DNA ligase (Promega). Transformed bacteria were expanded and plasmids were extracted using the PureYield kit (Promega). Novel plasmid sequences were obtained using standard DNA sequencing (Prism ready reaction dye-deoxy terminator cycle sequencing kit (PerkinElmer, Foster City, CA, USA) and an ABI prism automated DNA sequencer (377, PerkinElmer).
3T3 cells (CRL-1658; LGC Standards, Teddington, Middlesex, UK) were grown in DMEM (Invitrogen) with 10% calf serum (Invitrogen) and 1× antibiotic/antimycotic (Invitrogen) at 37°C and 5% CO2. Cells were transfected (TransFast protocol, Promega) with the Egr-1 promoter constructs together with the reference plasmid pGL4.75[hRluv/CMV] (50:1 molar ratio; Promega) and maintained for 30 h. After this time, cells were lysed and both Firefly and Renilla luciferase assays were conducted according to the manufacturers protocol (Dual-luciferase reporter assay system, Promega). Relative luminescence values were measured on a Luminometer (Model TD-20/20, Turner Biosystems, Sunnyvale, CA, USA). Each transfection was replicated eight-fold (four replicates in two transfection experiments). Statistical analysis was conducted with SPSS16 for Mac using one-way ANOVA together with a post hoc Tukey’s multiple comparison test. Significance was accepted for p < 0.05.
Bioinformatic Analysis
Sequence alignment was conducted using ClustalW2 (http://www.ebi.ac.uk/).
MatInspector analysis (Genomatix Software GmbH, Munich, Germany; Cartharius et al., 2005) was used to identify conserved PWMs for different TFs within these sequences. In addition, the Gene2Promoter software (Genomatix) was used to illustrate the conservation of serum response factor family (SRFF) and neuron restrictive silencer factor (NRSF) PWMs across mammalian Egr-1 promoters.
Results
General
The Egr-1-d2EGFP transgene was abundantly expressed in embryonic rat brain (Figures 1A,B). Expression was restricted to specific categories of cells (detailed below at E18 and E20 time points) and was found to be similar in two independently derived transgenic lines (Z16 and Z27B, see Man et al., 2007). We verified that transgene expression co-localized with endogenous EGR-1 in different populations of cells (see below) indicating that, in large-part, transgene-derived GFP is a surrogate for Egr-1 transcriptional activity at this developmental stage. The results of the current study also substantiate our previous observation (Man et al., 2007) that cellular filling by GFP is perhaps the major advantage of our transgenic approach to mapping TF activity, providing both signal amplification and morphological detail that transcends (nuclear) EGR-1 detection methods (e.g., Figures 1C,D). Low magnification micrographs (e.g., Figure 1A) provide a compelling overview of Egr-1 transcription in embryonic brain, revealing what appears to be a spatially organized distribution of activated cells.
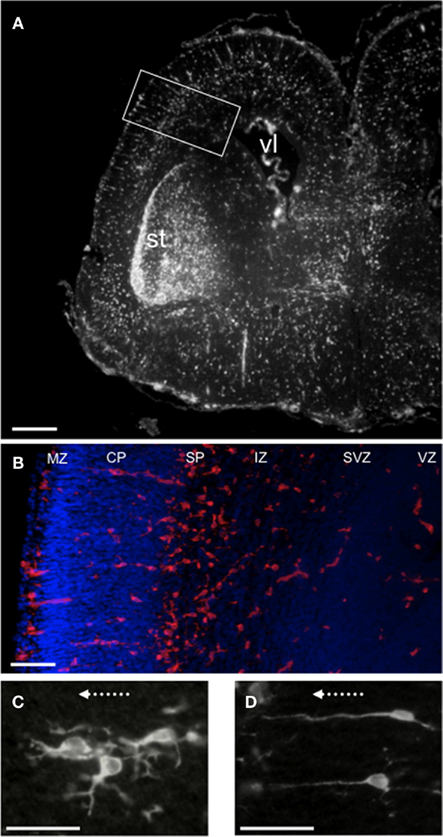
Figure 1. Distribution of Egr-1-d2EGFP transgene expression in the embryonic rat brain. Representative fluorescence microscopic images of E20 brain showing immunohistochemically detected GFP+ cells. (A) One hemisphere showing two major populations of GFP+ cells: a dense group of cells in the striatum (st) and secondly, cells distributed across different regions, from the border of the lateral ventricle (vl) to the pial surface. Scale bar = 200 μm. (B) Enlargement of boxed region in (A) showing GFP+ cells (red) in different zones demarcated by DAPI (blue). Scale bar = 100 μm. (C,D) Examples of GFP+ cells in the cortical plate illustrating the diverse cellular morphologies that are revealed by transgene GFP cell-filling: (C) branched processes projecting laterally; (D) single processes projecting to the pial surface. Arrows are positioned 90° to pial surface. Scale bar = 50 μm. Abbreviations: CP, cortical plate; IZ, intermediate zone; MZ, marginal zone; SP, subplate; st, striatum; SVZ, sub-ventricular zone; vl, lateral ventricle; VZ, ventricular zone.
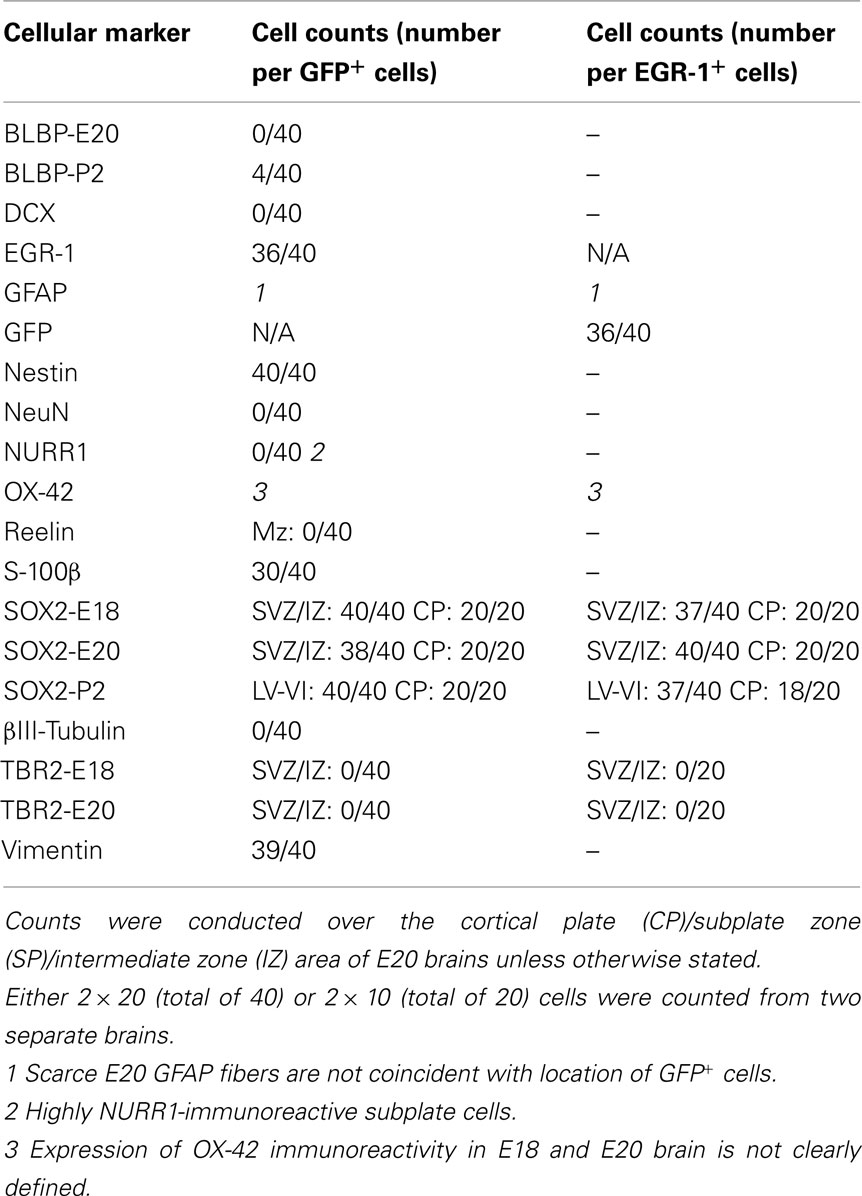
GFP-expression analysis of embryonic brains revealed two major categories of positive cells: SOX2+ progenitor cells and NeuN+ developing neurons. Similar cell-types were observed in both E18 and E20 embryos with differences only in cell numbers; the detailed results largely refer to E20 data except where indicated (see Table 1).
SOX2+ Progenitor Cells in Embryonic Brain
These cells can be seen distributed across the brain, from ventricular zone to marginal zone (Figures 1A,B), and are distinct from the discrete central group of GFP+ neurons in the striatum that form the second major category of GFP+ cells (described below). In other brain sections GFP+/SOX2+cells were also observed in the developing hippocampus (see below). Although the GFP+ progenitor cells share a marker protein phenotype (characterized below), they exhibit extreme morphological variety that ranges from non-process-bearing (e.g., Figure 1B), to branched (Figure 1C), and unbranched radial process-bearing (Figure 1D). Process orientation is also varied indicating propensity for both tangential (e.g., Figure 1C) and radial (e.g., Figure 1D) migration. As can be seen (Figure 1B) at E20, these cells are more abundant in the subplate area (6.5 ± 0.6/mm2) compared for example with the cortical plate (2.1 ± 0.1/mm2) and marginal zone (4.4 ± 0.4/mm2). At E18, the GFP+ progenitor cells are similarly distributed although less abundant, and generally less ornate than at E20.
The phenotype of the GFP+ progenitor cells was established in multiple co-localization experiments (Figures 2–4; Table 2). As noted above, cellular filling with transgene GFP permitted co-localization with process markers; positive co-localizations were obtained with the glial/progenitor markers vimentin, S-100β, and nestin (Figures 2A–C; Table 2). Co-localization with S-100β was more variable than for vimentin and nestin (Table 2) possibly reflecting the relatively low level of S-100β immunoreactivity obtained here rather than absence of expression. Only scarce GFAP+ fibers were observed in E20 brain and these were not coincident with GFP+ cells. In further experiments a developing/migratory neuronal phenotype was eliminated by demonstrating an absence of co-localization with βIII-tubulin and doublecortin (DCX; Figures 2D,E). The DCX− phenotype demonstrates that these cells are not neuronal precursors migrating from the neurogenic SVZ (Dayer et al., 2008). A non-neuronal phenotype was confirmed by showing that the GFP+ progenitor cells were also distinct from NeuN+ immunoreactive cells (Figure 2F).
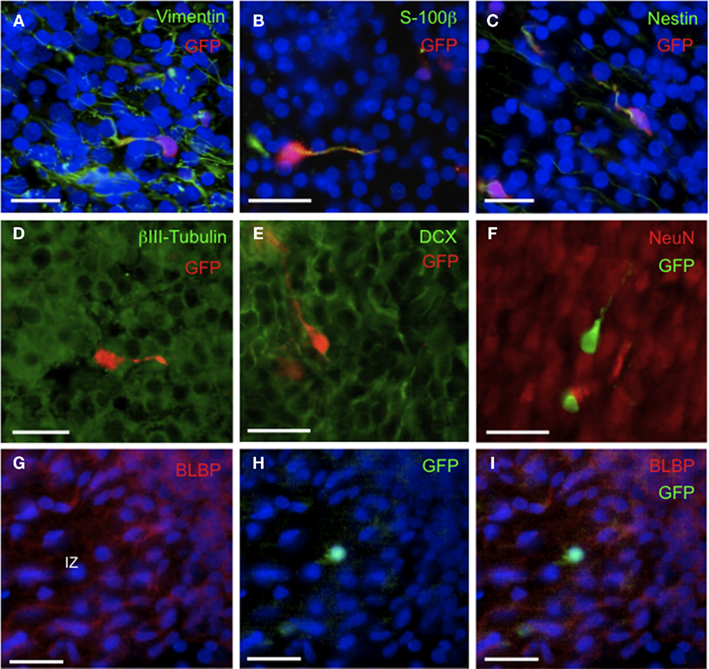
Figure 2. Phenotypic characterization of GFP+ cells in embryonic rat brain. Representative fluorescence microscopic images of E20 brain showing immunohistochemically detected GFP+ cells in the context of known cellular marker proteins and DAPI (blue). (A–C) Note co-localization (yellow) of GFP with vimentin, S-100β, and nestin. (D–F) Note absence of co-localization of GFP with βIII-tubulin, DCX, and NeuN. (G) Note BLBP+ processes coursing through the IZ. (H) Note a single GFP+ cell in the IZ. (I) Note absence of co-localization of GFP with BLBP. Scale bars = 20 μm. Abbreviations: BLBP, brain lipid-binding protein; DCX, doublecortin; GFP, green fluorescent protein; IZ, intermediate zone.
We then went on to show that the GFP+ progenitor cells were distinct from other well-characterized cellular phenotypes. First, a radial glial phenotype was investigated using BLBP as a marker (Figures 2G–I). BLBP staining revealed, firstly, a characteristic population of cells with cell bodies along the walls of the lateral ventricle and long processes projecting toward the pial surface. This distribution and morphology were clearly quite distinct from the GFP+ cell population (Figure 1B). In addition a minor population of extra-ventricular BLBP+ immunoreactive cell bodies were also observed; double IHC with BLBP and mGFP antibodies and cell counting revealed no overlap in immunoreactivity (Table 2). The possibility that some of the ornate GFP+ cells may be representative of a microglial population was eliminated because the OX-42 antisera failed to detect significant immunoreactivity in the embryonic rat brain. Thirdly, we showed that GFP+ cells in the marginal zone were distinct from reelin+ Cajal Retzius neurons (not shown, demonstrated previously for a similar cell population in postnatal (P2) rats; Man et al., 2007). Finally, we found no evidence of serotonin immunoreactivity in the vicinity of GFP+ cells (not shown).
The phenotype of the GFP+/vimentin+/nestin+/S-100β+ progenitor cells was more fully characterized using antisera to cell-type-specific TFs (Figures 3 and 4). First, we determined the distribution of two major populations of progenitor cells in embryonic rat brain as defined by SOX2 and TBR2 staining (Figure 3). As anticipated from mouse data (e.g., Englund et al., 2005), SOX2 expression defined a major population of progenitor cells in the ventricular zone whereas TBR2 defined a more medial population of (intermediate progenitor) cells in the SVZ (Figure 3A). Interestingly, we observed that a small population of SOX2+ cells extended, not only out of the VZ and beyond the TBR2+ zone (Figure 3B), but also out into the developing cortical area (Figure 3). This phenomenon was observed to be more extensive for SOX2+, compared with TBR2+ cells that were more tightly restricted to the SVZ area (Figures 3C–E). The extra-ventricular population of SOX2+ cells clearly showed some similarities to the GFP+ population and therefore co-localization studies were performed (Figure 4; Table 2). First, in the SVZ/IZ, we demonstrated a 100% (E18) or near 100% (E20) co-localization between GFP and SOX2 (Figures 4A–C, Table 2). These findings were then replicated for SOX2/EGR-1 (Figures 4D–F; Table 2). The cellular co-expression of GFP/EGR-1 and SOX2 was confirmed by high-resolution confocal microscopic analysis. GFP and SOX2 were also co-localized in process-bearing GFP+ cells of the cortical plate (Figures 4G,H; Table 2). At the same time, there were large numbers of GFP−/EGR-1−/SOX2+ cells across the brain (e.g., Figures 4D–F) indicating that the Egr-1 gene is activated in a sub-population of these scattered SOX2+ cells. In further experiments, we demonstrated, firstly, that the GFP+ cell population in the SVZ/IZ area was distinct from TBR2+ cells (Figure 4I; Table 2), and secondly, that GFP+ cells in the subplate area are distinct from the band of highly immunoreactive NURR1+ developing neurons in this location (Arimatsu et al., 2003; Figures 4J–L; Table 2).
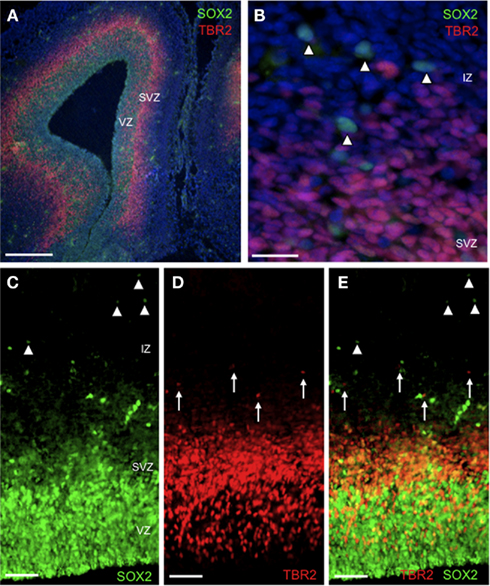
Figure 3. Distribution of SOX2 and TBR2 in embryonic rat brain. Representative fluorescence microscopic images of E18 brain showing immunohistochemically detected SOX2+ and TBR2+ cells in the context of total cells [DAPI, blue, (A,B) only]. (A) Note the abundance of SOX2+ and TBR2+ cells in the VZ and SVZ respectively. Scale bar = 200 μm. (B) Detail of image (A) showing extra-ventricular SOX2+ cells (arrowheads) in the IZ. Scale bar = 20 μm. (C–E) Relative distribution of SOX2+ and TBR2+ cells in the IZ. Note that extra-ventricular SOX2+ cells (arrowheads) are distributed across the IZ (and beyond, see text) whereas TBR2+ cells (arrows) are restricted to the inner IZ. Scale bar = 50 μm. Abbreviations: IZ, intermediate zone; SVZ, sub-ventricular zone; VZ, ventricular zone.
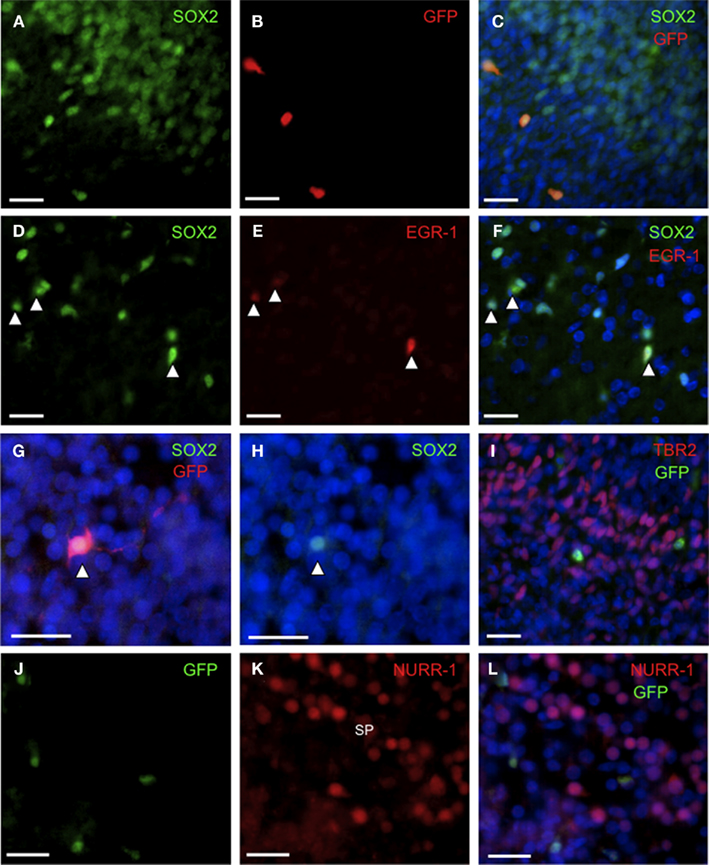
Figure 4. GFP/EGR-1 co-localizes with SOX2+ cells in embryonic rat brain. Representative fluorescence microscopic images of E18 (A–F,I) and E20 (G,H,J–L) brain showing immunohistochemically detected GFP+/EGR-1+ cells in the context of total cells (DAPI, blue) and specific transcription factor proteins. (A–C) GFP is expressed in a sub-set of SOX2+ cells. (D–F) EGR-1 is expressed in a sub-set (arrowheads) of SOX2+ cells. (G–H) Nuclear SOX2 protein within a process-bearing GFP+ cell. (I) GFP+ cells are distinct from TBR2+ cells. (J–L) GFP+ cells are distinct from NURR-1+ cells in the subplate. Scale bars = 20 μm. Abbreviations: SP, subplate.
NeuN+ Developing Neurons in Embryonic Brain
The second major population of GFP+/Egr-1+ cells in E18 and E20 rat brain are striatal neurons (Figure 5). This population of cells is coincident with abundant TH immunoreactive fibers (Figure 5A) that are involved in the development of this neuronal population (Jung and Bennett, 1996). In this location where GFP+ cells are closely packed, it is possible to clearly visualize the recapitulation of EGR-1 expression by the egr-1-d2EGFP transgene (compare Figures 5C,D). EGR-1 expression was detected using an antiserum that detected a single, 78 kDa, nuclear-concentrated band in Western blots of brain tissue (Figure 5B). The abundant striatal GFP+ cells were shown to co-localize with NeuN indicating a neuronal phenotype (Figures 5E–G) and not co-localize with SOX2 (not shown). It should be noted, however, that we also observed a minority of NeuN−/GFP+/SOX2+ progenitor-like cells in this location.
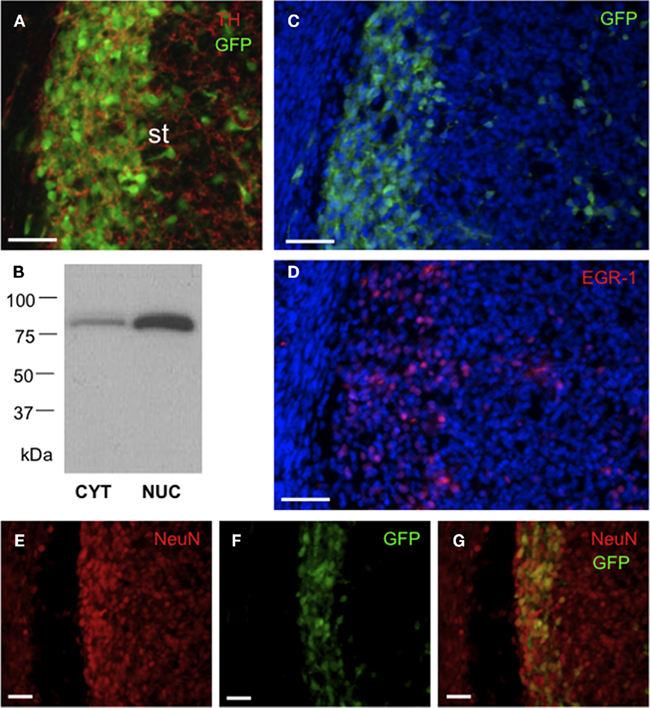
Figure 5. GFP/EGR-1 is highly expressed in NeuN+ neurons of the embryonic rat striatum. Representative fluorescence microscopic images of E20 brain showing immunohistochemically detected GFP+ cells in the context of cellular proteins and DAPI (blue). (A) Densely packed GFP+ cells in the lateral striatum. The cells are associated with an extensive striatal TH innervation. Scale bar = 50 μm. (B) Representative chemiluminescent image of immunoblot analysis of cytoplasmic (CYT) and nuclear (NUC) protein extracts (25 μg) probed with an antibody to EGR-1. Note that the antibody primarily detects a single, approximately 80 kDa, nuclear protein band. (C,D) Analysis of adjacent brain sections showing the similar distributions of GFP+ and EGR-1+ cells; packed in the lateral striatum and scattered in the medial striatum. Scale bars = 50 μm. Abbreviations: st, striatum; TH, tyrosine hydroxylase. (E–G) GFP is primarily localized in NeuN+ neurons of the lateral striatum. Scale bar = 20 μm.
SOX2+ Progenitor Cells in Postnatal Brain
We also examined brains from postnatal animals in order to determine whether SOX2 was also expressed in GFP+/EGR-1+ cells at this developmental stage. In fact, SOX2 is still abundantly expressed in extra-ventricular cells in P2 brain. GFP+ cells in the cortical plate and developing cortical layer V and VI areas were observed to be 100% SOX2+ (Table 2). At the same time there was an abundance of SOX+/GFP− cells. Interestingly, in the P2 Insular cortex, we observed some apposition of SOX2+/GFP+ precursor cells and SOX2−/lowGFP+ neurons (Figure 6). As in E18 and E20 brain, the major population of ventricular BLBP+ radial glia did not correspond with the SOX2+/GFP+ precursor cells (not shown). An additional minor population of extra-ventricular BLBP+ soma were also evident in P2 brains and a minority of these cells were, in fact, GFP+ (Table 2). Notably, this minor population of GFP+/BLBP+ cells in P2 brain were in “low” BLBP(“low”)-expressing cells that contrasted with a second population of BLBP+(“high”)/GFP− cells. Therefore, in P2 brain, the Egr-1-d2EGFP transgene is expressed in a minority of cells with characteristics of extra-ventricular radial glia. However, this population of cells is largely distinct from SOX2+/GFP+ precursors that we have characterized here in embryonic and postnatal brain: this observation is best illustrated in the postnatal hippocampal field (Figures 6E–H) where an organized and widespread distribution of GFP+ cells contrasts with BLBP immunoreactivity that is concentrated only in the subicular area. Finally, we showed that (as E20 brain) the sparse GFAP+ fibers did not overlap with the GFP+ cell population (not shown).
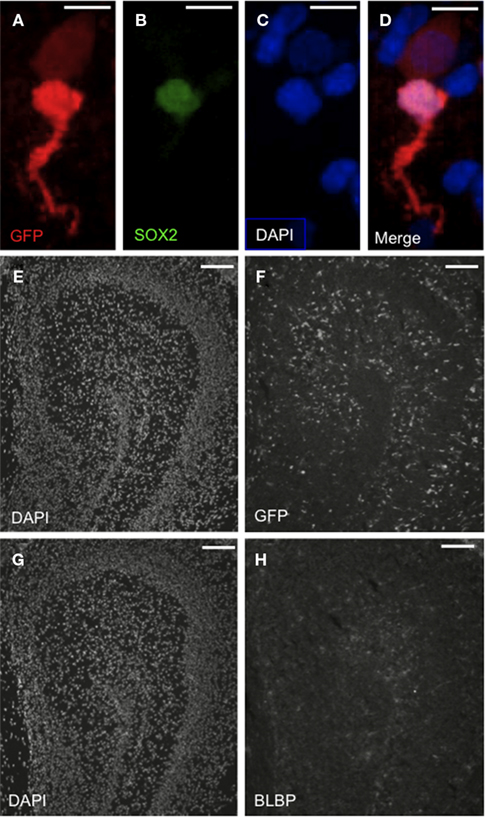
Figure 6. The Egr-1-d2EGFP transgene is expressed in SOX2+ cells in postnatal rat brain. Representative fluorescence microscopic images of P2 rat brain showing immunohistochemically detected GFP+ cells in the context of cellular proteins and DAPI+ cells (blue/white). (A–D) Representative cells in insular cortex. Note that GFP is expressed in two cellular populations: SOX2+ (“bright” GFP) and SOX2− (“dim” GFP). Scale bars = 10 μm. (E–H) Distribution of GFP+ cells in the hippocampal field relative to DAPI and BLBP. Note the widespread, ordered distribution of GFP+ cells relative to the sparse distribution of BLBP+ cells. Scale bars = 100 μm.
Egr-1 Promoter Analysis
Our finding that Egr-1 expression is, in fact, restricted to neuronal and progenitor cells in embryonic and neonatal rat brain, and largely excludes radial glial/mature glial phenotypes, demands a consideration of the molecular mechanisms that underlie this expression pattern. Our transgenic paradigm argues that proximal 5′ sequence is involved. In order to investigate this hypothesis, we conducted in silico sequence analysis followed by transient transfection studies with rat Egr-1 gene constructs.
Multiple sequence alignment combined with MatInspector analysis identified a number of conserved PWMs in the region −1400 to +100 in the Egr-1 promoter. Amongst these are the well-documented SRF sites, but we have made the novel observation of conserved NRSF/REST elements (starting at positions −633 and −9 relative to TSS in the rat promoter sequence). Conservation of these sites (and the previously characterized SRF sites, see Discussion) is illustrated is Figure 7. Based on this in silico evidence of potential “neuronal restrictive” sites, we investigated the regulatory function of these sites in transfected NIH3T3 cells.
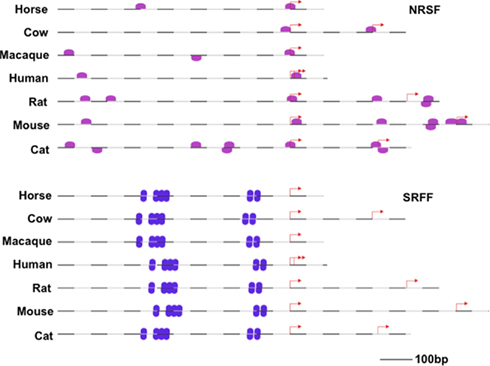
Figure 7. Genomatix™-derived promoter alignments showing the position of predicted NRSF (upper, pink) and SRF (lower, purple) elements within seven mammalian promoters (−770 to +100 bp relative to TSS). Red arrows represent transcriptional start sites (NB. >1 predicted in some species).
Functional analysis of rat Egr-1 promoter constructs showed that all of the constructs were highly expressed compared with the empty pGL4.11 plasmid (Figure 8). Although sequence truncation to remove the distal NRSF/REST sequences did result in a significant increase in expression levels, this was only elevated two-fold (Figure 8). Further removal of the proximal NRSF/REST sequence did not significantly affect expression (Figure 8). This result indicates that the NRSF/REST sequences appear to play only a minor role in dictating cellular expression of Egr-1 and that other sequences (likely including SRF) dominate. An antibody was used to detect SRF expression in E18 and E20 rat brain but we found no evidence of enhanced expression levels in the GFP+ cell populations (not shown) indicating that other SRF-related proteins may confer cell-specific expression of Egr-1 in the brain.
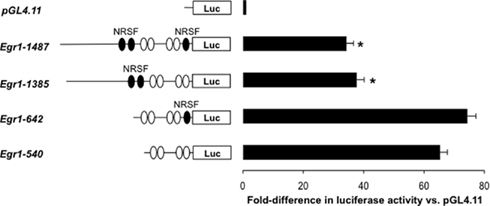
Figure 8. Functional analysis of Egr-1 promoter activity in transfected cells: role of NRSF sites. DNA constructs derived from rat Egr-1-d2EGFP transgene were cloned into pGL4.11 and transfected into 3T3 cells. Levels of expression were determined by luciferase (Luc) assays and corrected against a co-transfected renilla luciferase construct. Histogram shows expression levels of the different constructs relative to empty pGL4.11 (Mean ± SE, n = 8; *p < 0.05 vs. Egr-1-642 and Egr-1-540 groups, ANOVA and Tukey’s multiple comparison test; df = 3, F = 57.28). The position of the predicted NRSF and SRF elements (see text) are indicated by filled and unfilled ovals respectively.
Discussion
Our study describes for the first time the precise cellular location of Egr-1 transcription in the embryonic rat brain. A previous large-scale mapping project (Allen Brain Atlas) and one report (Jung and Bennett, 1996) have localized Egr-1 transcript to the striatum of embryonic mouse and rat brain but the limited cellular resolution of these in situ hybridization (ISH) studies does not permit cellular identification. In particular, non-aggregated cellular populations like the SOX2+/EGR-1+ cells are not visualized by ISH at this resolution and have not been observed previously. Our identification of the novel progenitor cell population is interesting and raises questions about the fate of these cells and the functional interactions that induce Egr-1 expression.
Progenitor Cell Identity
We have identified a novel EGR-1-expressing cellular population in the embryonic rat brain and have characterized these cells by anatomical location, morphology and expression of known cellular markers. Much of our protein co-localization data argues for a radial glial cell identity, the major class of neurogenic precursor cells in the brain (Anthony and Heintz, 2008). However, radial glial stem cells have a well-characterized location and morphology that is not shared by the GFP-filled cell population and we have also found no evidence of BLBP co-expression. Our previous assumption (Man et al., 2007) that vimentin+/nestin+/GFP+ cells in P2–4 brain were of a known glial progenitor phenotype is also not borne out by additional studies reported here in which we co-localized GFP with SOX2, but not BLBP/GFAP in this postnatal population, indicating the P2 cells are also a distinct progenitor population. A recent study (Hansen et al., 2010) has identified a population of non-ventricular radial glia-like cells in human outer SVZ. These cells lack an apical process to the ventricular surface but the presence of a long, pial-oriented process in this human cell population indicates that perhaps only a minority of the GFP+/ SOX2+ cells identified here may represent a similar phenotype.
Early growth response-1 has not previously been observed in a stem/progenitor cell population. Regulation of Egr-1 gene expression has been demonstrated in primary neural cell cultures (Luo et al., 2005; Simó et al., 2007; Stritt and Knöll, 2010) and one study (Luo et al., 2005) using a stromal cell derived factor-1 (SDF-1) stimulus provided an indication that Egr-1 may be expressed in chemokine (C-X-C motif) receptor 4 (CXCR4+) neuronal precursors. However, the GFP+/EGR-1+ population identified here are clearly not CXCR4+ cells because most of the latter population co-localizes with DCX in developing rat brain (Stumm et al., 2007).
Regulation and Role of EGR-1 in SOX2+ Progenitor Cells
The presence of EGR-1 in a scattered sub-population of SOX2+ cells is consistent with a stochastic pattern of cellular activation. Currently, the signals that may activate Egr-1 in these cells are unknown but may include neurotransmitters (LoTurco et al., 1995). There has been a recent report of serotonin acting on progenitor cells (Cheng et al., 2010) but in the current study we have found no evidence of a selective association between 5-HT immunoreactivity and the GFP+/SOX+ cells. Two recent studies have shown that reelin stimulates Egr-1 expression in primary neuronal cultures (Simó et al., 2007; Stritt and Knöll, 2010) and this factor may be relevant for MZ Egr-1 expression because MZ GFP+ cells closely appose reelin+ Cajal Retzius neurons (present study, Man et al., 2007).
The full functional context of EGR-1 expression in SOX2+ progenitor cells cannot be ascertained form the current studies. Clearly, a potential role in intermediate (Ben-Ari and Spitzer, 2010) or terminal differentiation (Sharma and Cline, 2010) is indicated and this would be consistent with the original identification of EGR-1 as a factor induced by NGF (hence NGFI-A) in PC12 cells (Milbrandt, 1987). Prima facie, the SOX2 and EGR-1 TFs would appear to serve opposing demands; SOX2 maintaining an undifferentiated, progenitor/stem state (Bani-Yaghoub et al., 2006) and EGR-1 supporting differentiation (Lanoix et al., 1998; Salani et al., 2009; Passiatore et al., 2010). However, there is evidence that SOX2 can be required for differentiation (Cavallaro et al., 2008) and is even expressed in limited populations of differentiated neurons (see Episkopou, 2005); therefore these two factors may exhibit prolonged co-expression. Conversely, it may be that EGR-1 is induced in SOX2+ progenitors which then rapidly terminate SOX2 expression. The Egr-1-d2EGFP transgenic rats may provide one model in which the temporal dynamics of these TFs in neural cells can be followed, and functional relationships identified.
Expression in Developing Striatal NeuN+ Neurons
Our demonstration that EGR-1 (and Egr-1-d2EGFP transgene) are highly expressed in embryonic striatum confirms not only confirms previous studies (Jung and Bennett, 1996), but also accords with our finding of postnatal striatal transgene expression in these transgenic lines (Man et al., 2007). Here, we have characterized the embryonic cells as largely neuronal and our results therefore attest to a role for a prolonged transcriptional EGR-1 drive in the development and maintenance of neuronal gene expression in the striatum (Jung and Bennett, 1996).
Restriction of EGR-1 Expression
Although the Egr-1 gene is abundantly expressed in embryonic rat brain, expression is restricted to particular classes of neurons and progenitor cells. In agreement with our previous study (Man et al., 2007), we have found no evidence of expression in mature glia. Previous studies report EGR-1 in cultured astrocytes (Hu and Levin, 1994; Biesiada et al., 1996; Mayer et al., 2009) but not in adult brain with the exception of one study (Beck et al., 2008) that reported EGR-1 immunoreactivity in a minority of GFAP+ cells in the adult mouse brain. However, expression in the latter study was primarily in and around the brain ventricles and is therefore not representative of a mature glial population. Overall, it is apparent that molecular mechanisms restrict brain Egr-1 expression to neurons and progenitor cells. Our transgenic approach has been useful in showing the cell restrictive mechanisms are largely, if not wholly, mediated at the level of proximal 5′Egr-1 genomic sequence.
In the current study, we have investigated the hypothesis that conserved, NRSF/RE-1 sites play a role in silencing Egr-1 expression.
This was based on our bioinformatic identification of Egr-1 NRSF sites (Figure 7), and also on recent studies that have indicated roles for NRSF/REST in neuronal differentiation (Gupta et al., 2009) and glial specification (Abrajano et al., 2009). Our results (obtained in a REST-expressing fibroblast cell line) show that only the relatively distal NRSF site (−633 in rat Egr-1 promoter) could potentially make a contribution to transcriptional control; however, other sequences are clearly paramount in determining a high level of Egr-1 transcription. This result is in line with genome-wide analysis of REST targets that exclude Egr-1 (albeit in Jurkat cells; Johnson et al., 2007) and, indeed, Egr-1 is widely expressed in peripheral tissues (Su et al., 2004). Accordingly, although the NRSF sites exhibit conservation and may contribute to transcriptional regulation, it can be seen (Figure 7) that the Egr-1 SRF sites are very highly conserved and are therefore potentially dominant (positive) regulators of Egr-1 transcription as demonstrated in other paradigms (Changelian et al., 1989; Bernal-Mizrachi et al., 2000; Ramanan et al., 2005; Tyan et al., 2008; Parkitna et al., 2010). In support of the latter contention, SRF exhibits neuronal specificity (Knöll and Nordheim, 2009) and is up-regulated postnatally (Stringer et al., 2002) in a parallel manner with EGR-1 (Man et al., 2007). However, in the current study we found no evidence of a selective association of SRF protein with the EGR-1+ progenitors and expression is low at this developmental stage (see Stringer et al., 2002). Consequently, cell-specific expression other TFs including the SRF-associated factor ELK-1 (Chen et al., 2004; Hasan and Schafer, 2008; Boros et al., 2009) may be involved in specifying EGR-1 expression.
Conclusion
In conclusion, we have characterized embryonic brain Egr-1 expression using a fluorescent transgene approach and have identified a novel population of SOX2+ progenitor cells in which Egr-1 has been induced. Induction of Egr-1 implies cellular activation by an extrinsic stimulus and the apparent co-incidence of extrinsic (Egr-1) and intrinsic (SOX2) cellular signals appears to form a novel paradigm for progenitor cell development. The wide distribution of “activated” EGR-1+/SOX2+ cells suggests a general role for EGR-1 in cellular regulation during late embryonic/early postnatal brain development. In defining this cell population, we have also provided an additional cellular substrate for epigenetic modification of EGR-1 targets (Weaver et al., 2007; Oberlander et al., 2008; McGowan et al., 2009) during the perinatal period. Further studies are also required to understand the role of the extra-ventricular SOX2+ cells; these may form a reserve of migrating stem cells that can be directed to particular phenotypes by spatial/temporal-specific inputs. Studies are also required to define both the genomic targets of the EGR-1 TF in embryonic brain and the full temporal and spatial expression pattern across brain development. Egr-1 may be similarly induced during human brain cell development and could be involved in mediating extrinsic influences during pregnancy, for example to addictive (Jouvert et al., 2002; Lee et al., 2010) or therapeutic drugs (Pawluski et al., 2009).
Conflict of Interest Statement
The authors declare that the research was conducted in the absence of any commercial or financial relationships that could be construed as a potential conflict of interest.
References
Abrajano, J. J., Qureshi, I. A., Gokhan, S., Zheng, D., Bergman, A., and Mehler, M. F. (2009). Differential deployment of REST and CoREST promotes glial subtype specification and oligodendrocyte lineage maturation. PLoS ONE 4, e7665. doi: 10.1371/journal.pone.0007665
Altman, J., and Bayer, S. A. (1995). Atlas of Prenatal Rat Brain Development. Boca Raton: CRC Press.
Anthony, T. E., and Heintz, N. (2008). Genetic lineage tracing defines distinct neurogenic and gliogenic stages of ventral telencephalic radial glial development. Neural Dev. 5, 30.
Arimatsu, Y., Ishida, M., Kaneko, T., Ichinose, S., and Omori, A. (2003). Organization and development of corticocortical associative neurons expressing the orphan nuclear receptor Nurr1. J. Comp. Neurol. 466, 180–196.
Bani-Yaghoub, M., Tremblay, R. G., Lei, J. X., Zhang, D., Zurakowski, B., Sandhu, J. K., Smith, B., Ribecco-Lutkiewicz, M., Kennedy, J., Walker, P. R., and Sikorska, M. (2006). Role of Sox2 in the development of the mouse neocortex. Dev. Biol. 295, 52–66.
Beck, H., Semisch, M., Culmsee, C., Plesnila, N., and Hatzopoulos, A. K. (2008). Egr-1 regulates expression of the glial scar component phosphacan in astrocytes after experimental stroke. Am. J. Pathol. 173, 77–92.
Beckmann, A. M., and Wilce, P. A. (1997). Egr transcription factors in the nervous system. Neurochem. Int. 31, 477–510.
Ben-Ari, Y., and Spitzer, N. C. (2010). Phenotypic checkpoints regulate neuronal development. Trends Neurosci. 33, 485–492.
Bernal-Mizrachi, E., Wice, B., Inoue, H., and Permutt, M. A. (2000). Activation of serum response factor in the depolarization induction of Egr-1 transcription in pancreatic islet-cells. J. Biol. Chem. 275, 25681–25689.
Biesiada, E., Razandi, M., and Levin, E. R. (1996). Egr-1 activates basic fibroblast growth factor transcription. Mechanistic implications for astrocyte proliferation. J. Biol. Chem. 271, 18576–18581.
Boros, J., Donaldson, I. J., O’Donnell, A., Odrowaz, Z. A., Zeef, L., Lupien, M., Meyer, C. A., Liu, X. S., Brown, M., and Sharrocks, A. D. (2009). Elucidation of the ELK1 target gene network reveals a role in the coordinate regulation of core components of the gene regulation machinery. Genome Res. 19, 1963–1973.
Brinton, R. D., Yamazaki, R., Gonzalez, C. M., O’Neill, K., and Schreiber, S. S. (1998). Vasopressin-induction of the immediate early gene, NGFI-A, in cultured hippocampal glial cells. Brain Res. Mol. Brain Res. 57, 73–85.
Cacci, E., Salani, M., Anastasi, S., Perroteau, I., Poiana, G., Biagioni, S., and Augusti-Tocco, G. (2003). Hepatocyte growth factor stimulates cell motility in cultures of the striatal progenitor cells ST14A. J. Neurosci. Res. 74, 760–768.
Cartharius, K., Frech, K., Grote, K., Klocke, B., Haltmeier, M., Klingenhoff, A., Frisch, M., Bayerlein, M., and Werner, T. (2005). MatInspector and beyond: promoter analysis based on transcription factor binding sites. Bioinformatics 21, 2933–2942.
Cavallaro, M., Mariani, J., Lancini, C., Latorre, E., Caccia, R., Gullo, F., Valotta, M., DeBiasi, S., Spinardi, L., Ronchi, A., Wanke, E., Brunelli, S., Favaro, R., Ottolenghi, S., and Nicolis, S. K. (2008). Impaired generation of mature neurons by neural stem cells from hypomorphic Sox2 mutants. Development 135, 541–557.
Changelian, P. S., Feng, P., King, T. C., and Milbrandt, J. (1989). Structure of the NGFI-A gene and detection of upstream sequences responsible for its transcriptional induction by nerve growth factor. Proc. Natl. Acad. Sci. U.S.A. 86, 377–381.
Chen, C. C., Lee, W. R., and Safe, S. (2004). Egr-1 is activated by 17-estradiol in MCF-7 cells by mitogen-activated protein kinase-dependent phosphorylation of elk-1. J. Cell. Biochem. 93, 1063–1074.
Cheng, A., Scott, A. L., Ladenheim, B., Chen, K., Ouyang, X., Lathia, J. D., Mughal, M., Cadet, J. L., Mattson, M. P., and Shih, J. C. (2010). Monoamine oxidases regulate telencephalic neural progenitors in late embryonic and early postnatal development. J. Neurosci. 30, 10752–10762.
Ching, G. Y., and Liem, R. K. (2009). RE1 silencing transcription factor is involved in regulating neuron-specific expression of alpha-internexin and neurofilament genes. J. Neurochem. 109, 1610–1623.
Davies, J. S., Klein, D. C., and Carter, D. A. (2011). Selective genomic targeting by FRA-2/FOSl2: regulation of Rgs4 is mediated by a variant AP-1 promoter sequence/CBP mechanism. J. Biol. Chem. 286, 15227–15233.
Dayer, A. G., Jenny, B., Potter, G., Sauvain, M. O., Szabó, G., Vutskits, L., Gascon, E., and Kiss, J. Z. (2008). Recruiting new neurons from the subventricular zone to the rat postnatal cortex: an organotypic slice culture model. Eur. J. Neurosci. 27. 1051–1060.
Englund, C., Fink, A., Lau, C., Pham, D., Daza, R. A., Bulfone, A., Kowalczyk, T., and Hevner, R. F. (2005). Pax6, Tbr2, and Tbr1 are expressed sequentially by radial glia, intermediate progenitor cells, and postmitotic neurons in developing neocortex. J. Neurosci. 25, 247–251.
Geoghegan, D., and Carter, D. A. (2008). A novel site of adult doublecortin expression: neuropeptide neurons within the suprachiasmatic nucleus circadian clock. BMC Neurosci. 9, 2. doi: 10.1186/1471-2202-9-2
Gupta, S. K., Gressens, P., and Mani, S. (2009). NRSF downregulation induces neuronal differentiation in mouse embryonic stem cells. Differentiation 77, 19–28.
Hansen, D. V., Lui, J. H., Parker, P. R., and Kriegstein, A. R. (2010). Neurogenic radial glia in the outer subventricular zone of human neocortex. Nature 464, 554–561.
Hasan, R. N., and Schafer, A. I. (2008). Hemin upregulates Egr-1 expression in vascular smooth muscle cells via reactive oxygen species ERK-1/2-Elk-1 and NF-kappaB. Circ. Res. 102, 42–50.
Holter, J. L., Davies, J. S., Man, P.-S., Wells, T., and Carter, D. A. (2008). “Transgenic delivery and detection of GFP in neuropeptide neurons,” in Neuropeptide Techniques, ed. I. Gozes (Totowa, NJ: Humana Press), 31–44.
Hu, R. M., and Levin, E. R. (1994). Astrocyte growth is regulated by neuropeptides through Tis 8 and basic fibroblast growth factor. J. Clin. Invest. 93, 1820–1827.
Humphries, A., Weller, J., Klein, D., Baler, R., and Carter, D. A. (2004). NGFI-B (Nurr77/Nr4a1) orphan nuclear receptor in rat pinealocytes: circadian expression involves an adrenergic-cyclic AMP mechanism. J. Neurochem. 91, 946–955.
Johnson, D. S., Mortazavi, A., Myers, M., and Wold, B. (2007). Genome-wide mapping of in vivo protein–DNA interactions. Science 316, 1497–1502.
Jouvert, P., Dietrich, J. B., Aunis, D., and Zwiller, J. (2002). Differential rat brain expression of EGR proteins and of the transcriptional corepressor NAB in response to acute or chronic cocaine administration. Neuromol. Med. 1, 137–151.
Jung, A. B., and Bennett, J. P., Jr. (1996). Development of striatal dopaminergic function. II: Dopaminergic regulation of transcription of the immediate early gene zif268 and of D1 (D1a) and D2 (D2a) receptors during pre- and postnatal development. Brain Res. Dev. Brain Res. 94, 121–132.
Knöll, B., and Nordheim, A. (2009). Functional versatility of transcription factors in the nervous system: the SRF paradigm. Trends Neurosci. 32, 432–442.
Lanoix, J., Mullick, A., He, Y., Bravo, R., and Skup, D. (1998). Wild-type egr1/Krox24 promotes and dominant-negative mutants inhibit, pluripotent differentiation of p19 embryonal carcinoma cells. Oncogene 17, 2495–2504.
Lee, C. T., Chen, J., Worden, L. T., and Freed, W. J. (2010). Cocaine causes deficits in radial migration and alters the distribution of glutamate and GABA neurons in the developing rat cerebral cortex. Synapse 65, 21–34.
LoTurco, J. J., Owens, D. F., Heath, M. J., Davis, M. B., and Kriegstein, A. R. (1995). GABA and glutamate depolarize cortical progenitor cells and inhibit DNA synthesis. Neuron 15, 1287–1298.
Luo, Y., Cai, J., Xue, H., Miura, T., and Rao, M. S. (2005). Functional SDF1 alpha/CXCR4 signaling in the developing spinal cord. J. Neurochem. 93, 452–462.
Man, P.-S., and Carter, D. A. (2008). Pineal gland expression of the transcription factor Egr-1 is restricted to a population of glia that are distinct from nestin-immunoreactive cells. J. Mol. Histol. 39, 69–75.
Man, P.-S., Evans, T., and Carter, D. A. (2008). Rhythmic expression of an egr-1 transgene in rats distinguishes two populations of photoreceptor cells in the retinal outer nuclear layer. Mol. Vis. 14, 1175–1186.
Man, P.-S., Wells, T., and Carter, D. A. (2007). Egr-1-d2EGFP transgenic rats identify transient populations of neurons and glial cells during postnatal brain development. Gene Expr. Patterns 7, 872–883.
Mayer, S. I., Rössler, O. G., Endo, T., Charnay, P., and Thiel, G. (2009). Epidermal-growth-factor-induced proliferation of astrocytes requires Egr transcription factors. J. Cell. Sci. 122, 3340–3350.
McGowan, P. O., Sasaki, A., D’Alessio, A. C., Dymov, S., Labonté, B., Szyf, M., Turecki, G., and Meaney, M. J. (2009). Epigenetic regulation of the glucocorticoid receptor in human brain associates with childhood abuse. Nat. Neurosci. 12, 342–348.
McKee, S. C., Thompson, C. S., Sabourin, L. A., and Hakim, A. M. (2006). Regulation of expression of early growth response transcription factors in rat primary cortical neurons by extracellular ATP. Brain Res. 1088, 1–11.
Milbrandt, J. (1987). A nerve growth factor-induced gene encodes a possible transcriptional regulatory factor. Science 238, 797–799.
Oberlander, T. F., Weinberg, J., Papsdorf, M., Grunau, R., Misri, S., and Devlin, A. M. (2008). Prenatal exposure to maternal depression, neonatal methylation of human glucocorticoid receptor gene (NR3C1) and infant cortisol stress responses. Epigenetics 3, 97–106.
Parkitna, J. R., Bilbao, A., Rieker, C., Engblom, D., Piechota, M., Nordheim, A., Spanagel, R., and Schütz, G. (2010). Loss of the serum response factor in the dopamine system leads to hyperactivity. FASEB J. 24, 2427–2435.
Passiatore, G., Gentilella, A., Rom, S., Pacifici, M., Bergonzini, V., and Peruzzi, F. (2010). Induction of Id-1 by FGF-2 involves activity of EGR-1 and sensitizes neuroblastoma cells to cell death. J. Cell. Physiol. 226, 1763–1770.
Pawluski, J. L., Galea, L. A., Brain, U., Papsdorf, M., and Oberlander, T. F. (2009). Neonatal S100B protein levels after prenatal exposure to selective serotonin reuptake inhibitors. Pediatrics 124, e662–e670.
Poirier, R., Cheval, H., Mailhes, C., Garel, S., Charnay, P., Davis, S., and Laroche, S. (2008). Distinct functions of egr gene family members in cognitive processes. Front. Neurosci. 2:47–55. doi: 10.3389/neuro.01.002.2008
Ramanan, N., Shen, Y., Sarsfield, S., Lemberger, T., Schütz, G., Linden, D. J., and Ginty, D. D. (2005). SRF mediates activity-induced gene expression and synaptic plasticity but not neuronal viability. Nat. Neurosci. 8, 759–767.
Salani, M., Anelli, T., Tocco, G. A., Lucarini, E., Mozzetta, C., Poiana, G., Tata, A. M., and Biagioni, S. (2009). Acetylcholine-induced neuronal differentiation: muscarinic receptor activation regulates EGR-1 and REST expression in neuroblastoma cells. J. Neurochem. 108, 821–834.
Sharma, P., and Cline, H. T. (2010). Visual activity regulates neural progenitor cells in developing Xenopus CNS through musashi1. Neuron 68, 442–455.
Simó, S., Pujadas, L., Segura, M. F., La Torre, A., Del Río, J. A., Ureña, J. M., Comela, J. X., and Soriano, E. (2007). Reelin induces the detachment of postnatal subventricular zone cells and the expression of the Egr-1 through Erk1/2 activation. Cereb. Cortex 17, 294–303.
Stringer, J. L., Belaguli, N. S., Iyer, D., Schwartz, R. J., and Balasubramanyam, A. (2002). Developmental expression of serum response factor in the rat central nervous system. Brain Res. Dev. Brain Res. 138, 81–86.
Stritt, C., and Knöll, B. (2010). SRF (Serum Response Factor) regulates hippocampal lamination and dendrite development and is connected with reelin signaling. Mol. Cell. Biol. 30, 1828–1837.
Stumm, R., Kolodziej, A., Schulz, S., Kohtz, J. D., and Höllt, V. (2007). Patterns of SDF-1alpha and SDF-1gamma mRNAs, migration pathways, and phenotypes of CXCR4-expressing neurons in the developing rat telencephalon. J. Comp. Neurol. 502, 382–399.
Su, A. I., Wiltshire, T., Batalov, S., Lapp, H., Ching, K. A., Block, D., Zhang, J., Soden, R., Hayakawa, M., Kreiman, G., Cooke, M. P., Walker, J. R., and Hogenesch, J. B. (2004). A gene atlas of the mouse and human protein-encoding transcriptomes. Proc. Natl. Acad. Sci. U.S.A. 101, 6062–6067.
Tyan, S. W., Tsai, M. C., Lin, C. L., Ma, Y. L., and Lee, E. H. (2008). Serum- and glucocorticoid-inducible kinase 1 enhances zif268 expression through the mediation of SRF and CREB1 associated with spatial memory formation. J. Neurochem. 105, 820–832.
Watson, M. A., and Milbrandt, J. (1990). Expression of the nerve growth factor-regulated NGFI-A and NGFI-B genes in the developing rat. Development 110, 173–183.
Weaver, I. C., D’Alessio, A. C., Brown, S. E., Hellstrom, I. C., Dymov, S., Sharma, S., Szyf, M., and Meaney, M. J. (2007). The transcription factor nerve growth factor-inducible protein a mediates epigenetic programming: altering epigenetic marks by immediate-early genes. J. Neurosci. 27, 1756–1768.
Keywords: EGR-1, neural progenitor cells, SOX2, transgenic, transcription factor, green fluorescent protein
Citation: Wells T, Rough K and Carter DA (2011) Transcription mapping of embryonic rat brain reveals EGR-1 induction in SOX2+ neural progenitor cells. Front. Mol. Neurosci. 4:6. doi: 10.3389/fnmol.2011.00006
Received: 18 April 2011; Paper pending published: 28 April 2011;
Accepted: 02 May 2011; Published online: 17 May 2011.
Edited by:
James Olcese, Florida State University College of Medicine, USAReviewed by:
Urs Albrecht, University of Fribourg, SwitzerlandRalf Jockers, University of Paris, France
Erik Maronde, University of Frankfurt, Germany
Copyright: © 2011 Wells, Rough and Carter. This is an open-access article subject to a non-exclusive license between the authors and Frontiers Media SA, which permits use, distribution and reproduction in other forums, provided the original authors and source are credited and other Frontiers conditions are complied with.
*Correspondence: David A. Carter, School of Biosciences, Cardiff University, Museum Avenue, Cardiff CF10 3AX, Wales, UK. e-mail: smbdac@cardiff.ac.uk

