 Alexander K. Converse1*
 Maryann N. Krasko2,3
 Denis Michael Rudisch2,3,4
 Charlie Lenell Lunaris2†Alex F. Nisbet2†
 Maxim S. Slesarev1John C. Szot2Andrew G. Hoerst2
 Glen E. Leverson2
 Catherine L. Gallagher5
 Michelle R. Ciucci2,3,6
- 1Waisman Center, University of Wisconsin-Madison, Madison, WI, United States
- 2Division of Otolaryngology, Department of Surgery, University of Wisconsin-Madison, Madison, WI, United States
- 3Department of Communication Science and Disorders, University of Wisconsin-Madison, Madison, WI, United States
- 4Institute for Clinical and Translational Research, University of Wisconsin-Madison, Madison, WI, United States
- 5Department of Neurology, University of Wisconsin-Madison, Madison, WI, United States
- 6Neuroscience Training Program, University of Wisconsin-Madison, Madison, WI, United States
Introduction: Parkinson disease (PD) is a neurodegenerative condition affecting multiple sensorimotor and cognitive systems. The Pink1−/− rat model exhibits vocal, cognitive, and limb use deficits seen in idiopathic PD. We sought to measure glucose metabolism in brain regions in Pink1−/− and wild type (WT) rats, and to associate these to measures of ultrasonic vocalization, cognition, and limb use behavior.
Methods: Pink1−/− (n = 12) and WT (n = 14) rats were imaged by [18F]fluorodeoxyglucose (FDG) positron emission tomography (PET) in a repeated measures design at approximately 10 months of age and 6 weeks later. Relative regional glucose metabolism was indexed by whole brain normalized FDG uptake, which was calculated for 18 regions identified a priori for comparison. Behavioral measures included tests of communication via ultrasonic vocalization, cognition with 5-Choice Serial Reaction Time Test (5-CSRTT), and limb use with Cylinder Test and Challenge Beam.
Results: Relative glucose metabolism was significantly different in Pink1−/− rats in prelimbic area, striatum, nucleus ambiguus, globus pallidus, and posterior parietal association cortex compared to WT controls. For behavioral measures, Pink1−/− rats demonstrated quieter vocalizations with a restricted frequency range, and they showed increased number of foot-faults and hindlimb steps (shuffling) in limb motor tests. Significant behavior vs. brain correlations included associations of ultrasonic vocalization parameters with glucose metabolism indices in locus coeruleus and substantia nigra.
Conclusion: FDG PET reveals abnormalities in relative regional brain glucose metabolism in Pink1−/− rats in brain regions that are important to cognition, vocalization, and limb motor control that are also impacted by Parkinson disease. This method may be useful for mechanistic studies of behavioral deficits and therapeutic interventions in translational studies in the Pink1−/− PD model.
1 Introduction
Parkinson disease (PD) is a progressive neurodegenerative disorder that manifests throughout the central nervous system. In addition to typical motor dysfunction (i.e., gait disturbances, tremor) (Berg et al., 2018; Bloem et al., 2021), PD results in other motor and nonmotor deficits including difficulties with speech (Logemann et al., 1978; Hartelius and Svensson, 1994; Theodoros, 2011), swallowing (Kalf et al., 2012; Suttrup and Warnecke, 2016; Schapira et al., 2017; Pflug et al., 2018; Krasko et al., 2023a; Rudisch et al., 2023b), and cognition (Aarsland et al., 2017; O’Callaghan and Lewis, 2017). The role of nigrostriatal dopamine in motor functioning is widely known. Its depletion is well-understood to lead to motor decline in PD and this premise has guided therapeutic dopamine replacement as treatment for PD. However, many other sensorimotor and nonmotor symptoms of PD appear in the prodromal stage of disease, prior to significant nigrostriatal depletion (Schapira et al., 2017). Moreover, dopamine-centered treatments do not improve vocal communication, swallowing, or cognitive deficits (Ho et al., 2008; Skodda et al., 2010; Ciucci et al., 2013; Seppi et al., 2019). Currently, the mechanisms driving many of these other common PD deficits are not well understood.
Glucose metabolism is associated with the pathophysiology of PD (Dunn et al., 2014; Dai et al., 2023). Glucose serves as the primary energy source for the brain, and disruptions in its metabolism can lead to cellular energy deficits and oxidative stress, both of which are implicated in neurodegeneration (Anandhan et al., 2017). Dysregulated glucose metabolism can also exacerbate mitochondrial dysfunction (Anandhan et al., 2017), impair protein degradation, and promote neuroinflammation (Edison et al., 2013), all of which are key pathological features of PD. Clinically, impaired glucose utilization has been observed in the brains of individuals with PD through positron emission tomography (PET) imaging using the PET tracer [18F]fluorodeoxyglucose (FDG), a glucose analog (Teune et al., 2014). A pattern of resting state metabolism has been identified as hypermetabolic in several brain regions including the thalamus (Thal), putamen, globus pallidus, pons, cerebellum and motor cortex, as well as hypometabolic in posterior parietal, occipital, and frontal cortices (Eidelberg, 2009; Meles et al., 2020). The exact brain-behavior relationships between vocal communication/cognition and glucose metabolism in associated brain regions in the PD disease process are yet to be uncovered. Elucidating these relationships is imperative for better understanding the pathogenesis of PD, as well as the development of novel, targeted therapeutics for these specific PD deficits.
Repeated in vivo imaging enhances mechanistic understanding of potential treatments, allowing for within subject control that increases statistical power, and it further permits the association of baseline measures with subsequent responses (i.e., potential neuroprogression over time) (Nikolaus et al., 2004; Lancelot and Zimmer, 2010). Animal models offer a controlled environment where variables can be manipulated with greater precision, facilitating more rigorous assessment of glucose uptake and behavior within the same organism over time (Konnova and Swanberg, 2018). The Pink1−/− rat model is based on the disruption of the Pink1 gene, which encodes PTEN-induced putative kinase 1 (PINK1), a protein associated with mitochondrial function and implicated in the development of PD (Quinn et al., 2020). In Pink1−/− rats, the absence of PINK1 leads to mitochondrial dysfunction, oxidative stress, and impaired cellular energy metabolism, characteristics observed in human PD (Quinn et al., 2020). Moreover, this is a progressive model of PD, where deficits manifest and worsen as the rat ages and disease progresses (Dave et al., 2014; Grant et al., 2015). Specifically, the Pink1−/− rat demonstrates early and progressive decline in swallowing/oromotor function (Krasko et al., 2023b), anxiety (Hoffmeister et al., 2021, 2022), affect (Marquis et al., 2020), as well as vocal communication (Grant et al., 2015; Johnson et al., 2020; Marquis et al., 2020; Krasko et al., 2021), cognition (Soto et al., 2024), and limb motor function (Dave et al., 2014; Grant et al., 2015; Kelm-Nelson et al., 2018), making it an appropriate model for this work. Additionally, this model demonstrates loss of dopaminergic cells in the substantia nigra (SN) (Dave et al., 2014), changes in norepinephrine levels in SN and locus coeruleus (LC) (Grant et al., 2015; Kelm-Nelson et al., 2018), and correlations between brainstem noradrenergic markers and vocal decline/anxiety (e.g., β1 receptor in the nucleus ambiguus/dorsal motor nucleus of vagus and reduced vocal intensity) (Hoffmeister et al., 2021). Animal models of PD have been imaged by PET, and Pink1−/− rats have been studied with MRI (Ferris et al., 2018; Real et al., 2023), however, to our knowledge, the Pink1−/− model has not yet been imaged by PET. We expect that these methods and the use of more specific PET radiotracers in the Pink1−/− model may lead to improved understanding of the relations among brain and behavior and eventually aid in translation of interventions to the clinic.
Here we describe the novel application of FDG PET neuroimaging in the Pink1−/− genetic rat model of PD and associations with behavioral measures. With this application of PET neuroimaging in Pink1−/− rats, we sought to establish methods for future studies and to test the hypotheses that Pink1−/− rats would show, in comparison to wild type (WT) controls, (1) altered relative regional brain glucose metabolism (i.e., FDG uptake), (2) diminished behavioral function, (3) altered associations between behavioral measures and metabolism, and (4) more rapid degeneration. Given our overarching interest in catecholamines in the Pink1−/− model, in the FDG PET analysis we focused on brain regions that are key components of the noradrenergic and dopaminergic systems. In particular, we examined regions rich in norepinephrine transporters, including LC, Thal, and prelimbic area (PrL), as well as regions with high densities of dopamine transporters, including SN, striatum (Str), and PrL. Furthermore, we examined regions implicated in neuromotor speech difficulties (dysarthria), namely hypoglossal nucleus, solitary nucleus, nucleus ambiguus, and periaqueductal grey. Additionally, we assessed regions consistently found to be abnormal on FDG PET in PD, including globus pallidus, pons, primary and secondary motor areas, medial and posterior parietal association cortex areas, caudate putamen, cerebellum, and primary visual area.
2 Materials and methods
2.1 Study design
To test the hypotheses regarding genotype differences, brain-behavior associations, and age effects, rats were studied using a repeated measures design. As detailed below (Table 1), male Pink1−/− (n = 12) and male WT (n = 15) Long-Evans rats were assessed at baseline and then at a final timepoint 6 weeks later with no intervening treatment. A younger and older group of rats were chosen to span the age range from 9 to 12 months, a window in which our lab has observed declines in various measures in Pink1−/− rats. Rats underwent FDG PET brain imaging and behavioral assays, as described below. This manuscript was drafted in accord with the ARRIVE 2.0 guidelines (Percie du Sert et al., 2020).
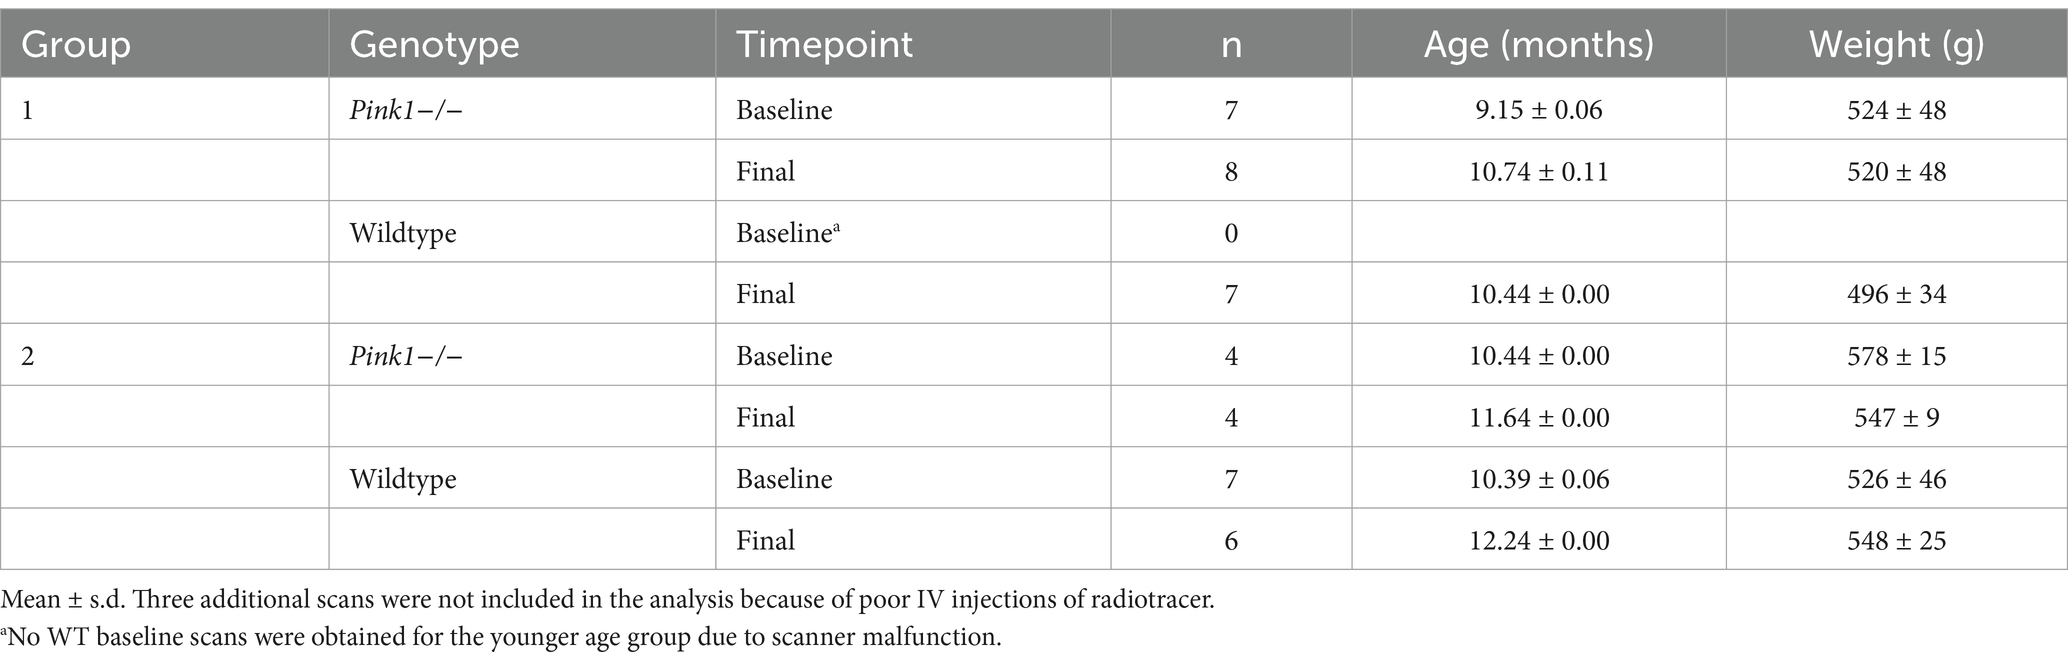
Table 1. PET scans: mean ages and weights with SD.
2.2 Rats
All work involving rats was approved by the University of Wisconsin-Madison Institutional Animal Care and Use Committee (IACUC protocols M006390, M006782, and G006404) and was conducted in accordance with the National Institutes of Health Guide for the Care and Use of Laboratory Animals (2011). Twenty seven male Long-Evans rats [Pink1−/− (n = 12), WT (n = 15)] were received from Envigo Research Laboratories (Boyertown, PA, United States) at 4–6 weeks of age. Genotype was independently confirmed for rats used in this study (Transnetyx, Cordova, Tennessee). All handling and testing occurred during the dark period (awake) of a 12-h reverse light–dark cycle (12:12) under partial red illumination. Water and food were provided ad libitum except when used as a reward for the 5-Choice Serial Reaction Time Task (see below). Behavioral testing and in vivo imaging generally occurred twice for each rat at approximately 9–11 months of age with baseline and final testing separated by ~6 weeks. Rats were acclimated to handling and transport for 1 week prior to training and testing.
2.3 PET
2.3.1 Data acquisition
Rats were imaged using a microPET P4 scanner (Concorde Microsystems Inc., Knoxville), with 7.8 cm axial and 19 cm transaxial fields of view, and 2 mm full width at half maximum resolution. Rats were scanned in groups of up to four. An in-house anesthesia system allowed for individual adjustment of isoflurane concentration in oxygen at 1 L/min. Anesthesia was initially delivered at 4.5% in an induction chamber, after which rats were placed in head holders affixed to the scanner bed. The holders were made in-house and consisted of two levels, each accommodating two rats with a tooth bar and ear bars for each individual rat to keep their heads stationary during the scans. Isoflurane at a concentration of 1–4% in oxygen at 1 L/min was administered individually in order to maintain anesthetic plane. Heating pads and mylar body wraps were used to keep the rats at an acceptable body temperature (35.9–37.5°C). Oxygen saturation, heart rate, and rectal temperature were monitored regularly, and ophthalmic lubricant was used to keep corneas moisturized throughout the procedure. Head holder, anesthesia, and warming apparatus materials within the field of view were minimized to reduce scatter and attenuation. 24-gauge intravenous (IV) catheters were placed in the tail veins and kept primed with heparinized saline (10 USP/mL). To dilate veins for IV catheter placement, tails were placed in 45°C water for 5 min and a tourniquet was placed at the base of the tail of each anesthetized rat at the end of the 5-min period. Catheter placement was checked by examining blood backflow, and intravenous administration was confirmed by examining time activity curves (TACs) in post-processing. Rats were centered axially at the interaural line. When scanned in groups of four, the rats were placed radially at 4.9 cm from the cFOV. When scanned in groups of two, radial placement was at 3.5 cm from cFOV. A 57Co point source was used to obtain a 518 s single-pass transmission scan with a 120–125 keV energy window. Once head placement was verified by examining the transmission image, a 90-min emission scan (350–650 keV with a 6 ns coincidence window) was started and a single bolus of FDG (Sofie Romeoville, Illinois) was injected into each rat at 1-min intervals (nominal 1 μCi/g, measured 0.58 ± 0.19 mCi net injected activity).
2.3.2 Image reconstruction
Image reconstruction was performed using the scanner vendor’s software (microPET Manager and ASIPro, Siemens, Knoxville). List mode data were sorted into 90 1-min frames and binned into 3D sinograms (168 projection angles × 192 bins; span 3; ring difference 31; 11 segments). The emission sinograms were corrected for random coincidences, detector sensitivity, and dead time. Transmission sinograms were reconstructed, calibrated to a representative region of interest (ROI) in brain (511 keV attenuation coefficient μ = 0.095 cm−1), segmented (< 0.095/2 cm−1 = 0, > 0.095/2 cm−1 = 0.095 cm−1), and forward projected. Using the adjusted transmission sinograms to correct for attenuation and scatter, dynamic emission images were reconstructed by filtered back-projection (Fourier 2D rebinning; image matrix size, 128 × 128; pixel size, 0.47 mm × 0.47 mm in-plane × 1.21 mm slice thickness, ramp filter) and corrected for radioactive decay to the beginning of the scan.
2.3.3 Image analysis
The publicly available Waxholm atlas of the rat brain was used for anatomical identification (version 1.01) (Papp et al., 2014). To facilitate the alignment procedure, the original 39 μm cubic voxels were downsampled to 0.25 mm cubic, which is still small compared to the 1.8 mm resolution of the PET scanner. This downsampling resulted in the loss of 2 small regions of the original 76. The remaining 74 bilateral regions had a median size of 6 mm3. The PrL ROI was obtained from version 4 of the Waxholm atlas (Kleven et al., 2023). Additional regions were delineated in-house with respect to the Paxinos atlas (Paxinos and Watson, 1998) for pons, nucleus ambiguus, LC, solitary nucleus, and hypoglossal nucleus (12). To judge if the Waxholm Sprague Dawley atlas was suitable for analysis of Long-Evans rats, publicly available Long-Evans MR images1 were aligned to the atlas MR template by nine degrees of freedom (df, 3 shifts, 3 rotations, and 3 scales). The resulting scaling in 3 dimensions increased the Long-Evans brain volume by 1.5% (scale factors: medial-lateral 1.011, dorsal-ventral 0.979, anterior–posterior 1.024), similar to a reported 4% smaller brain weight in LE at PND 35 (Holson et al., 2001). Waxholm atlas boundaries of the whole brain, cerebellum, LC, periaqueductal grey, Thal, Str, and PrL ROIs agreed to better than 0.5 mm with structures in the transformed Long-Evans MRI template.
Alignment of PET images to the atlas was performed using in-house python code that called freely available image processing algorithms (Jenkinson et al., 2002). Sum images were created from 30 to 60 min post-injection of radiotracer. PET images were first coarsely aligned by manual shifts and rotations (6 df) to the atlas space. The PET images were next finely aligned by computer optimization of 6 and then 9 df transforms to the brain mask, which was smoothed (Gaussian kernel, σ = 0.85 mm) to simulate the PET scanner resolution. For within-subject alignment, baseline and final timepoint image pairs of the same subject were first aligned to each other by 6 df and then with the same 9 df transformation to the Waxholm atlas. From these aligned images, baseline and final images of 6 WT and 6 Pink1−/− rats (24 images) were averaged and aligned by 9 df to the smoothed brain mask to create a study template. The fine alignment procedure was then repeated with the study template as the target. The final alignment transformations were created by concatenating the coarse and fine transformation matrices, and these were applied to the 4D images in scanner space yielding aligned dynamic images in atlas space.
To determine the regional distribution of FDG uptake, time-activity curves (TACs) were extracted for each atlas ROI. The mean radioactivity concentration (Bq/mL) from 30 to 60 min was calculated and divided by the injected dose per body weight (Bq/g) to yield the standardized uptake value (SUV, g/mL) for each region. To correct for any variations within or between rats in administration, distribution, metabolism, and excretion (ADME), each region’s SUV was divided by the whole brain SUV to yield the relative SUV (SUVr), which is equivalent to the regional radioactivity concentration scaled to the whole brain radioactivity concentration. SUVr served as an index of regional glucose metabolism relative to whole brain (Lin et al., 2008).
2.4 Ultrasonic vocalizations
Vocalization was tested using an established mating paradigm to elicit male rat ultrasonic vocalizations (Ciucci et al., 2010; Johnson et al., 2013; Hoffmeister et al., 2021; Broadfoot et al., 2023; Cullins et al., 2023; Rudisch et al., 2023a). Briefly, all testing rats were acclimated to the testing procedure for 7 consecutive days followed by one recording session. Testing occurred at baseline and final timepoints. Male testing rats were placed in their standard polycarbonate home cage without their housing-mate. An ultrasonic microphone with 16-bit resolution and a sampling rate of 250 kHz (CM16, Avisoft, Berlin, Germany) attached to an ultrasonic recording system (AviSoft, Berlin, Germany) was mounted 15 cm above the rat’s home cage. A stimulus female rat, conspecific in estrus, was placed in the single male rat’s cage and removed after two mounting attempts by the male rat or after the male rat had expressed interest (i.e., sniffing, genital auto-grooming, or chasing). Estrus of the stimulus female rats was confirmed by observing typical behavioral signs (e.g., lordosis, ear wiggling, hopping, and darting) (Bialy et al., 2000; Brudzynski, 2021). Ultrasonic vocalizations in the 50 kHz range were recorded for 5 min after the female rat was removed. USV files (WAV) were automatically detected and analyzed for frequency parameters [peak frequency and delta frequency (bandwidth)] in kHz, loudness [mean power (dB/Hz)], and call complexity parameters (% complex calls), using DeepSqueak v.3.0.1 (Coffey et al., 2019) in MATLAB (9.11.17.69968 [R2021b]; MathWorks Inc., Natick, MA). DeepSqueak identifies calls using a pre-trained neural network. USVs were then manually labeled for six call types based on the spectrogram output from DeepSqueak: simple, simple-compound, frequency-modulated, frequency-modulated-compound, harmonic, and harmonic-compound (Supplementary Table S1) and collapsed into three call categories (simple, frequency-modulated (FM), and harmonic) for statistical analysis (Wright et al., 2010; Hoffmeister et al., 2024). Peak frequency (kHz), mean power (dB/Hz), and bandwidth (kHz) of simple and frequency-modulated calls, parameters sensitive to abnormalities in social communication in rat models of PD (Krasko et al., 2021), were used for statistical analyses using baseline and final testing recordings.
2.5 Tapered Balance Beam
Motor performance and coordination were measured via Tapered Balance Beam as previously described (Grant et al., 2015). The Tapered Balance Beam and Cylinder Test (below) are two of the more common gross motor tests employed by our lab that are sensitive to sensorimotor changes in the Pink1−/− model at this age. Briefly, a beam (165 cm in length), with the testing length being the middle 135 cm, was suspended 1 m above the ground. The beam was wider on one end (6.35 cm), narrowing to 1.27 cm on the opposite end. The upper part of the beam is composed of high-density polyethylene plastic with a safety walk non-slip material on the top surface. Rats were acclimated to the task for three consecutive days prior to testing, completing five trials each day. On testing day, each rat was placed at the wide end of the beam and was video-recorded (Sony HDR-CX210, New York, NY) traversing the tapered beam to the narrower end for a total of five trials. Raters, blinded to age and genotype, viewed and rated recordings in slow motion using Windows Media Player (Microsoft, Redmond, WA). All personnel were trained to meet intra-and inter-rater reliability criteria of ICC >0.95. The total time to traverse the beam (sec), time to traverse the final one-third of the beam (sec), the number of combined forelimb foot faults, and the number of combined hindlimb foot faults along the length the beam were recorded for each trial.
2.6 Cylinder Test
Spontaneous motor activity was measured via Cylinder Test for 120 s as previously described (Grant et al., 2015). A transparent cylinder (20 cm diameter × 60 cm height) was used, which was placed vertically on a piece of glass. A camera (Sony HDR-CX210, New York, NY) was positioned below, in order to provide a clear view of movements along the ground and walls of the cylinder. Raters, blinded to age and genotype, viewed recordings in slow motion using Windows Media Player. All personnel were trained to meet intra-and inter-rater reliability criteria of ICC >0.95. The total number of forelimb up steps, the total number of forelimb down steps, the total number of hindlimb steps, the total number of rears, and the total number of lands were measured over a two-minute period for each rat.
2.7 Five-Choice Serial Reaction Time Task
Attention and impulse control were assessed with the 5-CSRTT using Noldus Ethovision XT software (Version 13.0.1220, Noldus Information Technology Inc., Leesburg, VA, United States) and a Med Associates five-choice chamber (Model MED-NP5L-B1, Med Associates Inc., St. Albans, VT, United States). The methods for this study were adapted from Bari et al. (2008) and Asinof and Paine (2014) to accommodate the 5-CSRTT for aged Long-Evans rats. Rats were acclimated to the data collection room for 1 week prior to the start of the 5-CSRTT. During acclimation, rats were food restricted until they reached 90% of free feeding weight, and feed was then adjusted with daily monitoring, so weight increased 5 g per week. The rats were subsequently acclimated to the chamber and reward pellets (Dustless Precision Pellets 45 mg, Bio-Serv, Flemington, NJ, United States) for 1 week.
After acclimation, the rats progressed through multiple training stages (see Supplementary Table S2A) based on performance for a period of 3 weeks. A rat moved to the next stage by achieving 70% correct responses on two consecutive days. Baseline testing occurred after the 3 week acclimation period and final testing occurred 5 weeks later. All rats were re-acclimated prior to the final testing period. The testing week consisted of two standard testing days, a test of attentiveness/impulsivity, and a test of cognitive function (see Supplementary Table S2B). To establish a standard performance level, each rat underwent 2 days of scored testing at the highest training stage achieved during training. To test impulsivity, the Inter-Trial Interval (ITI) was increased for each trial and all other parameters remained at those of the standard training stage. To test attentiveness, the Stimulus-Duration parameter (SD) was decreased to that of the next stage and all other parameters remained at those of the standard stage.
Nominal variables of correct, incorrect, premature, and omission were scored for each trial throughout the 4 days of testing. The two standard days of testing were averaged and used as a comparison to compute the fractional differences for the Long-ITI and Short-SD trials. Data were included for timepoints at which the rat completed an average of at least 43 trials in the standard sessions. These parameters are interpreted as measures of accuracy (fraction correct), inhibitory response control (premature), and sustained attention (omissions) (Robbins, 2002; Bari et al., 2008).
2.8 Statistical analysis
Linear mixed-effects models were used in a two-by-two repeated measures design with genotype (Pink1−/−, WT) and timepoint (baseline, final) as fixed effects and each rat as a random effect. To determine associations between behavioral and brain measures, behavior was treated as the dependent variable in a genotype X FDG uptake model. Significant interactions were followed with Tukey post-hoc analyses. All statistical analyses were performed using SAS version 9.4 (SAS Institute, Inc., Cary, North Carolina) with type III sums of squares. Significance was set at α = 0.05 except where otherwise noted. To qualitatively confirm genotype differences in FDG uptake found in the ROI analyses, a voxel-wise two sample t-test of Pink1−/− vs. WT images was performed and arbitrarily thresholded at |t| > 0.05 without correction for multiple comparisons.
3 Results
As detailed below, the main findings of this work were altered FDG uptake in several of the brain regions chosen a priori (PrL, Str, nucleus ambiguus, globus pallidus, caudate putamen, and posterior area of the parietal association cortex) as well as altered behavioral measures (vocalization, gait, activity, and cognition) in the Pink1−/− rats compared to WT controls. FDG uptake was associated with behavioral measures in several brain regions.
3.1 PET
3.1.1 Animals scanned
Two overlapping age groups of rats (14 WT and 12 Pink1−/−) were scanned at two time points, with baseline and final separated by approximately 1.5 months. As detailed in Table 1, not all rats were successfully scanned at both time points, so a total of 43 scans were obtained (20 WT scans and 23 Pink1−/− scans).
3.1.2 Image alignment and regional radioactivity time courses
Images were aligned to the template space with better than 1 mm accuracy (Figure 1). The combined 3-dimensional scale factors (x * y * z) of the WT image volumes at the final timepoint was 1.08 +/− 0.07 (n = 13, mean +/-SD), and Pink1−/− volumes were scaled by a lesser amount, 1.03 +/− 0.04 (n = 12, p = 0.035; two sample t-test). These adjustments in the brain volumes of the WT and Pink1−/− rats are not unexpected given that Long-Evans rats imaged here have been shown to have 4% lower brain weight compared to the Sprague Dawley rats represented in the atlas (Holson et al., 2001).
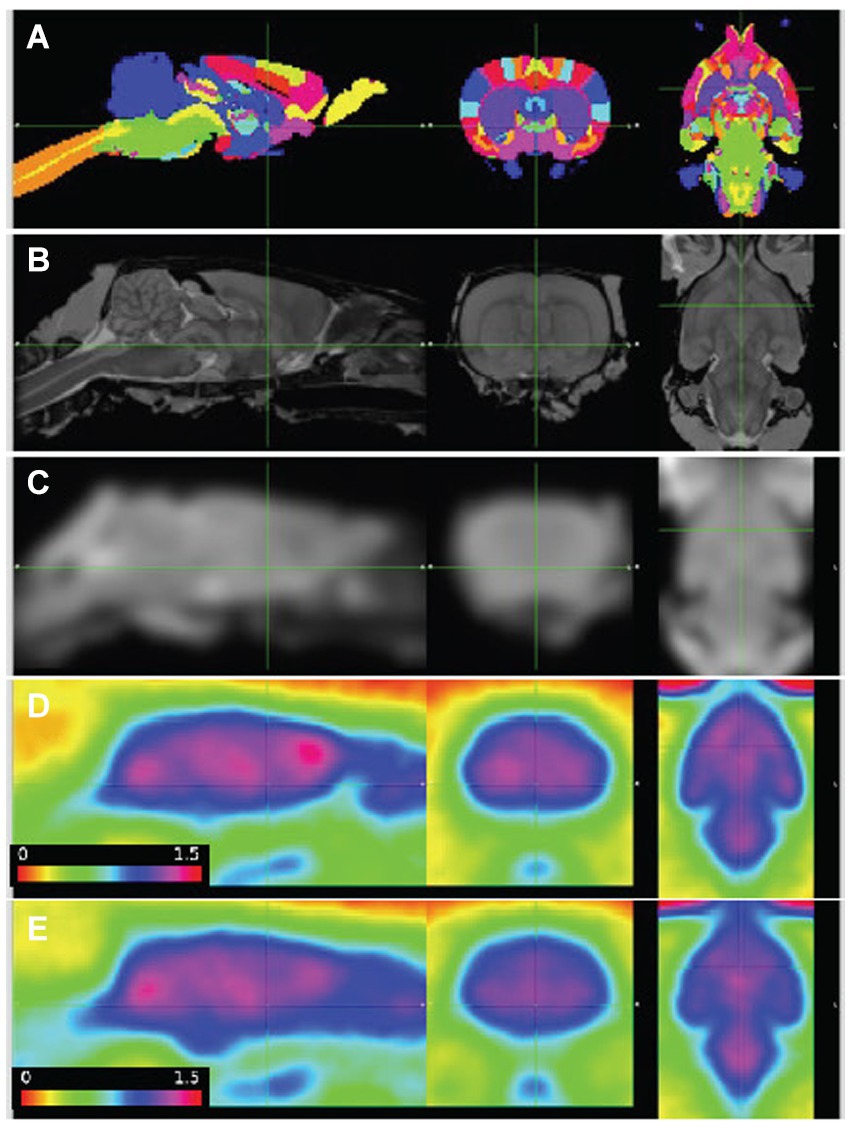
Figure 1. PET images aligned to atlas. (A) Delineated regions; (B) MRI template; (C) MRI template smoothed to PET resolution; (D,E) average of baseline FDG images, wildtype (n = 7) and Pink1−/− rats (n = 11), whole-brain normalized, 30–60 min post injection. Sagittal, coronal, and horizontal sections shown at anterior commissure.
Standardized uptake values (SUV) were calculated by dividing the regional radioactivity concentration 30–60 min post-injection by injected dose/body weight. For each genotype and timepoint the whole-brain SUVs were SUVWT, baseline = 1.73 +/− 0.46, SUVWT, final = 1.73 +/− 0.40, SUVPink1−/−, baseline = 1.53 +/− 0.55, and SUVPink1−/−, final = 1.64 +/− 0.48 (mean +/− SD). The calculated time activity curves (TACs) showed rapid uptake following IV injection of FDG and sustained radioactivity levels to the end of the 90-min scanning period. Individual and summary TACs for WT and Pink1−/− rats are shown in Figure 2.
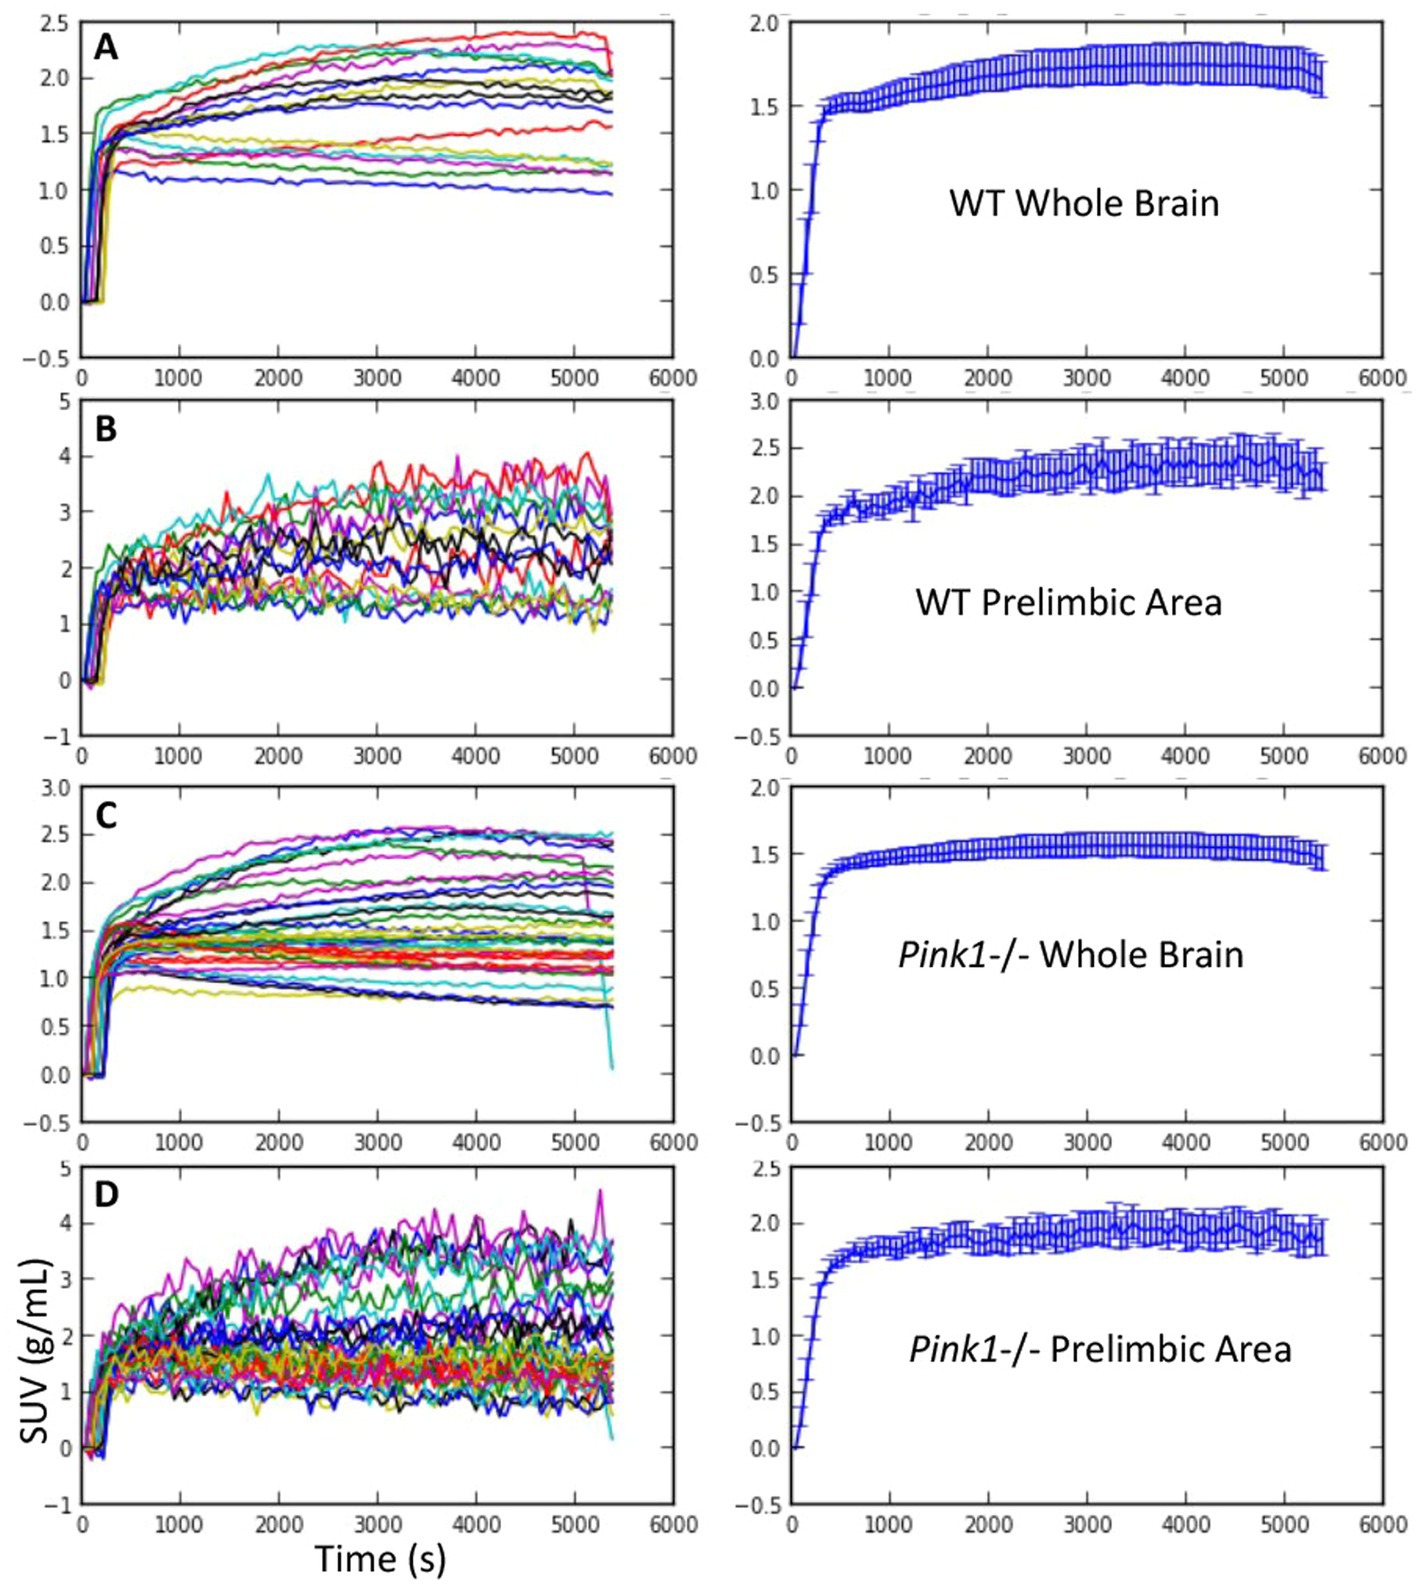
Figure 2. FDG uptake. Standardized uptake value (SUV) vs. time. Individual time courses are shown on the left, and mean +/− SEM are shown on the right. (A and B) Wildtype (WT) whole brain and prelimbic area. (C and D) Pink1−/− whole brain and prelimbic area.
3.1.3 Regional whole-brain normalized FDG uptake
For the 18 anatomical regions of interest selected a priori, linear mixed-effects analyses were applied to the PET measures of relative regional FDG uptake (SUVr) with genotype and time as fixed effects and rat as a random effect. As detailed in Table 2, no interactions of genotype and time were observed. A main effect of genotype was observed in six regions (Figure 3): whole brain normalized FDG uptake was reduced in Pink1−/− rats in PrL [F(1, 24) = 6.05, p = 0.021], Str [F(1, 24) = 7.47, p = 0.012], caudate putamen [F(1, 24) = 6.87, p = 0.015], and globus pallidus [F(1,24) = 4.44, p = 0.046] and elevated in nucleus ambiguus [F(1, 24) = 6.12, p = 0.021] and the posterior area of the parietal association cortex [F(1, 24) = 8.84, p = 0.007]. A main effect of time was observed in three regions (Figure 4): whole brain normalized FDG uptake was greater at Final in hypoglossal nucleus (12) [F(1, 15) = 8.00, p = 0.013] and solitary nucleus [F(1, 15) = 4.77, p = 0.045] and lower in secondary motor area [F(1, 15) = 5.20, p = 0.038].
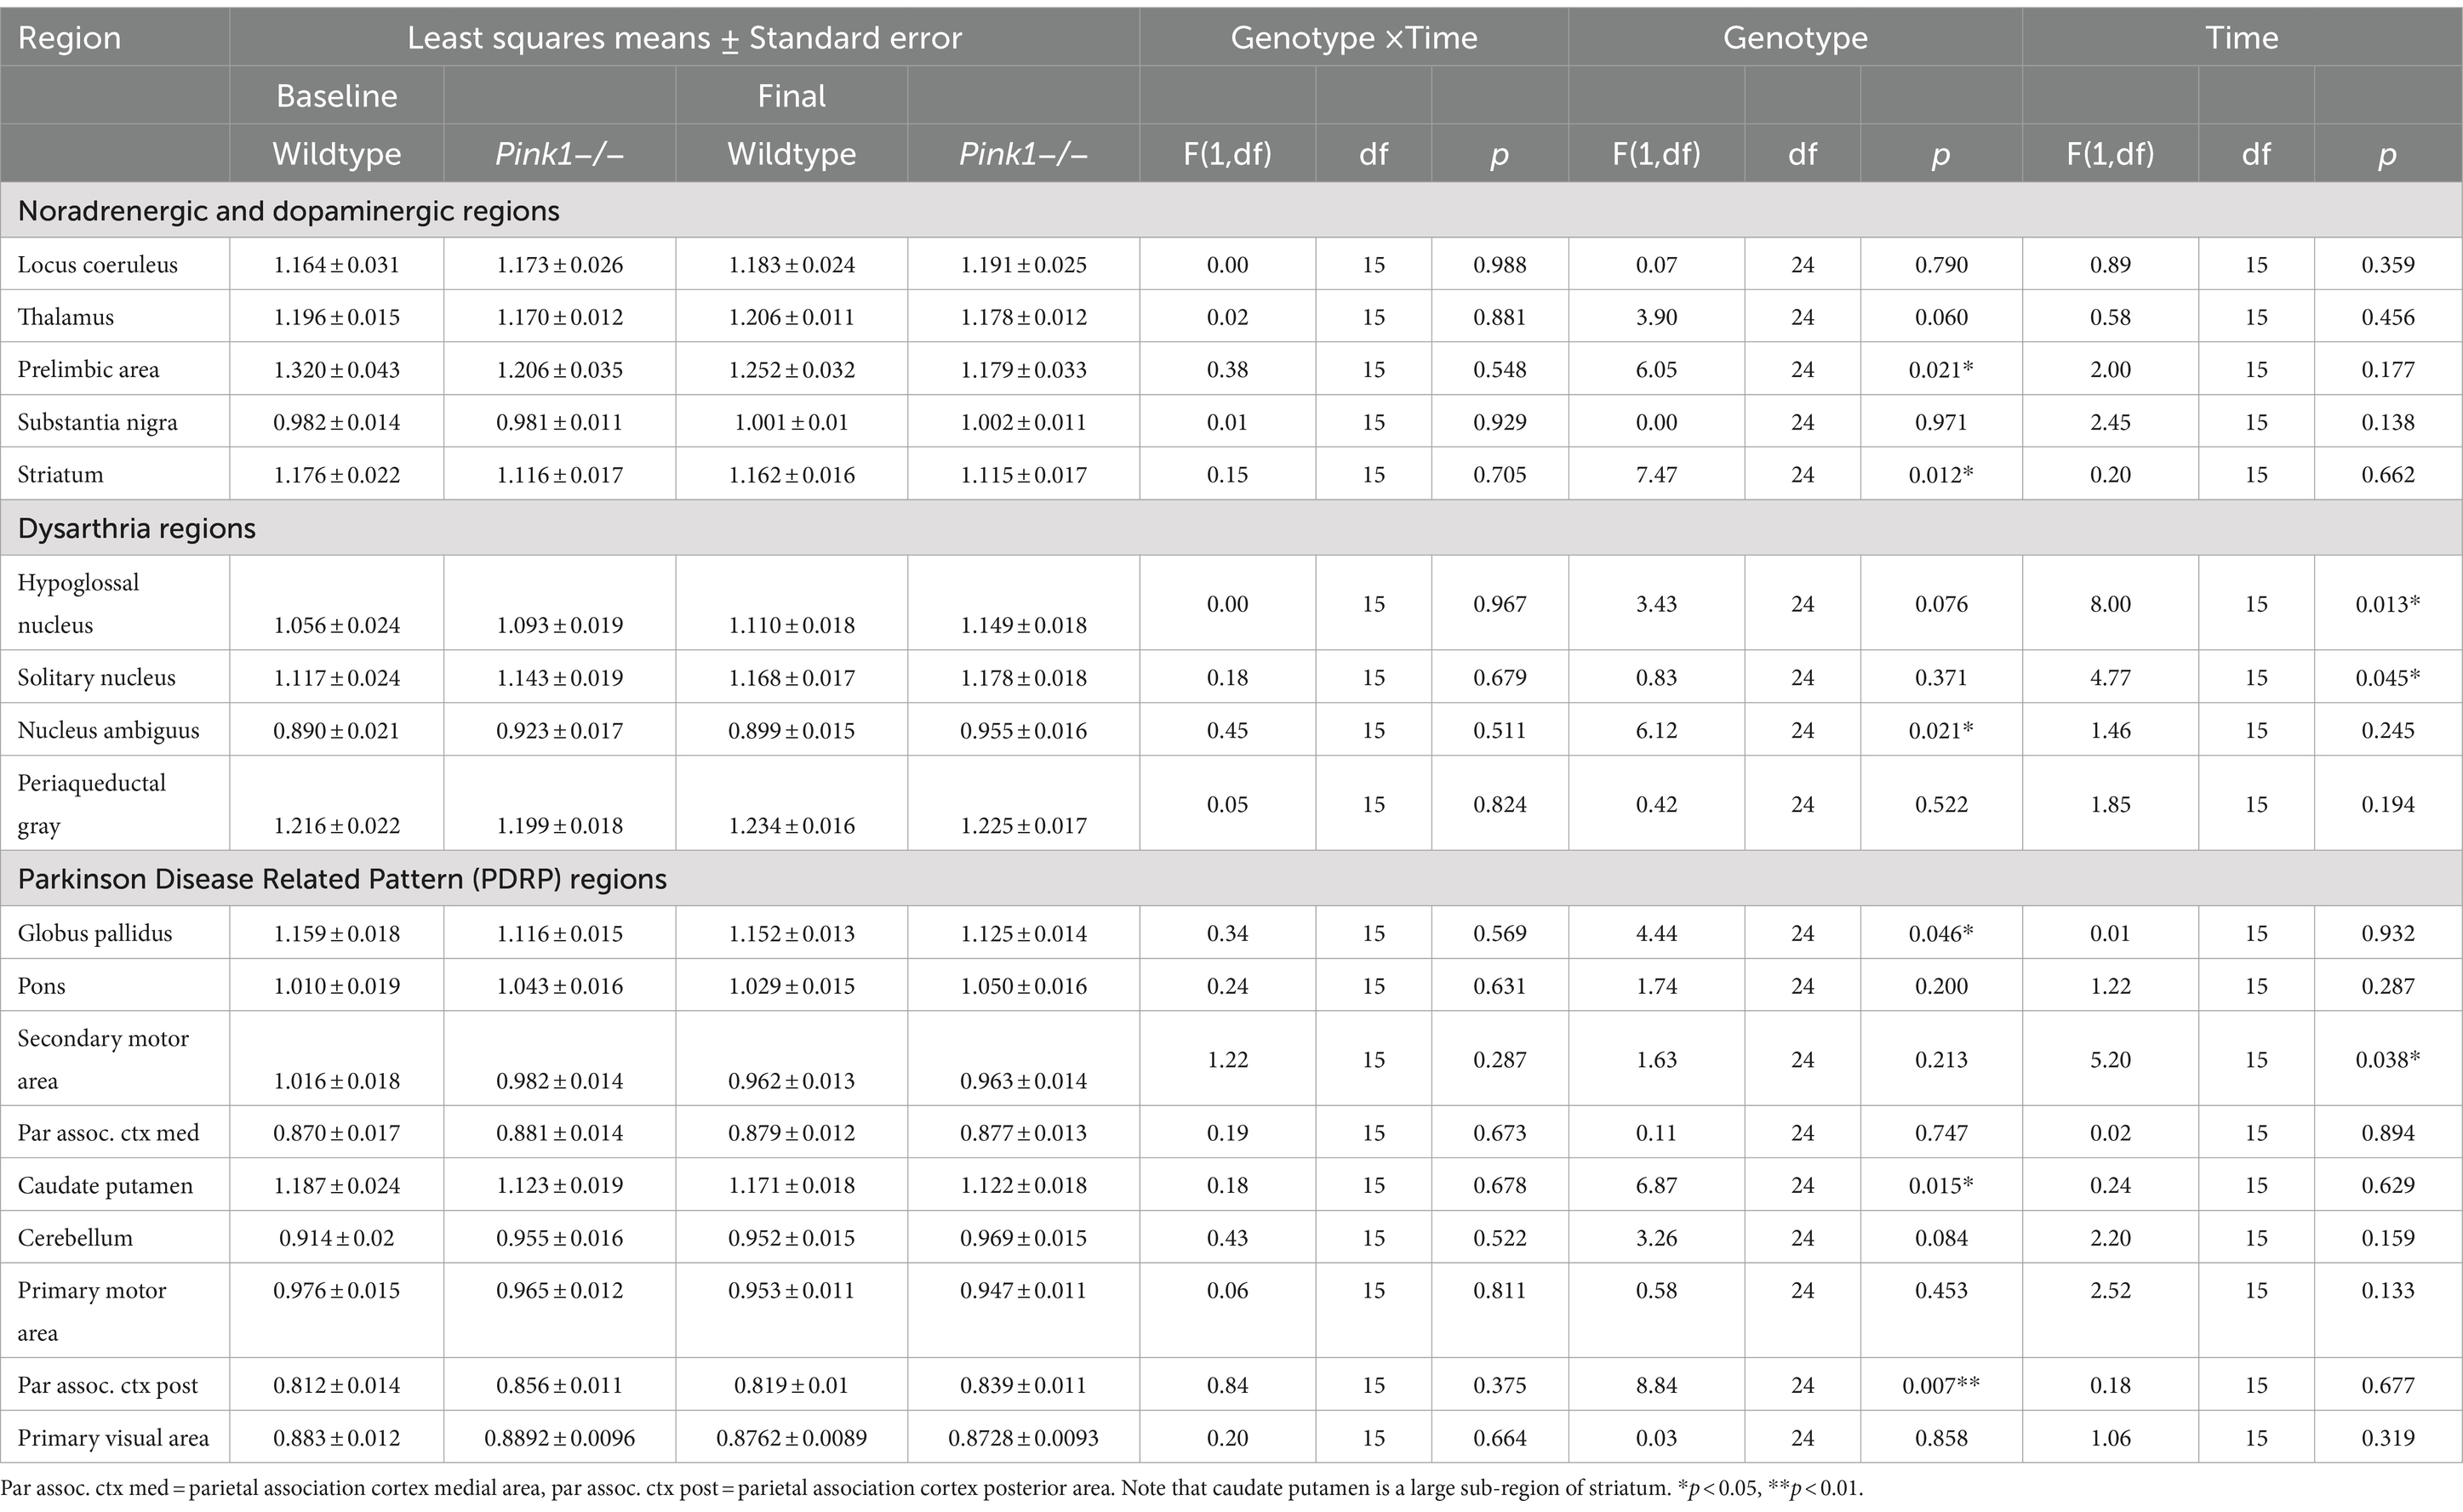
Table 2. PET FDG measures.
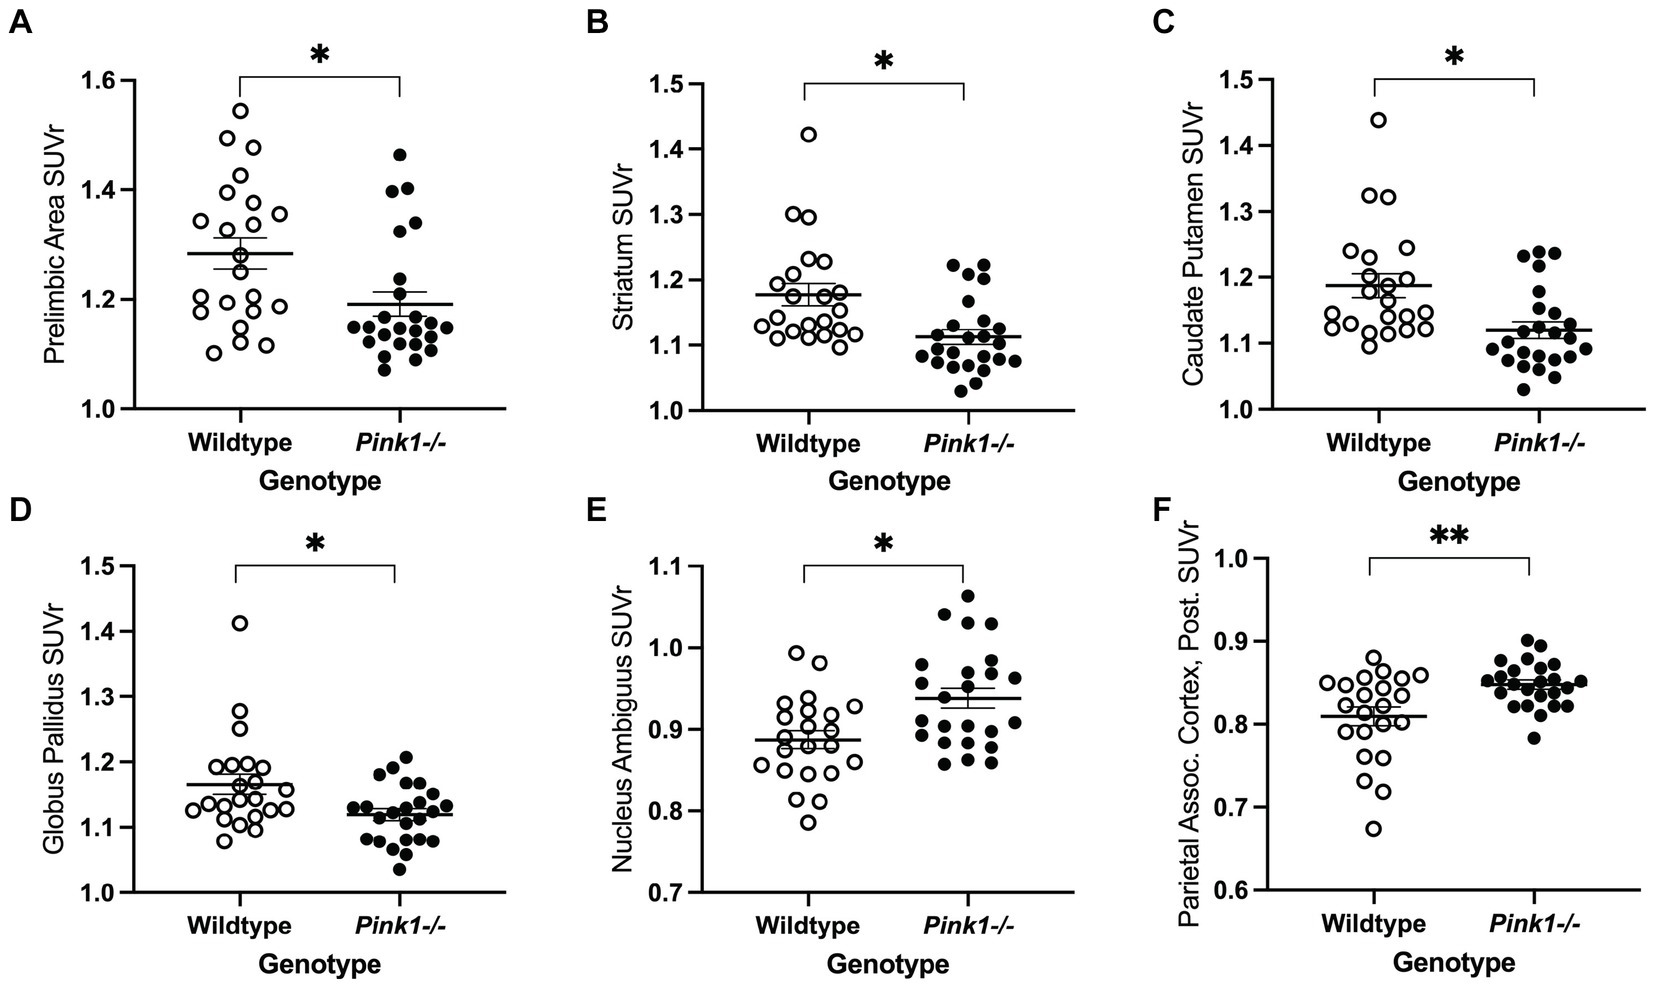
Figure 3. PET main effect of genotype was observed in six brain regions. Whole brain normalized FDG uptake (SUVr) was reduced in Pink1−/− animals in (A) prelimbic cortex, (B) striatum, (C) caudate putamen, and (D) globus pallidus, and elevated in (E) nucleus ambiguus and (F) the posterior area of the parietal association cortex. White = wildtype rats, black = Pink1−/− rats. Error bars indicate mean ± SEM, *p < 0.05; **p < 0.01.
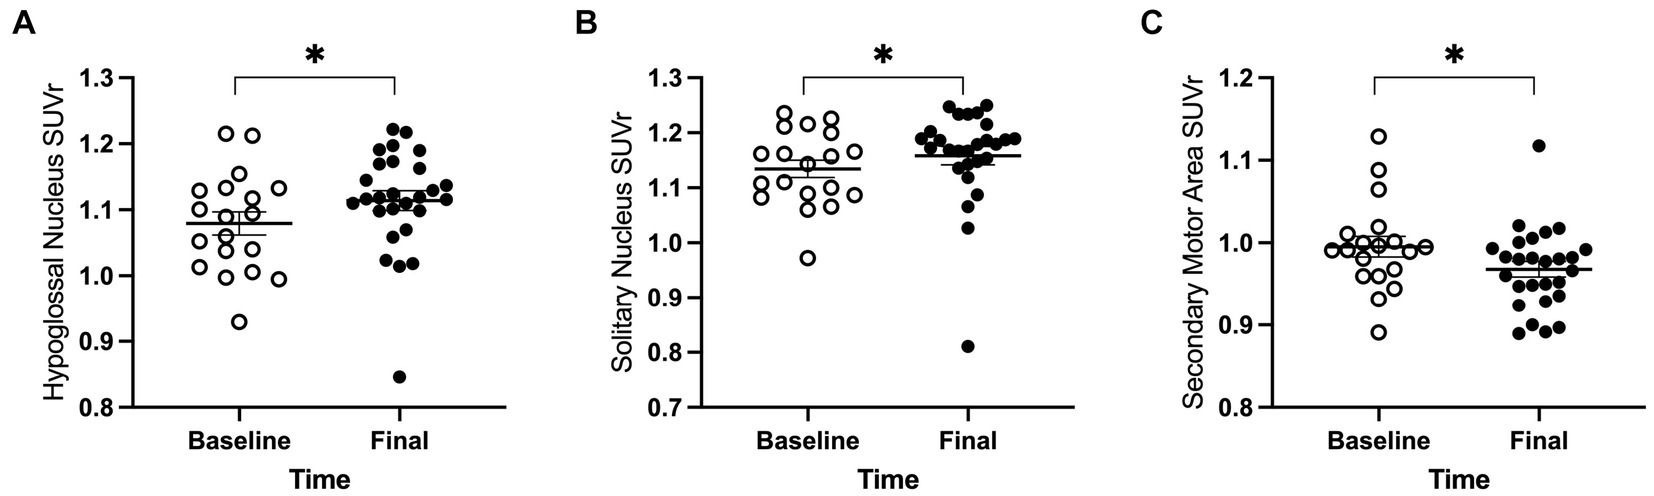
Figure 4. PET main effect of time was observed in three brain regions. The whole brain normalized FDG uptake (SUVr) was greater at the final timepoint in (A) hypoglossal nucleus and (B) solitary nucleus, and lower in (C) secondary motor area. White = baseline, black = final. Error bars indicate mean +/− SEM. *p < 0.05.
3.1.4 Brain map
A voxel-wise statistical map qualitatively confirmed the above ROI analyses, notably indicating reduced FDG uptake relative to whole brain in the Pink1−/− rats in Str and PrL (Figure 5).
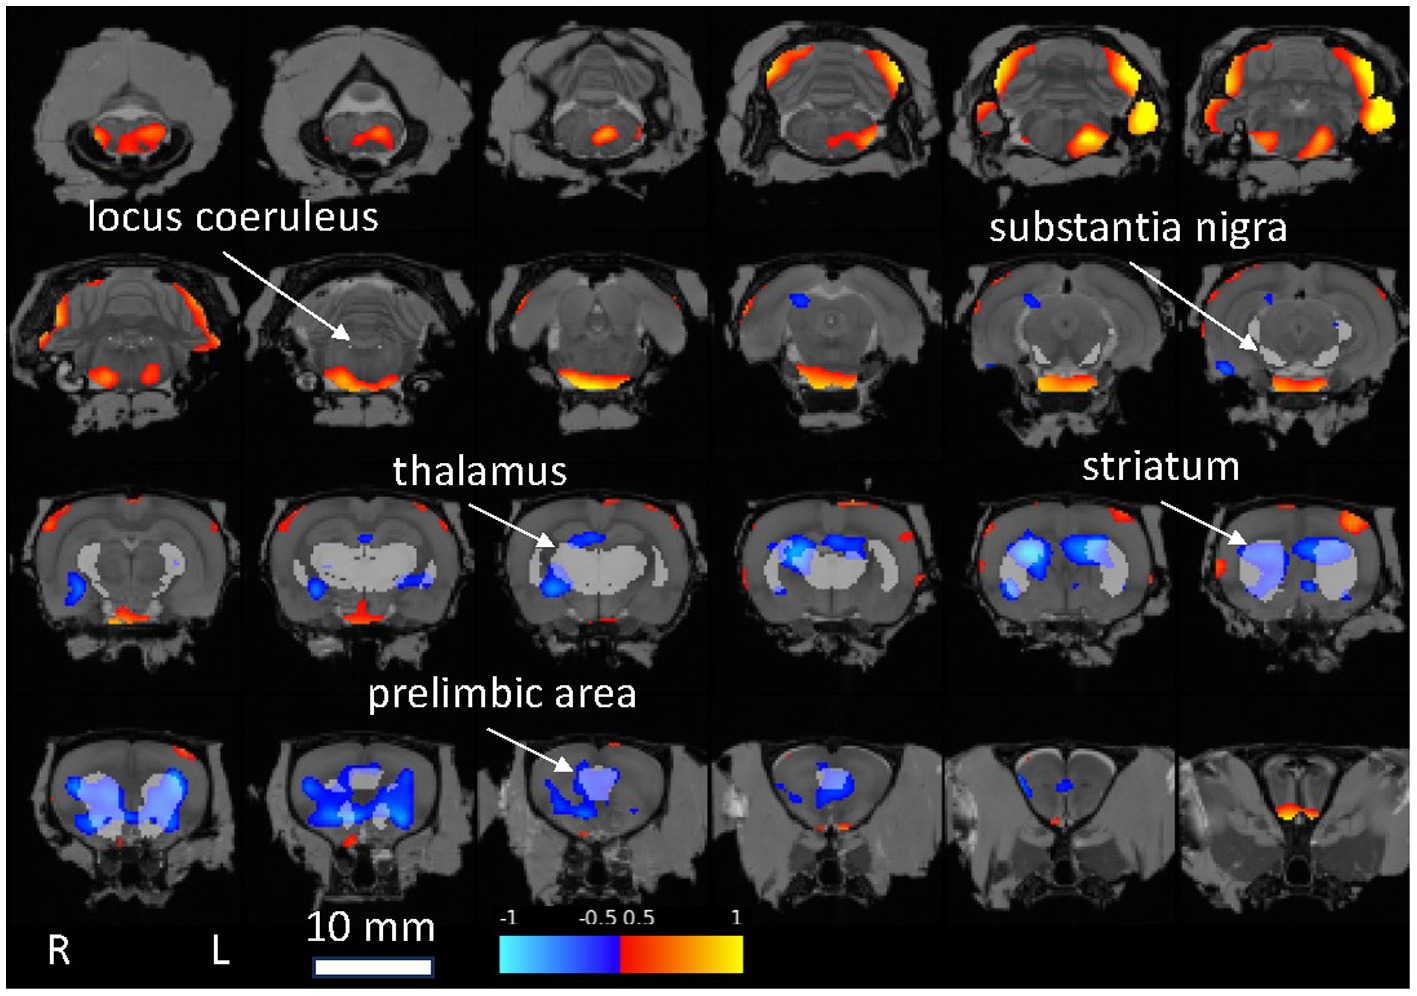
Figure 5. Statistical map showing Pink1−/− whole-brain normalized FDG uptake images compared against wildtype images (two-sample t-test). Red: Pink1−/− > wildtype; blue: Pink1−/− < wildtype (0.05 < |t| < 0.10); 1 mm coronal slices overlaid on MRI template image; gray regions of interest indicated by arrows are anatomically defined noradrenergic (locus coeruleus, thalamus, and prelimbic area) and dopaminergic (substantia nigra, striatum, and prelimbic area) structures.
3.2 Behavioral measures
Linear mixed-effects analyses were applied to the six ultrasonic vocalization measures, four Tapered Balance Beam measures, four Cylinder Test measures, and eight 5-CSRTT measures. As with the PET analyses, genotype and time were treated as fixed effects, and rat as a random effect. These analyses are summarized in Table 3.
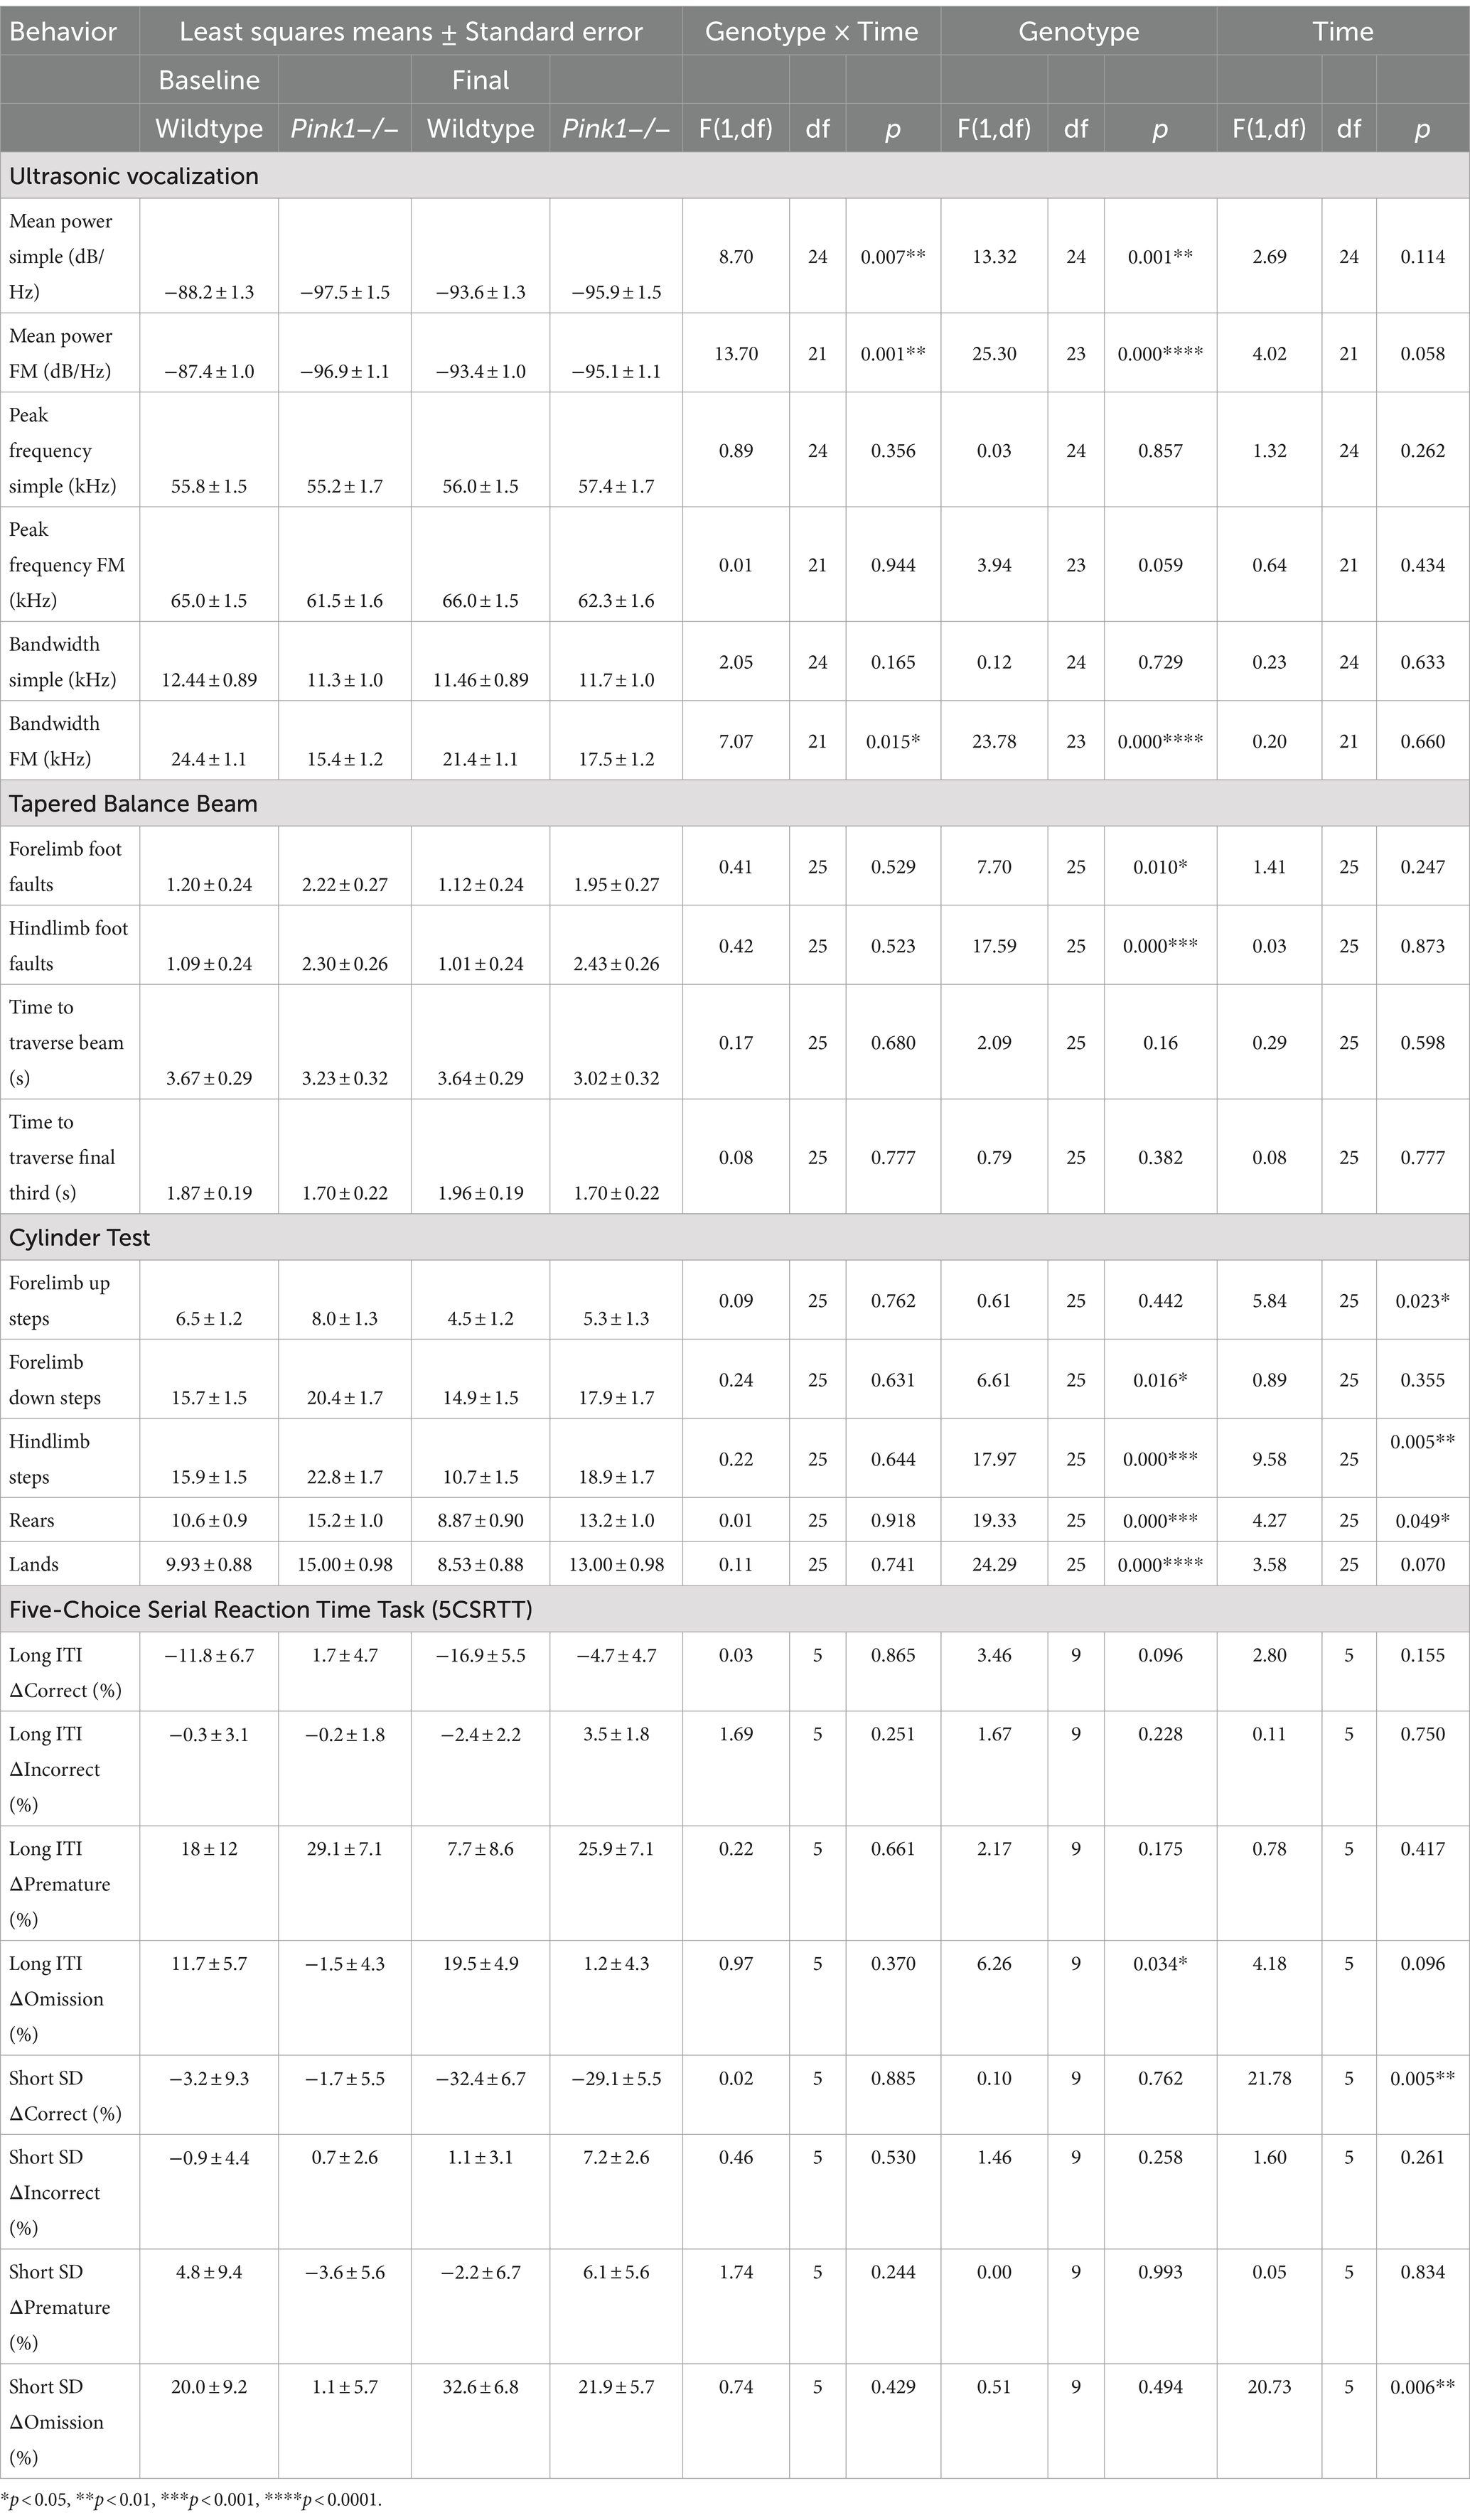
Table 3. Behavioral measures.
3.2.1 Ultrasonic vocalizations
Interactions of genotype and time were observed in three of the USV measures (mean power of simple calls, mean power of FM calls, and bandwidth of FM calls) as illustrated in Figure 6 and detailed here.
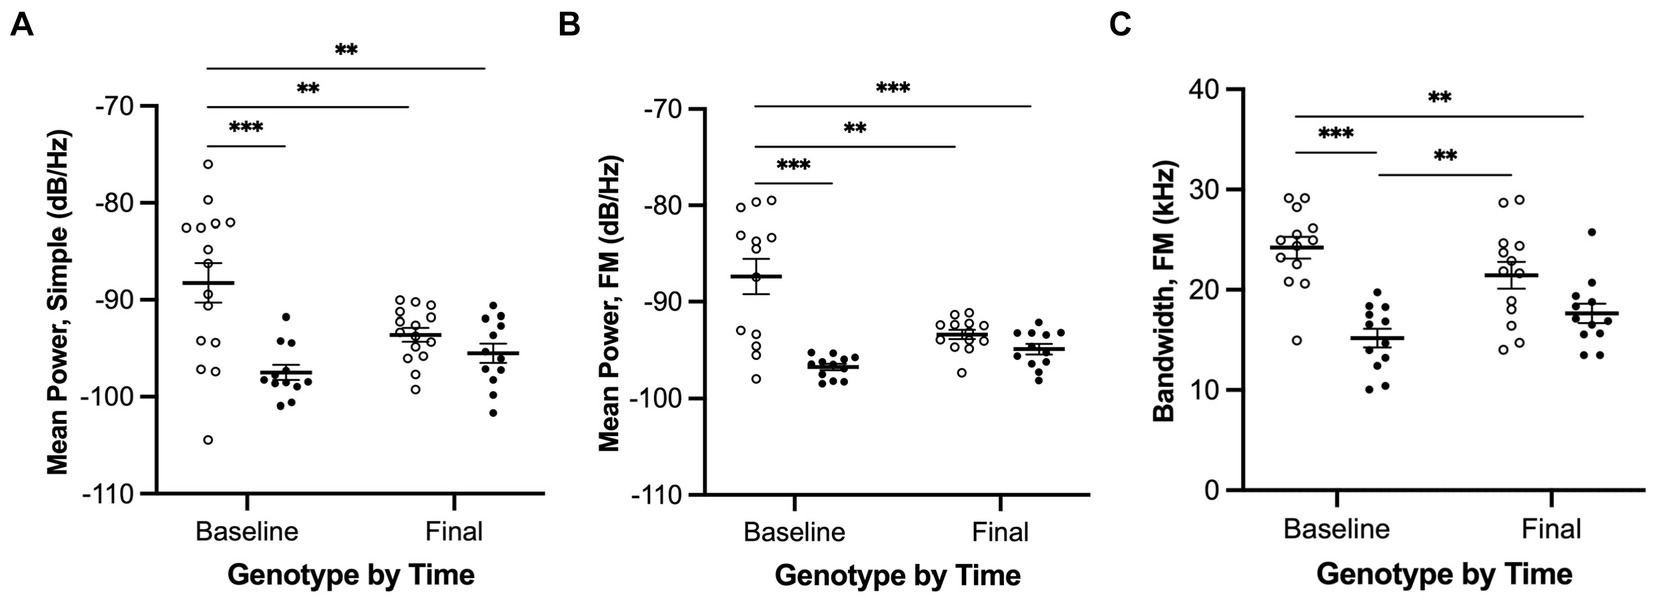
Figure 6. Ultrasonic vocalizations interactions of genotype and time for simple and FM calls. (A) Mean power of simple calls, (B) Mean power of FM calls, and (C) Bandwidth of FM calls. White = wildtype rats; black = Pink1−/− rats. Error bars indicate mean +/− SEM. **p < 0.01, ***p < 0.001.
We observed a significant interaction effect between genotype and time for mean power of simple calls [F(1, 24) = 8.7, p = 0.007, Figure 6A]. Pairwise comparisons revealed that (1) WTs at baseline produced simple calls with greater mean power than WTs at final (p = 0.0087), (2) WTs at baseline produced simple calls with greater mean power than Pink1−/− rats at baseline (p = 0.0005), and (3) WTs at baseline produced simple calls with greater mean power than Pink1−/− rats at final (p = 0.0034).
We observed a significant interaction effect between genotype and time for mean power of FM calls [F(1, 21) = 13.7, p = 0.0013, Figure 6B]. Pairwise comparisons revealed that (1) WTs at baseline produced FM calls with greater mean power than WTs at final (p = 0.0021), (2) WTs at baseline produced FM calls with greater mean power than Pink1−/− rats at baseline (p < 0.0001), and (3) WTs at baseline produced FM calls with greater mean power than Pink1−/− rats at final (p = 0.0003).
We observed a significant interaction effect between time and genotype for bandwidth of FM calls [F(1, 21) = 7.07, p = 0.0147, Figure 6C]. Pairwise comparisons revealed that (1) WTs at baseline produced FM calls with greater bandwidth than Pink1−/− rats at baseline (p = 0.0001), (2) WTs at baseline produced FM calls with greater bandwidth than Pink1−/− rats at final (p = 0.0021), and (3) Pink1−/− rats at baseline produced FM calls with lower bandwidth than WTs at final (p = 0.0069).
3.2.2 Tapered Balance Beam
No interactions of genotype and time were observed. A main effect of genotype was observed in two of the Tapered Balance Beam measures (Figure 7): Pink1−/− rats exhibited greater forelimb [F(1, 25) = 7.70, p = 0.01] and greater hindlimb [F(1, 25) = 17.59, p < 0.001] foot faults.
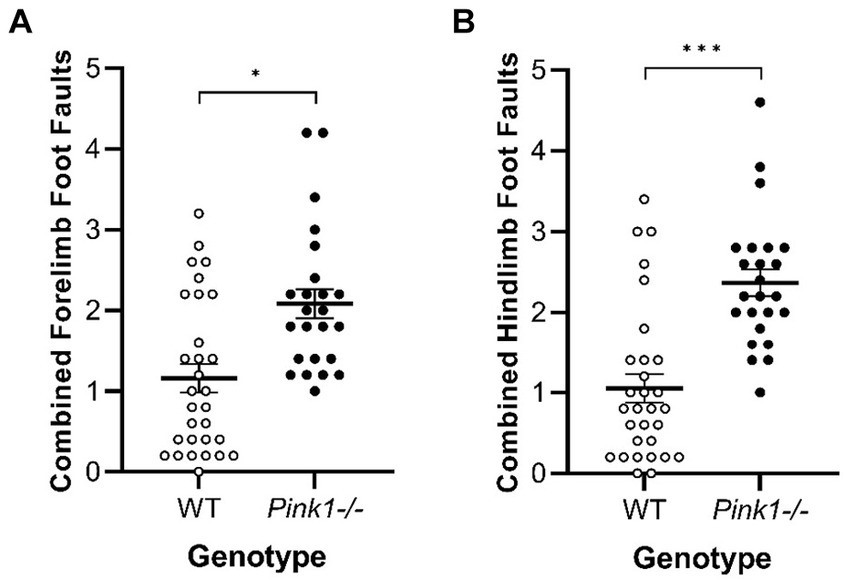
Figure 7. Tapered Balance Beam main effect of genotype. Pink1−/− rats exhibited more (A) forelimb foot faults and (B) hindlimb foot faults. White = wildtype rats; black = Pink1−/− rats. Error bars indicate mean +/− SEM. *p < 0.05; ***p < 0.001.
3.2.3 Cylinder Test
In the Cylinder Test, no interactions of genotype and time were observed. A main effect of genotype was observed in four of the measures (Figure 8) with Pink1−/− rats exhibiting greater numbers of forelimb down steps [F(1, 25) = 6.61, p = 0.016], hindlimb steps [F(1, 25) = 17.97, p < 0.001], rears [F(1, 25) = 19.33, p < 0.001], and lands. A main effect of time was observed with rats exhibiting fewer forelimb up steps, hindlimb steps, and rears at Final (Figure 9).
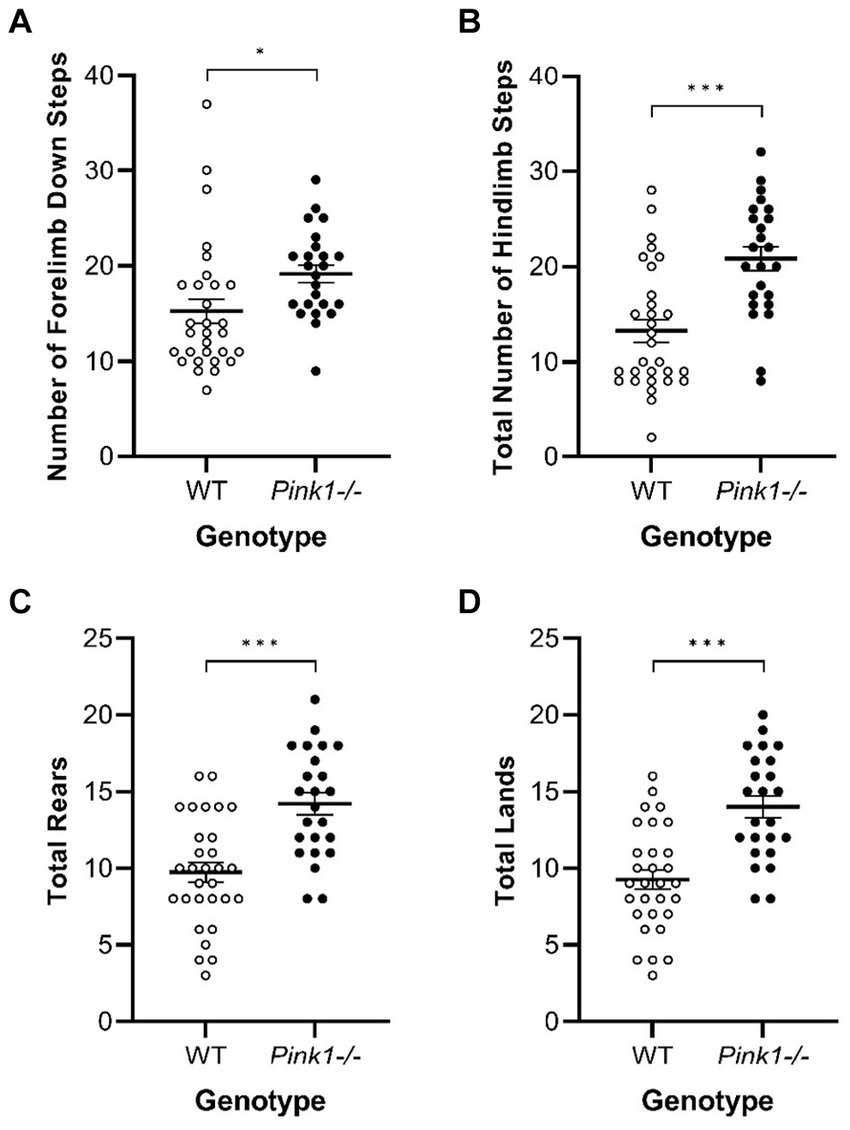
Figure 8. Cylinder Test main effects of genotype. Pink1−/− animals exhibited greater numbers of (A) forelimb down steps, (B) hindlimb steps, (C) rears, and (D) lands. White = wildtype controls, black = Pink1−/− rats. Error bars indicate mean +/− SEM. *p < 0.05; ***p < 0.001.
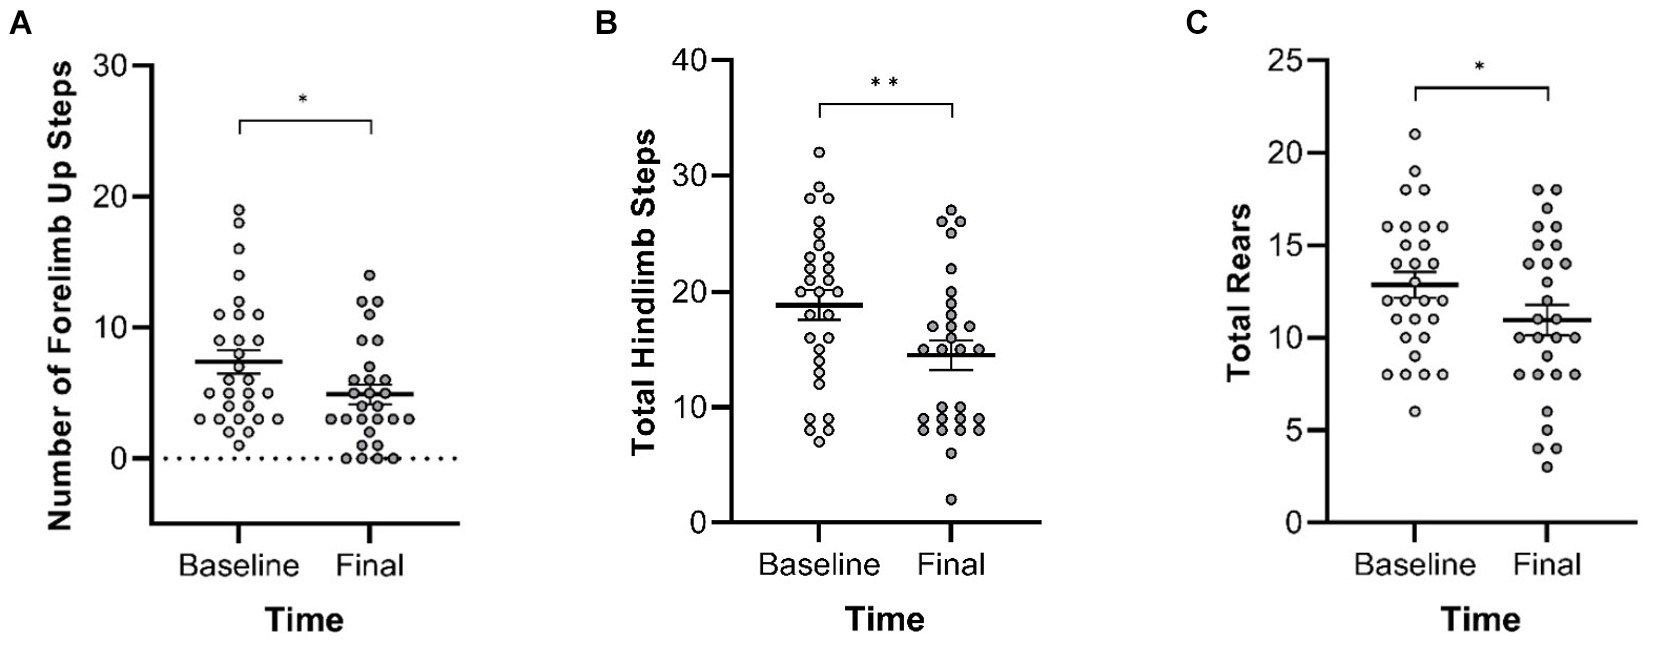
Figure 9. Cylinder Test main effects of time. At the final timepoint, rats exhibited reduced numbers of (A) forelimb up steps, (B) hindlimb steps, and (C) rears. White = baseline; gray = final. Error bars indicate mean +/− SEM. *p < 0.05; **p < 0.01.
3.2.4 Five-Choice Serial Reaction Time Task
A main effect of genotype was observed in the long inter-trial interval omission delta score with Pink1−/− rats exhibiting fewer additional omissions relative to standard trials [F(1, 9) = 6.26, p = 0.034] (Figure 10). Also, main effects of time were observed in short stimulus display delta scores with rats at Final exhibiting fewer correct responses [F(1, 5) = 21.78, p = 0.005] and more omissions [F(1, 5) = 20.73, p = 0.006] (Figure 11).
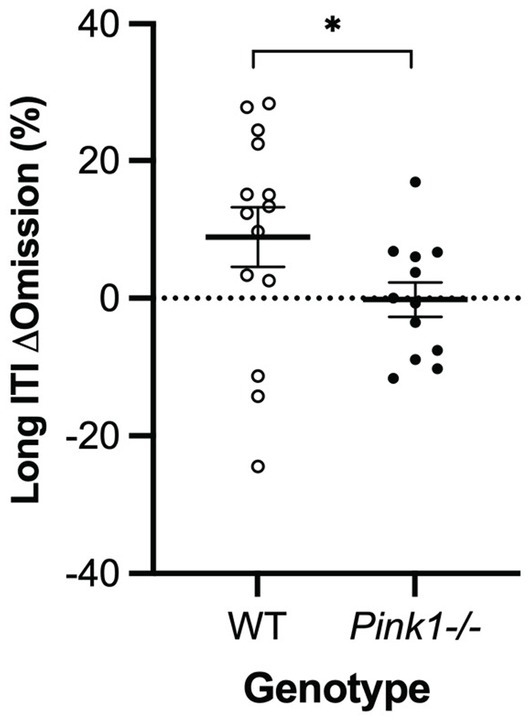
Figure 10. Five-Choice Serial Reaction Time Task long inter-trial interval main effect of genotype. Pink1−/− rats exhibited fewer omissions relative to standard trials. White = wildtype rats; black = Pink1−/− rats. Error bars indicate mean +/− SEM. *p < 0.05.
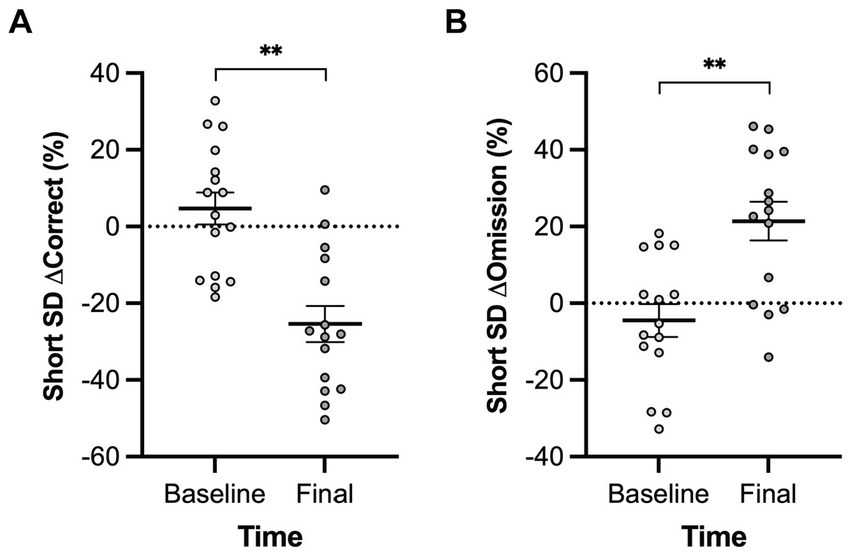
Figure 11. Five-Choice Serial Reaction Time Task short stimulus duration main effect of time. Rats at the final timepoint exhibited (A) fewer correct responses and (B) more omissions relative to standard trials. White = baseline; black = final. Error bars indicate mean +/− SEM. **p < 0.01.
3.3 Relationships between behavioral and PET measures
To examine correlations between behavioral and PET measures, linear mixed effects analyses were applied with behavior as the dependent variable described by a regional FDG uptake x genotype model. Given our overarching interest in norepinephrine, dopamine, and dysarthria, we focused a priori within this exploration on relationships between the six USV measures (mean power, peak frequency, and bandwidth of simple and FM calls) and FDG uptake in the five catecholaminergic regions (LC, Thal, PrL, SN, and Str). An interaction effect (region and genotype) relating peak frequency in simple calls to LC [F(1, 14) = 5.14, p = 0.040] and a main effect of brain region relating mean power of simple calls to SN [F(1, 14) = 5.22, p = 0.038] were revealed (Figure 12).
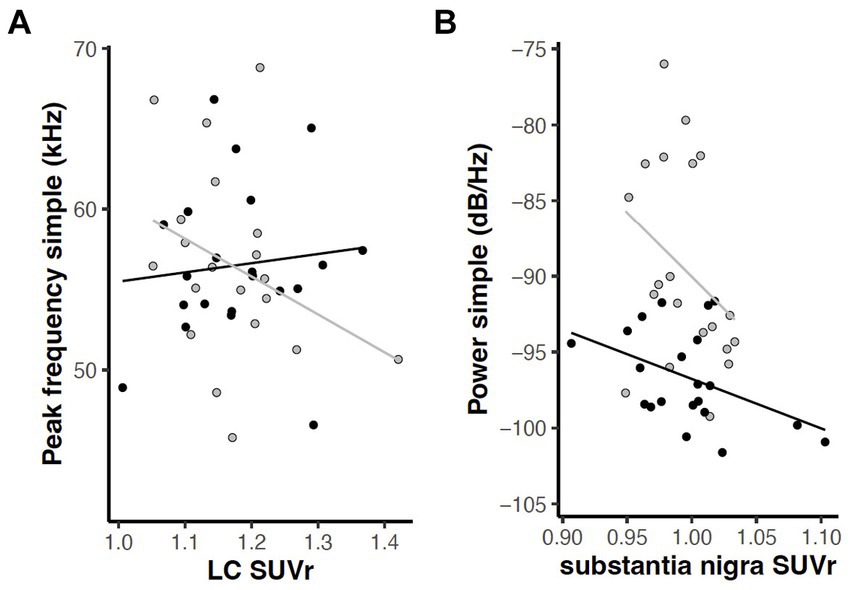
Figure 12. Relations between USV parameters and FDG uptake in catecholaminergic regions (p < 0.05). (A) Interaction of region and genotype in relation of peak frequency of simple calls and locus coeruleus. (B) Main effect of brain region in relation of mean power of simple calls to substantia nigra. Gray = wildtype rats; black = Pink1−/− rats. Lines indicate linear regression by genotype.
Exploring relations between all 23 behavioral measures and 18 brain regions involved 414 tests. Of these, 29 tests yielded significant interactions of region and genotype, and 20 tests yielded significant main effects of region at p < 0.05 (Supplementary Tables S3, S4). To further focus this exploratory analysis, significance was limited to p < 0.005, which two tests would be expected to meet by chance. This yielded five significant interactions of region and genotype, in which Pink1−/− rats exhibited different dependencies of behavior on FDG uptake compared to WT (Supplementary Figure S1). Interactions were observed relating 5-CSRTT long ITI premature responses to nucleus ambiguus [F(1, 10) = 13.83, p = 0.004], Cylinder Test rears to medial parietal cortex [F(1, 15) = 13.73, p = 0.002], Cylinder Test lands to medial parietal cortex [F(1, 15) = 15.37, p = 0.001], USV FM calls peak frequency to cerebellum [F(1, 14) = 11.52, p = 0.004], and USV FM calls peak frequency to motor cortex [F(1, 14) = 18.75, p = 0.0007]. Additionally at p < 0.005 there were two significant main effects of region (Supplementary Figure S2) relating 5-CSRTT long ITI incorrect responses to nucleus ambiguus [F(1, 10) = 14.14, p = 0.004] and Cylinder Test forelimb down to medial parietal cortex [F(1, 15) = 12.24, p = 0.003].
4 Discussion
4.1 FDG PET
This novel application of FDG PET imaging to the Pink1−/− rat model of PD revealed abnormalities in relative glucose metabolism in several regions of interest identified a priori (Table 2) for their associations with catecholaminergic circuits, vocalization, cognition, limb use, and PD (Hypothesis 1).
We observed reduced FDG uptake in Pink1−/− rats in two of the five regions that we focused on because of their roles in the dopaminergic and noradrenergic systems, namely PrL and Str. PrL and Str are rich in dopamine receptors and are involved in motor function regulation (Bamford and Bamford, 2019). As dopaminergic neurons degenerate in PD, there is a change in metabolic activity and glucose utilization in these areas, reflected by altered FDG uptake in PET imaging studies (Eidelberg, 2009; Eggers et al., 2014; Liu et al., 2018; Seiffert et al., 2022). Additionally, in rats PrL is innervated by noradrenergic axons, and degeneration of such projections to homologous regions in PD may contribute to cognitive decline (Miner et al., 2003).
In this study we also found elevated FDG uptake in Pink1−/− rats in the nucleus ambiguus and the posterior area of the parietal association cortex. Elevated FDG uptake in certain brain regions can indicate increased metabolic activity and glucose utilization in those areas. This heightened uptake often reflects physiological or pathological processes such as neuronal activation, synaptic transmission, neuroplasticity, or compensatory mechanisms. In disease, compensatory mechanisms or neuroinflammatory responses may lead to increased glucose metabolism and subsequent FDG uptake in specific brain regions (Teune et al., 2010). The nucleus ambiguus, involved in voice, swallowing, and autonomic functions, may exhibit increased metabolic activity as a compensatory response to dysfunction in other brain regions affected by PD pathology (Schapira et al., 2017; Coon et al., 2018). Moreover, the nucleus ambiguus is innervated by the vagus nerve, which may be one of the earliest implicated pathways in the pathogenesis of PD (Braak et al., 2003; Hawkes et al., 2010; Goedert et al., 2013). The posterior area of the parietal association cortex also showed elevated FDG uptake in this study; this area plays a role in sensory integration and spatial awareness, and may also be compensating for deficits in motor control and sensory processing associated with PD (Isaias et al., 2020). This is in line with the decreased FDG uptake we observed in Pink1−/− rat brain regions involved in motor functioning (i.e., PrL and Str). Enhanced FDG uptake in these regions may reflect adaptive responses aimed at maintaining functional integrity despite dopaminergic neuronal loss or other changes in the pathogenesis of PD.
Contrary to our expectations, we did not observe metabolic differences in LC, despite evidence of altered norepinephrine, tyrosine hydroxylase, and α1 receptors in this structure as reported in our previous work (Kelm-Nelson et al., 2018; Hoffmeister et al., 2021). FDG-PET imaging primarily reflects glucose metabolism and overall neural activity, which may not always directly correlate with specific neurotransmitter changes or receptor alterations. Additionally, changes in norepinephrine levels or receptor expression in the LC may occur without significant alterations in glucose metabolism or FDG uptake, particularly when compensatory mechanisms may be at play. The relationship between catecholamines and metabolic activity in the LC is complex and may involve multiple regulatory mechanisms beyond just glucose metabolism. Therefore, while changes in norepinephrine, tyrosine hydroxylase immunoreactivity, and α1 receptors have been observed, these alterations may not always manifest as detectable changes in FDG uptake in PET imaging studies. Further studies using more specific radiotracers may be helpful to illuminate the roles of dopamine and norepinephrine in Pink1−/− rats.
Regarding the effects of timepoint (Hypothesis 4) in the FDG PET results, we observed no significant difference in the rate of change between Pink1−/− and WT rats, i.e., no interactions of genotype and timepoint. We did, however, observe main effects of timepoint with increased uptake in hypoglossal nucleus and solitary nucleus at final compared to baseline timepoints and decreased uptake in the secondary motor area. These results may reflect changes with age common to both Pink1−/− and WT rats. Six weeks between time points within subject may not have been sufficient to observe additional neurological changes.
4.2 Behavior
We hypothesized a decline in behavioral function in Pink1−/− rats compared to WT rats (Hypothesis 2), and our analyses revealed significant differences in ultrasonic vocalizations, motor performance and coordination, spontaneous motor activity, and cognitive behavior.
4.2.1 Ultrasonic vocalizations
Vocal deficits, dysarthria, and motor speech disorders are common signs during the course of PD and greatly impact vocal communication (Tjaden, 2008; Liss et al., 2009; Bowen et al., 2013; Ciucci et al., 2013; Stepp, 2013; Di Pietro et al., 2022; Rohl et al., 2022). Common vocal deficits are decreased loudness, monotone pitch, and decreased intelligibility (Sapir et al., 2008; Plowman-Prine et al., 2009). The Pink1−/− rat model of PD has been used in the past to investigate vocal deficits (Krasko et al., 2021). Studies revealed that vocal intensity was the most affected acoustic outcome, followed by reduced bandwidth of vocalizations (up to 10 months of age). These findings are highly analogous to clinically presenting reduced loudness and range in patients with PD (for review see Krasko et al., 2021).
In our study, mean power of simple calls and FM calls was reduced at baseline between WT and Pink1−/− rats (Simple∆: −9.22 dB/Hz; FM∆: −9.48 dB/Hz). We furthermore found reduced bandwidth in FM calls between Pink1−/− and WT at baseline (∆: −8.96 kHz), confirming findings from previous studies that investigated early stages of PD (Grant et al., 2015; Krasko et al., 2021). Interestingly, we also found a reduction in mean power in WT rats from baseline to the final timepoint for both simple (∆: 6.05 dB/Hz) and FM (∆: 5.33 dB/Hz) vocalizations, but we could not confirm this for Pink1−/− rats: While we do see a distinct difference in mean power and bandwidth between genotypes at baseline, only WT vocalizations show a decline in mean power over time while Pink1−/− rats remain in about the same intensity range. This significant decrease in mean power in WT rat vocalizations could be attributed to aging, which also has a significant effect on call intensity (Basken et al., 2012), or it could be an effect of habituation and loss of motivation/interest. Here, Pink 1−/− rats might not display pronounced aging effects due to their already heavily impacted mean power at baseline (Simple: −97.45 dB/Hz; FM: −96.86 dB/Hz). It is important to note that our rats varied in age at each timepoint, and testing occurred twice (baseline/final) with all rats generally ranging from 9 to 11 months of age across timepoints, which could have impacted our findings. In a study by Johnson and colleagues, increased intensity in Pink1−/− rats has been described at around 10 months of age with mean power otherwise declining up to this specific timepoint, which has been found in conjunction with increased motor variability at around 10 months of age in Pink1−/− rats (Johnson et al., 2020). The timepoints we chose for this study might have captured a transitioning period that ultimately resulted in no significant differences between baseline and final timepoints in Pink1−/− rats. The decreasing aging/habituation effect on mean power and the increasing disease-related effect on mean power (which typically occurs for Pink1−/− rats at 10-months of age) might have resulted in an overall counter-balancing effect, explaining the steady range of mean power between timepoints in Pink 1−/− rats in our results.
4.2.2 Tapered Balance Beam
Two major hallmark signs in PD are the effects of the disease on motor performance and coordination with more pronounced deficits in motor function and coordination as the disease progresses (Mazzoni et al., 2012; Antony et al., 2013; Moustafa et al., 2016). In this study, we found that motor performance and coordination was impaired in Pink1−/− rats: Pink1−/− rats exhibited a greater number of forelimb and hindlimb foot faults compared to WT controls. Our findings confirm the presence of gross motor deficits that have been described in previous studies using this rat model (Dave et al., 2014; Grant et al., 2015; Marquis et al., 2020; Kelm-Nelson et al., 2021) and similar timepoints (Johnson et al., 2020). The observed motor performance and coordination deficits in the Tapered Balance Beam task did not differ across time, which could be a result of the chosen timepoints where motor deficits might already be pronounced, and further deficiencies might only appear subtly, or the short time period in between tests may not have been sufficient to note significant motor decline.
4.2.3 Cylinder Test
Spontaneous activity was tested via Cylinder Test, and Pink1−/− rats performed more forelimb down steps, hindlimb steps, and rears compared to WT rats. This is consistent with previous findings where 8-month-old Pink1−/− rats demonstrated higher spontaneous activity with an increase in hindlimb movements than WT rats (Grant et al., 2015); another study reported more forelimb movements in young adult Pink1−/− rats when compared with WT rats, without any significant sex differences (Lechner et al., 2022). We also found an overall decrease in the number of forelimb steps, hindlimb steps, and rears over time for both Pink1−/− and WT rats indicating that, regardless of genotype, rats move less as they age. This has previously been observed in female Pink1−/− and female WT rats (Marquis et al., 2020).
4.2.4 Five-Choice Serial Reaction Time Task
In this novel application of the Five-Choice Serial Reaction Time Task with the Pink1−/− rat model, we found a smaller number of omissions in the long inter trial interval (ITI) trials relative to standard trials when compared with WT omissions for the same task. Prima facie, this might be interpreted as better attention in the Pink1−/− rats, but this seems unlikely, and it may instead be a consequence of adaptation to the task in the WT controls (Asinof and Paine, 2014). We also observed a main effect of time in short stimulus display delta scores with rats at the final timepoint exhibiting fewer correct responses and more omissions relative to standard trials regardless of genotype when compared to the baseline scores. This could be an indicator of reduced attention with time, perhaps due to effects of aging or adaptation common to both genotypes (Asinof and Paine, 2014). Due to logistical issues, a subset of only 6 Pink1−/− and 4 WT rats were successfully assessed with the 5-CSRTT, and further work with this test in this model may be warranted.
4.3 Brain-behavior associations
In this study we observed associations between behavioral and PET measures in several brain regions (Hypothesis 3). Notably, relationships were found between vocalization parameters and FDG uptake in LC and SN, regions rich in noradrenergic and dopaminergic cell bodies, respectively. In Pink1−/− rats, the peak frequency of simple calls was seen to increase with LC metabolism, while WT calls decreased with LC metabolism. This may reflect inflammation or compensatory hypermetabolism in LC, where we previously found reduced norepinephrine levels in Pink1−/− rats (Kelm-Nelson et al., 2018). Substantia nigra and nigrostriatal pathway integrity are necessary for 50 kHz vocalization in rats, as has been demonstrated by 6-OHDA infusion in SN and, unilaterally, the medial forebrain bundle (Vecchia et al., 2018; Simola et al., 2021). In this study, the mean power of simple calls decreased with FDG uptake in SN in both Pink1−/− and WT rats. The latter finding suggests that SN integrity or function may be involved in the reduced simple call power we observed in this study in Pink1−/− rats, perhaps reflective of inflammation or a compensatory response to losses elsewhere.
This study revealed genotype differences in several other relationships between behavioral measures and FDG uptake. For example, Pink1−/− rats had positive relationships between rears/lands and FDG uptake in the medial parietal association cortex, while WT rats showed negative relationships for these brain-behaviors. As a compensatory response, Pink1−/− rats may exhibit increased FDG uptake in certain brain regions, including the medial parietal association cortex, as the brain attempts to recruit additional resources or alternative pathways to compensate for impaired function (Reuter-Lorenz and Cappell, 2008; Fettrow et al., 2021). The positive relationship observed between rears/lands and FDG uptake in the medial parietal association cortex in Pink1−/− rats may reflect this compensatory mechanism. In PD, higher FDG uptake in the medial parietal association cortex could indicate increased neural activity or recruitment of additional motor planning resources in response to gait disturbances. This suggests that PD patients may rely more heavily on cortical areas, including the medial parietal association cortex, to compensate for motor deficits. It should be noted, however, that while the increased rears/lands in Pink1−/− rats is interpreted as gait instability, it cannot be stated with certainty that decreased rears/lands in WT rats is an indication of gait stability. This is because we did not make a distinction between time maintaining a rear, and time remaining on all fours; both scenarios would result in decreased rears/lands.
4.4 Limitations
This study was subject to certain limitations. Partial volume effects due to the finite spatial resolution of the PET scanner (2 mm full width at half maximum) limited the certainty of anatomical identification. Due to scanner downtime, the younger group of WT rats were scanned only at the final timepoint. This may have reduced sensitivity to neurodegeneration (genotype × timepoint), especially in the ~9.2 to ~10.6 months sub-range. Further, the relatively short period of time in between testing periods (6 weeks) may not have been sufficient to capture robust neurodegeneration within each sub-range, and variance between the rats in the two sub-ranges may have obscured changes over the combined 9–12 month age range. Typically, studies from our lab test at least 8–12 weeks in between time points. Finally, comparisons of these experimental animal findings and clinical observations of FDG uptake may be complicated by the effects on glucose metabolism of drugs such as L-DOPA in patients and isoflurane anesthesia in rats (Matsumura et al., 2003; Ko et al., 2015; Spangler-Bickell et al., 2016).
5 Conclusion
In conclusion, FDG PET reveals abnormalities in relative regional brain glucose metabolism in Pink1−/− rats in brain regions that are important to cognition, vocalization, and limb motor control that are also impacted by Parkinson disease. This method may be useful for mechanistic studies of behavioral deficits and therapeutic interventions in translational studies in the Pink1−/− PD model.
Data availability statement
The original contributions presented in the study are included in the article/Supplementary material, further inquiries can be directed to the corresponding author.
Ethics statement
The animal study was approved by the University of Wisconsin-Madison Institutional Animal Care and Use Committee. The study was conducted in accordance with the local legislation and institutional requirements.
Author contributions
AC: Conceptualization, Data curation, Formal analysis, Investigation, Methodology, Software, Supervision, Writing – original draft, Writing – review & editing. MK: Investigation, Writing – original draft, Writing – review & editing. DR: Investigation, Writing – original draft, Writing – review & editing. CL: Investigation, Writing – review & editing. AN: Investigation, Writing – review & editing. MS: Investigation, Writing – review & editing. JS: Investigation, Project administration, Writing – review & editing. AH: Writing – review & editing. GL: Formal analysis, Writing – review & editing. CG: Writing – review & editing. MC: Conceptualization, Funding acquisition, Supervision, Writing – review & editing.
Funding
The author(s) declare that financial support was received for the research, authorship, and/or publication of this article. This work was supported by NIH NIDCD R01DC018584 (MC), F31DC022161 (MK), and NIH NICHD P50HD105353.
Acknowledgments
The authors are grateful to the UW-Madison laboratory animal veterinary staff.
Conflict of interest
The authors declare that the research was conducted in the absence of any commercial or financial relationships that could be construed as a potential conflict of interest.
Publisher’s note
All claims expressed in this article are solely those of the authors and do not necessarily represent those of their affiliated organizations, or those of the publisher, the editors and the reviewers. Any product that may be evaluated in this article, or claim that may be made by its manufacturer, is not guaranteed or endorsed by the publisher.
Supplementary material
The Supplementary material for this article can be found online at: https://www.frontiersin.org/articles/10.3389/fnins.2024.1451118/full#supplementary-material
Footnotes
References
Aarsland, D., Creese, B., Politis, M., Chaudhuri, K. R., Ffytche, D. H., Weintraub, D., et al. (2017). Cognitive decline in Parkinson disease. Nat. Rev. Neurol. 13, 217–231. doi: 10.1038/nrneurol.2017.27
Anandhan, A., Jacome, M. S., Lei, S., Hernandez-Franco, P., Pappa, A., Panayiotidis, M. I., et al. (2017). Metabolic dysfunction in Parkinson’s disease: bioenergetics, redox homeostasis and central Carbon metabolism. Brain Res. Bull. 133, 12–30. doi: 10.1016/j.brainresbull.2017.03.009
Antony, P. M. A., Diederich, N. J., Krüger, R., and Balling, R. (2013). The hallmarks of Parkinson’s disease. FEBS J. 280, 5981–5993. doi: 10.1111/febs.12335
Asinof, S. K., and Paine, T. A. (2014). The 5-Choice Serial Reaction Time Task: a task of attention and impulse control for rodents. J. Vis. Exp. 90:e51574. doi: 10.3791/51574
Bamford, I. J., and Bamford, N. S. (2019). The Striatum’s role in executing rational and irrational economic behaviors. Neuroscientist 25, 475–490. doi: 10.1177/1073858418824256
Bari, A., Dalley, J. W., and Robbins, T. W. (2008). The application of the 5-Choice Serial Reaction Time Task for the assessment of visual attentional processes and impulse control in rats. Nat. Protoc. 3, 759–767. doi: 10.1038/nprot.2008.41
Basken, J. N., Connor, N. P., and Ciucci, M. R. (2012). Effect of aging on ultrasonic vocalizations and laryngeal sensorimotor neurons in rats. Exp. Brain Res. 219, 351–361. doi: 10.1007/s00221-012-3096-6
Berg, D., Adler, C. H., Bloem, B. R., Chan, P., Gasser, T., Goetz, C. G., et al. (2018). Movement disorder society criteria for clinically established early Parkinson’s disease. Mov. Disord. 33, 1643–1646. doi: 10.1002/mds.27431
Bialy, M., Rydz, M., and Kaczmarek, L. (2000). Precontact 50-kHz vocalizations in male rats during acquisition of sexual experience. Behav. Neurosci. 114, 983–990. doi: 10.1037//0735-7044.114.5.983
Bloem, B. R., Okun, M. S., and Klein, C. (2021). Parkinson’s disease. Lancet 397, 2284–2303. doi: 10.1016/S0140-6736(21)00218-X
Bowen, L. K., Hands, G. L., Pradhan, S., and Stepp, C. E. (2013). Effects of Parkinson’s disease on fundamental frequency variability in running speech. J. Med. Speech Lang. Pathol. 21, 235–244
Braak, H., Del Tredici, K., Rüb, U., de Vos, R. A. I., Jansen Steur, E. N. H., and Braak, E. (2003). Staging of brain pathology related to sporadic Parkinson’s disease. Neurobiol. Aging 24, 197–211. doi: 10.1016/s0197-4580(02)00065-9
Broadfoot, C. K., Lenell, C., Kelm-Nelson, C. A., and Ciucci, M. R. (2023). Effects of social isolation on 50-kHz ultrasonic vocalizations, affective state, cognition, and neurotransmitter concentrations in the ventral tegmental and locus coeruleus of adult rats. Behav. Brain Res. 437:114157. doi: 10.1016/j.bbr.2022.114157
Brudzynski, S. M. (2021). Biological functions of rat ultrasonic vocalizations, arousal mechanisms, and call initiation. Brain Sci. 11, 1–44. doi: 10.3390/brainsci11050605
Ciucci, M. R., Grant, L. M., Rajamanickam, E. S. P., Hilby, B. L., Blue, K. V., Jones, C. A., et al. (2013). Early identification and treatment of communication and swallowing deficits in Parkinson disease. Semin. Speech Lang. 34, 185–202. doi: 10.1055/s-0033-1358367
Ciucci, M. R., Vinney, L., Wahoske, E. J., and Connor, N. P. (2010). A translational approach to vocalization deficits and neural recovery after behavioral treatment in Parkinson disease. J. Commun. Disord. 43, 319–326. doi: 10.1016/j.jcomdis.2010.04.004
Coffey, K. R., Marx, R. E., and Neumaier, J. F. (2019). Deep squeak: a deep learning-based system for detection and analysis of ultrasonic vocalizations. Neuropsychopharmacology 44, 859–868. doi: 10.1038/s41386-018-0303-6
Coon, E. A., Cutsforth-Gregory, J. K., and Benarroch, E. E. (2018). Neuropathology of autonomic dysfunction in synucleinopathies. Mov. Disord. 33, 349–358. doi: 10.1002/mds.27186
Cullins, M. J., Lenell, C., Ciucci, M. R., and Connor, N. P. (2023). Changes in ultrasonic vocalizations after unilateral cerebral ischemia in a rat stroke model. Behav. Brain Res. 439:114252. doi: 10.1016/j.bbr.2022.114252
Dai, C., Tan, C., Zhao, L., Liang, Y., Liu, G., Liu, H., et al. (2023). Glucose metabolism impairment in Parkinson’s disease. Brain Res. Bull. 199:110672. doi: 10.1016/j.brainresbull.2023.110672
Dave, K. D., de Silva, S., Sheth, N. P., Ramboz, S., Beck, M. J., Quang, C., et al. (2014). Phenotypic characterization of recessive gene knockout rat models of Parkinson’s disease. Neurobiol. Dis. 70, 190–203. doi: 10.1016/j.nbd.2014.06.009
di Pietro, D. A., Olivares, A., Comini, L., Vezzadini, G., Luisa, A., Petrolati, A., et al. (2022). Voice alterations, dysarthria, and respiratory derangements in patients with Parkinson’s disease. J. Speech Lang. Hear. Res. 65, 3749–3757. doi: 10.1044/2022_JSLHR-21-00539
Dunn, L., Allen, G. F., Mamais, A., Ling, H., Li, A., Duberley, K. E., et al. (2014). Dysregulation of glucose metabolism is an early event in sporadic Parkinson’s disease. Neurobiol. Aging 35, 1111–1115. doi: 10.1016/j.neurobiolaging.2013.11.001
Edison, P., Ahmed, I., Fan, Z., Hinz, R., Gelosa, G., Ray Chaudhuri, K., et al. (2013). Microglia, amyloid, and glucose metabolism in Parkinson’s disease with and without dementia. Neuropsychopharmacology 38, 938–949. doi: 10.1038/npp.2012.255
Eggers, C., Schwartz, F., Pedrosa, D. J., Kracht, L., and Timmermann, L. (2014). Parkinson’s disease subtypes show a specific link between dopaminergic and glucose metabolism in the striatum. PLoS One 9:e96629. doi: 10.1371/journal.pone.0096629
Eidelberg, D. (2009). Metabolic brain networks in neurodegenerative disorders: a functional imaging approach. Trends Neurosci. 32, 548–557. doi: 10.1016/j.tins.2009.06.003
Ferris, C. F., Morrison, T. R., Iriah, S., Malmberg, S., Kulkarni, P., Hartner, J. C., et al. (2018). Evidence of neurobiological changes in the presymptomatic PINK1 knockout rat. J. Parkinsons Dis. 8, 281–301. doi: 10.3233/JPD-171273
Fettrow, T., Hupfeld, K., Tays, G., Clark, D. J., Reuter-Lorenz, P. A., and Seidler, R. D. (2021). Brain activity during walking in older adults: implications for compensatory versus dysfunctional accounts. Neurobiol. Aging 105, 349–364. doi: 10.1016/j.neurobiolaging.2021.05.015
Goedert, M., Spillantini, M. G., Del Tredici, K., and Braak, H. (2013). 100 years of Lewy pathology. Nat. Rev. Neurol. 9, 13–24. doi: 10.1038/nrneurol.2012.242
Grant, L. M., Kelm-Nelson, C. A., Hilby, B. L., Blue, K. V., Paul Rajamanickam, E. S., Pultorak, J. D., et al. (2015). Evidence for early and progressive ultrasonic vocalization and oromotor deficits in a PINK1 gene knockout rat model of Parkinson’s disease. J. Neurosci. Res. 93, 1713–1727. doi: 10.1002/jnr.23625
Hartelius, L., and Svensson, P. (1994). Speech and swallowing symptoms associated with Parkinson’s disease and multiple sclerosis: a survey. Folia Phoniatr. Logop. 46, 9–17. doi: 10.1159/000266286
Hawkes, C. H., Del Tredici, K., and Braak, H. (2010). A timeline for Parkinson’s disease. Parkinsonism Relat. Disord. 16, 79–84. doi: 10.1016/j.parkreldis.2009.08.007
Ho, A. K., Bradshaw, J. L., and Iansek, R. (2008). For better or worse: the effect of levodopa on speech in Parkinson’s disease. Mov. Disord. 23, 574–580. doi: 10.1002/mds.21899
Hoffmeister, J. D., Broadfoot, C. K., Schaen-Heacock, N. E., Lechner, S. A., Krasko, M. N., Nisbet, A. F., et al. (2024). Vocal and tongue exercise in early to mid-stage Parkinson disease using the Pink1−/− rat. Brain Res. 1837:148958. doi: 10.1016/j.brainres.2024.148958
Hoffmeister, J. D., Kelm-Nelson, C. A., and Ciucci, M. R. (2021). Quantification of brainstem norepinephrine relative to vocal impairment and anxiety in the Pink1−/− rat model of Parkinson disease. Behav. Brain Res. 414:113514. doi: 10.1016/j.bbr.2021.113514
Hoffmeister, J. D., Kelm-Nelson, C. A., and Ciucci, M. R. (2022). Manipulation of vocal communication and anxiety through pharmacologic modulation of norepinephrine in the Pink1−/− rat model of Parkinson disease. Behav. Brain Res. 418:113642. doi: 10.1016/j.bbr.2021.113642
Holson, R. R., Cogan, J. E., and Adams, J. (2001). Gestational retinoic acid exposure in the rat: effects of sex, strain and exposure period. Neurotoxicol. Teratol. 23, 147–156. doi: 10.1016/s0892-0362(01)00133-7
Isaias, I. U., Brumberg, J., Pozzi, N. G., Palmisano, C., Canessa, A., Marotta, G., et al. (2020). Brain metabolic alterations herald falls in patients with Parkinson’s disease. Ann. Clin. Transl. Neurol. 7, 579–583. doi: 10.1002/acn3.51013
Jenkinson, M., Bannister, P., Brady, M., and Smith, S. (2002). Improved optimization for the robust and accurate linear registration and motion correction of brain images. Neuroimage 17, 825–841. doi: 10.1016/s1053-8119(02)91132-8
Johnson, A. M., Ciucci, M. R., and Connor, N. P. (2013). Vocal training mitigates age-related changes within the vocal mechanism in old rats. J. Gerontol. A Biol. Sci. Med. Sci. 68, 1458–1468. doi: 10.1093/gerona/glt044
Johnson, R. A., Kelm-Nelson, C. A., and Ciucci, M. R. (2020). Changes to ventilation, vocalization, and thermal nociception in the Pink1−/− rat model of Parkinson’s disease. J. Parkinsons Dis. 10, 489–504. doi: 10.3233/JPD-191853
Kalf, J. G., de Swart, B. J. M., Bloem, B. R., and Munneke, M. (2012). Prevalence of oropharyngeal dysphagia in Parkinson’s disease: a meta-analysis. Parkinsonism Relat. Disord. 18, 311–315. doi: 10.1016/j.parkreldis.2011.11.006
Kelm-Nelson, C. A., Lechner, S. A., Lettenberger, S. E., Kaldenberg, T. A. R., Pahapill, N. K., Regenbaum, A., et al. (2021). Pink1(−/−) rats are a useful tool to study early Parkinson disease. Brain Commun. 3:fcab077. doi: 10.1093/braincomms/fcab077
Kelm-Nelson, C. A., Trevino, M. A., and Ciucci, M. R. (2018). Quantitative analysis of Catecholamines in the Pink1−/− rat model of early-onset Parkinson’s disease. Neuroscience 379, 126–141. doi: 10.1016/j.neuroscience.2018.02.027
Kleven, H., Bjerke, I. E., Clascá, F., Groenewegen, H. J., Bjaalie, J. G., and Leergaard, T. B. (2023). Waxholm space atlas of the rat brain: a 3D atlas supporting data analysis and integration. Nat. Methods 20, 1822–1829. doi: 10.1038/s41592-023-02034-3
Ko, J. H., Lerner, R. P., and Eidelberg, D. (2015). Effects of levodopa on regional cerebral metabolism and blood flow. Mov. Disord. 30, 54–63. doi: 10.1002/mds.26041
Konnova, E. A., and Swanberg, M. (2018). “Animal models of Parkinson’s disease” in Parkinson’s disease: pathogenesis and clinical aspects. eds. T. B. Stoker and J. C. Greenland (Brisbane).
Krasko, M. N., Hoffmeister, J. D., Schaen-Heacock, N. E., Welsch, J. M., Kelm-Nelson, C. A., and Ciucci, M. R. (2021). Rat models of vocal deficits in Parkinson’s disease. Brain Sci. 11, 1–21. doi: 10.3390/brainsci11070925
Krasko, M. N., Rudisch, D. M., Burdick, R. J., Schaen-Heacock, N. E., Broadfoot, C. K., Nisbet, A. F., et al. (2023a). Dysphagia in Parkinson disease: part II—current treatment options and insights from animal research. Curr. Phys. Med. Rehabil. Rep. 11, 188–198. doi: 10.1007/s40141-023-00393-8
Krasko, M. N., Szot, J., Lungova, K., Rowe, L. M., Leverson, G., Kelm-Nelson, C. A., et al. (2023b). Pink1−/− rats demonstrate swallowing and gastrointestinal dysfunction in a model of prodromal Parkinson disease. Dysphagia 38, 1382–1397. doi: 10.1007/s00455-023-10567-0
Lancelot, S., and Zimmer, L. (2010). Small-animal positron emission tomography as a tool for neuropharmacology. Trends Pharmacol. Sci. 31, 411–417. doi: 10.1016/j.tips.2010.06.002
Lechner, S. A., Welsch, J. M., Pahapill, N. K., Kaldenberg, T. A. R., Regenbaum, A., and Kelm-Nelson, C. A. (2022). Predictors of prodromal Parkinson’s disease in young adult Pink1−/− rats. Front. Behav. Neurosci. 16:867958. doi: 10.3389/fnbeh.2022.867958
Lin, T. P., Carbon, M., Tang, C., Mogilner, A. Y., Sterio, D., Beric, A., et al. (2008). Metabolic correlates of subthalamic nucleus activity in Parkinson’s disease. Brain 131, 1373–1380. doi: 10.1093/brain/awn031
Liss, J. M., White, L., Mattys, S. L., Lansford, K., Lotto, A. J., Spitzer, S. M., et al. (2009). Quantifying speech rhythm abnormalities in the dysarthrias. J. Speech Lang. Hear. Res. 52, 1334–1352. doi: 10.1044/1092-4388(2009/08-0208)
Liu, F.-T., Ge, J.-J., Wu, J.-J., Wu, P., Ma, Y., Zuo, C.-T., et al. (2018). Clinical, dopaminergic, and metabolic correlations in Parkinson disease: a dual-tracer PET study. Clin. Nucl. Med. 43, 562–571. doi: 10.1097/RLU.0000000000002148
Logemann, J. A., Fisher, H. B., Boshes, B., and Blonsky, E. R. (1978). Frequency and cooccurrence of vocal tract dysfunctions in the speech of a large sample of Parkinson patients. J. Speech Hear. Disord. 43, 47–57. doi: 10.1044/jshd.4301.47
Marquis, J. M., Lettenberger, S. E., and Kelm-Nelson, C. A. (2020). Early-onset parkinsonian behaviors in female Pink1−/− rats. Behav. Brain Res. 377:112175. doi: 10.1016/j.bbr.2019.112175
Matsumura, A., Mizokawa, S., Tanaka, M., Wada, Y., Nozaki, S., Nakamura, F., et al. (2003). Assessment of microPET performance in analyzing the rat brain under different types of anesthesia: comparison between quantitative data obtained with microPET and ex vivo autoradiography. Neuroimage 20, 2040–2050. doi: 10.1016/j.neuroimage.2003.08.020
Mazzoni, P., Shabbott, B., and Cortés, J. C. (2012). Motor control abnormalities in Parkinson’s disease. Cold spring Harb. Perspect. Med. 2:a009282. doi: 10.1101/cshperspect.a009282
Meles, S. K., Renken, R. J., Pagani, M., Teune, L. K., Arnaldi, D., Morbelli, S., et al. (2020). Abnormal pattern of brain glucose metabolism in Parkinson’s disease: replication in three European cohorts. Eur. J. Nucl. Med. Mol. Imaging 47, 437–450. doi: 10.1007/s00259-019-04570-7
Miner, L. H., Schroeter, S., Blakely, R. D., and Sesack, S. R. (2003). Ultrastructural localization of the norepinephrine transporter in superficial and deep layers of the rat prelimbic prefrontal cortex and its spatial relationship to probable dopamine terminals. J. Comp. Neurol. 466, 478–494. doi: 10.1002/cne.10898
Moustafa, A. A., Chakravarthy, S., Phillips, J. R., Gupta, A., Keri, S., Polner, B., et al. (2016). Motor symptoms in Parkinson’s disease: a unified framework. Neurosci. Biobehav. Rev. 68, 727–740. doi: 10.1016/j.neubiorev.2016.07.010
National Institutes of Health Guide for the Care and Use of Laboratory Animals (2011). Guide for the care and use of laboratory animals. 8th Edn. Washington, DC: National Academies Press.
Nikolaus, S., Beu, M., Wirrwar, A., Vosberg, H., Muller, H. W., and Larisch, R. (2004). The contribution of small animal positron emission tomography to the neurosciences - a critical evaluation. Rev. Neurosci. 15, 131–156. doi: 10.1515/REVNEURO.2004.15.2.131
O’Callaghan, C., and Lewis, S. J. G. (2017). Cognition in Parkinson’s disease. Int. Rev. Neurobiol. 133, 557–583. doi: 10.1016/bs.irn.2017.05.002
Papp, E. A., Leergaard, T. B., Calabrese, E., Johnson, G. A., and Bjaalie, J. G. (2014). Waxholm space atlas of the Sprague Dawley rat brain. Neuroimage 97, 374–386. doi: 10.1016/j.neuroimage.2014.04.001
Paxinos, G., and Watson, C. (1998). The rat brain in stereotaxic coordinates. San Diego: Academic Press.
Percie du Sert, N., Hurst, V., Ahluwalia, A., Alam, S., Avey, M. T., Baker, M., et al. (2020). The ARRIVE guidelines 2.0: updated guidelines for reporting animal research. J. Cereb. Blood Flow Metab. 40, 1769–1777. doi: 10.1177/0271678X20943823
Pflug, C., Bihler, M., Emich, K., Niessen, A., Nienstedt, J. C., Flügel, T., et al. (2018). Critical dysphagia is common in Parkinson disease and occurs even in early stages: a prospective cohort study. Dysphagia 33, 41–50. doi: 10.1007/s00455-017-9831-1
Plowman-Prine, E. K., Okun, M. S., Sapienza, C. M., Shrivastav, R., Fernandez, H. H., Foote, K. D., et al. (2009). Perceptual characteristics of parkinsonian speech: a comparison of the pharmacological effects of levodopa across speech and non-speech motor systems. NeuroRehabilitation 24, 131–144. doi: 10.3233/NRE-2009-0462
Quinn, P. M. J., Moreira, P. I., Ambrósio, A. F., and Alves, C. H. (2020). PINK1/PARKIN signalling in neurodegeneration and neuroinflammation. Acta Neuropathol. Commun. 8:189. doi: 10.1186/s40478-020-01062-w
Real, C. C., Binda, K. H., Thomsen, M. B., Lillethorup, T. P., Brooks, D. J., and Landau, A. M. (2023). Selecting the best animal model of Parkinson’s disease for your research purpose: insight from in vivo PET imaging studies. Curr. Neuropharmacol. 21, 1241–1272. doi: 10.2174/1570159x21666230216101659
Reuter-Lorenz, P. A., and Cappell, K. A. (2008). Neurocognitive aging and the compensation hypothesis. Curr. Dir. Psychol. Sci. 17, 177–182. doi: 10.1111/j.1467-8721.2008.00570.x
Robbins, T. W. (2002). The 5-Choice Serial Reaction Time Task: behavioural pharmacology and functional neurochemistry. Psychopharmacology 163, 362–380. doi: 10.1007/s00213-002-1154-7
Rohl, A., Gutierrez, S., Johari, K., Greenlee, J., Tjaden, K., and Roberts, A. (2022). Speech dysfunction, cognition, and Parkinson’s disease. Prog. Brain Res. 269, 153–173. doi: 10.1016/bs.pbr.2022.01.017
Rudisch, D. M., Krasko, M. N., Barnett, D. G. S., Mueller, K. D., Russell, J. A., Connor, N. P., et al. (2023a). Early ultrasonic vocalization deficits and related thyroarytenoid muscle pathology in the transgenic TgF344-AD rat model of Alzheimer’s disease. Front. Behav. Neurosci. 17:1294648. doi: 10.3389/fnbeh.2023.1294648
Rudisch, D. M., Krasko, M. N., Burdick, R., Broadfoot, C. K., Rogus-Pulia, N., and Ciucci, M. R. (2023b). Dysphagia in Parkinson disease: part I-pathophysiology and diagnostic practices. Curr. Phys. Med. Rehabil. Rep. 11, 176–187. doi: 10.1007/s40141-023-00392-9
Sapir, S., Ramig, L., and Fox, C. (2008). Speech and swallowing disorders in Parkinson disease. Curr. Opin. Otolaryngol. Head Neck Surg. 16, 205–210. doi: 10.1097/MOO.0b013e3282febd3a
Schapira, A. H. V., Chaudhuri, K. R., and Jenner, P. (2017). Non-motor features of Parkinson disease. Nat. Rev. Neurosci. 18, 435–450. doi: 10.1038/nrn.2017.62
Seiffert, A. P., Gómez-Grande, A., Alonso-Gómez, L., Méndez-Guerrero, A., Villarejo-Galende, A., Gómez, E. J., et al. (2022). Differences in striatal metabolism in [(18)F]FDG PET in Parkinson’s disease and atypical parkinsonism. Diagnostics 13, 1–10. doi: 10.3390/diagnostics13010006
Seppi, K., Ray Chaudhuri, K., Coelho, M., Fox, S. H., Katzenschlager, R., Perez Lloret, S., et al. (2019). Update on treatments for nonmotor symptoms of Parkinson’s disease-an evidence-based medicine review. Mov. Disord. 34, 180–198. doi: 10.1002/mds.27602
Simola, N., Serra, M., Marongiu, J., Costa, G., and Morelli, M. (2021). Increased emissions of 50-kHz ultrasonic vocalizations in hemiparkinsonian rats repeatedly treated with dopaminomimetic drugs: a potential preclinical model for studying the affective properties of dopamine replacement therapy in Parkinson’s disease. Prog. Neuro-Psychopharmacol. Biol. Psychiatry 108:110184. doi: 10.1016/j.pnpbp.2020.110184
Skodda, S., Visser, W., and Schlegel, U. (2010). Short-and long-term dopaminergic effects on dysarthria in early Parkinson’s disease. J. Neural Transm. (Vienna) 117, 197–205. doi: 10.1007/s00702-009-0351-5
Soto, I., Nejtek, V. A., Siderovski, D. P., and Salvatore, M. F. (2024). PINK1 knockout rats show premotor cognitive deficits measured through a complex maze. Front. Neurosci. 18:1390215. doi: 10.1101/2024.01.18.576285
Spangler-Bickell, M. G., de Laat, B., Fulton, R., Bormans, G., and Nuyts, J. (2016). The effect of isoflurane on (18)F-FDG uptake in the rat brain: a fully conscious dynamic PET study using motion compensation. EJNMMI Res. 6:86. doi: 10.1186/s13550-016-0242-3
Stepp, C. E. (2013). Relative fundamental frequency during vocal onset and offset in older speakers with and without Parkinson’s disease. J. Acoust. Soc. Am. 133, 1637–1643. doi: 10.1121/1.4776207
Suttrup, I., and Warnecke, T. (2016). Dysphagia in Parkinson’s disease. Dysphagia 31, 24–32. doi: 10.1007/s00455-015-9671-9
Teune, L. K., Bartels, A. L., de Jong, B. M., Willemsen, A. T. M., Eshuis, S. A., de Vries, J. J., et al. (2010). Typical cerebral metabolic patterns in neurodegenerative brain diseases. Mov. Disord. 25, 2395–2404. doi: 10.1002/mds.23291
Teune, L. K., Renken, R. J., de Jong, B. M., Willemsen, A. T., van Osch, M. J., Roerdink, J. B. T. M., et al. (2014). Parkinson’s disease-related perfusion and glucose metabolic brain patterns identified with PCASL-MRI and FDG-PET imaging. Neuroimage Clin. 5, 240–244. doi: 10.1016/j.nicl.2014.06.007
Tjaden, K. (2008). Speech and swallowing in Parkinson’s disease. Top. Geriatr. Rehabil. 24, 115–126. doi: 10.1097/01.TGR.0000318899.87690.44
Vecchia, D. D., Kanazawa, L. K. S., Wendler, E., De Almeida Soares Hocayen, P., Bruginski, E., Campos, F. R., et al. (2018). Effects of ketamine on vocal impairment, gait changes, and anhedonia induced by bilateral 6-OHDA infusion into the substantia nigra pars compacta in rats: therapeutic implications for Parkinson’s disease. Behav. Brain Res. 342, 1–10. doi: 10.1016/j.bbr.2017.12.041
Keywords: Parkinson disease, Pink1−/− rat model, positron emission tomography, [18F]fluorodeoxyglucose, ultrasonic vocalizations, Five-Choice Serial Reaction Time Task, Tapered Balance Beam, Cylinder Test
Citation: Converse AK, Krasko MN, Rudisch DM, Lunaris CL, Nisbet AF, Slesarev MS, Szot JC, Hoerst AG, Leverson GE, Gallagher CL and Ciucci MR (2024) Positron emission tomography neuroimaging of [18F]fluorodeoxyglucose uptake and related behavior in the Pink1−/− rat model of Parkinson disease. Front. Neurosci. 18:1451118. doi: 10.3389/fnins.2024.1451118
Edited by:
Muthuraju Sangu, Universiti Sains Malaysia Health Campus, MalaysiaReviewed by:
Arshiya Parveen, Houston Methodist Research Institute, United StatesSajeev Sridhar, Houston Methodist Research Institute, United States
Copyright © 2024 Converse, Krasko, Rudisch, Lunaris, Nisbet, Slesarev, Szot, Hoerst, Leverson, Gallagher and Ciucci. This is an open-access article distributed under the terms of the Creative Commons Attribution License (CC BY). The use, distribution or reproduction in other forums is permitted, provided the original author(s) and the copyright owner(s) are credited and that the original publication in this journal is cited, in accordance with accepted academic practice. No use, distribution or reproduction is permitted which does not comply with these terms.
*Correspondence: Alexander K. Converse, YWxleGFuZGVyLmNvbnZlcnNlQHdpc2MuZWR1
†Present addresses: Charlie Lenell Lunaris, Department of Communication Science and Disorders, University of Northern Colorado, Greeley, CO, United StatesAlex F. Nisbet, Perelman School of Medicine, University of Pennsylvania, Philadelphia, PA, United States