
94% of researchers rate our articles as excellent or good
Learn more about the work of our research integrity team to safeguard the quality of each article we publish.
Find out more
ORIGINAL RESEARCH article
Front. Neurosci., 26 February 2024
Sec. Neurogenomics
Volume 18 - 2024 | https://doi.org/10.3389/fnins.2024.1258996
This article is part of the Research TopicMultifaceted Genes in Amyotrophic Lateral Sclerosis-Frontotemporal Dementia Volume IIView all 5 articles
 Iris J. Broce1,2*
 Daniel W. Sirkis1
 Ryan M. Nillo3
 Luke W. Bonham1,3
 Suzee E. Lee1
 Bruce L. Miller1
 Patricia A. Castruita1
 Virginia E. Sturm1,4
 Leo S. Sugrue3
 Rahul S. Desikan3
 Jennifer S. Yokoyama1,3,4*
Introduction: A hexanucleotide repeat expansion (HRE) intronic to chromosome 9 open reading frame 72 (C9orf72) is recognized as the most common genetic cause of amyotrophic lateral sclerosis (ALS), frontotemporal dementia (FTD), and ALS-FTD. Identifying genes that show similar regional co-expression patterns to C9orf72 may help identify novel gene targets and biological mechanisms that mediate selective vulnerability to ALS and FTD pathogenesis.
Methods: We leveraged mRNA expression data in healthy brain from the Allen Human Brain Atlas to evaluate C9orf72 co-expression patterns. To do this, we correlated average C9orf72 expression values in 51 regions across different anatomical divisions (cortex, subcortex, and cerebellum) with average gene expression values for 15,633 protein-coding genes, including 54 genes known to be associated with ALS, FTD, or ALS-FTD. We then performed imaging transcriptomic analyses to evaluate whether the identified C9orf72 co-expressed genes correlated with patterns of cortical thickness in symptomatic C9orf72 pathogenic HRE carriers (n = 19) compared to controls (n = 23). Lastly, we explored whether genes with significant C9orf72 imaging transcriptomic correlations (i.e., “C9orf72 imaging transcriptomic network”) were enriched in specific cell populations in the brain and enriched for specific biological and molecular pathways.
Results: A total of 2,120 genes showed an anatomical distribution of gene expression in the brain similar to C9orf72 and significantly correlated with patterns of cortical thickness in C9orf72 HRE carriers. This C9orf72 imaging transcriptomic network was differentially expressed in cell populations previously implicated in ALS and FTD, including layer 5b cells, cholinergic neurons in the spinal cord and brainstem and medium spiny neurons of the striatum, and was enriched for biological and molecular pathways associated with protein ubiquitination, autophagy, cellular response to DNA damage, endoplasmic reticulum to Golgi vesicle-mediated transport, among others.
Conclusion: Considered together, we identified a network of C9orf72 associated genes that may influence selective regional and cell-type-specific vulnerabilities in ALS/FTD.
Frontotemporal dementia (FTD) and amyotrophic lateral sclerosis (ALS) are neurodegenerative disorders that have overlapping clinical, genetic, and neuropathological features. FTD is the most common form of dementia diagnosed in people younger than 65 years old and is characterized by changes in social behavior and/or language abilities due to neurodegeneration of the frontal and temporal lobes. Depending on the signs and symptoms, FTD patients are classified into one of three different syndromes: behavioral variant FTD (bvFTD) or one of two forms of primary progressive aphasias (PPA), including non-fluent variant PPA (nfvPPA) and semantic variant PPA (svPPA). ALS is the most common form of adult-onset motor neuron disease (MND) and is characterized by progressive degeneration of both upper motor neurons of the motor cortex and lower motor neurons of the brainstem and spinal cord at disease onset. Although motor neuron damage predominates in ALS, other neuronal populations including within frontal, temporal, and parietal cortical circuits, the basal ganglia, and dorsal root ganglia are also involved in some patients (Rosness et al., 2008; Rabinovici and Miller, 2010; van Vliet et al., 2013; Bang et al., 2015). Although the clinical phenotypes of FTD and ALS can be heterogeneous, about 15% of people with bvFTD, 11% of patients with nfvPPA, and 19% of patients with svPPA may eventually develop motor symptoms consistent with ALS (Rascovsky et al., 2011; Vinceti et al., 2019). Similarly, about 50% of ALS patients develop cognitive and behavioral impairment, with 13% meeting diagnostic criteria for bvFTD (Ljubenkov and Miller, 2016). This clinical overlap may, at least in part, be due to shared neuropathology due to aggregation of TDP-43, which drives MND and around half of frontotemporal lobar degeneration (FTLD) pathology. After decades of research, it is now recognized that a pathogenic hexanucleotide repeat expansion (HRE) intronic to chromosome 9 open reading frame 72 (C9orf72) is the most common genetic cause of ALS, FTD, and ALS combined with FTD (ALS-FTD) (DeJesus-Hernandez et al., 2011; Renton et al., 2011).
The clinical syndromes of FTD and ALS represent the manifestations of underlying neuropathology that results in the dysfunction and death of neurons in specific neuroanatomical regions. For example, individuals with ALS display muscle weakness and wasting because of dysfunction and death of upper and lower motor neurons. C9orf72-FTD typically manifests as bvFTD (Vatsavayai et al., 2019), and anatomically, the cortico-striato-thalamic network (Lee et al., 2014), and medial pulvinar thalamus, specifically, appear to be the primary structures affected (Sha et al., 2012; Yokoyama et al., 2014; Vatsavayai et al., 2016; Bonham et al., 2023). Understanding the genetic landscape of normal C9orf72 - that is, genes that are normally co-expressed with non-expanded C9orf72 - may clarify why certain brain regions are selectively targeted in ALS or FTD (henceforth, ALS/FTD), why some patients may be more likely to develop either ALS/FTD, or both; and which cell-type populations and biological mechanisms are involved.
There is considerable genetic overlap between ALS and FTD. Beyond C9orf72, pathogenic variants in TARDBP, SQSTM1, VCP, FUS, TBK1, CHCHD10, and UBQLN2 (Abramzon et al., 2020) are also closely associated with both diseases. Notably, ALS, FTD, and ALS-FTD patients carrying pathogenic HRE in C9orf72 sometimes carry a second gene mutation previously implicated in ALS or FTD (Gijselinck et al., 2018). Multiple gene abnormalities in C9orf72 HRE carriers have been detected in TARDBP (Chio et al., 2012; Cooper-Knock et al., 2012; van Blitterswijk et al., 2012), TBK1 (Van Mossevelde et al., 2016), FUS (Millecamps et al., 2012; van Blitterswijk et al., 2012), SOD1 (Millecamps et al., 2012; van Blitterswijk et al., 2012), OPTN (Cooper-Knock et al., 2012; Millecamps et al., 2012), ANG (Millecamps et al., 2012), UBQLN2 (Millecamps et al., 2012), DAO (Millecamps et al., 2012), GRN (Ferrari et al., 2012), SQSTM1 (Almeida et al., 2016), and PSEN2 (Cooper-Knock et al., 2012; Ferrari et al., 2012; Van Mossevelde et al., 2016). Thus, the possibility of carrying a C9orf72 HRE and a second ALS/FTD pathogenic variant is likely not random. Specific ALS/FTD genes may be co-expressed and form a functional network in brain regions that are selectively vulnerable to ALS and FTD. Consequently, disruption of these genes, depending on the affected neuroanatomical regions, is likely to influence ALS/FTD-related disease processes. Identifying genes that show similar regional co-expression patterns as C9orf72 may, therefore, help identify novel gene targets, pathways, and biological mechanisms that mediate selective vulnerability to ALS/FTD pathogenesis.
To explore the neuroanatomical basis of shared genetic risk in the FTD/ALS spectrum, we performed gene co-expression analysis to identify genes that show regional co-expression patterns similar to C9orf72, the most common shared genetic contributor to ALS/FTD. We then implemented an imaging transcriptomics approach to evaluate whether the identified C9orf72 co-expressed genes also correlate with patterns of cortical thickness in symptomatic C9orf72 expansion carriers. Lastly, we evaluated whether certain cell populations within the brain may be selectively vulnerable to ALS/FTD pathogenesis.
We investigated co-expression and regional patterns of gene expression in the healthy brain across the cortex, subcortex, and cerebellum using microarray gene expression data from the Allen Human Brain Atlas (AHBA)1, a publicly available microarray dataset widely used for exploration of gene networks in the human brain (Hawrylycz et al., 2012). The microarray data was sampled from six adult human donors (3 White, 2 African American, 1 Hispanic, aged 24−57 years) in roughly 500 tissue samples from each donor, either in the left hemisphere only (n = 4) or in both hemispheres (n = 2). Although the same anatomical regions were sampled in all six donors, both the exact number and position of samples varied among donors. Donors also differed in other characteristics, including cause of death, post-mortem intervals, brain pH, tissue cytoarchitectural integrity, RNA quality, and number of probes used for each gene. Given space constraints, we refer the reader to the original technical white paper for additional details regarding the dissection methods, quality control, and normalization measures taken.2
The AHBA data were preprocessed and mapped to parcellated brain regions using a publicly available “abagen” processing pipeline.3 We applied the recommended default parameters outlined in the original manuscripts (Arnatkeviciute et al., 2019; Markello et al., 2021). Briefly, all available probes (Custom and Agilent) were included in the analyses. Probes that did not exceed background noise in at least 50% of all cortical and subcortical samples across all subjects were excluded. As more than one probe can be available for a single gene, the probe with the higher differential stability score was selected (default parameter). Probe selection was performed for each donor separately. The Montreal Neurological Institute (MNI) coordinates of tissue samples were updated to those generated via non-linear registration using Advanced Normalization Tools (ANTs). Tissue samples were assigned to brain regions in the provided atlas if their MNI coordinates were within 2 mm of a given parcel. To reduce potential misassignment, sample-to-region matching was constrained by hemisphere and gross anatomical divisions (cortex, subcortex/brainstem, and cerebellum). All tissue samples not assigned to a brain region in the provided atlas were discarded. We used the Desikan “aparcaseg” atlas (34 nodes per hemisphere + subcortex) to map tissue samples to cortical and subcortical regions4 (Desikan et al., 2006). We used the Diedrichsen atlas to map tissue samples to cerebellar regions5 (Diedrichsen et al., 2009). Inter-subject variation was addressed by normalizing tissue sample expression values across genes using a robust sigmoid function. Normalized expression values were then rescaled to the unit interval. Gene expression values across genes were normalized separately for each anatomic division (cortex, subcortex, and cerebellum) also using a robust sigmoid function. Samples assigned to the same region were averaged separately for each donor and then across donors. Gene expression values for the same region and gene sampled from both hemispheres from the same donor were averaged.
After implementing the pre-processing and quality control steps outlined above (Figure 1A), gene expression values from 15,633 protein-coding genes from the six donors were included in the analyses. Gene expression values were computed for 51 brain regions (34 cortical regions, 7 subcortical regions, and 10 cerebellar regions).
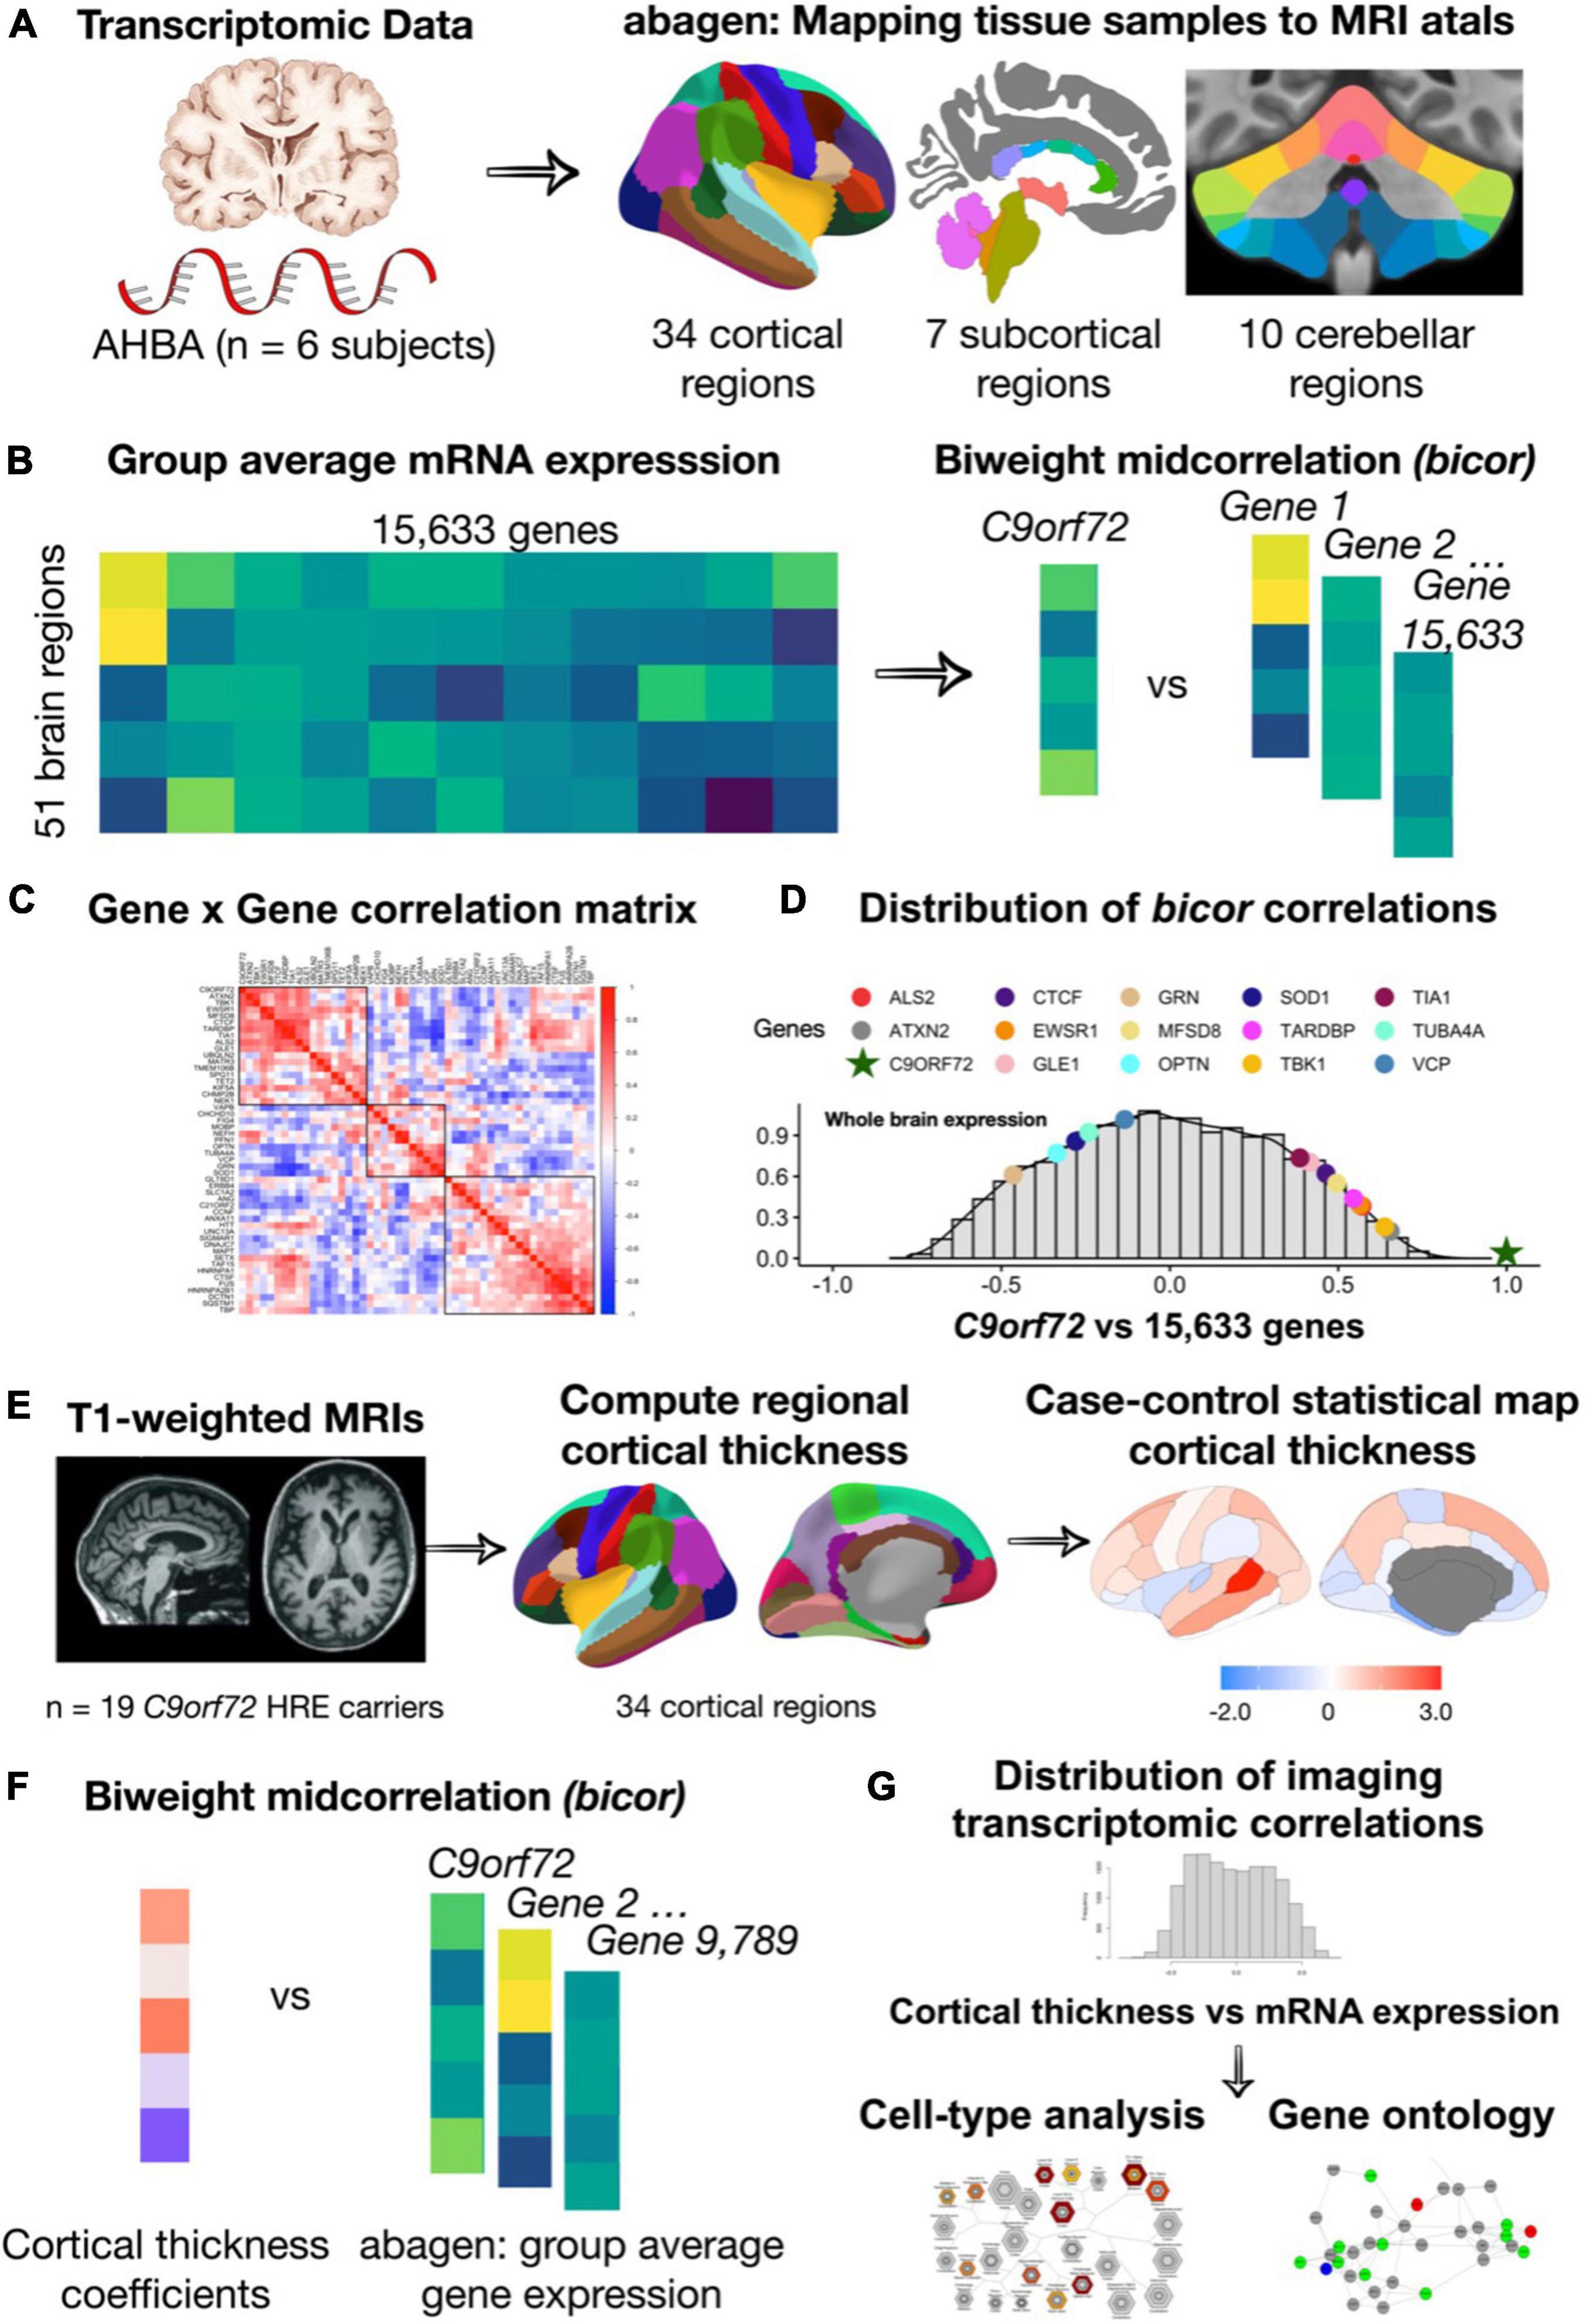
Figure 1. An overview of the methodology used for mapping mRNA gene expression to MRI atlas, estimation of regional gene expression, co-expression gene analysis, gene ontological and cell type analyses. (A) Allen Human Brain Atlas samples of gene expression data were mapped to the 51 brain regions (34 cortical regions, 7 subcortical regions, and 10 cerebellar regions) according to the anatomical parcellations. (B) Samples across the left/right hemisphere for the same region and gene were averaged across donor resulting in average gene expression values for 15,633 protein-coding genes. (C) Using the biweight correlation method, we separately correlated the columns of each expression matrix to generate a 54 × 54 ALS/FTD gene co-expression matrix. (D) We also used the biweight correlation method to correlate average C9orf72 expression values for each region with average expression of all available 15,633 protein-coding genes. Subsequent analysis focused on C9orf72-associated genes, defined as having a correlation value above the absolute value of 0.5. (E) Mean cortical thickness were from 34 cortical regions for patients with C9orf72 hexanucleotide repeat expansions (HRE) compared to controls. (F) Using the biweight correlation method, we correlated the case-control cortical thickness coefficients for each region with average regional expression values for each C9orf72-associated gene. (G) Genes that were significant after permutation testing underwent gene ontological analyses for biological processes and cell-type enrichment analyses.
Median expression values (Log10 transcripts per million) for 10 distinct brain regions (amygdala, anterior cingulate cortex, caudate, cerebellar hemisphere, cerebellum, cortex, frontal cortex, hippocampus, nucleus accumbens, putamen, and substantia nigra) were obtained from the Genotype-Tissue Expression (GTEx) project database for the purpose of independent sample validation. Despite this dataset having lower spatial resolution compared to AHBA, we conducted a general comparison of co-expression patterns across the available regions for genes of interest to substantiate the generalizability of the AHBA expression data. We performed a Mantel test with permutations to examine whether the observed correlation between the two co-expression matrices was statistically significant. The permutation process involved shuffling the data multiple times to establish a null distribution, against which the actual correlation could be compared. P-values were calculated based on how often correlations in the permuted data are observed that are as extreme as, or more extreme than, the observed correlation.
Nineteen symptomatic C9orf72 HRE carriers participated in this study (10 males, 9 females; age range = 48−81 years, mean = 64 years, SD = 10 years). Individuals were recruited from the UCSF Memory and Aging Center (MAC) FTD cohort. C9orf72 HRE carriers were clinically diagnosed with FTD (n = 8), and FTD-ALS/ALS (n = 5), mild cognitive impairment (n = 4), and other (n = 2). For the two patients categorized as other, both showed concerns for motor neuron disease and possibly FTD. Healthy controls included 23 related family members (6 males, 17 females; age range = 28−72 years, mean = 47 years, SD = 13 years). Detailed information on participant inclusion criteria can be found in prior reports (Lee et al., 2014; Bonham et al., 2023). The UCSF Committee on Human Research approved the procedures for all participants. All participants or their surrogates provided informed consent prior to participation.
Genomic DNA was extracted from whole blood according to standard procedures. Participants were identified as carrying a pathogenic HRE in C9orf72 if they harbored >30 hexanucleotide repeats (DeJesus-Hernandez et al., 2011). Participants in this study were negative for pathogenic variants in MAPT and GRN.
All MRI scans were acquired on a 3T MRI scanner at the Neuroscience Imaging Center at UC San Francisco using previously described sequences (Bettcher et al., 2012). A high resolution T1-weighted image was acquired for all participants for structural reference, for the purpose of normalization, and for deriving morphological measures. MRI scans were processed using the FreeSurfer software package, version 6.0 (see text footnote 4) (Fischl, 2012). All images were visually inspected for segmentation accuracy and corrected as needed. We quantified disease burden using morphological measures of cortical thickness, since it provides a more sensitive measure of atrophy than gray matter volume (Winkler et al., 2010; Broce et al., 2023). For participants with multiple scans, the earliest scan with the best quality was selected. For visualization purposes, cortical brain images were generated using the R software statistical package “ggseg,” which allows for plotting brain atlases using simple features.
The R statistical package (version 4.2.2) was used for all statistical analysis. We first evaluated how average C9orf72 expression in each brain region varied across different anatomical divisions: cortex, subcortex, and the cerebellum. One sample t-tests (two-tailed) were conducted to assess which of the 51 brain regions from the six donor samples expressed mRNA to a significantly greater or lesser degree compared to average mRNA expression across the whole brain. To correct for multiple tests, reported p-values were Holm–Bonferroni adjusted. Cohen’s d values for one-sample t-tests were calculated to yield a measure of effect size.
We then evaluated C9orf72 co-expression patterns by correlating average C9orf72 expression values for each region with average expression values from 54 other genes known to cause ALS, FTD, or combined ALS-FTD (Table 1). These genes were selected based on prior reports (Abramzon et al., 2020; Kirola et al., 2022). Two ALS/FTD genes, PRPH (encoding Peripherin), and DAO (encoding D-amino-acid oxidase), were excluded from analyses at the preprocessing stage due to low quality or coverage. We separately correlated the columns of each expression matrix to generate a 54 × 54 gene co-expression matrix, reflecting the relative expression patterns across cortical, subcortical, and cerebellar regions for each gene pair (Figures 1B, C). We used the biweight midcorrelation as the similarity measure. In biweight midcorrelation gene expression, values that are much higher or much lower than the median value are given less weight in the correlation calculation, which makes the method more robust to extreme values and outliers (Langfelder and Horvath, 2008). Clusters were identified to assess co-expression patterns using the complete linkage method (Murtagh and Contreras, 2017).
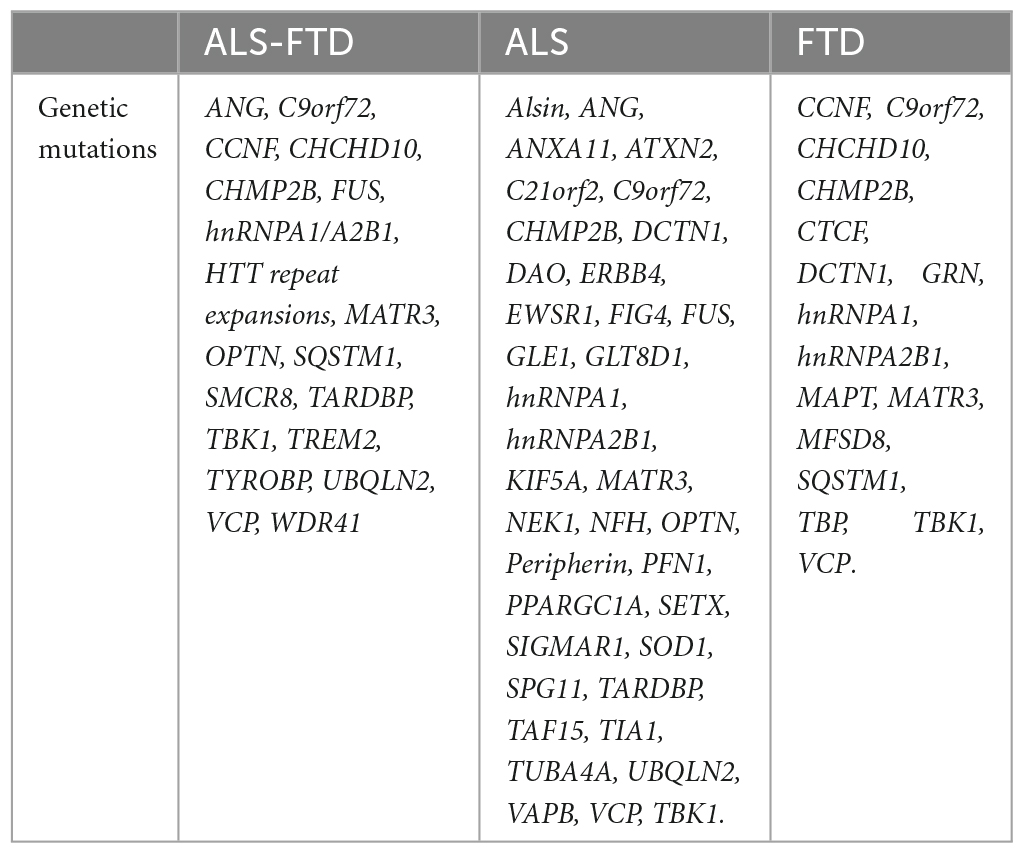
Table 1. These genes were selected based on prior reports (Abramzon et al., 2020; Kirola et al., 2022).
Subsequently, to screen in an unbiased manner for novel genes that are co-expressed with C9orf72, we used the identical procedure described above. We correlated average C9orf72 expression values for each region with average expression of all available 15,633 protein-coding genes (Figures 1B–D). To explore whether C9orf72 co-expression patterns were driven by gene expression differences among the different anatomical divisions (cortex, subcortex, and cerebellum), we repeated the correlation analyses, separately, for each anatomical division. To reduce the influence of non-informative genes on subsequent analyses, genes with correlation values lower than an absolute value of 0.5 were excluded.
A main goal of this study was to identify a network of genes or gene products that may contribute to the regional vulnerability of the human brain to C9orf72 HRE-mediated pathology and, more generally, risk for ALS and FTD. Therefore, we identified correlations between average mRNA expression for each of the C9orf72-co-expressed genes from AHBA and differences in average cortical thickness from symptomatic C9orf72 HRE carriers compared to controls. Since age and sex are known to affect cortical thickness, and the age range within C9orf72 HRE carriers and controls was wide, our analyses controlled for age and sex. We followed established practices in the context of brain disorders to conduct these imaging transcriptomics analyses (Arnatkeviciute et al., 2022). In particular, our approach involved fitting separate linear models for each brain region to extract the estimated coefficients for case-control status on cortical thickness (i.e., C9orf72 HRE carriers versus controls), while also controlling for age and sex. We then correlated the coefficients obtained from the linear models for each region with gene expression across the same regions. To evaluate the significance of these correlations, we performed a permutation test with 10,000 iterations. This approach determines whether the observed imaging transcriptomics correlations differ significantly from what might occur due to chance.
We performed pathway enrichment analysis using the R statistical package “pathfindR” (Ulgen et al., 2019). Since enrichment analysis of a list of significant genes alone may not be informative enough to explain underlying disease mechanisms, we used “pathfindR,” which leverages interaction information from a protein-protein interaction network (PIN) to identify distinct active subnetworks and then perform enrichment analyses on these subnetworks. We preformed pathway enrichment analysis for three gene sets: “KEGG,” “GO-BP,” and “GO-MF” (all for Homo sapiens). For visualization, we plotted the top 30 terms for each gene set based on p-value.
Figure 2 displays how regional C9orf72 expression varies across the cortex, subcortex, and the cerebellum. The caudate was the only brain region that was significantly different from average expression across the whole brain after Holm–Bonferroni correction (p-adjusted = 0.006). The full results can be found in Supplementary Table 1. Group-level analysis tends to obscure how expression and imaging markers co-vary across regions within individual participants (Broce et al., 2023). In our subsequent analyses, we directly measure the strength of regional correlations at the individual-participant level, thus avoiding the dilution of these relationships that can occur at the group level. Specifically, we explored regional C9orf72 expression across cortical, subcortical, and cerebellar regions using correlation network analysis.
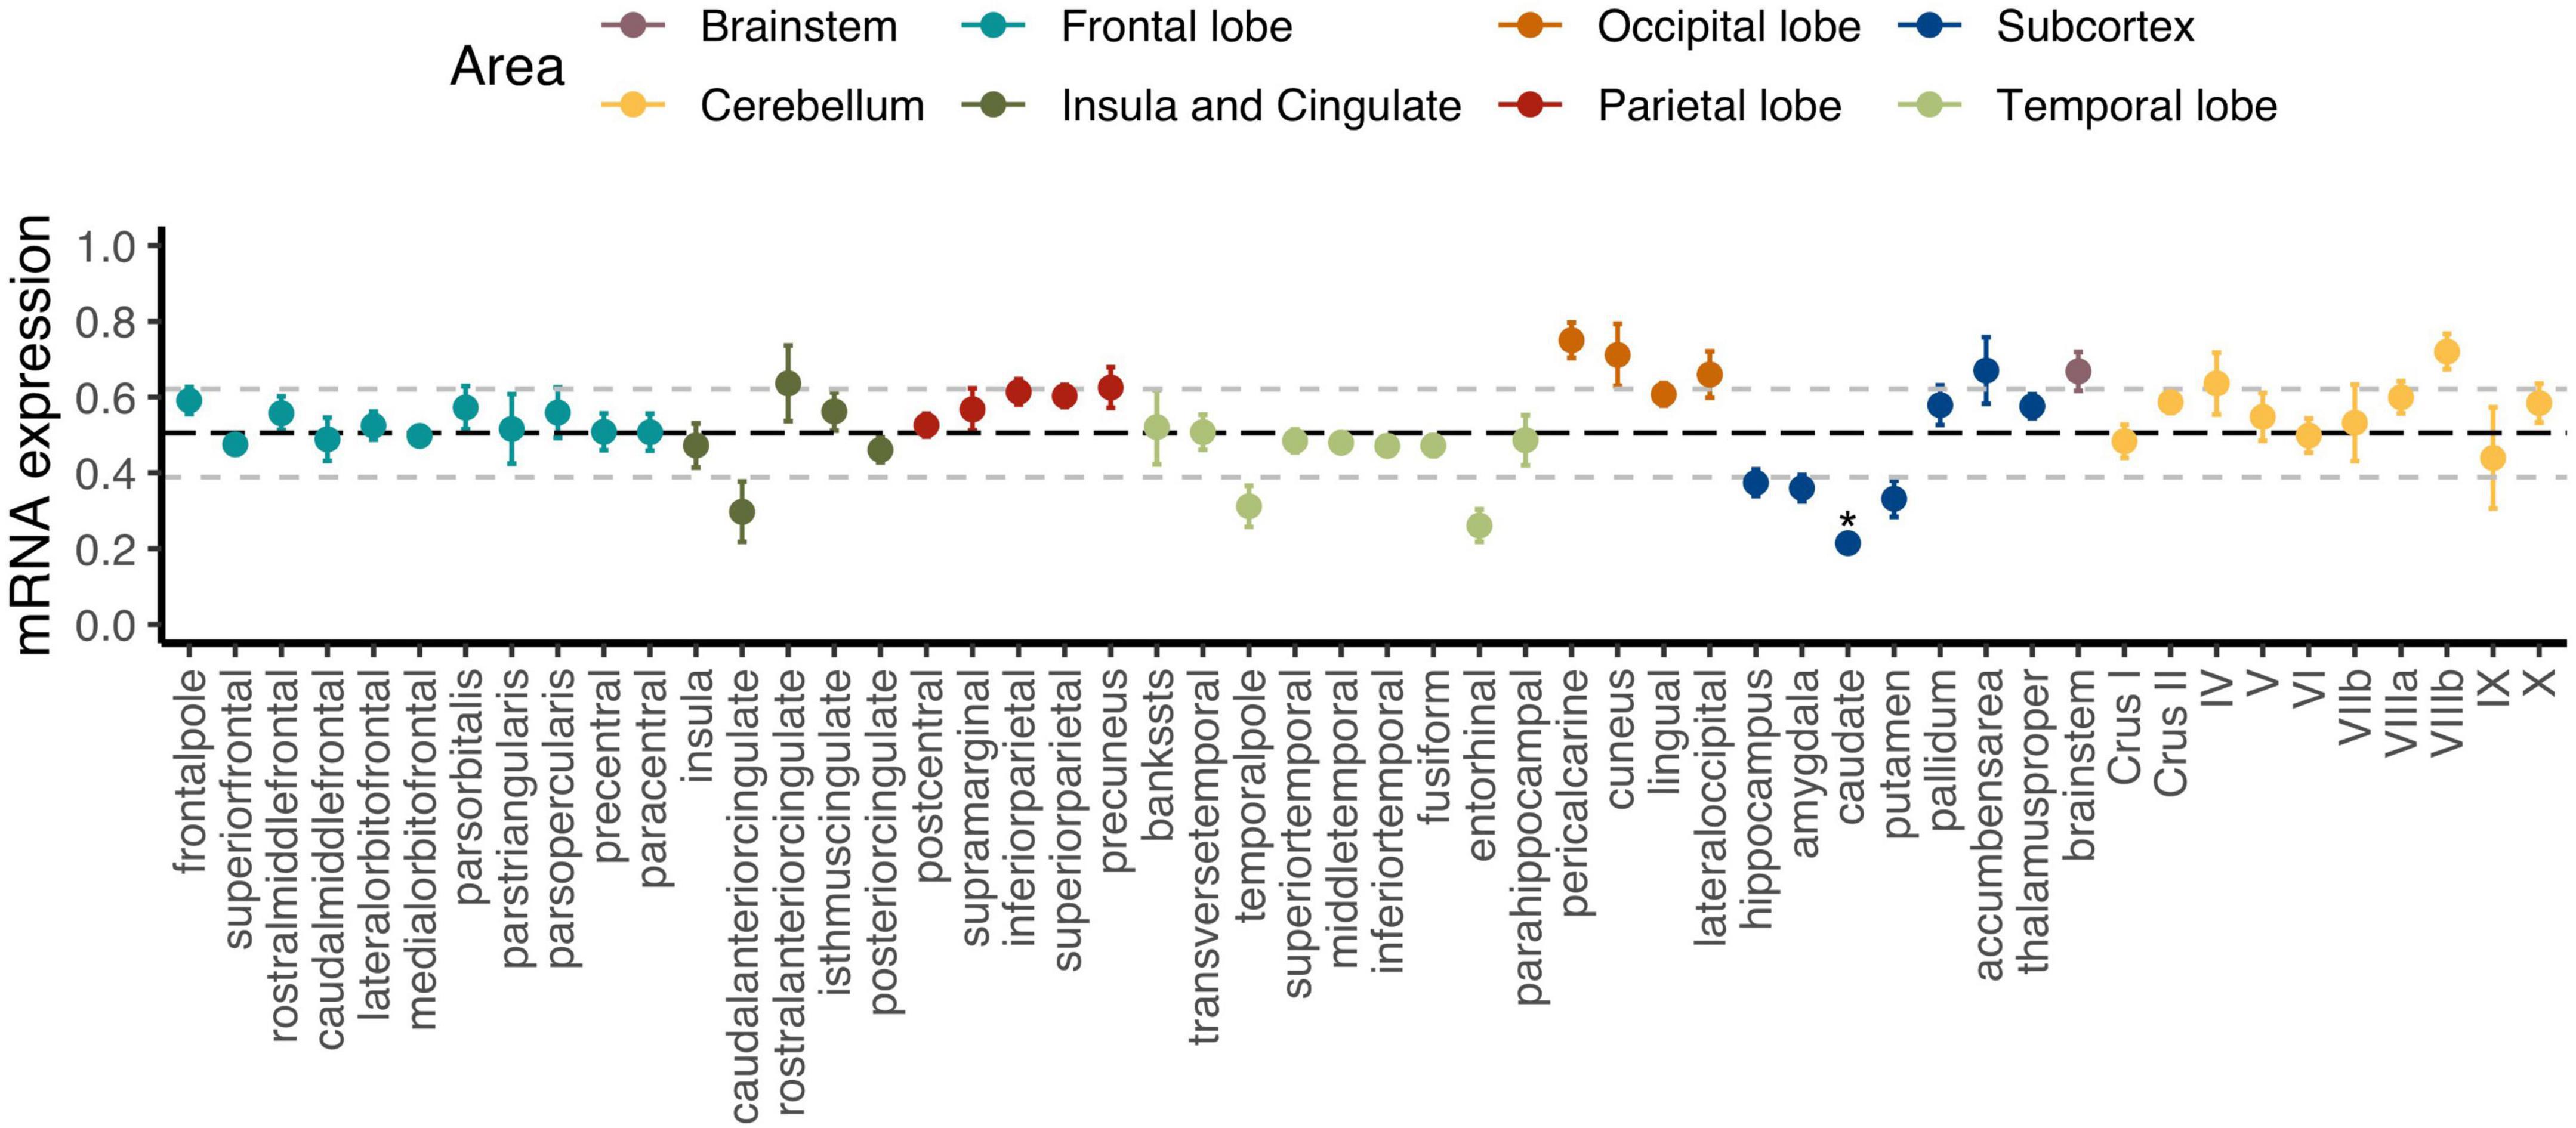
Figure 2. Regional C9orf72 gene expression in the human brain. Each point represents mean expression from six donors with standard errors for a given brain region. Black bolded dashed line represents the mean expression across all genes with 1 standard deviation (± ) also shown in light gray dashed lines. *Adjusted p < 0.05.
To explore whether the patterns of C9orf72 mRNA expression in brain resemble the patterns of mRNA expression of other well-established genes known to cause ALS, FTD, or combined ALS-FTD, we correlated the average C9orf72 mRNA expression values across the whole brain (51 brain regions) with average mRNA expression values across the whole brain for 54 ALS/FTD associated genes (Table 1). As shown in the dendrogram in Figure 3, we identified three main clusters: an orange cluster with 21 gene members, a green cluster with 16 gene members, and a blue cluster with 17 gene members. C9orf72 was in the orange cluster and grouped with 9 other gene members: ATXN2, TBK1, EWSR1, MFSD8, CTCF, TARDBP, TIA, ALS2, and GLE1. C9orf72 mRNA expression across the brain most strongly correlated with ATXN2 (bicor = 0.67) and TBK1 (bicor = 0.66) mRNA expression. Interestingly, as shown in the 54 × 54 gene co-expression matrix, the orange cluster was anti-correlated with several gene members from the green and blue clusters, including GRN, TREM2, TYROBP, OPTN, SOD1, ANG, CCNF, C21ORF2, and VCP, among others. Overall, the strongest positive correlations in the 54 × 54 gene correlation matrix were between TREM2 and TYROBP (bicor = 0.87), HNRNPA2B1 and FUS (bicor = 0.86), and TARDBP and TIA (bicor = 0.83). The strongest negative correlations were between GRN and TIA (bicor = −0.75), SOD1 and TIA (bicor = −0.74), and TARDBP, and GRN (bicor = −0.74). The full results can be found in Supplementary Table 2.
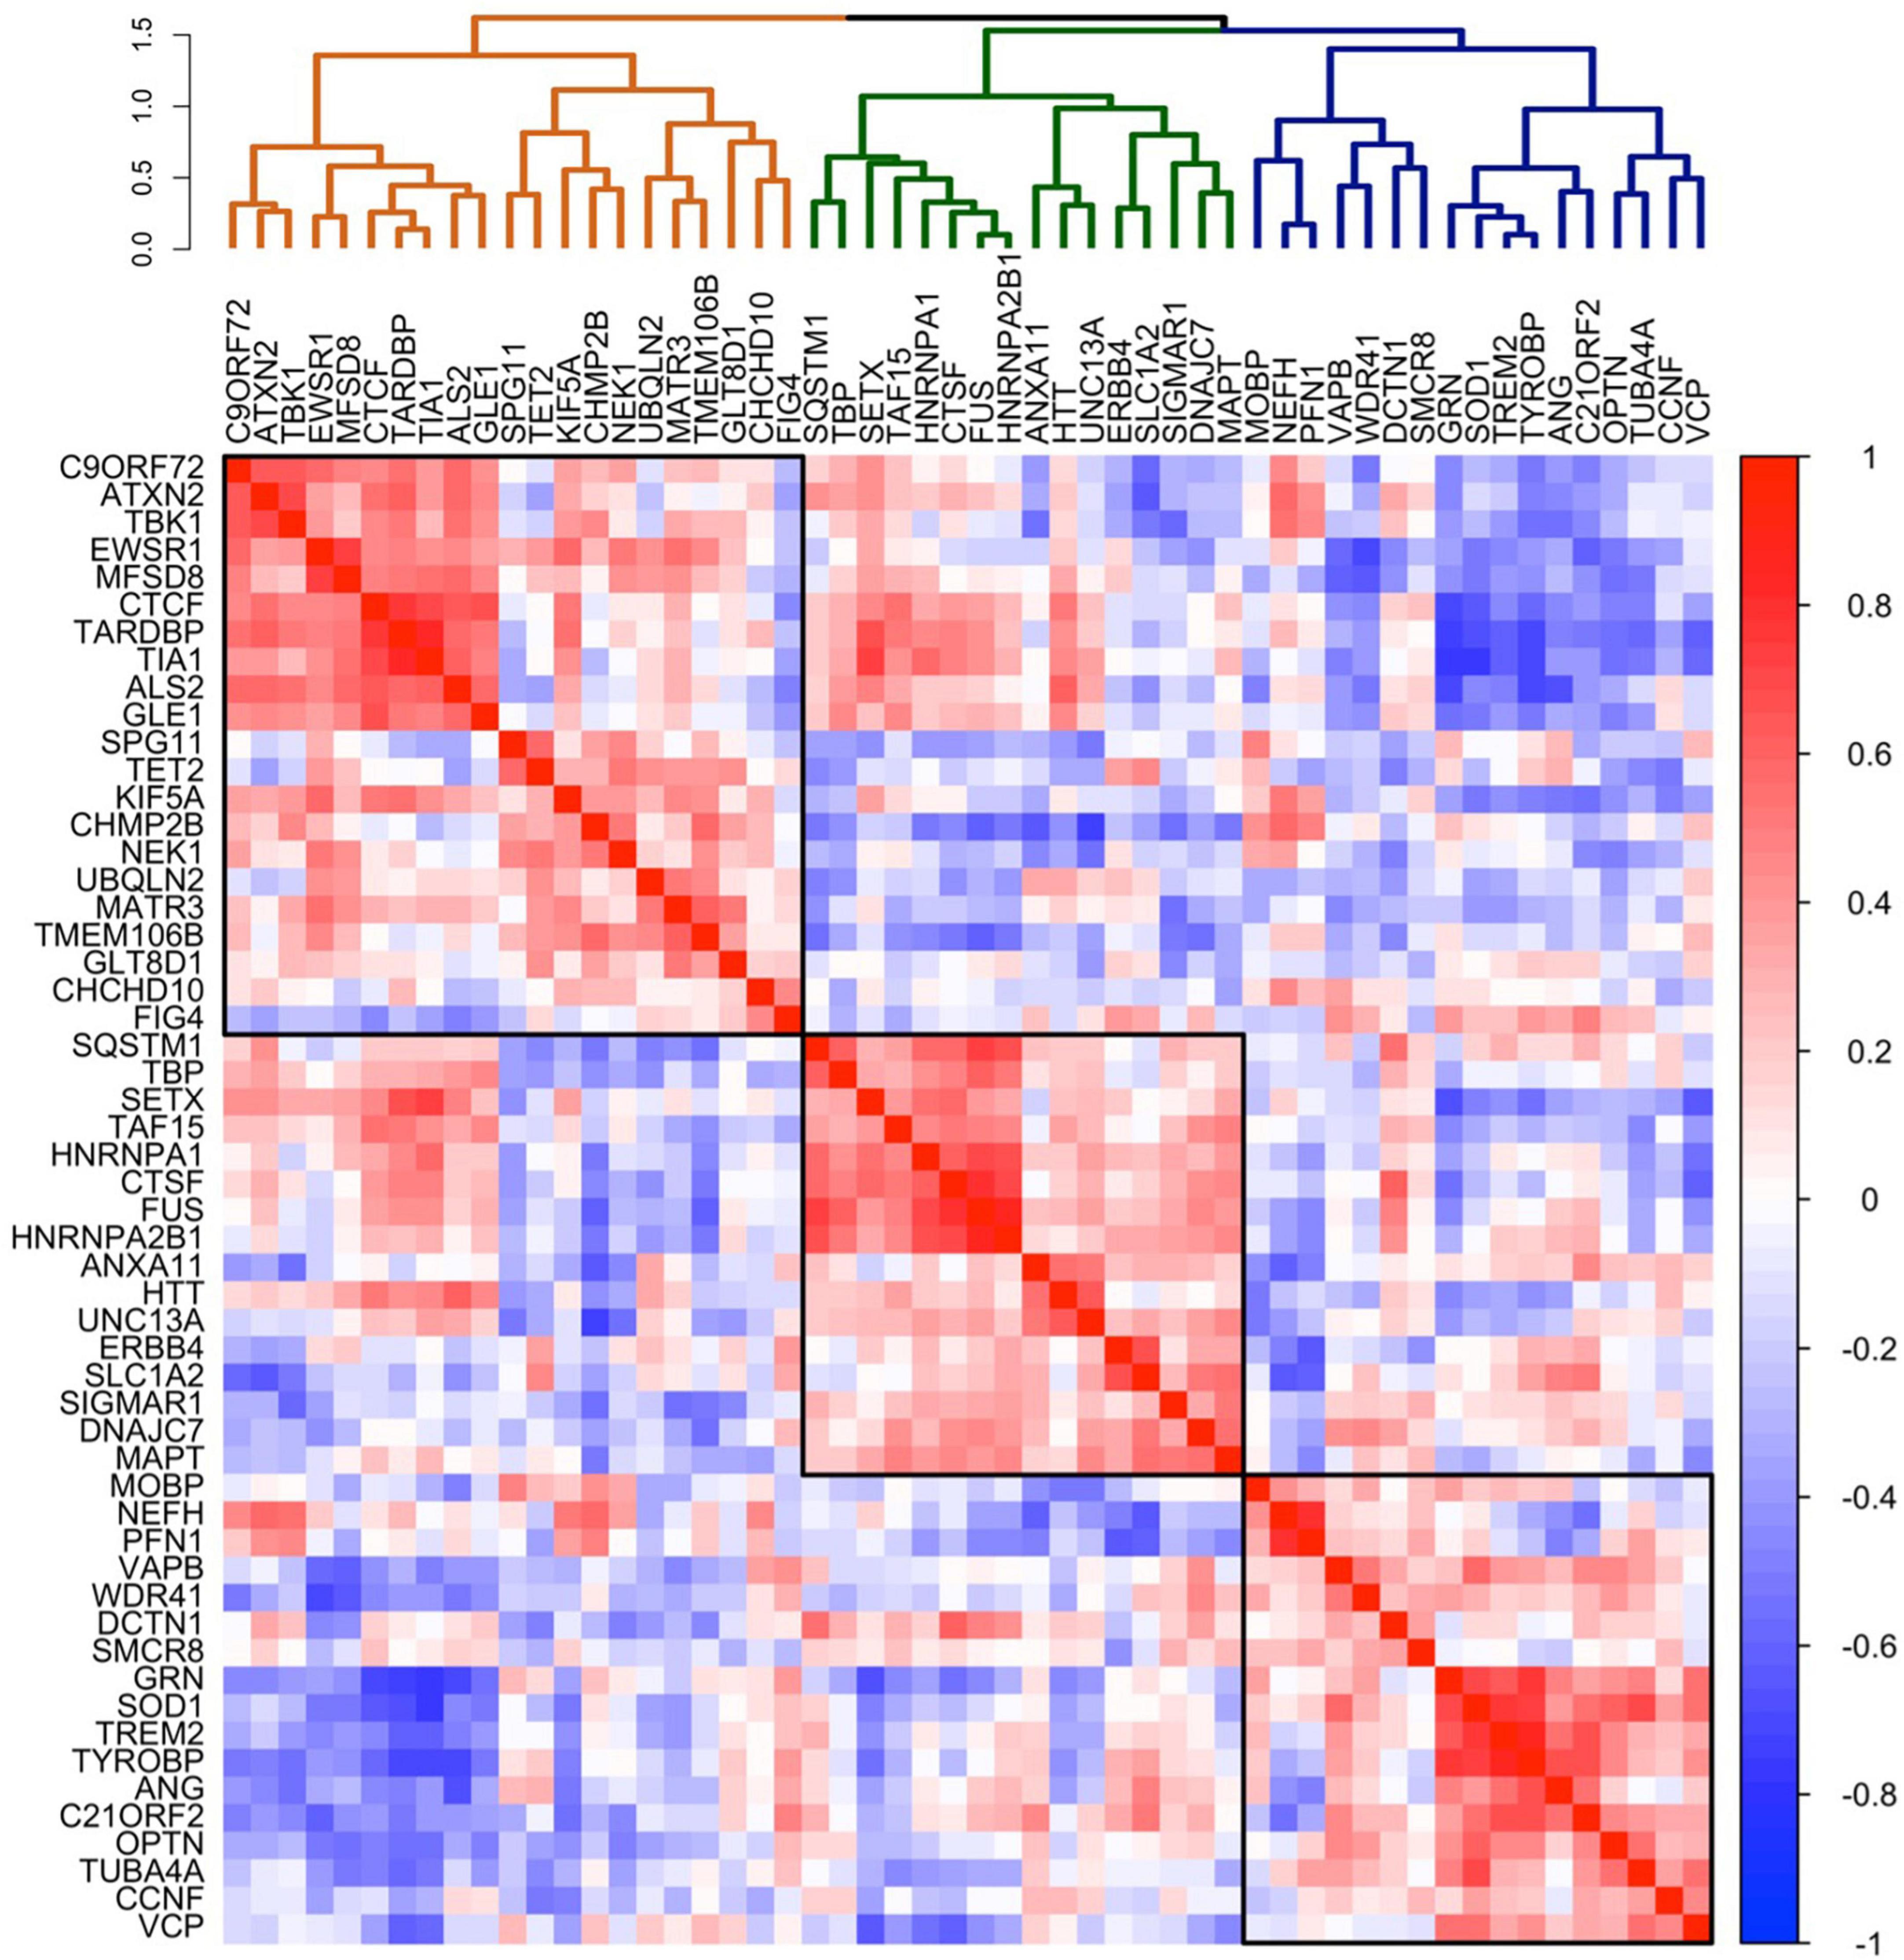
Figure 3. Co-expression of selected 54 ALS-FTD genes in the brain. Co-expression patterning for the expression of selected 54 ALS-FTD genes. The complete linkage method was used to identify 3 clustering groups (black squares).
To independently validate the correlation patterns of the 54 specified genes associated with ALS/FTD, we compared gene co-expression in the AHBA dataset with the GTEx dataset using a Mantel test (see “Materials and methods”) (Supplementary Figure 1). The results indicated a statistically significant correlation between the gene co-expression patterns in the two datasets (bicor = 0.16, p = 0.0001) (Supplementary Figure 2). Notably, in the dendrograms generated from both datasets, C9orf72, TBK1, and ATXN2 formed a tight-knit cluster at the lowest of branch heights, suggesting greatest similarities of gene expression between these genes across both datasets. These results add a layer of confidence to the findings, reinforcing the conclusion that the observed similarity in co-expression is likely not a random occurrence.
By testing a large number of genes and correlations it is possible to create a complex dataset that is open to multiple interpretations. Therefore, to strengthen the connection between correlated gene expression and potential pathogenic roles, we explore whether genes associated with specific neurodegenerative diseases, such as SMCR8 and WDR41, known to form a complex with C9orf72 as part of normal cellular physiology, and TREM2, TYROBP, and GRN associated with leukoencephalopathy and FTD, show correlated gene expression. These analyses revealed intriguing patterns (Supplementary Figure 3): While C9orf72 negatively correlated with WDR41 (bicor = −0.52), this result did not achieve statistical significance following permutation analysis (p-value = 1.00). No significant correlation was found between C9orf72 and SMCR8. However, SMCR8 and WDR41 were positively correlated (bicor = 0.33, p-value = 0.005). Additionally, GRN, TREM2, and TYROBP displayed strong positive correlations among themselves (bicor ≥ 0.65, p-value = 0.0001). These relations were preserved in the larger AHBA 54 × 54 ALS/FTD correlation matrix (Figure 3), where GRN, TREM2, and TYROBP formed a closely-knit cluster, while SMCR8 and WDR41 closely clustered. Further, these relations were generally maintained in GTEx, with the exception of GRN, which integrated into a larger cluster alongside TARDBP, C9orf72, and other genes (Supplementary Figure 1).
We used the same data driven approach described above to screen for new genes that were co-expressed with C9orf72, beyond the 54 known ALS/FTD genes. Thus, we correlated the average C9orf72 mRNA expression values across the whole brain with average mRNA expression values for each of the 15,633 protein-coding genes. Then, to determine whether the whole brain co-expression patterns were driven by gene expression differences between the anatomical subdivisions, we visualized the similarities in whole brain co-expression and expression patterns among the different anatomical subdivisions (Figures 4A–D). Visualizing the correlation values between C9orf72 and a few gene members from the orange, green, and blue clusters (Figure 2) revealed that patterns across the whole brain most closely resemble the same relationships within cortical areas. Thus, for the imaging transcriptomic analyses described below, we focus on C9orf72-co-expressed genes, defined as genes with a correlation value higher than the absolute value of 0.5 across one or more anatomical subdivisions (n = 9,789 genes). The full results can be found in (Supplementary Table 3).
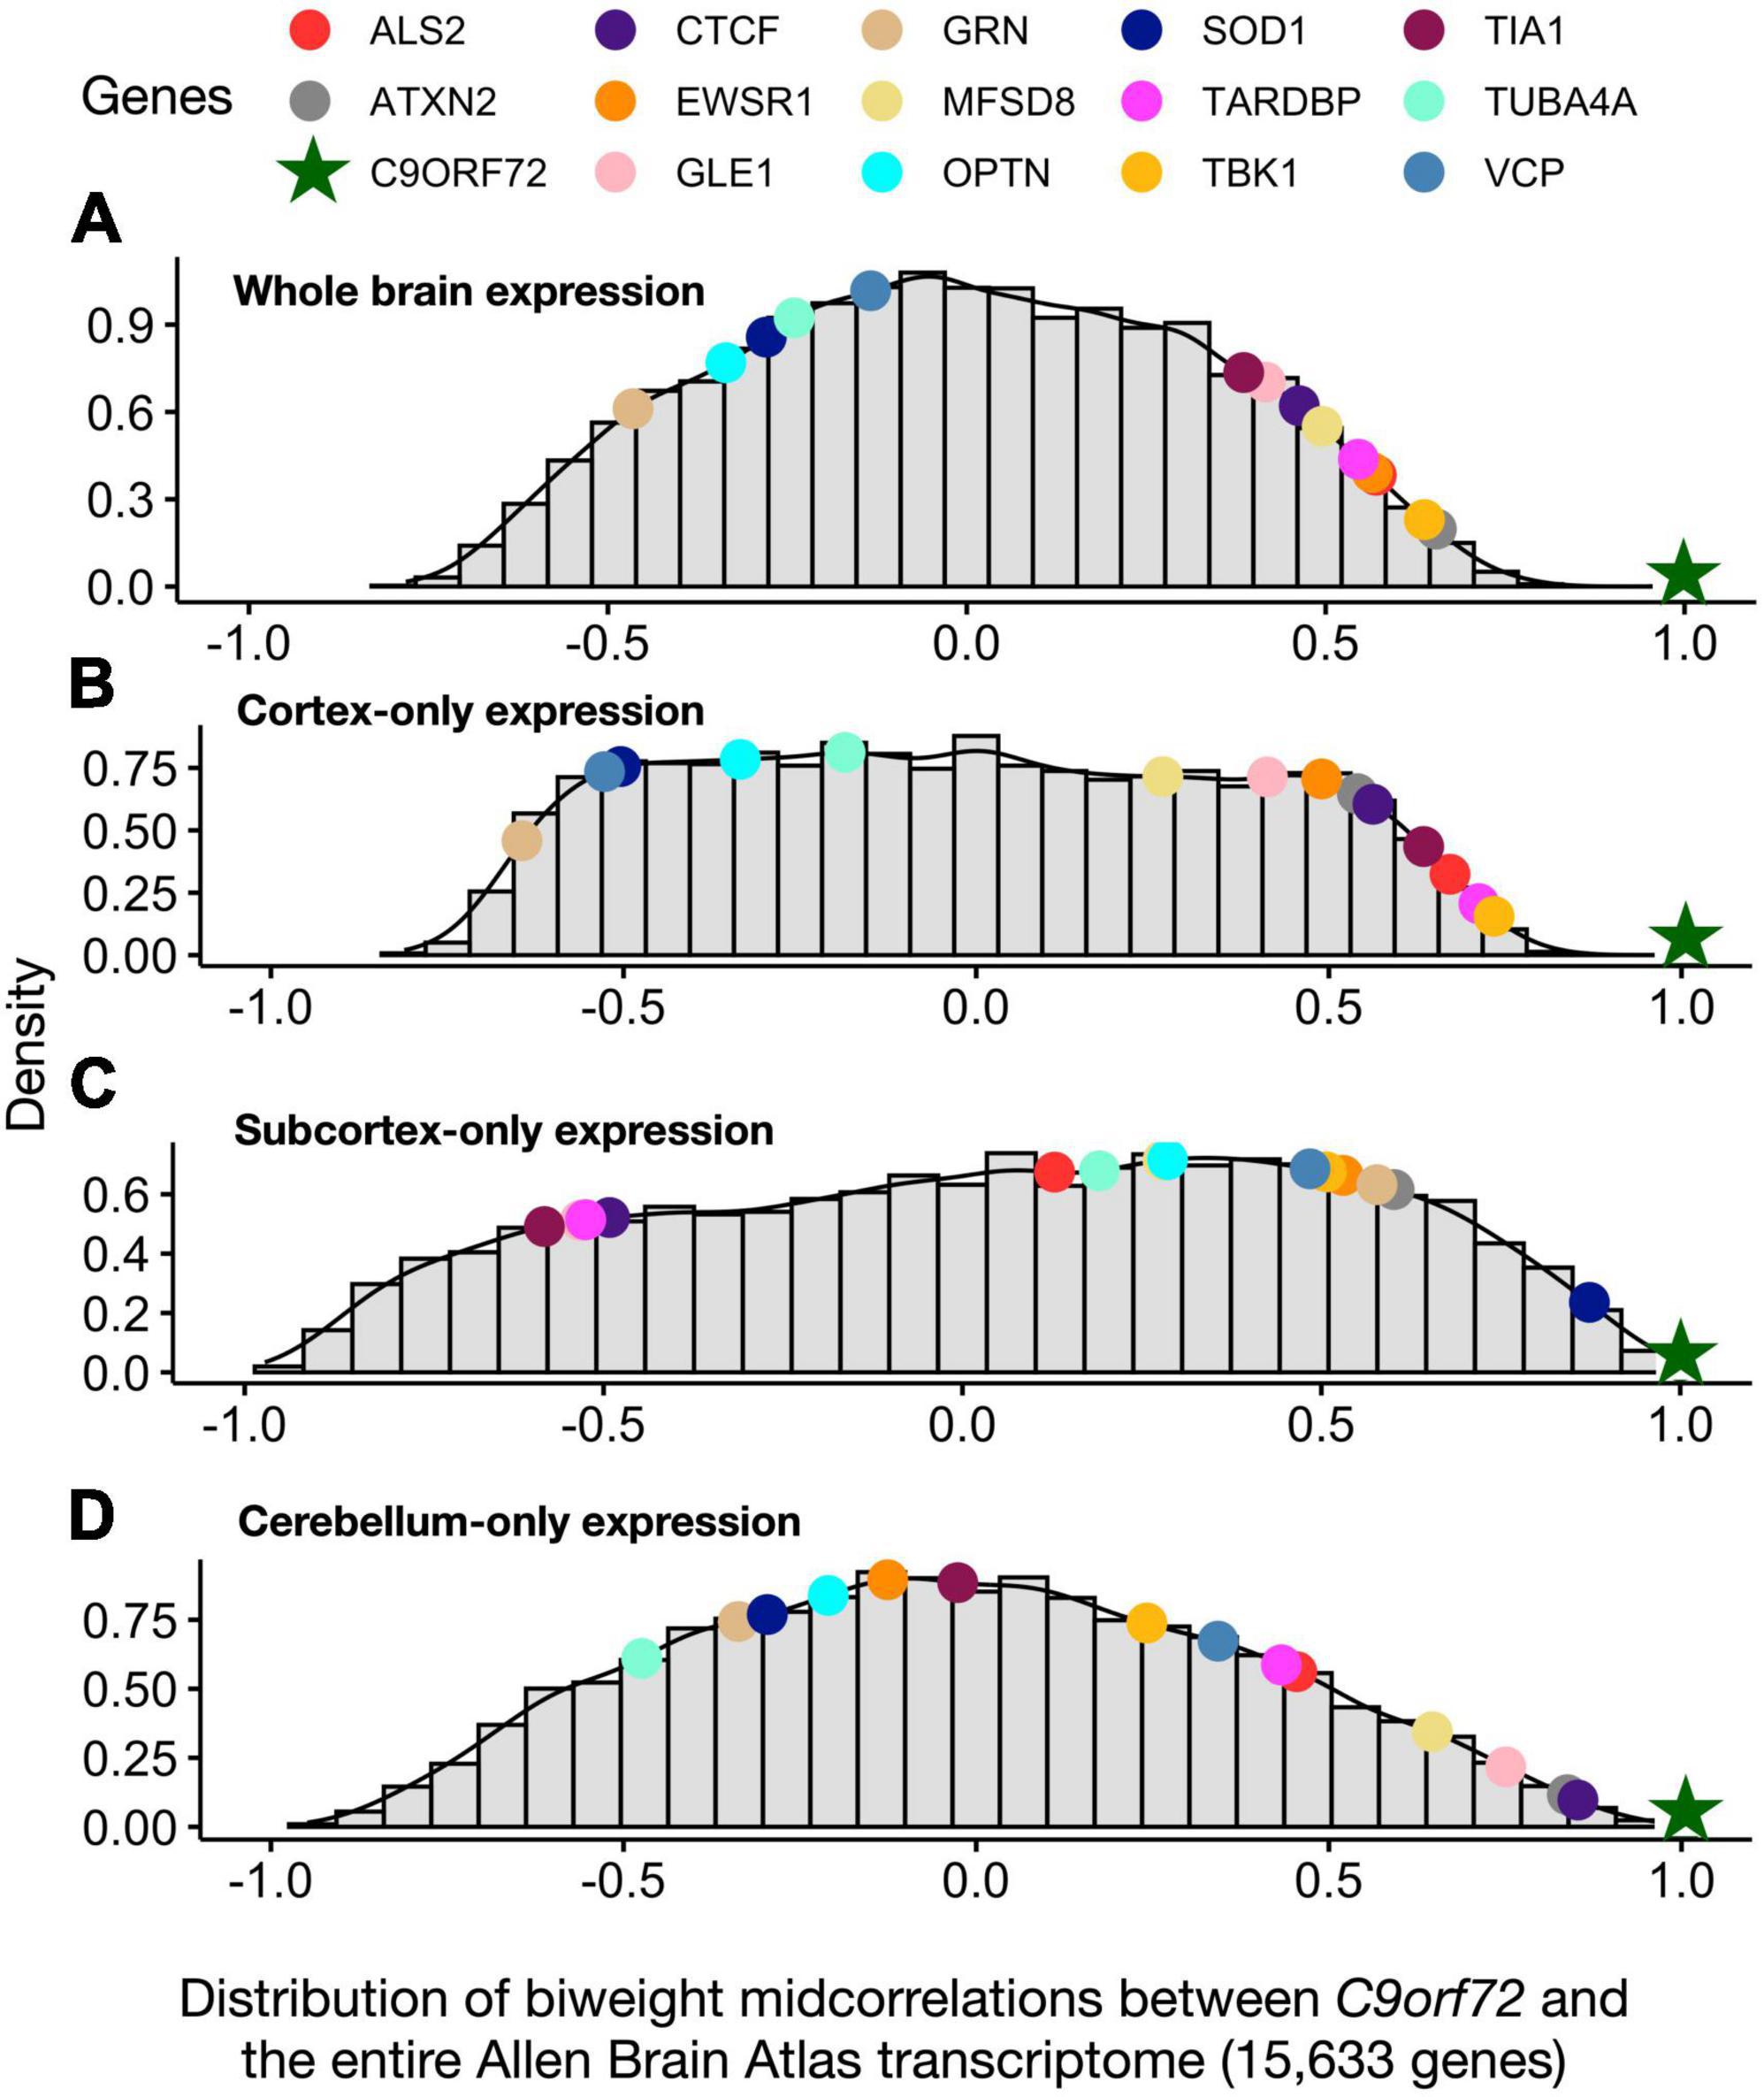
Figure 4. Distribution of biweight midcorrelations between C9orf72 and all genes in the Allen Human Brain Atlas across different anatomical distributions. (A) whole brain (B) cortex-only (C) subcortex-only, and (D) cerebellum-only. Biweight midcorrelations correlations are visualized on a density distribution.
To identify a network of genes that may contribute to the regional vulnerability of the human brain to C9orf72 HRE-mediated pathology, we calculated correlations between average mRNA expression for each of the C9orf72-co-expressed genes from AHBA and differences in average cortical thickness from symptomatic C9orf72 HRE carriers compared to controls (Figures 1E–G). Both brain mRNA expression values from the AHBA dataset and brain imaging measures from the C9orf72 HRE carriers and controls were mapped to the FreeSurfer average cortical surface, allowing for these imaging transcriptomic correlations.
After permutation testing (p-value < 0.05), average mRNA expression from roughly 20% of all C9orf72-co-expressed genes (n = 2,120 genes) significantly correlated with average cortical thickness in symptomatic C9orf72 HRE carriers, including C9orf72 and 7 out of the 54 ALS/FTD genes: TARDBP, ATXN2, NEFH, SETX, PFN1, VAPB, and UNC13A (Figure 5). Other correlations within the top 10 most significant include PLEKHH3, RGS14, LRCH1, and PCDHB10, notable for their prior implication in dementia and aging (Supplementary Table 4).
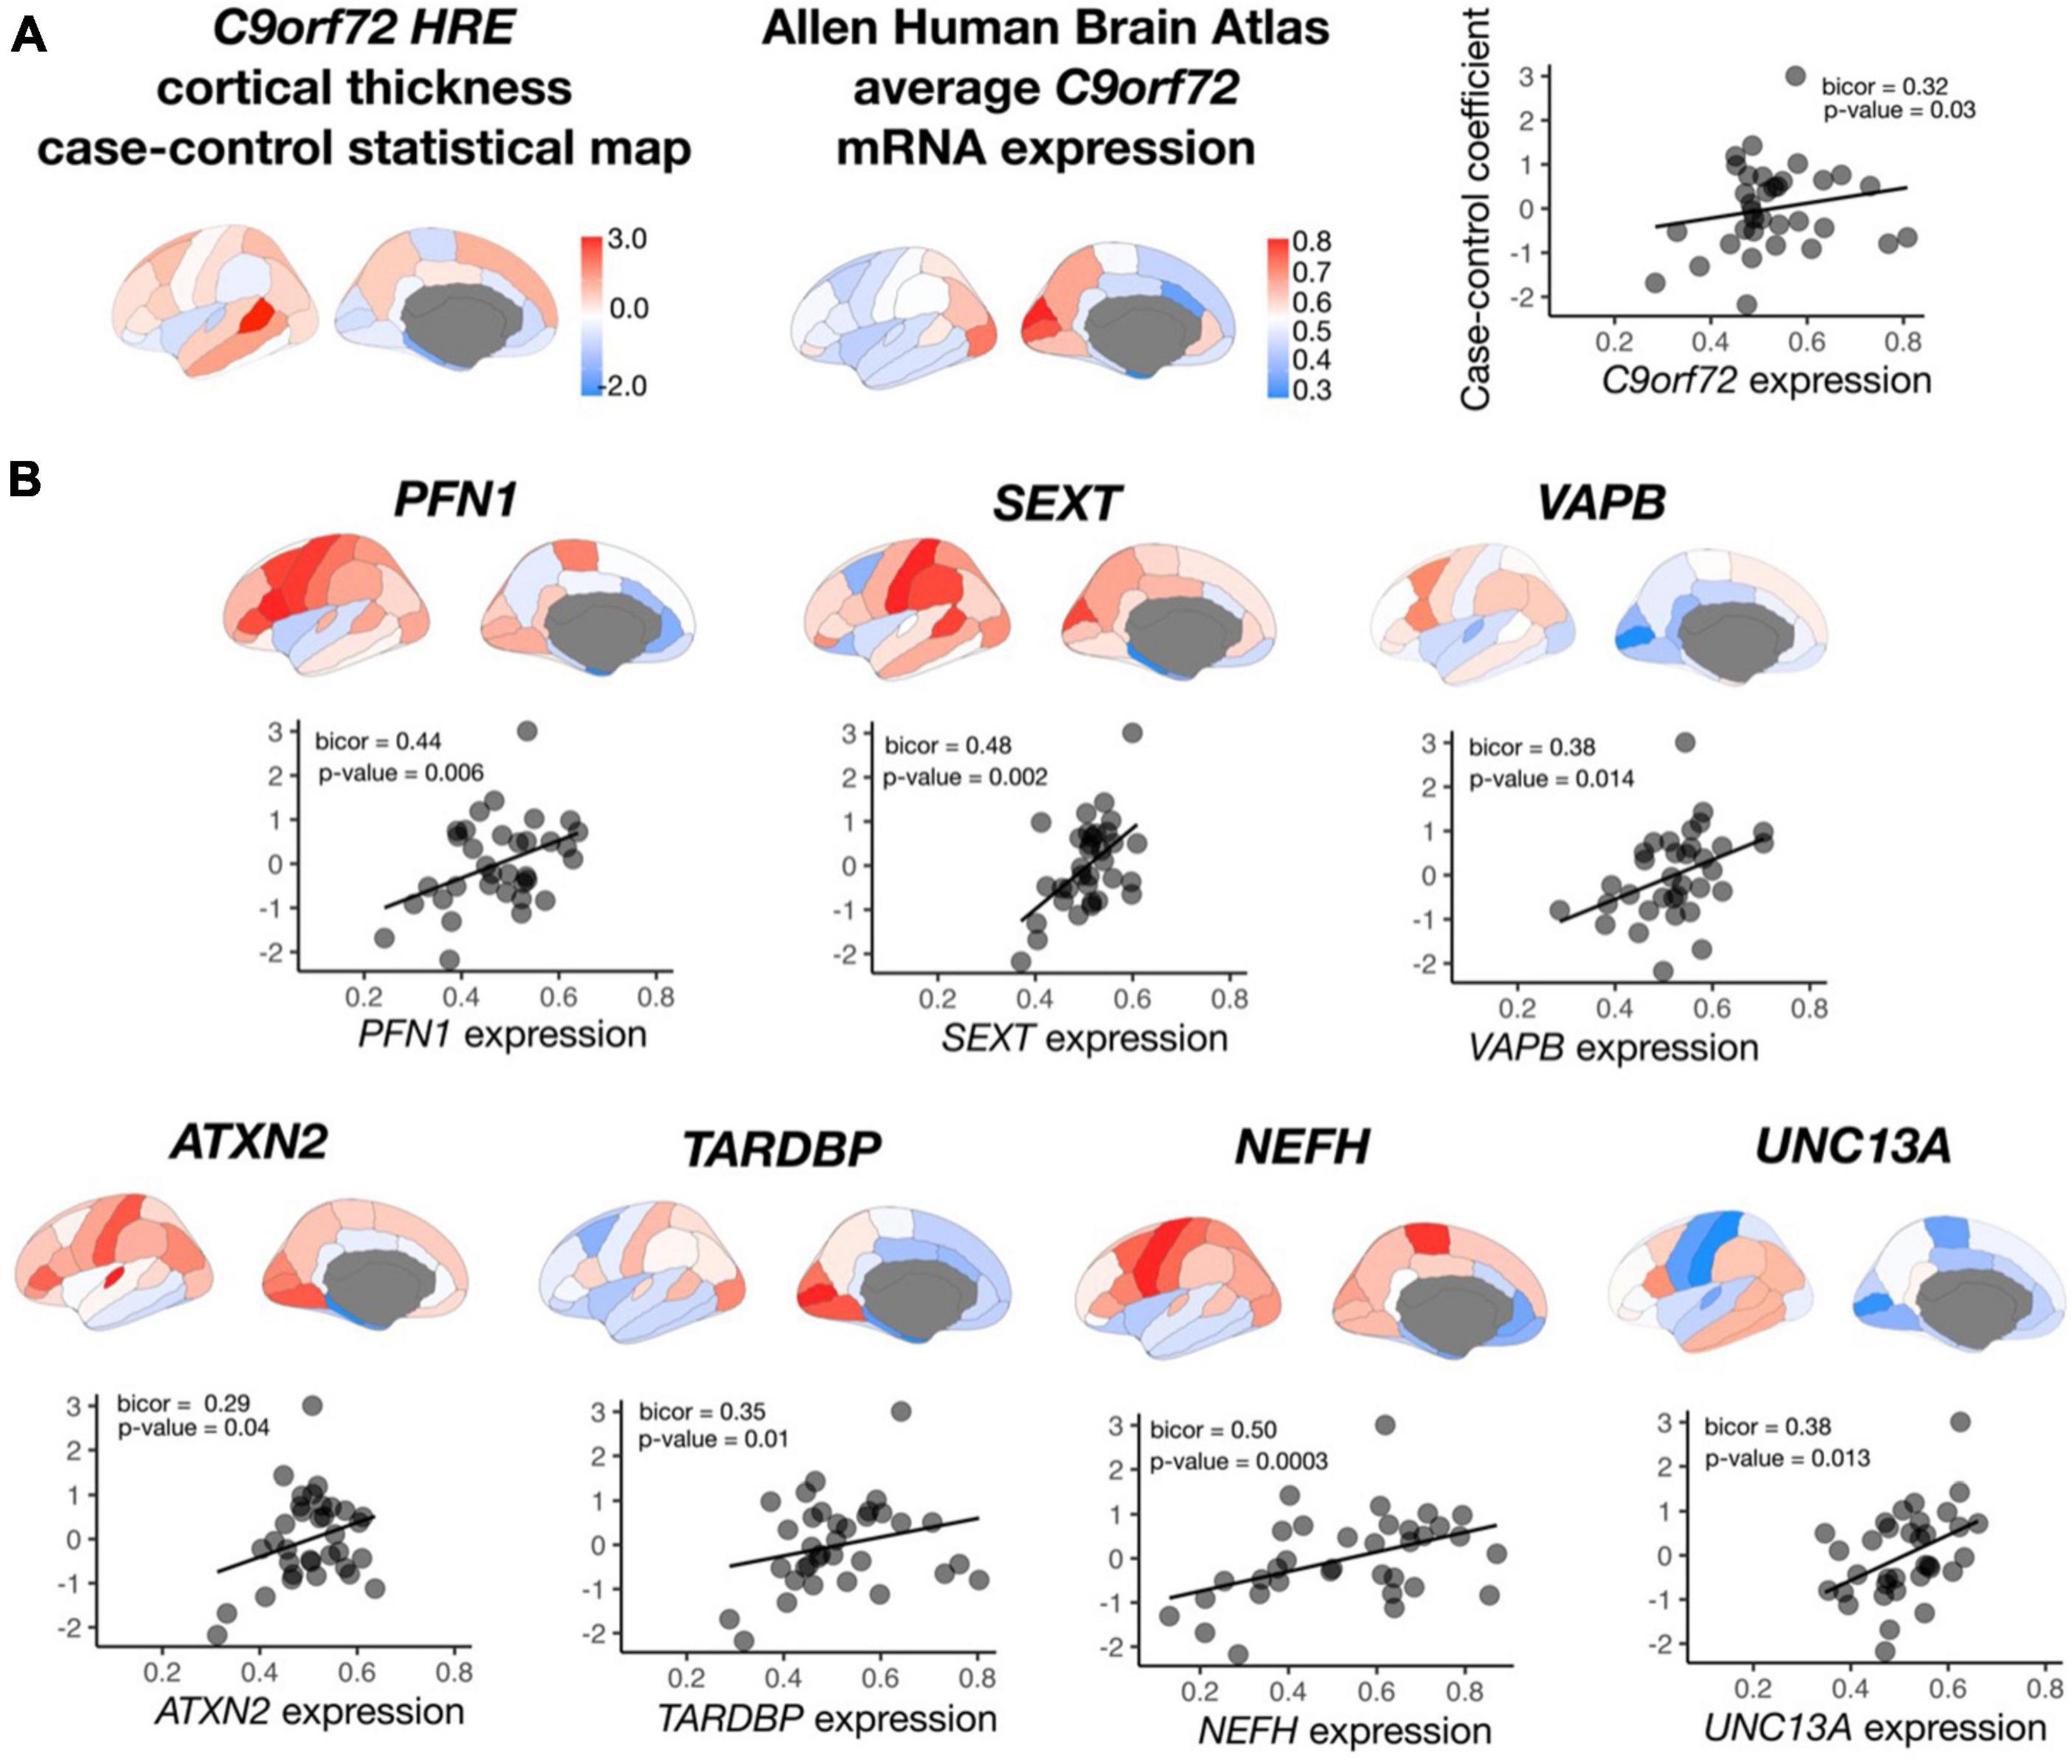
Figure 5. Correlation between C9orf72 co-expressed genes and cortical thickness coefficients from symptomatic C9orf72 HRE carriers compared to controls. (A) case-control cortical thickness coefficients, average C9orf72 mRNA expression from Allen Human Brain Atlas in the same regions, and correlation between the two (top panel). (B) In addition to C9orf72, average mRNA expression in 7 out of 15 ALS/FTD genes significantly correlated with case-control cortical thickness coefficients.
We explored whether genes with significant C9orf72 case-control imaging transcriptomic correlations (n = 2,120 genes; henceforth, “C9orf72 imaging transcriptomic genes”) from the previous analyses were enriched for different cell populations in the brain. To do this, we used the publicly available Cell-type Specific Expression Analysis (CSEA) tools, which extracts data from the Brainspan database.6 These genes were enriched for several cell types or systems previously implicated in ALS and FTD (Figure 6) (BH adjusted p-value < 0.05), including layer 5b cells (Genc et al., 2017; Nana et al., 2019; Vatsavayai et al., 2019), cholinergic motor neurons in the spinal cord and brainstem (Casas et al., 2013), and dopamine type 1 and 2 receptor-positive (Drd1 + , Drd2 +) medium spiny neurons of striatum (Riku et al., 2016; Sobue et al., 2018).
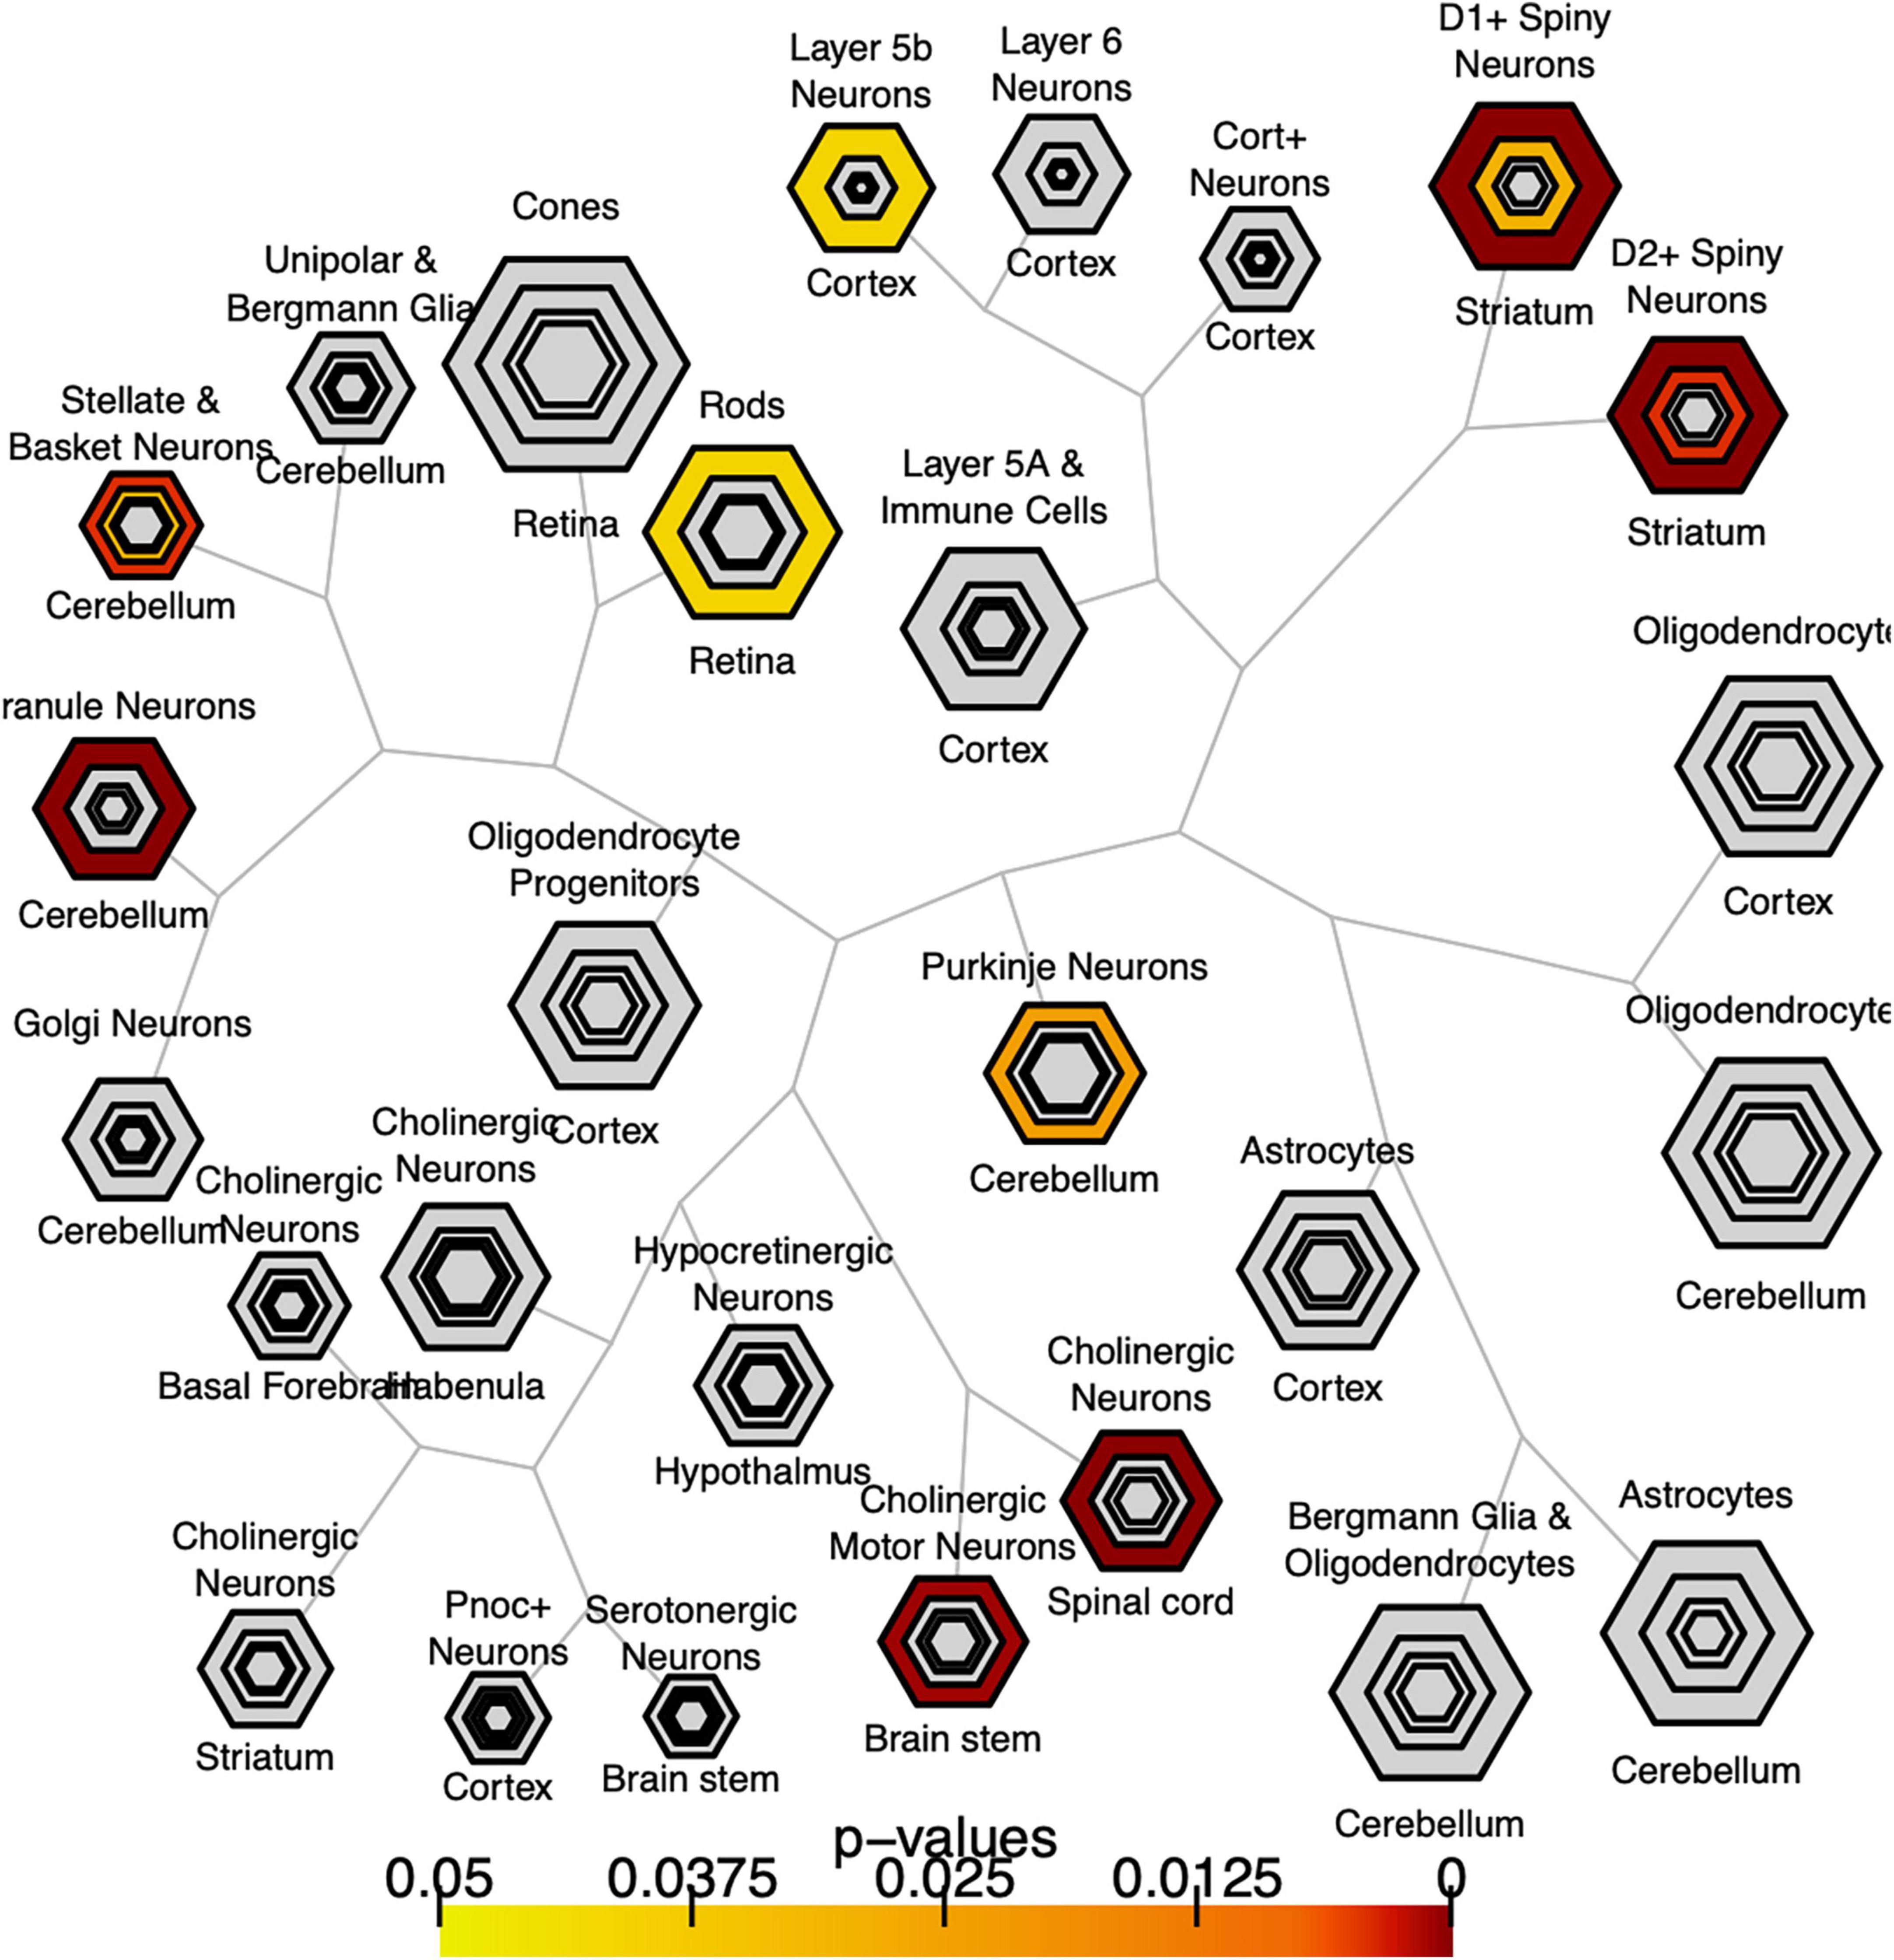
Figure 6. Bulls eye plot showing specific expression analysis across cell types (CSEA) of C9orf72-associated genes. Output of CSEA reveals a substantial over-representation at specificity index threshold (pSI) level (p-values 0.05) for layer 5b neurons, cholinergic motor neurons, and striatal medium spiny neurons. Bonferroni-Hochberg values are plotted by color.
We performed pathway enrichment analysis using the R statistical package “pathfindR” (Ulgen et al., 2019) to identify the biological pathways and mechanisms that the 2,120 C9orf72 imaging transcriptomic genes were enriched for (Figure 7, Supplementary Table 5). The most relevant KEGG biological pathways included autophagy; the Rap1, CAMP, and ErbB signaling pathways; and additional neurogenerative diseases (i.e., Parkinson’s disease and prion disease). Further, the most relevant GO biological pathway terms included mRNA splicing, endoplasmic reticulum to Golgi vesicle-mediated transport, protein ubiquitination, cellular response to DNA damage, regulation of miRNA transcription, and macroautophagy. Between KEGG pathways and GO biological pathway terms, over 25 genes were driving the autophagy enrichment, including C9orf72. Lastly, the most relevant GO molecular function terms included DNA binding transcription factor activity, RNA and microtubule binding, and protein ubiquitination. The full list of pathways and corresponding genes can be found in Supplementary Tables 5.
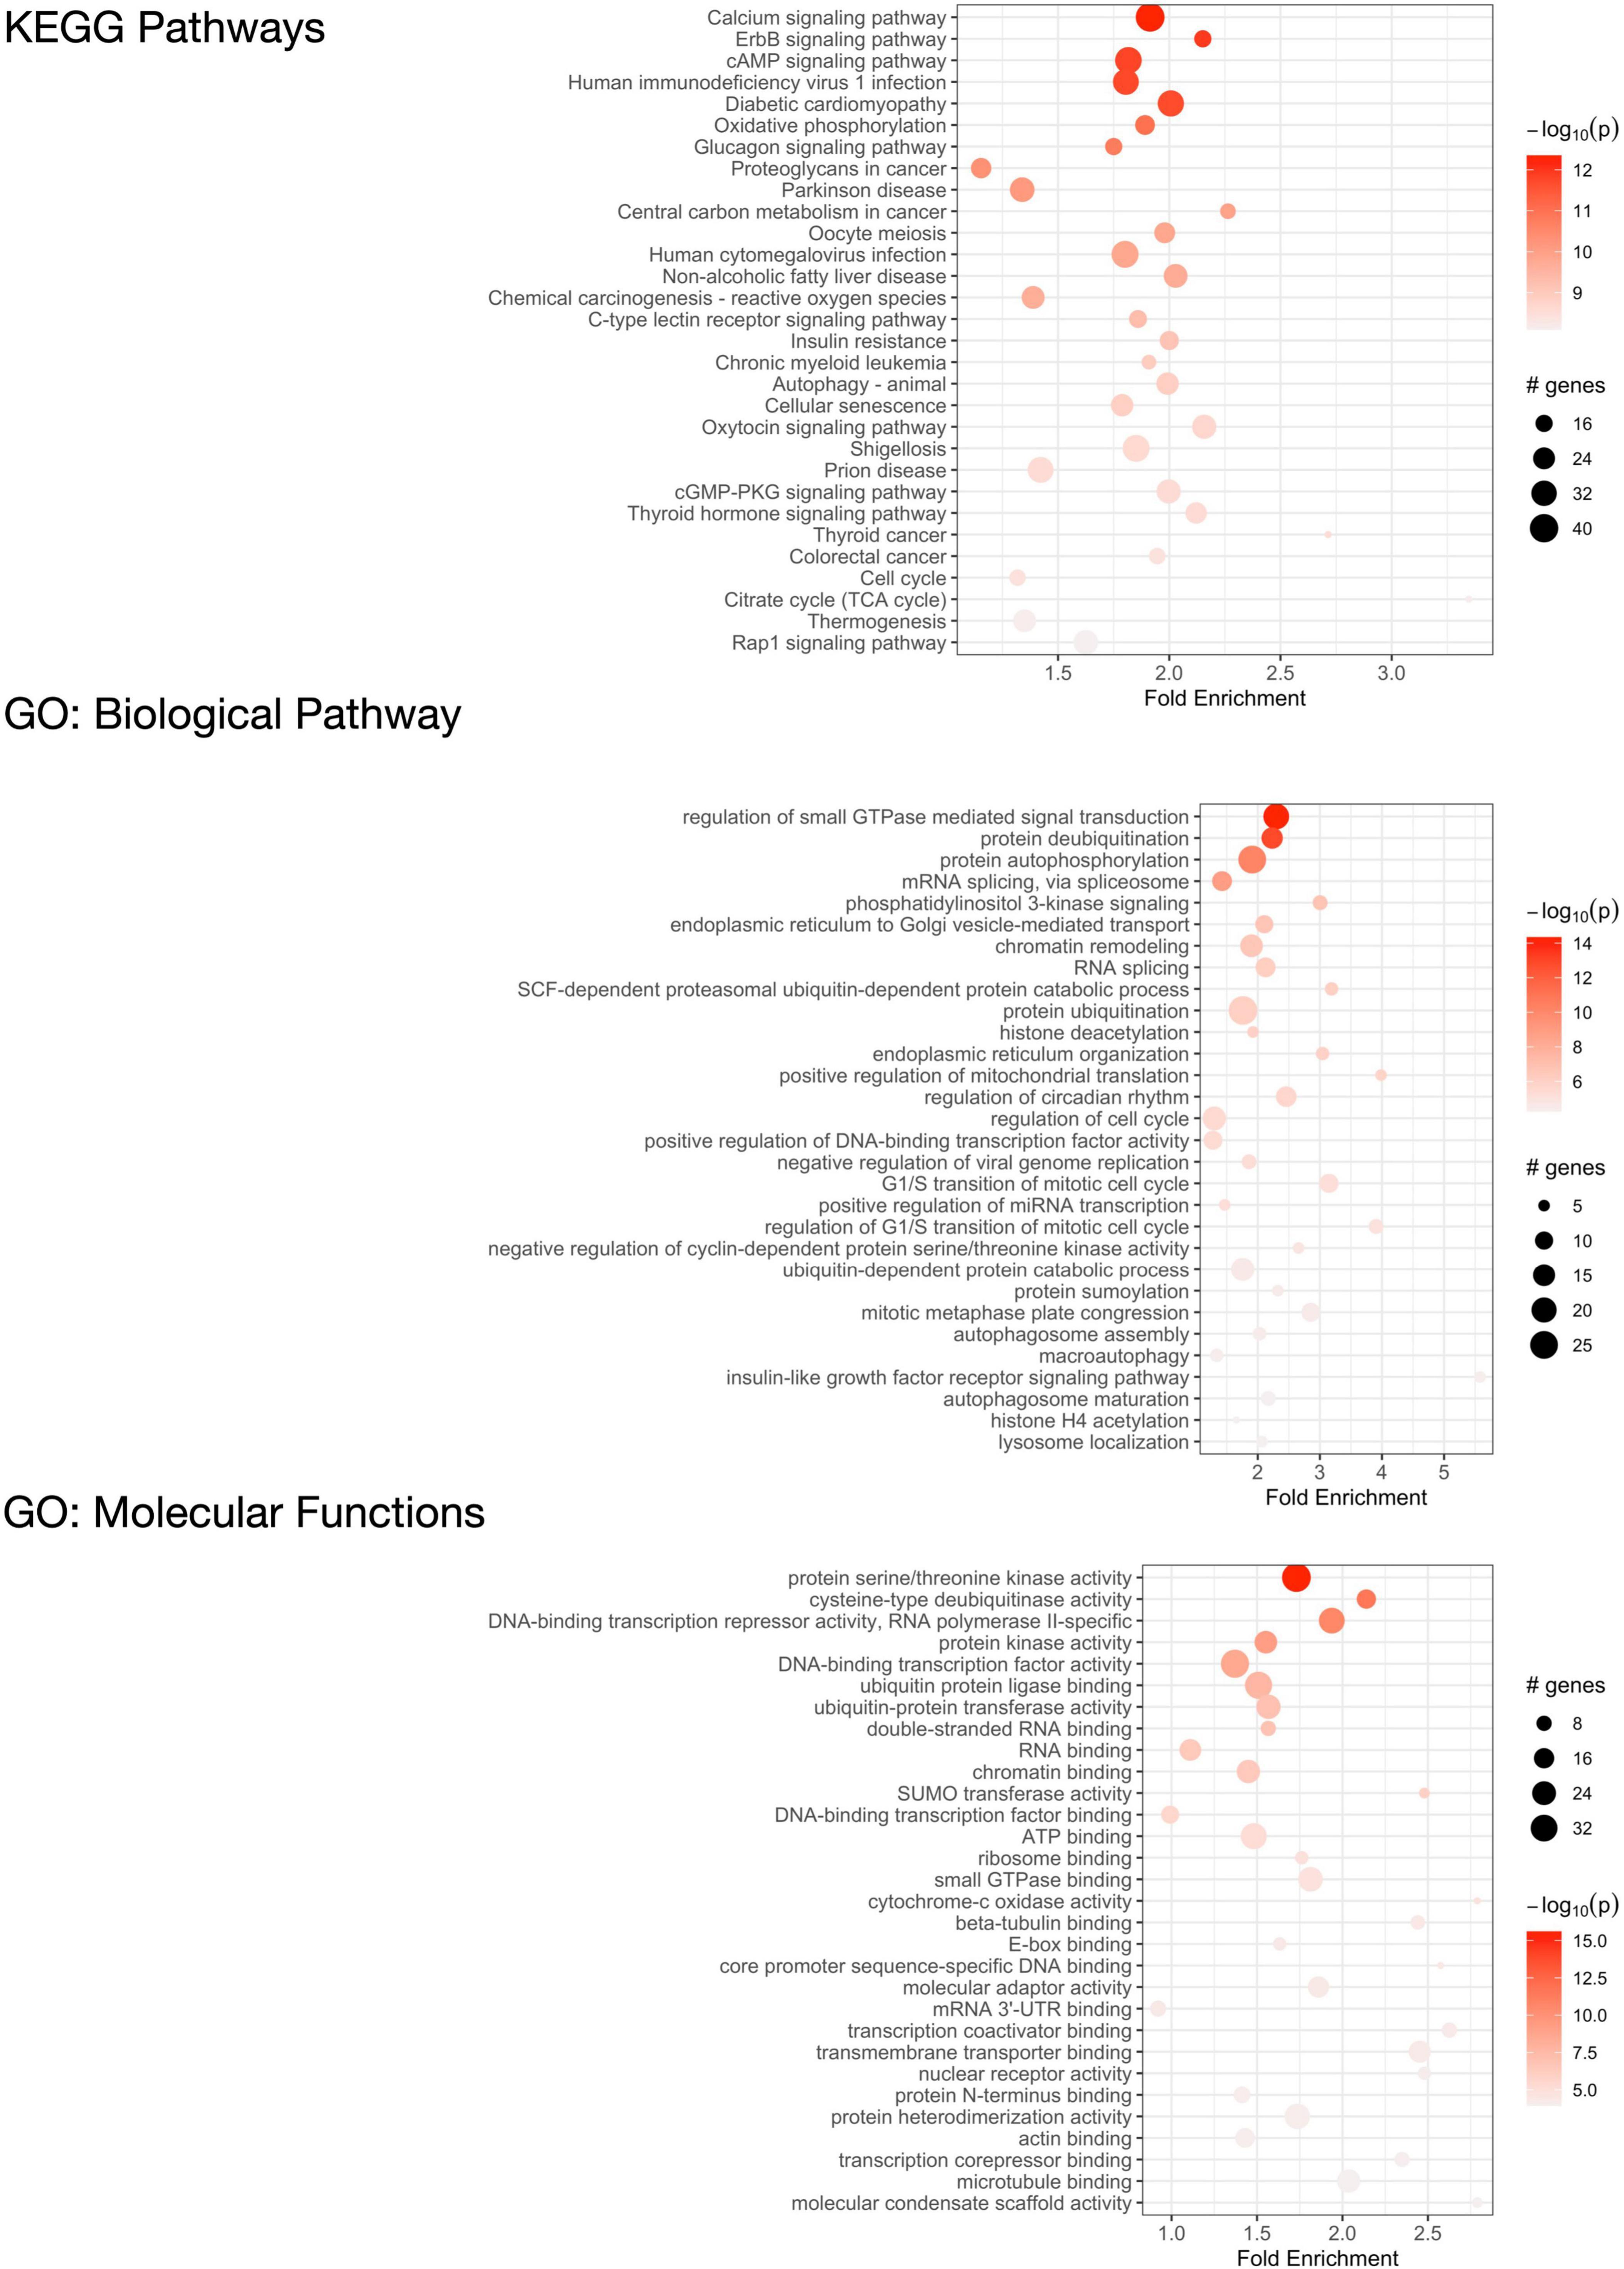
Figure 7. Functional enrichment analysis of C9orf72-associated genes. KEGG pathways that are significantly enriched in 2,120 significant C9orf72 imaging transcriptomic genes (top) and Gene Ontology (GO) analysis of biological processes (middle) and molecular functions (bottom).
We leveraged mRNA expression data from the AHBA and brain imaging data from 19 C9orf72 HRE carriers to identify a network of genes and gene products that might contribute to the regional vulnerability of human brain to C9orf72-mediated pathology and, more broadly, to ALS and FTD. A total of 2,120 genes showed similar anatomical distribution of gene expression in the brain as C9orf72 and significantly correlated with patterns of cortical thickness in C9orf72 HRE carriers compared to controls. These genes were enriched in expression in cell populations previously implicated in ALS and FTD, including layer 5b cells and cholinergic motor neurons in the spinal cord and brainstem, and spiny medium neurons of the striatum. Despite there not being a one-to-one correspondence between gene expression levels and resultant protein levels in patients with different neurodegenerative conditions, we began to probe the potential functional relevance of the C9orf72 imaging transcriptomics gene network by leveraging known protein-protein interaction networks to identify enriched pathways. The C9orf72 imaging transcriptomic gene network was enriched for biological and molecular pathways associated with autophagy, mRNA splicing, endoplasmic reticulum to Golgi vesicle-mediated transport, protein ubiquitination, and cellular response to DNA damage, among others. Considered together, we identified a network of C9orf72 associated genes that may influence selective regional and cell-type-specific vulnerabilities in ALS/FTD.
Different brain regions have distinct distributions of cell types that are segregated into layers and have shared and unique gene expression profiles. Ultimately, these cell types form functional circuits that support motor and cognitive function, language, and social behavior. The identified 2,120 C9orf72 imaging transcriptomic genes from our analyses showed selective expression in cell types previously implicated in the ALS/FTD-spectrum, including layer 5b cells in the cortex and cholinergic motor neurons in the spinal cord and brainstem (Figure 6). Betz cells, which are upper motor neurons, are found in layer 5b of the motor cortex. They are the largest cells in the neocortex and support long-range cortico-motor neuronal projections by sending their axons down to the spinal cord via the corticospinal tract, where they synapse directly with cholinergic lower motor neurons of the anterior horn of the spinal cord, which in turn synapse directly with their target muscle (Genc et al., 2017; McColgan et al., 2020). Damage to this system and degeneration of Betz cells and cholinergic lower motor neurons, are pathological hallmarks of ALS (Cleveland and Rothstein, 2001; Casas et al., 2013). Also located in layer 5b, but in anterior cingulate and fronto-insular cortices, are von Economo neurons (VENs) and fork cells (Nana et al., 2019; Vatsavayai et al., 2019). VENs and fork cells are selectively vulnerable to bvFTD. The anterior cingulate and fronto-insular cortices are key regions that support social-emotional functions (Seeley et al., 2007; Uddin, 2015; Lin et al., 2019). These regions are the earliest and most consistently affected in patients with sporadic bvFTD (Kril and Halliday, 2004; Seeley et al., 2008). Also, within layer 5b of anterior cingulate and frontoinsular cortices in brain tissue of FTD patients, VEN and fork cells show disproportionate tau aggregation in FTLD-tau (Lin et al., 2019) and TDP-43 aggregation in FTLD-TDP (Nana et al., 2019; Vatsavayai et al., 2019), suggesting that VEN and fork cell biology are key aspects of FTD pathobiology. Furthermore, the C9orf72 imaging transcriptomic genes were selectively expressed in medium spiny neurons of striatum. Atrophy in striatum, including caudate and nucleus accumbens, is another key feature in the ALS/FTD patients with behavioral and cognitive abnormalities, with and without C9orf72 mutations (Masuda et al., 2016; Mirzaeva et al., 2016; Sobue et al., 2018). Corroborating these findings, previous studies have found that patients with ALS/FTD show markedly reduced striatal medium spiny neurons, particularly in the caudate head (Riku et al., 2016, 2017). In line with this work, the present study found that the caudate was the most significant region for C9orf72 expression - C9orf72 expression was lower here (Figure 2). Taken together, we identified a set of C9orf72 imaging transcriptomic genes with selective expression in cell types known to be affected in ALS/FTD. Altering the normal gene expression profile of genes comprising the C9orf72 imaging transcriptomic network may, in turn, alter the corresponding functional circuits they participate in. Thus, disruption to one or more of these functional circuits may lead to converging ALS/FTD phenotypes via different paths. Further, given that the caudate was the most significant region for C9orf72 expression and C9orf72 expression was lowest, C9orf72 expression in this region may impact the intensity of C9orf72-specific pathological processes.
The C9orf72 imaging transcriptomic genes were associated with GO biological pathway and molecular function terms in autophagy, endoplasmic reticulum to Golgi vesicle-mediated transport, cellular response to DNA damage, DNA binding transcription factor activity, and protein ubiquitination. These pathways have been consistently associated with ALS/FTD (Serpente et al., 2015; Granatiero et al., 2021; Kallstig et al., 2021; Chua et al., 2022; Ohshiro et al., 2022), and C9orf72-ALS/FTD specifically (Serpente et al., 2015; Shao et al., 2020; Beckers et al., 2021). By leveraging protein-protein interaction information, we found that C9orf72 was associated with autophagy along with over 25 other genes. These findings have important implications for future research developing molecular-based clinical endpoints for clinical trials. For example, a potential therapeutic strategy that may be applied for the treatment of ALS/FTD is the use of small molecules that can affect autophagy dynamics (Zhang et al., 2021). Since C9orf72 and these genes are involved in the enriched term, developing a novel protein-based biomarker that incorporates their levels may help capture risk for ALS/FTD. Further, since cortical patterns of mRNA regional expression of the autophagy enriched genes were strongly correlated with cortical thickness patterns in symptomatic C9orf72 HRE carriers, it may be worthwhile to develop multimodal biomarkers based on cortical thickness measures and gene or protein expression data.
Brain imaging allows for non-invasive visualization and monitoring of structural and functional changes, aiding in early diagnosis, understanding disease progression, and facilitating the development and assessment of treatment interventions in neurodegenerative diseases. Advancements in high-throughput tissue processing enabled the creation of comprehensive transcriptomic atlases for the brain. By combining imaging and transcriptomic information, imaging transcriptomics aims to provide a comprehensive understanding of how genetic factors contribute to brain structure and function and offering insights into the molecular underpinnings of neurodegeneration. To date, the Allen Human Brain Atlas (AHBA) is the most anatomically comprehensive gene expression atlas. In the past decade, several studies have leveraged AHBA database to illuminate potential pathophysiological mechanisms in neurodegeneration [for a recent review see (Arnatkeviciute et al., 2022)]. A recent study explored co-expression patterns associated with brain atrophy patterns in symptomatic FTD mutation carriers in C9orf72, GRN, and MAPT and report top 20 genes and relevant biological pathways (Altmann et al., 2020). Of these, we identified four genes, KATNAL2, ABRACL, FXR1, and HIST1H4A, that were reported as most significant in C9orf72 HRE carriers. Our study differs from this one in that we investigated co-expression patterns specifically related to cortical thickness, as opposed to focusing on brain atrophy, and our brain maps control for age and sex. Another study set out to determine the correlation between regional brain metabolism using fluorodeoxyglucose PET and regional expression of Alzheimer-risk genes in the AHBA. Regional brain expression of several Alzheimer-risk genes, including APOE, CD33, and SORL1, showed a strong correlation with brain metabolism, particularly in regions of the brain that are affected earliest and most severely in Alzheimer’s disease (Ye et al., 2022). Taken together, better understanding the relationship between gene expression and imaging phenotypes in neurodegenerative conditions may illuminate potential pathophysiological mechanisms that contribute to disease susceptibility.
There are limitations to this study. Gene expression data was available using brain tissue data from healthy individuals. Therefore, the regional gene expression and imaging correlations described herein represent the relationship between regional gene expression levels in the healthy human brain and regional cortical thickness in symptomatic C9orf72 HRE carriers compared to controls. Future studies will be needed to assess regional gene expression and imaging data from the same participants. Also, research has shown that in the frontal cortex alone, thousands of genes are differentially expressed in C9orf72 HRE carrier ALS-FTD patients versus ALS-FTD patients without C9orf72 HRE (Dickson et al., 2019), and distinct expression patterns were evident in C9orf72 HRE carriers compared to healthy controls. In our imaging transcriptomics analyses, all imaging data were sourced exclusively from individuals diagnosed with ALS, FTD, or ALS-FTD who are C9orf72 HRE carriers, as well as from healthy controls. Therefore, an important limitation is that our results may not generalize to individuals with ALS/FTD without C9orf72 HRE. Interpretation of our imaging transcriptomics study is, therefore, constrained to regional patterns of gene expression in the healthy brain mirroring regional patterns of cortical thickness in C9orf72 HRE carriers compared to controls. An additional limitation to transcriptomic studies more broadly is that we cannot assume a one-to-one correspondence between gene expression levels and resultant protein levels. In our analyses, TREM2, TYROBP, and GRN associated with leukoencephalopathy and FTD, show correlated gene expression, however, SMCR8 and WDR41, known to form a complex with C9orf72, did not. Therefore, gene expression changes in C9orf72 due to the HRE represents only a partial understanding of the underlying pathogenic processes. Lastly, we acknowledge that additional insights could be gained by knowing if any of the six brain donors were carriers of the C9orf72 intermediate allele/expansion-associated haplotype (e.g., rs2814707 T allele) since it is common (MAF ∼20% in EUR) and has been shown to significantly affect the expression levels of C9orf72. However, genotype information for the donors is not available.
We explored the neuroanatomical basis of shared genetic risk in the ALS/FTD spectrum by identifying genes that show regional co-expression patterns similar to C9orf72, the most common genetic contributor to ALS and FTD. In doing so, we identified a C9orf72 imaging transcriptomic gene network that was enriched in cell populations and regions within the brain known to be selectively vulnerable to ALS/FTD. Altering the normal gene expression patterns of these C9orf72 imaging transcriptomic genes may disrupt cell-to-cell communication and protein-protein interactions between the specific cell-types/brain regions and, in turn, render these cell-types/brain regions vulnerable to ALS/FTD pathobiology. Future work will be required to clarify the impact of disease neuropathology on these neuroanatomical gene expression patterns.
Publicly available datasets were analyzed in this study. This data can be found here: https://portal.brain-map.org.
The studies involving humans were approved by the UCSF Committee on Human Research. The studies were conducted in accordance with the local legislation and institutional requirements. Written informed consent for participation in this study was provided by the participants’ legal guardians/next of kin.
IB: Conceptualization, Formal analysis, Funding acquisition, Investigation, Methodology, Resources, Visualization, Writing – original draft, Writing – review & editing. DS: Conceptualization, Formal analysis, Writing – original draft. RN: Visualization, Methodology, Writing – review & editing. LB: Data curation, Formal analysis, Writing – review & editing. SL: Data curation, Funding acquisition, Resources, Writing – review & editing. BM: Data curation, Funding acquisition, Resources, Conceptualization, Writing – review & editing. PC: Conceptualization, Methodology, Writing – review & editing. VS: Conceptualization, Writing – review & editing. LS: Conceptualization, Methodology, Writing – review & editing. RD: Conceptualization, Funding acquisition, Resources, Writing – original draft. JY: Conceptualization, Methodology, Resources, Supervision, Writing – review & editing.
The author(s) declare financial support was received for the research, authorship, and/or publication of this article. This work was supported by the UCSD Improving the Health of Aging Women and Men Fellowship (1T32AG058529), the Rainwater Charitable Foundation (P052319), the National Institutes of Health (NIH) (K01AG070376-03; 1R01AG058233), and the Department of Defense ALS Research Program (HT94252310353).
We thank the Memory and Aging Center at UCSF for continued support and the patients whose data contributed to this work.
The authors declare that the research was conducted in the absence of any commercial or financial relationships that could be construed as a potential conflict of interest.
All claims expressed in this article are solely those of the authors and do not necessarily represent those of their affiliated organizations, or those of the publisher, the editors and the reviewers. Any product that may be evaluated in this article, or claim that may be made by its manufacturer, is not guaranteed or endorsed by the publisher.
The Supplementary Material for this article can be found online at: https://www.frontiersin.org/articles/10.3389/fnins.2024.1258996/full#supplementary-material
Abramzon, Y. A., Fratta, P., Traynor, B. J., and Chia, R. (2020). The overlapping genetics of amyotrophic lateral sclerosis and Frontotemporal dementia. Front. Neurosci. 14:42. doi: 10.3389/fnins.2020.00042
Almeida, M. R., Letra, L., Pires, P., Santos, A., Rebelo, O., Guerreiro, R., et al. (2016). Characterization of an FTLD-PDB family with the coexistence of SQSTM1 mutation and hexanucleotide (G(4)C(2)) repeat expansion in C9orf72 gene. Neurobiol. Aging 40, 191.e1–191.e8. doi: 10.1016/j.neurobiolaging.2015.12.015
Altmann, A., Cash, D. M., Bocchetta, M., Heller, C., Reynolds, R., Moore, K., et al. (2020). Analysis of brain atrophy and local gene expression in genetic frontotemporal dementia. Brain Commun. 2:fcaa122. doi: 10.1093/braincomms/fcaa122
Arnatkeviciute, A., Fulcher, B. D., Bellgrove, M. A., and Fornito, A. (2022). Imaging transcriptomics of brain disorders. Biol. Psychiatry Glob. Open Sci. 2, 319–331. doi: 10.1016/j.bpsgos.2021.10.002
Arnatkeviciute, A., Fulcher, B. D., and Fornito, A. (2019). A practical guide to linking brain-wide gene expression and neuroimaging data. Neuroimage 189, 353–367. doi: 10.1016/j.neuroimage.2019.01.011
Bang, J., Spina, S., and Miller, B. L. (2015). Frontotemporal dementia. Lancet 386, 1672–1682. doi: 10.1016/S0140-6736(15)00461-4
Beckers, J., Tharkeshwar, A. K., and Van Damme, P. (2021). C9orf72 ALS-FTD: Recent evidence for dysregulation of the autophagy-lysosome pathway at multiple levels. Autophagy 17, 3306–3322. doi: 10.1080/15548627.2021.1872189
Bettcher, B. M., Wilheim, R., Rigby, T., Green, R., Miller, J. W., Racine, C. A., et al. (2012). C-reactive protein is related to memory and medial temporal brain volume in older adults. Brain Behav. Immun. 26, 103–108. doi: 10.1016/j.bbi.2011.07.240
Bonham, L. W., Geier, E. G., Sirkis, D. W., Leong, J. K., Ramos, E. M., Wang, Q., et al. (2023). Radiogenomics of C9orf72 expansion carriers reveals global transposable element derepression and enables prediction of thalamic atrophy and clinical impairment. J. Neurosci. 43, 333–345. doi: 10.1523/JNEUROSCI.1448-22.2022
Broce, I. J., Caverzasi, E., Sacco, S., Nillo, R. M., Paoletti, M., Desikan, R. S., et al. (2023). PRNP expression predicts imaging findings in sporadic creutzfeldt-jakob disease. Ann. Clin. Transl. Neurol. 10, 536–552. doi: 10.1002/acn3.51739
Casas, C., Herrando-Grabulosa, M., Manzano, R., Mancuso, R., Osta, R., and Navarro, X. (2013). Early presymptomatic cholinergic dysfunction in a murine model of amyotrophic lateral sclerosis. Brain Behav. 3, 145–158. doi: 10.1002/brb3.104
Chio, A., Restagno, G., Brunetti, M., Ossola, I., Calvo, A., Canosa, A., et al. (2012). ALS/FTD phenotype in two Sardinian families carrying both C9ORF72 and TARDBP mutations. J. Neurol. Neurosurg. Psychiatry 83, 730–733. doi: 10.1136/jnnp-2012-302219
Chua, J. P., De Calbiac, H., Kabashi, E., and Barmada, S. J. (2022). Autophagy and ALS: Mechanistic insights and therapeutic implications. Autophagy 18, 254–282. doi: 10.1080/15548627.2021.1926656
Cleveland, D. W., and Rothstein, J. D. (2001). From Charcot to Lou Gehrig: Deciphering selective motor neuron death in ALS. Nat. Rev. Neurosci. 2, 806–819. doi: 10.1038/35097565
Cooper-Knock, J., Hewitt, C., Highley, J. R., Brockington, A., Milano, A., Man, S., et al. (2012). Clinico-pathological features in amyotrophic lateral sclerosis with expansions in C9ORF72. Brain 135(Pt 3), 751–764. doi: 10.1093/brain/awr365
DeJesus-Hernandez, M., Mackenzie, I. R., Boeve, B. F., Boxer, A. L., Baker, M., Rutherford, N. J., et al. (2011). Expanded GGGGCC hexanucleotide repeat in noncoding region of C9ORF72 causes chromosome 9p-linked FTD and ALS. Neuron 72, 245–256. doi: 10.1016/j.neuron.2011.09.011
Desikan, R. S., Segonne, F., Fischl, B., Quinn, B. T., Dickerson, B. C., Blacker, D., et al. (2006). An automated labeling system for subdividing the human cerebral cortex on MRI scans into gyral based regions of interest. Neuroimage 31, 968–980. doi: 10.1016/j.neuroimage.2006.01.021
Dickson, D. W., Baker, M. C., Jackson, J. L., DeJesus-Hernandez, M., Finch, N. A., Tian, S., et al. (2019). Extensive transcriptomic study emphasizes importance of vesicular transport in C9orf72 expansion carriers. Acta Neuropathol. Commun. 7:150. doi: 10.1186/s40478-019-0797-0
Diedrichsen, J., Balsters, J. H., Flavell, J., Cussans, E., and Ramnani, N. (2009). A probabilistic MR atlas of the human cerebellum. Neuroimage 46, 39–46. doi: 10.1016/j.neuroimage.2009.01.045
Ferrari, R., Mok, K., Moreno, J. H., Cosentino, S., Goldman, J., Pietrini, P., et al. (2012). Screening for C9ORF72 repeat expansion in FTLD. Neurobiol. Aging 33:1850.e1–11. doi: 10.1016/j.neurobiolaging.2012.02.017
Genc, B., Jara, J. H., Lagrimas, A. K., Pytel, P., Roos, R. P., Mesulam, M. M., et al. (2017). Apical dendrite degeneration, a novel cellular pathology for Betz cells in ALS. Sci. Rep. 7:41765. doi: 10.1038/srep41765
Gijselinck, I., Cruts, M., and Van Broeckhoven, C. (2018). The genetics of C9orf72 expansions. Cold Spring Harb. Perspect. Med. 8:a026757. doi: 10.1101/cshperspect.a026757
Granatiero, V., Sayles, N. M., Savino, A. M., Konrad, C., Kharas, M. G., Kawamata, H., et al. (2021). Modulation of the IGF1R-MTOR pathway attenuates motor neuron toxicity of human ALS SOD1(G93A) astrocytes. Autophagy 17, 4029–4042. doi: 10.1080/15548627.2021.1899682
Hawrylycz, M. J., Lein, E. S., Guillozet-Bongaarts, A. L., Shen, E. H., Ng, L., Miller, J. A., et al. (2012). An anatomically comprehensive atlas of the adult human brain transcriptome. Nature 489, 391–399. doi: 10.1038/nature11405
Kallstig, E., McCabe, B. D., and Schneider, B. L. (2021). The links between ALS and NF-kappaB. Int. J. Mol. Sci. 22:3875. doi: 10.3390/ijms22083875
Kirola, L., Mukherjee, A., and Mutsuddi, M. (2022). Recent updates on the genetics of amyotrophic lateral sclerosis and frontotemporal dementia. Mol. Neurobiol. 59, 5673–5694. doi: 10.1007/s12035-022-02934-z
Kril, J. J., and Halliday, G. M. (2004). Clinicopathological staging of frontotemporal dementia severity: Correlation with regional atrophy. Dement. Geriatr. Cogn. Disord. 17, 311–315. doi: 10.1159/000077161
Langfelder, P., and Horvath, S. (2008). WGCNA: An R package for weighted correlation network analysis. BMC Bioinformatics 9:559. doi: 10.1186/1471-2105-9-559
Lee, S. E., Khazenzon, A. M., Trujillo, A. J., Guo, C. C., Yokoyama, J. S., Sha, S. J., et al. (2014). Altered network connectivity in frontotemporal dementia with C9orf72 hexanucleotide repeat expansion. Brain 137(Pt 11), 3047–3060. doi: 10.1093/brain/awu248
Lin, L. C., Nana, A. L., Hepker, M., Hwang, J. L., Gaus, S. E., Spina, S., et al. (2019). Preferential tau aggregation in von Economo neurons and fork cells in frontotemporal lobar degeneration with specific MAPT variants. Acta Neuropathol. Commun. 7:159. doi: 10.1186/s40478-019-0809-0
Ljubenkov, P. A., and Miller, B. L. (2016). A clinical guide to frontotemporal dementias. Focus 14, 448–464. doi: 10.1176/appi.focus.20160018
Markello, R. D., Arnatkeviciute, A., Poline, J. B., Fulcher, B. D., Fornito, A., and Misic, B. (2021). Standardizing workflows in imaging transcriptomics with the abagen toolbox. eLife 10:e72129. doi: 10.7554/eLife.72129
Masuda, M., Senda, J., Watanabe, H., Epifanio, B., Tanaka, Y., Imai, K., et al. (2016). Involvement of the caudate nucleus head and its networks in sporadic amyotrophic lateral sclerosis-frontotemporal dementia continuum. Amyotroph. Lateral Scler. Frontotemporal. Degener. 17, 571–579. doi: 10.1080/21678421.2016.1211151
McColgan, P., Joubert, J., Tabrizi, S. J., and Rees, G. (2020). The human motor cortex microcircuit: Insights for neurodegenerative disease. Nat. Rev. Neurosci. 21, 401–415. doi: 10.1038/s41583-020-0315-1
Millecamps, S., Boillee, S., Le Ber, I., Seilhean, D., Teyssou, E., Giraudeau, M., et al. (2012). Phenotype difference between ALS patients with expanded repeats in C9ORF72 and patients with mutations in other ALS-related genes. J. Med. Genet. 49, 258–263. doi: 10.1136/jmedgenet-2011-100699
Mirzaeva, D., Prokhorova, A., and Muinjanov, B. (2016). Association of amyotrophic lateral sclerosis with basal ganglia impairment (P4.308). Neurology 86:4.308.
Murtagh, F., and Contreras, P. (2017). Algorithms for hierarchical clustering: An overview, II. WIREs Data Min. Knowl. Discov. 7:e1219. doi: 10.1002/widm.1219
Nana, A. L., Sidhu, M., Gaus, S. E., Hwang, J. L., Li, L., Park, Y., et al. (2019). Neurons selectively targeted in frontotemporal dementia reveal early stage TDP-43 pathobiology. Acta Neuropathol. 137, 27–46. doi: 10.1007/s00401-018-1942-8
Ohshiro, T., Asai, A., Konno, M., Ohkawa, M., Komoto, Y., Ofusa, K., et al. (2022). Direct observation of DNA alterations induced by a DNA disruptor. Sci. Rep. 12:6945. doi: 10.1038/s41598-022-10725-8
Rabinovici, G. D., and Miller, B. L. (2010). Frontotemporal lobar degeneration: Epidemiology, pathophysiology, diagnosis and management. CNS Drugs 24, 375–398. doi: 10.2165/11533100-000000000-00000
Rascovsky, K., Hodges, J. R., Knopman, D., Mendez, M. F., Kramer, J. H., Neuhaus, J., et al. (2011). Sensitivity of revised diagnostic criteria for the behavioural variant of frontotemporal dementia. Brain 134(Pt 9), 2456–2477. doi: 10.1093/brain/awr179
Renton, A. E., Majounie, E., Waite, A., Simon-Sanchez, J., Rollinson, S., Gibbs, J. R., et al. (2011). A hexanucleotide repeat expansion in C9ORF72 is the cause of chromosome 9p21-linked ALS-FTD. Neuron 72, 257–268. doi: 10.1016/j.neuron.2011.09.010
Riku, Y., Watanabe, H., Yoshida, M., Mimuro, M., Iwasaki, Y., Masuda, M., et al. (2016). Marked involvement of the striatal efferent system in TAR DNA-binding protein 43 kDa-related frontotemporal lobar degeneration and amyotrophic lateral sclerosis. J. Neuropathol. Exp. Neurol. 75, 801–811. doi: 10.1093/jnen/nlw053
Riku, Y., Watanabe, H., Yoshida, M., Mimuro, M., Iwasaki, Y., Masuda, M., et al. (2017). Pathologic involvement of glutamatergic striatal inputs from the cortices in TAR DNA-Binding protein 43 kDa-related frontotemporal lobar degeneration and amyotrophic lateral sclerosis. J. Neuropathol. Exp. Neurol. 76, 759–768. doi: 10.1093/jnen/nlx055
Rosness, T. A., Haugen, P. K., and Engedal, K. (2008). Support to family carers of patients with frontotemporal dementia. Aging Ment. Health 12, 462–466. doi: 10.1080/13607860802224334
Seeley, W. W., Crawford, R., Rascovsky, K., Kramer, J. H., Weiner, M., Miller, B. L., et al. (2008). Frontal paralimbic network atrophy in very mild behavioral variant frontotemporal dementia. Arch. Neurol. 65, 249–255. doi: 10.1001/archneurol.2007.38
Seeley, W. W., Menon, V., Schatzberg, A. F., Keller, J., Glover, G. H., Kenna, H., et al. (2007). Dissociable intrinsic connectivity networks for salience processing and executive control. J. Neurosci. 27, 2349–2356. doi: 10.1523/JNEUROSCI.5587-06.2007
Serpente, M., Fenoglio, C., Cioffi, S. M., Bonsi, R., Arighi, A., Fumagalli, G. G., et al. (2015). Profiling of ubiquitination pathway genes in peripheral cells from patients with frontotemporal dementia due to C9ORF72 and GRN mutations. Int. J. Mol. Sci. 16, 1385–1394. doi: 10.3390/ijms16011385
Sha, S. J., Takada, L. T., Rankin, K. P., Yokoyama, J. S., Rutherford, N. J., Fong, J. C., et al. (2012). Frontotemporal dementia due to C9ORF72 mutations: Clinical and imaging features. Neurology 79, 1002–1011. doi: 10.1212/WNL.0b013e318268452e
Shao, Q., Yang, M., Liang, C., Ma, L., Zhang, W., Jiang, Z., et al. (2020). C9orf72 and smcr8 mutant mice reveal MTORC1 activation due to impaired lysosomal degradation and exocytosis. Autophagy 16, 1635–1650. doi: 10.1080/15548627.2019.1703353
Sobue, G., Ishigaki, S., and Watanabe, H. (2018). Pathogenesis of Frontotemporal lobar degeneration: Insights from loss of function theory and early involvement of the caudate Nucleus. Front. Neurosci, 12:473. doi: 10.3389/fnins.2018.00473
Uddin, L. Q. (2015). Salience processing and insular cortical function and dysfunction. Nat. Rev. Neurosci. 16, 55–61. doi: 10.1038/nrn3857
Ulgen, E., Ozisik, O., and Sezerman, O. U. (2019). pathfindR: An R package for comprehensive identification of enriched pathways in omics data through active subnetworks. Front. Genet. 10:858. doi: 10.3389/fgene.2019.00858
van Blitterswijk, M., van Es, M. A., Hennekam, E. A., Dooijes, D., van Rheenen, W., Medic, J., et al. (2012). Evidence for an oligogenic basis of amyotrophic lateral sclerosis. Hum. Mol. Genet. 21, 3776–3784. doi: 10.1093/hmg/dds199
Van Mossevelde, S., van der Zee, J., Gijselinck, I., Engelborghs, S., Sieben, A., Van Langenhove, T., et al. (2016). Clinical features of TBK1 carriers compared with C9orf72, GRN and non-mutation carriers in a Belgian cohort. Brain 139(Pt 2), 452–467. doi: 10.1093/brain/awv358
van Vliet, D., de Vugt, M. E., Bakker, C., Pijnenburg, Y. A., Vernooij-Dassen, M. J., Koopmans, R. T., et al. (2013). Time to diagnosis in young-onset dementia as compared with late-onset dementia. Psychol. Med. 43, 423–432. doi: 10.1017/S0033291712001122
Vatsavayai, S. C., Nana, A. L., Yokoyama, J. S., and Seeley, W. W. (2019). C9orf72-FTD/ALS pathogenesis: Evidence from human neuropathological studies. Acta Neuropathol. 137, 1–26. doi: 10.1007/s00401-018-1921-0
Vatsavayai, S. C., Yoon, S. J., Gardner, R. C., Gendron, T. F., Vargas, J. N., Trujillo, A., et al. (2016). Timing and significance of pathological features in C9orf72 expansion-associated frontotemporal dementia. Brain 139(Pt 12), 3202–3216. doi: 10.1093/brain/aww250
Vinceti, G., Olney, N., Mandelli, M. L., Spina, S., Hubbard, H. I., Santos-Santos, M. A., et al. (2019). Primary progressive aphasia and the FTD-MND spectrum disorders: Clinical, pathological, and neuroimaging correlates. Amyotroph. Lateral Scler Frontotemporal. Degener. 20, 146–158. doi: 10.1080/21678421.2018.1556695
Winkler, A. M., Kochunov, P., Blangero, J., Almasy, L., Zilles, K., Fox, P. T., et al. (2010). Cortical thickness or grey matter volume? The importance of selecting the phenotype for imaging genetics studies. Neuroimage 53, 1135–1146. doi: 10.1016/j.neuroimage.2009.12.028
Ye, F., Funk, Q., Rockers, E., Shulman, J. M., Masdeu, J. C., Pascual, B., et al. (2022). In Alzheimer-prone brain regions, metabolism and risk-gene expression are strongly correlated. Brain Commun. 4:fcac216. doi: 10.1093/braincomms/fcac216
Yokoyama, J. S., Sirkis, D. W., and Miller, B. L. (2014). C9ORF72 hexanucleotide repeats in behavioral and motor neuron disease: Clinical heterogeneity and pathological diversity. Am. J. Neurodegener. Dis. 3, 1–18.
Keywords: C9orf72, amyotrophic lateral sclerosis, frontotemporal dementia, imaging transcriptomics, gene networks, neurodegeneration
Citation: Broce IJ, Sirkis DW, Nillo RM, Bonham LW, Lee SE, Miller BL, Castruita PA, Sturm VE, Sugrue LS, Desikan RS and Yokoyama JS (2024) C9orf72 gene networks in the human brain correlate with cortical thickness in C9-FTD and implicate vulnerable cell types. Front. Neurosci. 18:1258996. doi: 10.3389/fnins.2024.1258996
Received: 14 July 2023; Accepted: 15 January 2024;
Published: 26 February 2024.
Edited by:
Alan Edward Renton, Icahn School of Medicine at Mount Sinai, United StatesReviewed by:
Pentti Tienari, University of Helsinki, FinlandCopyright © 2024 Broce, Sirkis, Nillo, Bonham, Lee, Miller, Castruita, Sturm, Sugrue, Desikan and Yokoyama. This is an open-access article distributed under the terms of the Creative Commons Attribution License (CC BY). The use, distribution or reproduction in other forums is permitted, provided the original author(s) and the copyright owner(s) are credited and that the original publication in this journal is cited, in accordance with accepted academic practice. No use, distribution or reproduction is permitted which does not comply with these terms.
*Correspondence: Iris J. Broce, aWJyb2NlQGhlYWx0aC51Y3NkLmVkdQ==; Jennifer S. Yokoyama, amVubmlmZXIueW9rb3lhbWFAdWNzZi5lZHU=
Disclaimer: All claims expressed in this article are solely those of the authors and do not necessarily represent those of their affiliated organizations, or those of the publisher, the editors and the reviewers. Any product that may be evaluated in this article or claim that may be made by its manufacturer is not guaranteed or endorsed by the publisher.
Research integrity at Frontiers
Learn more about the work of our research integrity team to safeguard the quality of each article we publish.