 Thomas Mitzelfelt1†
 Xiaohan Bao
 Stephen G. Lomber
- 1Department of Physiology, McGill University, Montreal, QC, Canada
- 2Integrated Program in Neuroscience, McGill University, Montreal, QC, Canada
Introduction: Congenitally deaf cats perform better on visual localization tasks than hearing cats, and this advantage has been attributed to the posterior auditory field. Successful visual localization requires both visual processing of the target and timely generation of an action to approach the target. Activation of auditory cortex in deaf subjects during visual localization in the peripheral visual field can occur either via bottom-up stimulus-driven and/or top-down goal-directed pathways.
Methods: In this study, we recorded visually evoked potentials (VEPs) in response to a reversing checkerboard stimulus presented in the hemifield contralateral to the recorded hemisphere in both hearing and deaf cats under light anesthesia.
Results: Although VEP amplitudes and latencies were systematically modulated by stimulus eccentricity, we found little evidence of changes in VEP in deaf cats that can explain their behavioral advantage. A statistical trend was observed, showing larger peak amplitudes and shorter peak latencies in deaf subjects for stimuli in the near- and mid-peripheral field. Additionally, latency of the P1 wave component had a larger inter-sweep variation in deaf subjects.
Discussion: Our results suggested that cross-modal plasticity following deafness does not play a major part in cortical processing of the peripheral visual field when the “vision for action” system is not recruited.
Introduction
Visual enhancement in the far-peripheral visual field of congenitally deaf humans and animals is one of the most impressive examples of compensatory cross-modal plasticity (Neville and Lawson, 1987; Bavelier et al., 2000; Lomber et al., 2010). In cats, the neural mechanism of this observed enhancement has been demonstrated to involve deaf auditory cortex. Deactivation of the region posterior to primary auditory cortex (i.e., the posterior auditory field, PAF) decreases enhanced visual localization performance in deaf cats to a level no different from hearing cats, indicating its involvement (Lomber et al., 2010). It is particularly interesting that the greatest enhancement of visual localization in deaf cats is observed at the largest eccentricities (furthest into the periphery), suggesting they rely more on visual cues for orientation behavior. Conversely, in hearing cats, auditory cues contribute more significantly to orientation behavior whereas visual cues in the far periphery are less significant.
Visual orientation, in its most general definition, includes any visually guided behavior where gaze is redirected toward a target, e.g., predator or prey (primates: Lisberger and Fuchs, 1978a,b; grasshopper: Szentesi et al., 1996; cat: Lomber and Payne, 2004), through movement in the body, head, and/or eyes (gaze). Orientation behavior is a vital neurological function for survival that involves both cortical and subcortical circuits. The superior colliculus (SC) is deemed as the most prominent modality-unspecific sensorimotor hub in mammals (King, 2004), which acquires the retinotopic map of its direct visual inputs from retinal ganglion neurons and receives modulation of its indirect inputs from cerebral cortex (Schiller et al., 1974; Mize and Murphy, 1976). In primate cortex, it has been identified that neurons in the frontal eye field respond specifically to locations in the visual field, that correspond to either the location of the visual stimulus or the destination of the intended saccade (Thompson et al., 2005). It is proposed that visual orientation (or saccadic eye movement, to be more specific) is triggered by a combination of neuronal activity related to both stimulus-driven bottom-up visual processing and goal-directed top-down motor generation. Human behavioral experiments have shown that subjects can make faster saccade responses when the visual stimulus is more salient, or when the target location is easier to predict (Marino and Munoz, 2009).
Considering permanent lesion or reversible deactivation studies, cat area 5 and part of area 6 have been found to be essential for the action of orientation behavior, as their deactivation eliminates both acoustic and visual localization (Malhotra et al., 2004). Some other areas are essential for acoustic-specific orientation, such as the primary auditory cortex, PAF, and anterior ectosylvian sulcus (AES) (Malhotra et al., 2004). Areas such as the posterior middle suprasylvian sulcus (pMS), dorsal posterior ectosylvian gyrus (dPE), and posterior suprasylvian sulcus (PS) are critical for visual orientation (Lomber and Payne, 2004). In cat auditory cortex, many areas including PAF contain neurons that respond to sound for selective source locations (Stecker et al., 2003; Lee and Middlebrooks, 2013). It has also been shown that AES in deaf cats is implicated in visual rather than auditory localization following cross-modal plastic changes (Meredith et al., 2011). It is unclear whether activity in AES contributes to the bottom-up, stimulus-driven, or top-down, goal-directed pathway.
Previous human studies have found that visually evoked potentials (VEPs) in congenital deaf subjects demonstrated shorter peak latency in early VEP component N85 (Hauthal et al., 2014), and larger magnitudes in P100 (Hauthal et al., 2014), N150, and P230 (Neville et al., 1983) when compared to normal hearing subjects. In cochlear-implanted children, shorter latency of the visual N1 component (Corina et al., 2017) and the higher occurrence and amplitude of oscillations in the N1-P2 complex (Campbell and Sharma, 2016) were found in comparison to normal hearing subjects. Brain imaging studies have also shown that areas in auditory cortex were activated by visual stimulus in deaf sign language users (Fine et al., 2005), in congenital deaf (Finney et al., 2001, 2003; Scott et al., 2014), when compared to hearing volunteers.
To investigate the stimulus-driven neural activity associated with visual localization, we recorded VEPs in response to a checkerboard stimulus present at one of seven eccentricity markers, between 0 and 90 degrees away from the midline in hearing and deaf cats under light anesthesia. Although VEPs are widely used in research and clinical applications (e.g., Laron et al., 2009), we were surprised to find that no existing documentation of VEP studies included far-peripheral stimuli as done previously in a cat visual localization task (Lomber et al., 2010). As expected, VEPs decayed exponentially with increasing eccentricity in both the hearing and deaf groups. However, we did not see a dramatic difference in VEPs between the two groups, suggesting a lack of cortical cross-modal plasticity involvement in sensory processing of the peripheral visual field.
Materials and methods
All procedures were conducted in compliance with the National Research Council’s Guide for the Care and Use of Laboratory Animals (8th edition; 2011) and the Canadian Council on Animal Care’s Guide to the Care and Use of Experimental Animals (1993). Furthermore, the following procedures were approved by the Animal Care Committee for Faculty of Medicine and Health Sciences at McGill University.
Deafening
Early deafness was produced in five cats using systemic ototoxic procedures. Before 21 days postnatal, three kittens received co-administration of subcutaneous kanamycin (300 mg/kg) and intravenous furosemide (2 mg/mL to effect; Valent Pharmaceuticals, Laval, QC, Canada). This drug combination has been identified to damage cochlear hair cells and induce profound, bilateral deafness (Schwaber et al., 1993). Throughout the procedure, auditory brainstem responses (ABRs) were measured to monitor the degree of hearing loss. Two other newborn cats received neomycin daily from the day of birth to between postnatal days 26 and 28 (Leake et al., 1991, 1997) before ABRs showed profound hearing loss. All five cats were confirmed deaf (click ABR threshold higher than 80 dB HL) in a follow-up ABR procedure at least 3 months later.
Animal preparation and anesthesia
In total, 12 cats (7 hearing and 5 early deaf) were examined. One hearing subject was excluded for poor signal quality leaving both groups with comparable sex and age distribution (hearing: 71.4% female and mean age 4.2 years; deaf: 60% female and mean age 3.1 years). After the subject was sedated using 0.04 mg/kg dexmedetomidine (Dexdomitor, Zoetis) injected intramuscularly, the left eye was occluded using a hard black contact lens so that visual stimuli were presented unilaterally. Phenylephrine (Mydfrin, Alcon) was applied to the right eye to dilate the pupil, and saline drops were used as lubrication. Hearing subjects were also ear-plugged to minimize auditory input. During stimulus presentation and EEG recording, the anesthesia level was closely monitored and remained stable so that there were rarely any cases of artifact from subject movement in the raw signal. Data collection was terminated either by 45 min after the injection or at the end of the session during which any sign of subject movement was noticed. After removing the electrodes, contact lens, and ear plugs, the subject received an intramuscularly injection with 0.4 mg/kg atipamezole (Antisedan, Zoetis) to facilitate recovery from sedation. Given the large range of stimulus eccentricities selected (0–90 degree), the minor horizontal eye movements previously reported in anesthetized but non-paralyzed cats (O’Keefe and Berkley, 1991) should not confound the effect of stimulus eccentricity. As such, our subjects were maintained in centrally-gazed position without the use of neuromuscular blockers.
Visual stimulation
The visual stimuli were presented to subjects from a 30-inch 2,560-by-1,600 LED screen with 178-degree horizontal and vertical viewing angles (Dell, U3014). To cover a wide azimuth range of visual field, the screen was placed 6.5 inch away from the right eye to the 45-deg front-right of subject (Figure 1A). The stimulus used to evoke VEPs was 12-deg-wide circular checkerboards with dartboard pattern (3 concentric rings, 8 divisions per ring). To occupy roughly the same size of visual field from the cat’s perspective, stimuli presented on the screen were the warped projection of the checkerboard, depending on how much stimulus eccentricity (0-, 15-, 30-, or 45-deg) deviated from 45 degrees (Figure 1C). For the same reason, the luminance of the bright cells in the checkerboard was calibrated to 100 cd/m2 individually for each eccentricity from different angles (Konica Minolta, LS160).
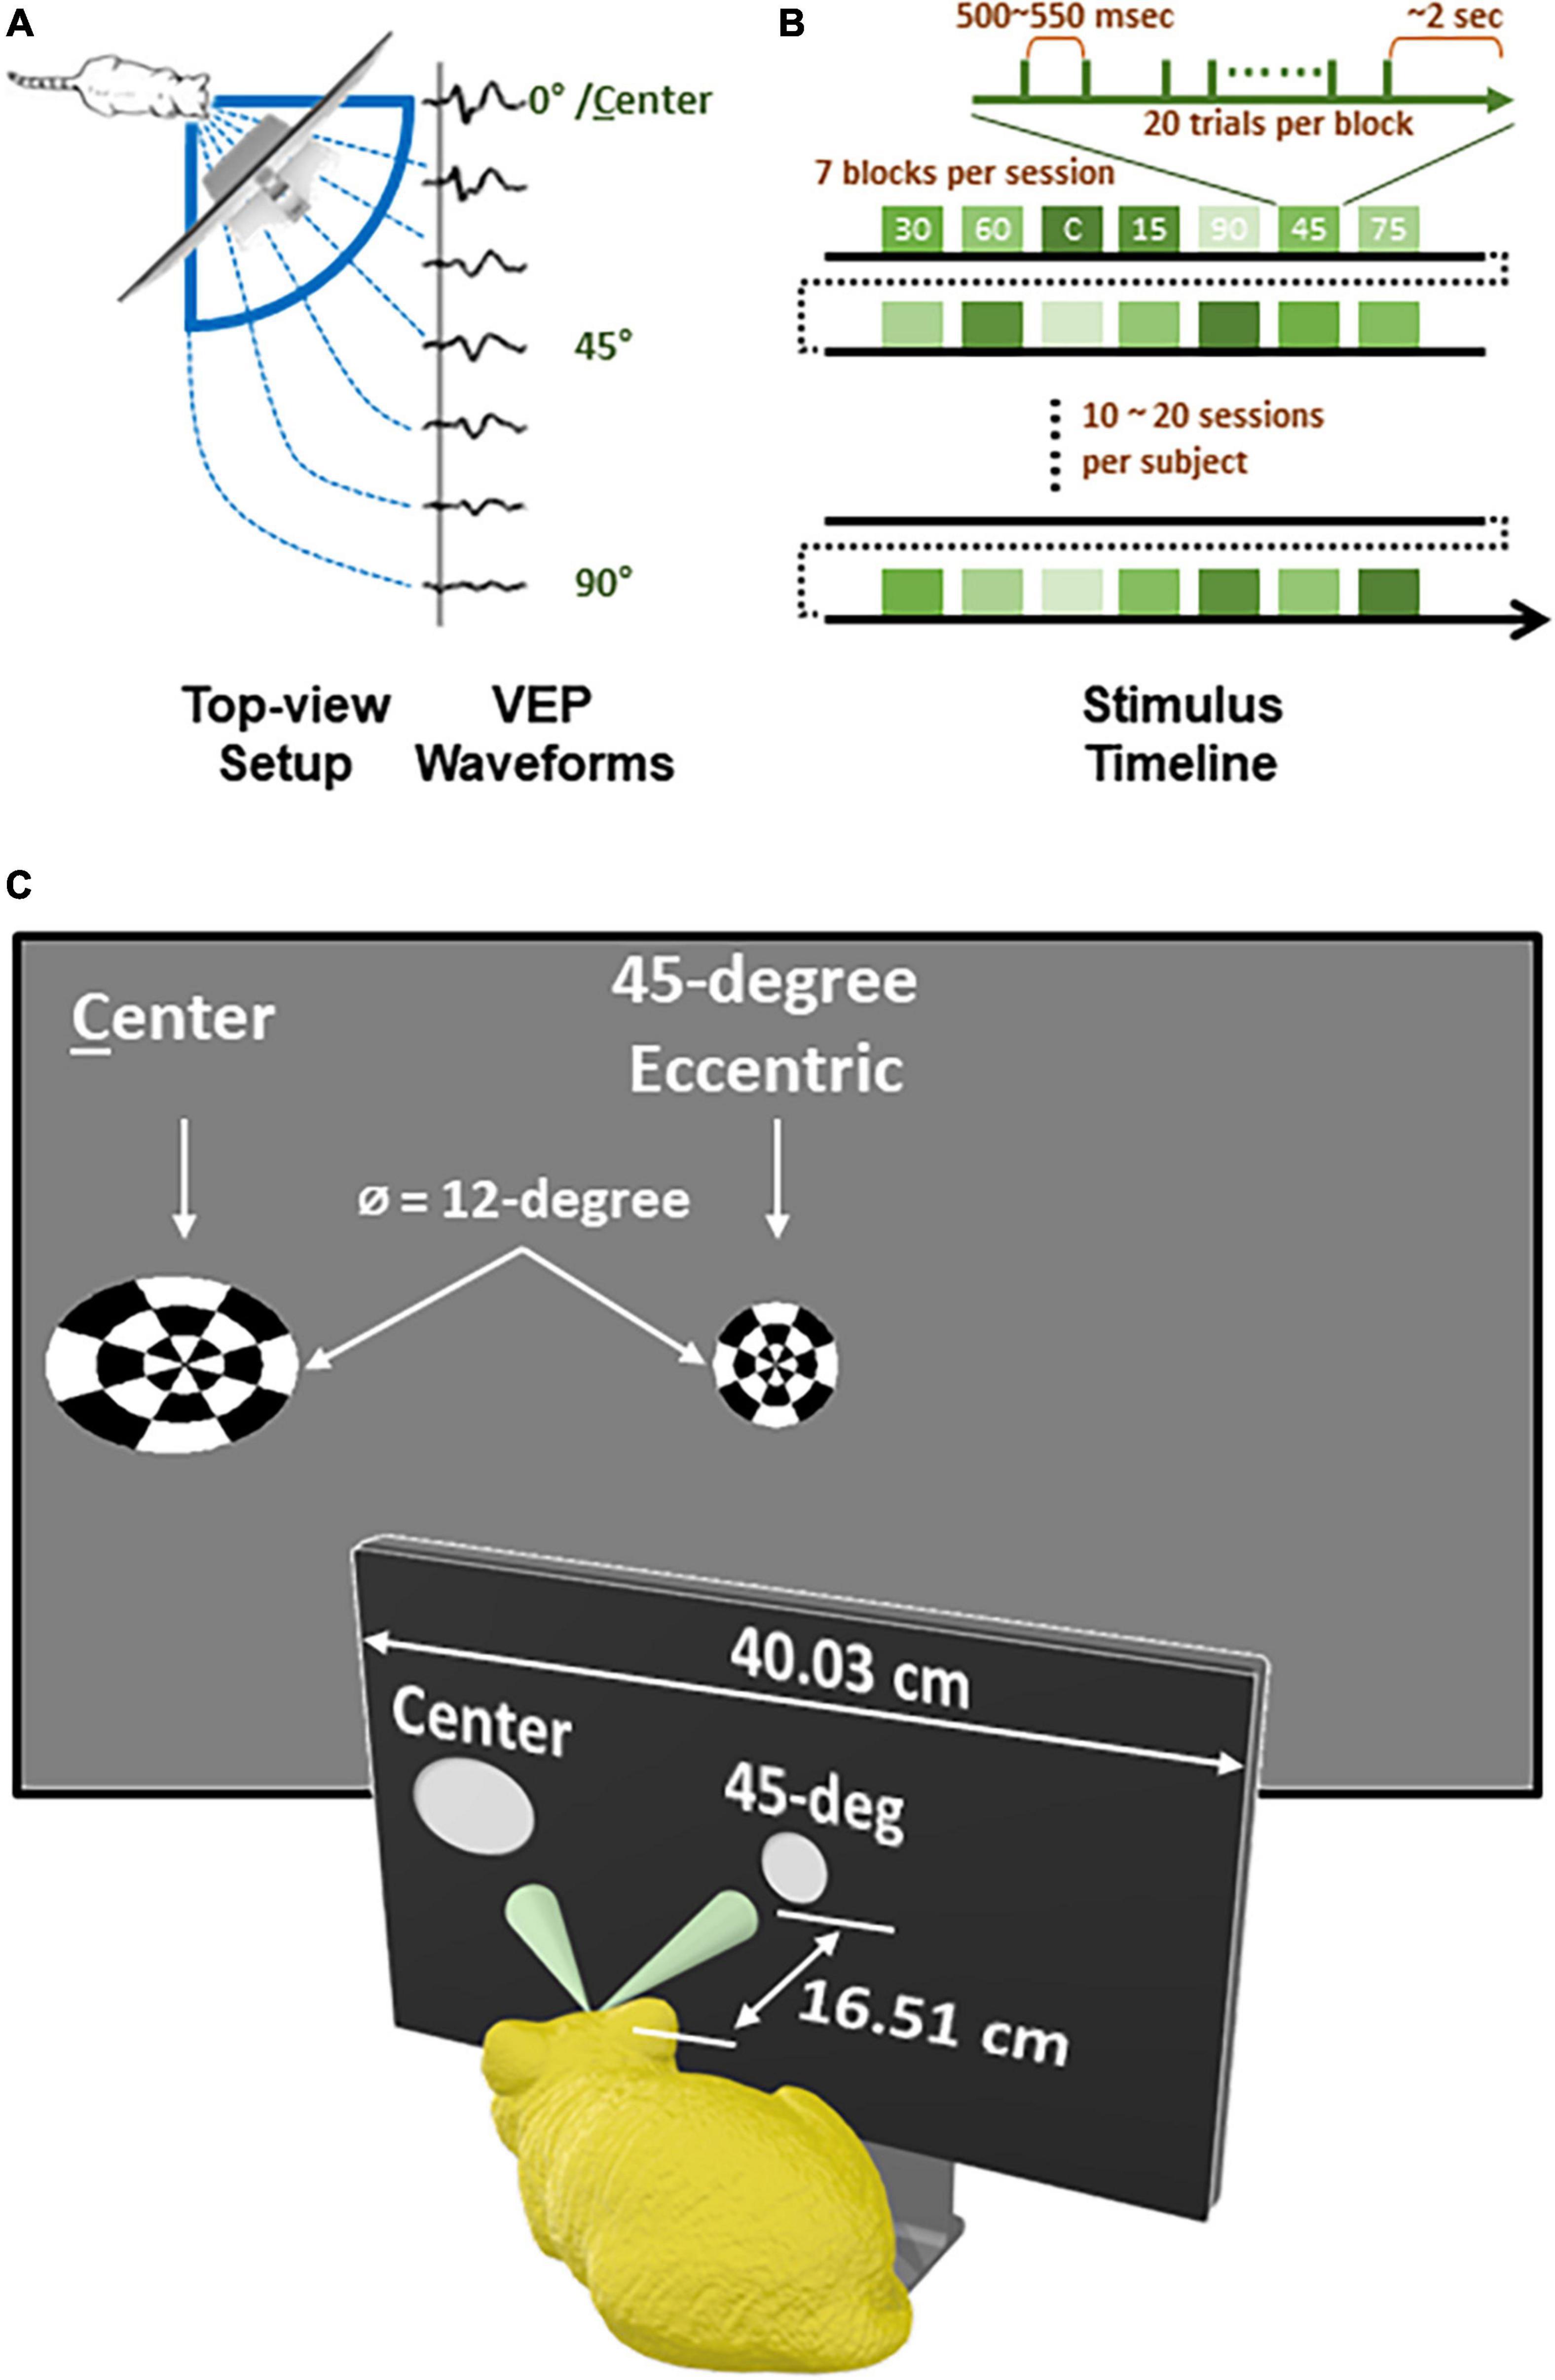
Figure 1. Experiment design and recording timeline of each subject. (A) A top-view diagram showing how checkerboard stimuli of varying eccentricity were present to animal subject and corresponding VEP waveforms for each eccentricity. (B) A timeline of recording for each subject. (C) Stimuli viewed from subject’s perspective.
All stimuli were programmed and controlled with PsychToolbox (Brainard, 1997; Pelli, 1997; Kleiner et al., 2007) run on MATLAB, rendered by a graphic card (AMD, Radeon HD 6800 Series), and transited at a video processing unit (Cambridge Research System, Bits#) for generating stimulus timestamps. Once a subject was under stable sedation, EEG data was collected while visual stimuli were presented for 10 to 20 sessions (Figure 1B). Each session lasted for ∼1.5 min, consisting of 7 blocks for different eccentricities in randomized order. In each block, the stimulus inverted 20 times (i.e., 20 sweeps), with inter-sweep interval randomly set between 500 and 550 milliseconds. Between two blocks, there was a 2-second-long black screen. At the end of each session, the level of sedation was re-evaluated, with measurement of heart rate, SpO2, respiration, and electrode impedances taken if needed, before starting the next session.
EEG recording and signal processing
Three 25G stainless steel needles were placed subcutaneously as recording electrodes. The active electrode was placed near the midpoint of subject’s interaural line, while the reference electrode was placed inferior to the right ear (ipsilateral to the side of visual stimulation). The ground electrode was placed on subject’s dorsum. The impedance of both active and reference electrodes was maintained below 3 kOhm during recording. The signal was amplified and digitized with a pre-amplifier (TDT, RA4LI/RA4PA), streamed onto a digital signal processor (TDT, RZ2), and stored on a computer hard drive.
All data analysis was performed offline. The signal was digitally filtered between 1 and 30 Hz (about 10 dB/octave roll-off) and notch-filtered at 30, 60, 120, 180, and 240 Hz, before epochs were extracted from 80-ms pre-stimulus to 400-ms post-stimulus. All epochs were demeaned with their pre-stimulus baselines individually, before being grouped by stimulus eccentricity and further processed separately (e.g., averaging or resampling).
Data analysis
Root-mean-square values were obtained using MATLAB built-in function rms(). Each averaged waveform was separated into an 80-ms pre-stimulus zero-mean baseline window and 400-ms post-stimulus response window, producing two RMS values, respectively. The corrected RMS value was calculated as in the following equation:
Curve fitting of the corrected RMS as a function of stimulus eccentricity was performed in MATLAB and its Curve Fitting Toolbox™. We first obtained the initial values for the model coefficients using function polyfit(), where the corrected RMS values were first converted into logarithmic space for exponential modeling. Then, function fit() was used to fine tune the model coefficients with customized anonymous functions RMScorrected = a⋅eb⋅Eccentricity for exponential modeling, and RMScorrected = k⋅Eccentricty + b for linear modeling, and to evaluate the goodness of fit.
To analyze peak components (N1, P1, and N2 components), we first manually determined a window surrounding the candidate of interest by interactively overlaying a pair of cursors with the averaged VEP waveform. This process was visually guided with graphical information including polarity, amplitude, latency, as well as the entire waveform and other peak components. Bounded by this window, either a minimum or maximum was identified with MATLAB built-in function min() or max() for the calculation of amplitude and latency.
To quantify the inter-sweep variability, we chose 18 out of total 20 sweeps (90%) before averaging to generate 190 resampled waveforms for each stimulus eccentricity in each subject. Here we only included the first 10 sessions, even when there were more sessions recorded in some subjects. The reference latency was determined from the waveform averaged from all 200 sweeps in the same way as described above. In each resampled waveform, the peak with a latency closest to the reference latency was taken as a resampled latency. Probability density functions, which were re-centered to the reference latency, were given by MATLAB built-in function ksdensity(). Mean absolute deviations (MADs) were calculated using MATLAB built-in function mad().
Statistical analysis
For corrected RMS values, peak amplitudes and latencies of the three components, we adopted two-way mixed-design ANOVA with deafness as the between-group variable and stimulus eccentricity as the within-group variable. As the motivation of the current study is to compare VEP traces between hearing and deaf cats, we enforced the “simple effect” test at each of seven stimulus eccentricity levels, regardless of whether the main effect of deafness is significant. Due to a small sample size in this study, both parametric (two-sample Student’s t-test, t-test2() in MATLAB) and non-parametric (Mann–Whitney U test, ranksum() in MATLAB) methods were used, and the largest p-values of the two tests were used to report statistical significance, without correction for multiple comparison. For latency jitter MADs, data of different stimulus eccentricity from different subjects were pooled together for comparison between hearing and deaf cats. The effect of deafness on MADs was examined by ANCOVA with peak amplitude as a covariate. All statistics were performed in MATLAB and its Statistics and Machine Learning Toolbox™.
Results
In this study, we recorded VEPs in response to checkerboards presented at seven different eccentricities, from 0 to 90 degrees, in seven hearing and five early deaf cats. The recorded data in all except for one hearing subject were of good quality, in respect to the signal-to-noise ratio, and were further analyzed and reported below.
Waveforms
First, we vertically stacked the averaged VEP waveforms for each hearing and deaf subject in the order of stimulus eccentricity (Figure 2). For the smaller eccentricities (upper rows), the VEP waveforms were not distinctively different between the two groups. However, the VEP responses seemed to scale down more drastically in deaf subjects than in hearing subjects as stimulus eccentricity increased.
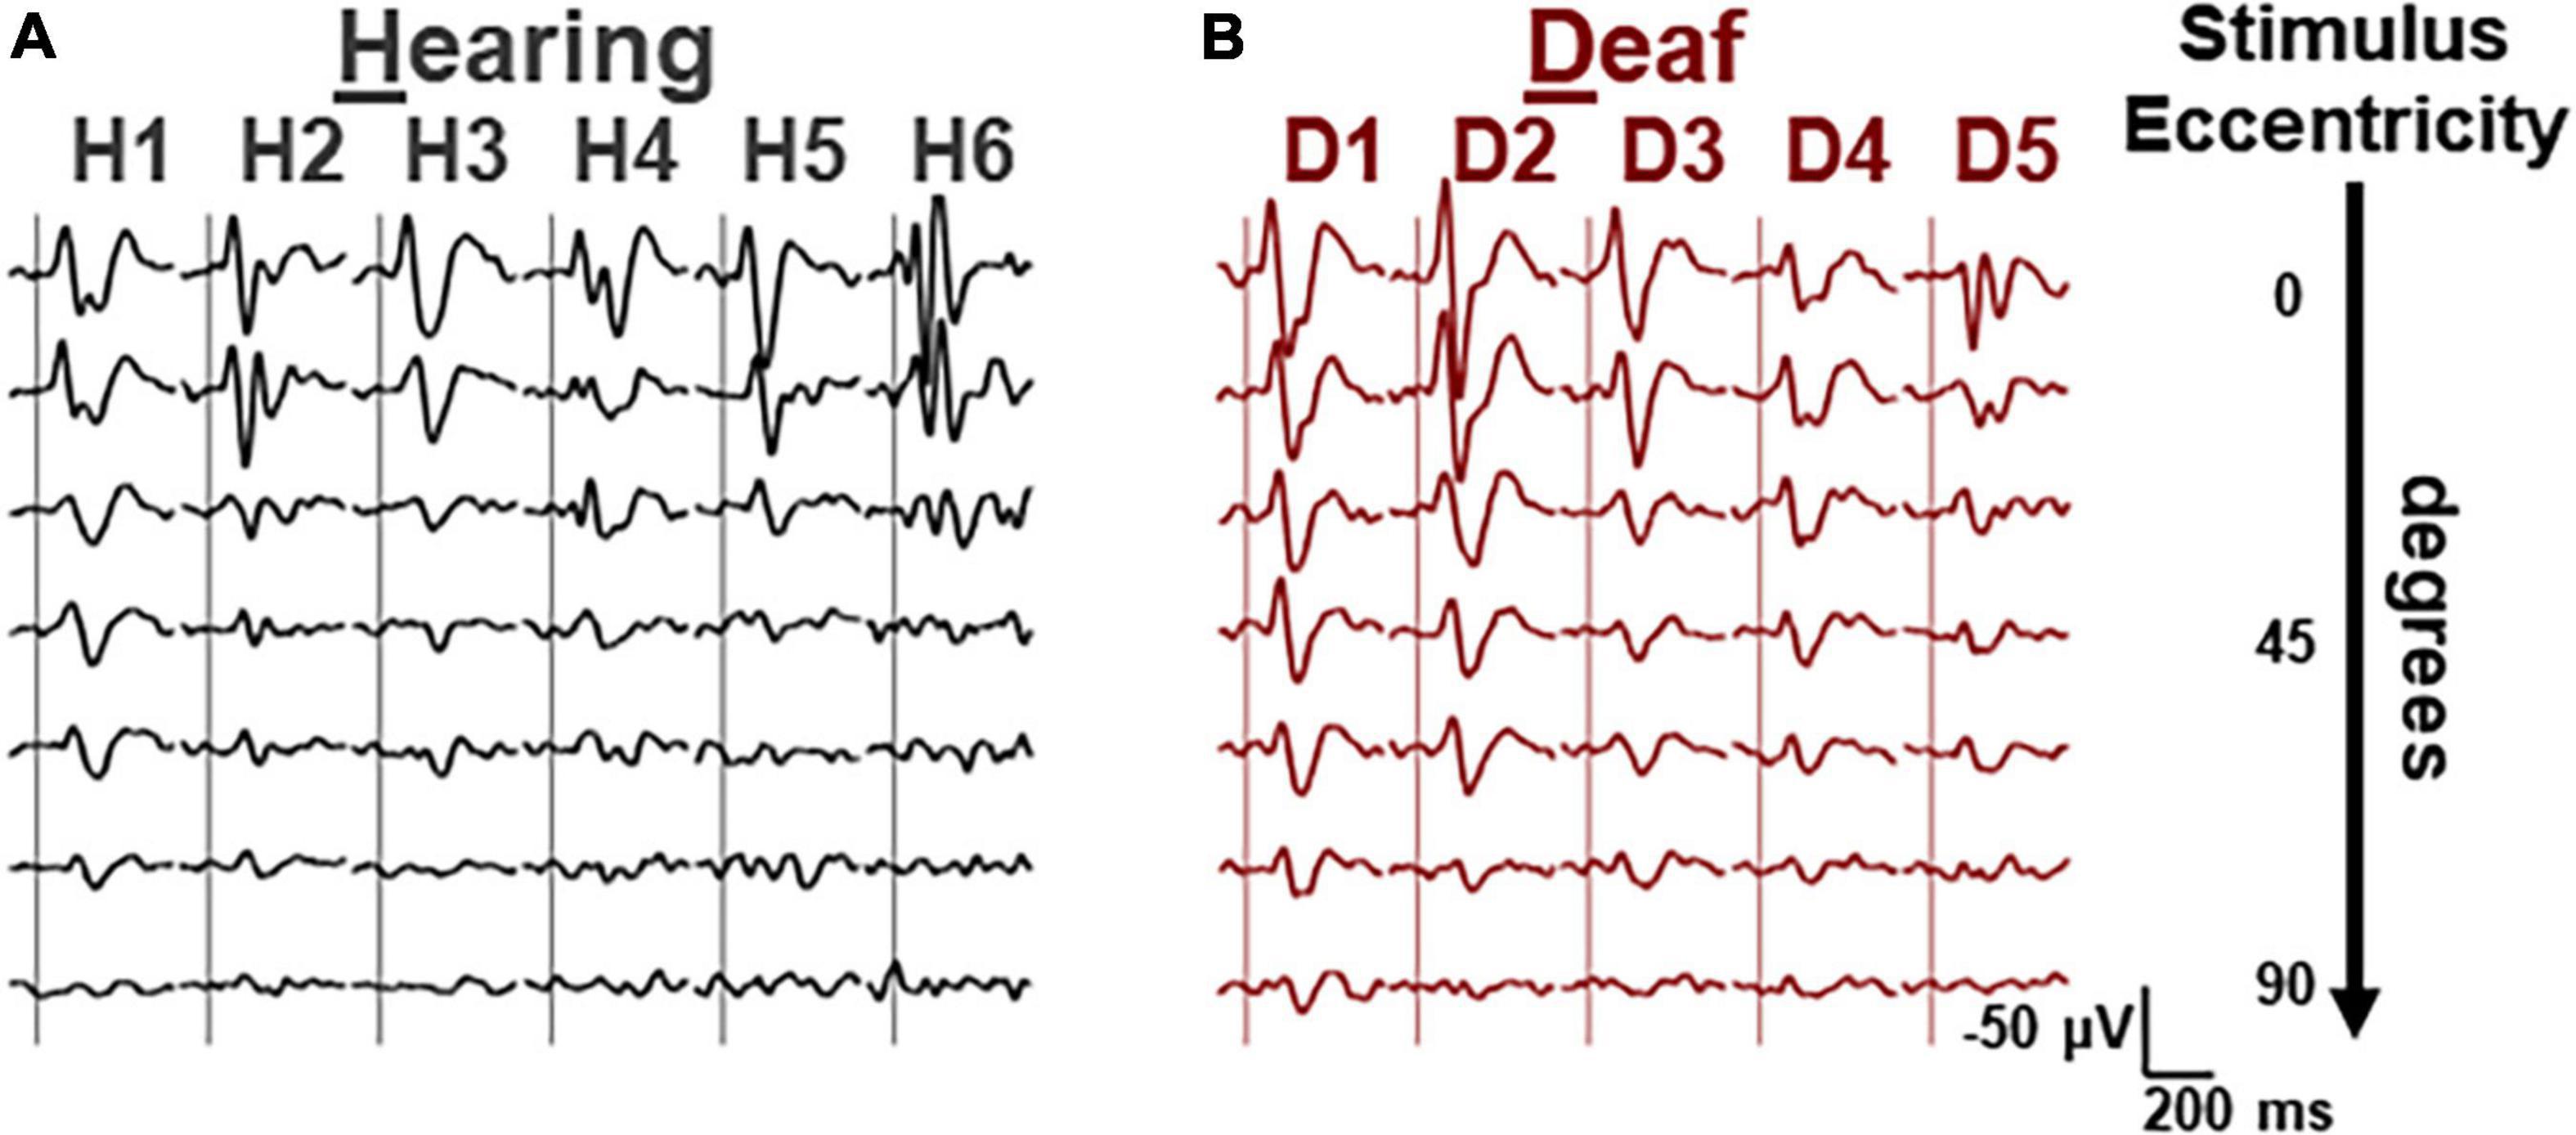
Figure 2. Averaged VEP waveforms for different eccentricities of each subject. (A) Waveforms from the data collected from 6 hearing cats, grouped by subject and stacked in each column. Stimulus eccentricity increases for the waveforms from the top (central) to the bottom (90 deg). (B) Waveforms of 6 deaf cats. Same scalars are applied to both hearing and deaf waveforms. Horizontal, 200 ms. Vertical, 50 μV, negative-up.
Root-mean-square (RMS) level
To quantify VEP responses with the least in prior bias, we calculated the noise-corrected root-mean-square (RMS) of the waveform in the entire post-stimulus window (i.e., 400-ms) for each subject and compared between hearing and deaf groups (Figure 3). In both groups, the median of the corrected RMSs decayed monotonously with increasing eccentricity (Figure 3A). A two-way mixed-design ANOVA showed that the effect of stimulus eccentricity was significant [F(6,54) = 52.02, p < 0.001], but not the effect of deafness or the interaction between eccentricity and deafness. For stimuli at the 45-degree and 60-degree eccentricities, the median of RMSs in the deaf group was higher than the hearing group with a large effect size quantified as Cohen’s d (see Table 1). We also investigated the effect of stimulus eccentricity and the trend of decay in RMS at the individual subject level (Figure 3B). Both non-linear and linear models were adopted to fit the RMSs as a function of eccentricity. All 11 subjects fit well with the two-coefficient (gain and decay) exponential model with an adjusted r2 above 0.75 (Figure 3C). Three deaf and five hearing subjects fit better with a non-linear exponential model than the linear model. A paired-test comparison of the Fisher’s Z-transformed adjusted r2 values showed that the advantage of the non-linear model was statistically significant (t10 = 2.26, p = 0.047 < 0.05). However, the gain yielded from the model fitting was not different between the two groups (Figure 4A). The decay rate was slightly higher in the deaf group (U = 42, p = 0.030 < 0.05) (Figure 4B).
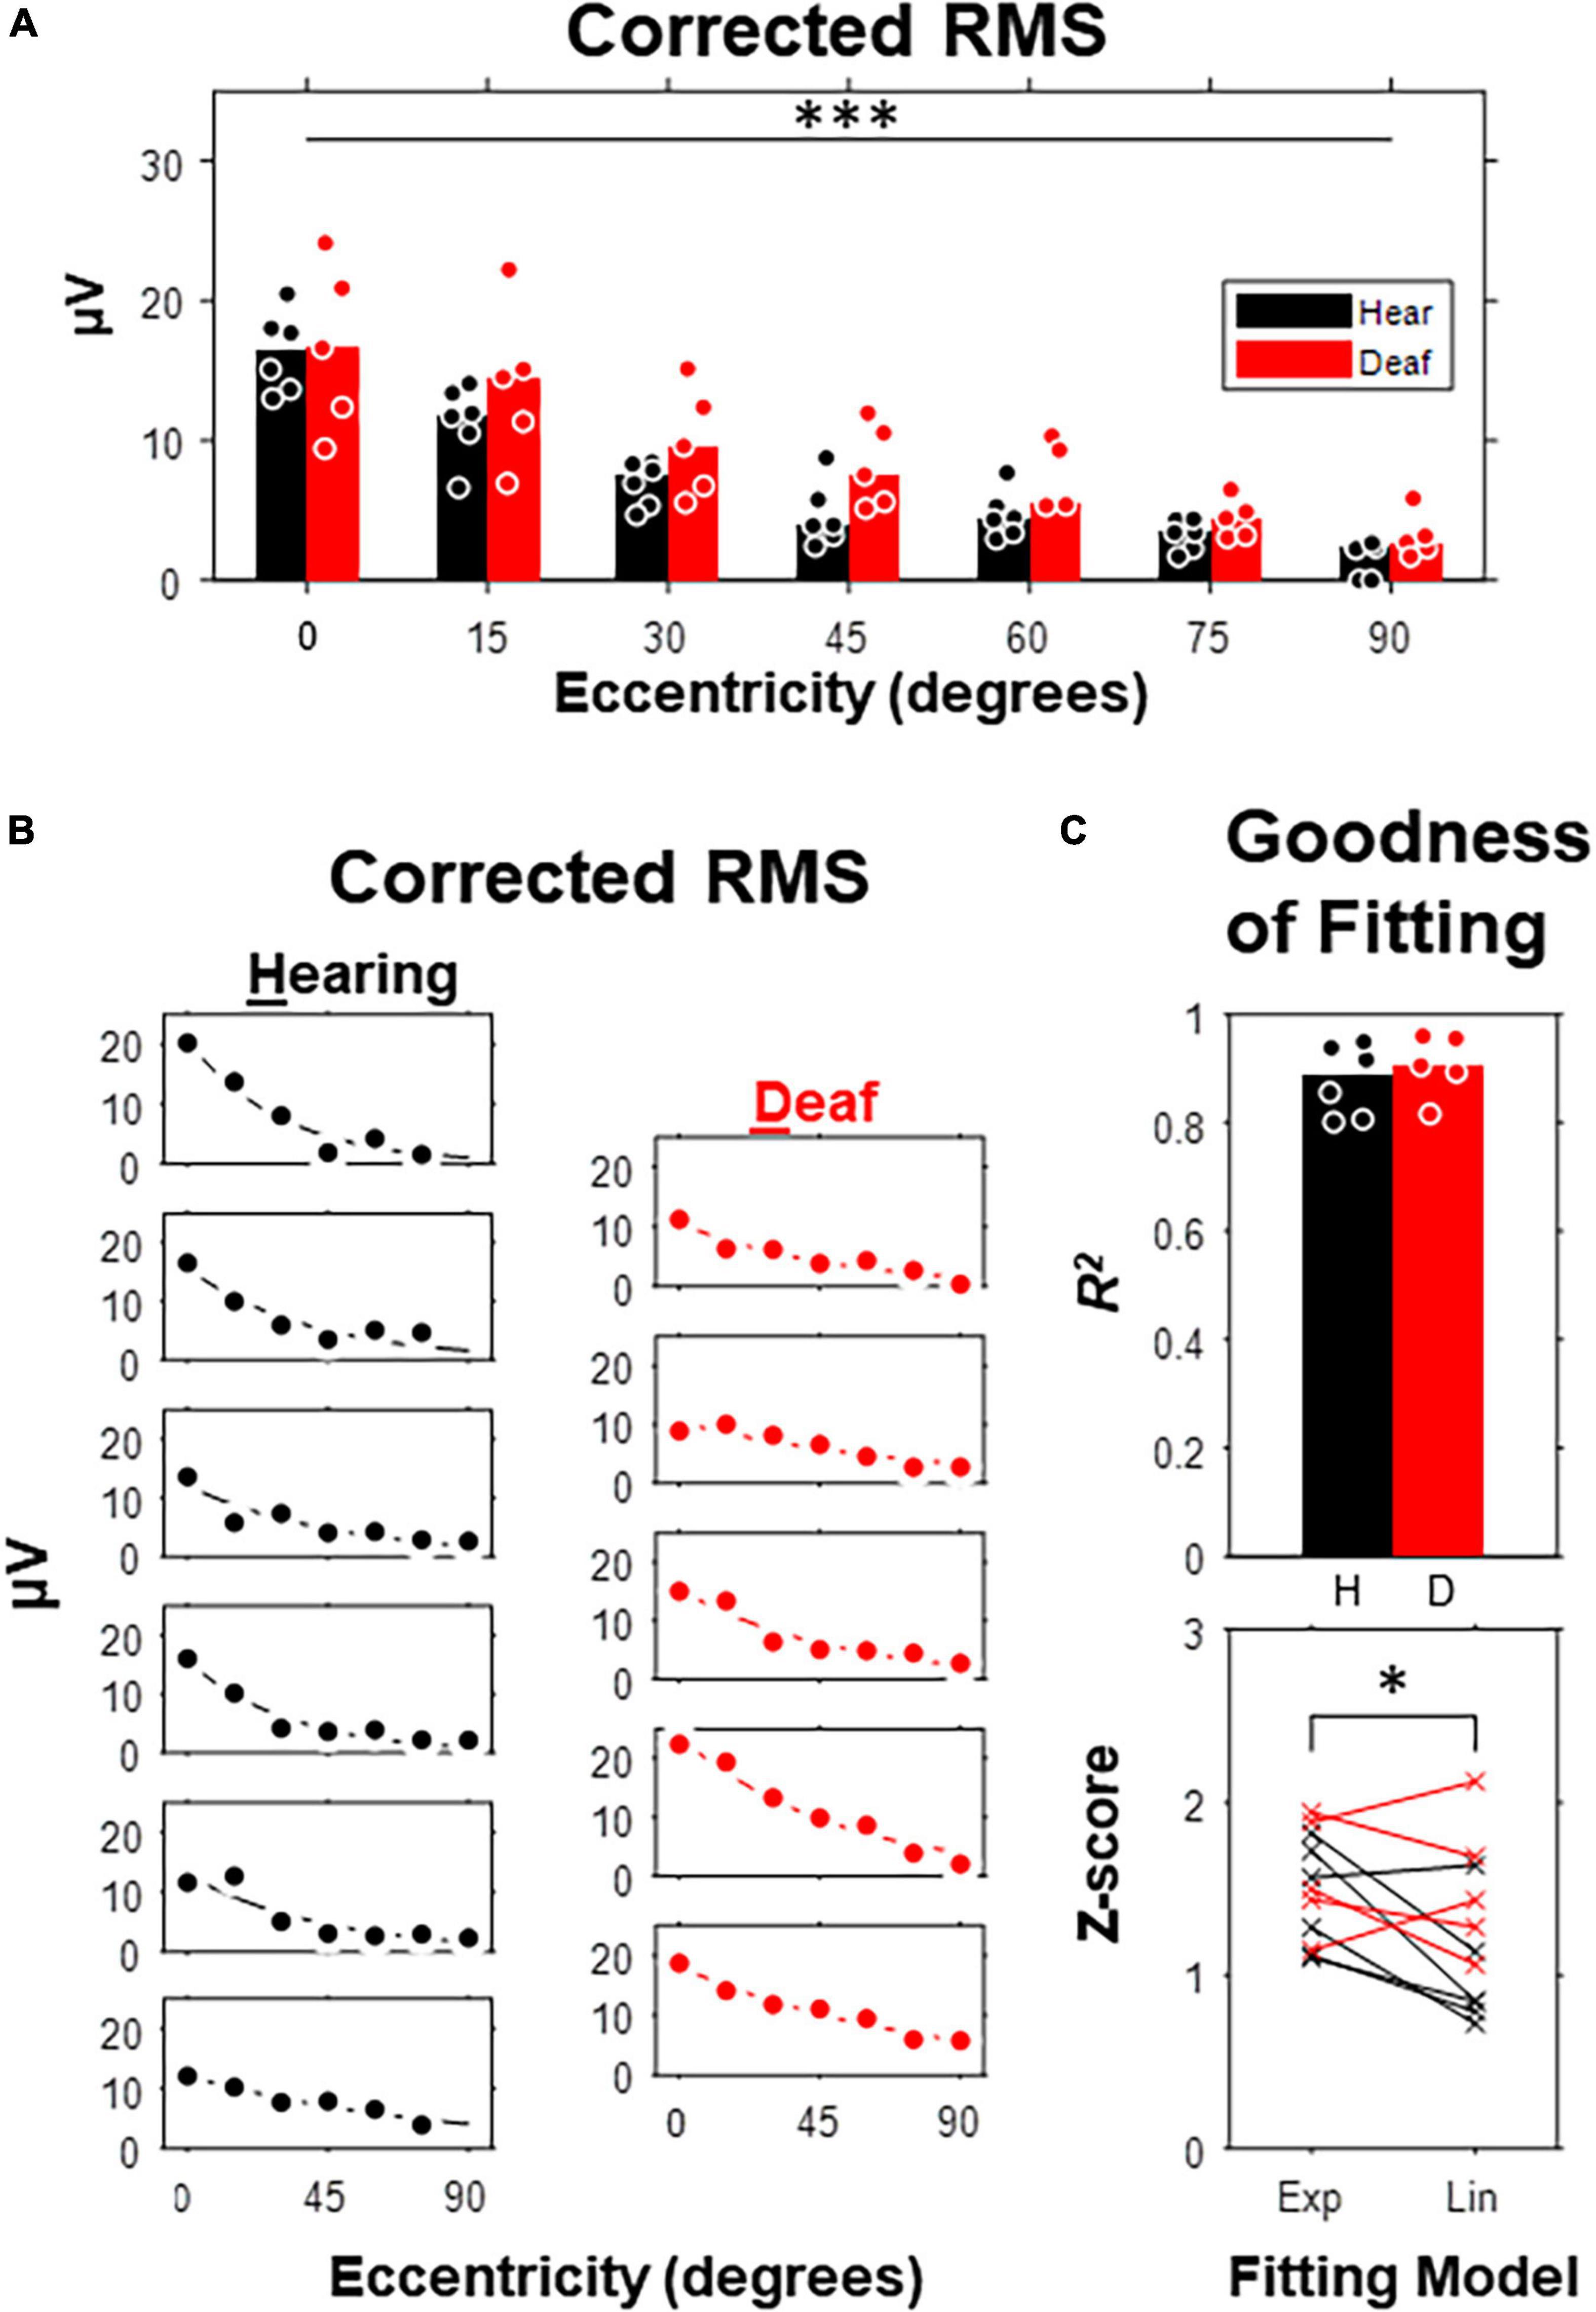
Figure 3. Corrected Root-Mean-Square (RMS) as a function of stimulus eccentricity. (A) RMS over a 420-ms post-stimulus window corrected with an 80-ms pre-stimulus baseline. Dot, data for individual subject. Bar, median. (B) Curve fitting with an exponentially decay model carried out for each of 6 hearing and 5 deaf subjects. (C) Goodness of fit. Top, adjusted R2 compared between hearing and deaf group. Bottom, Fisher’s Z scores of the adjusted R2 derived from exponential and linear fitting for each subject. *p < 0.05; ***p < 0.001 for the main effect of eccentricity.
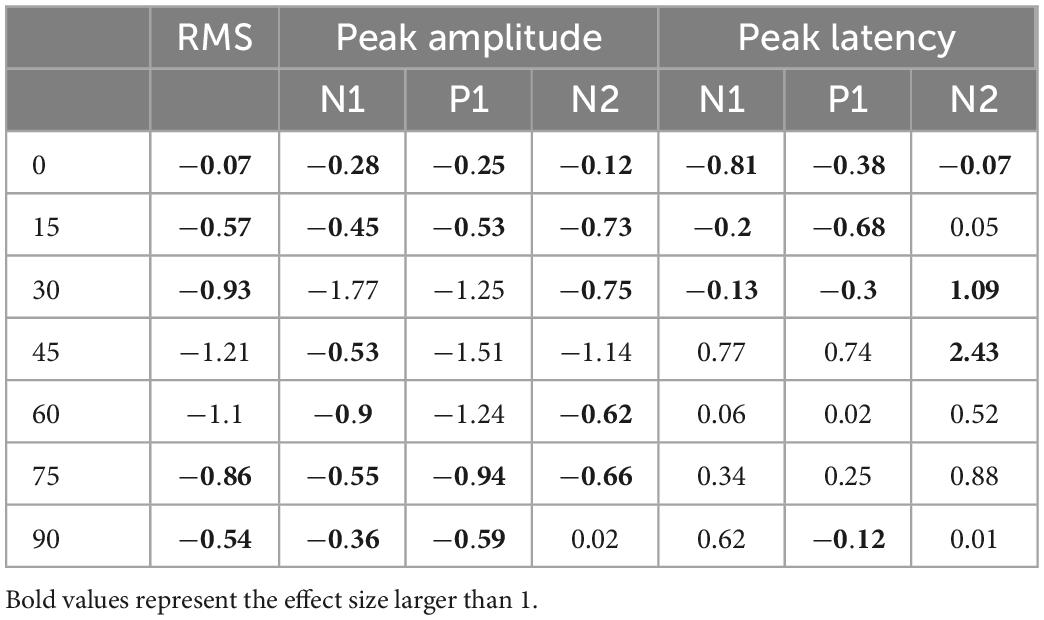
Table 1. Effect size for the comparisons between the two groups.
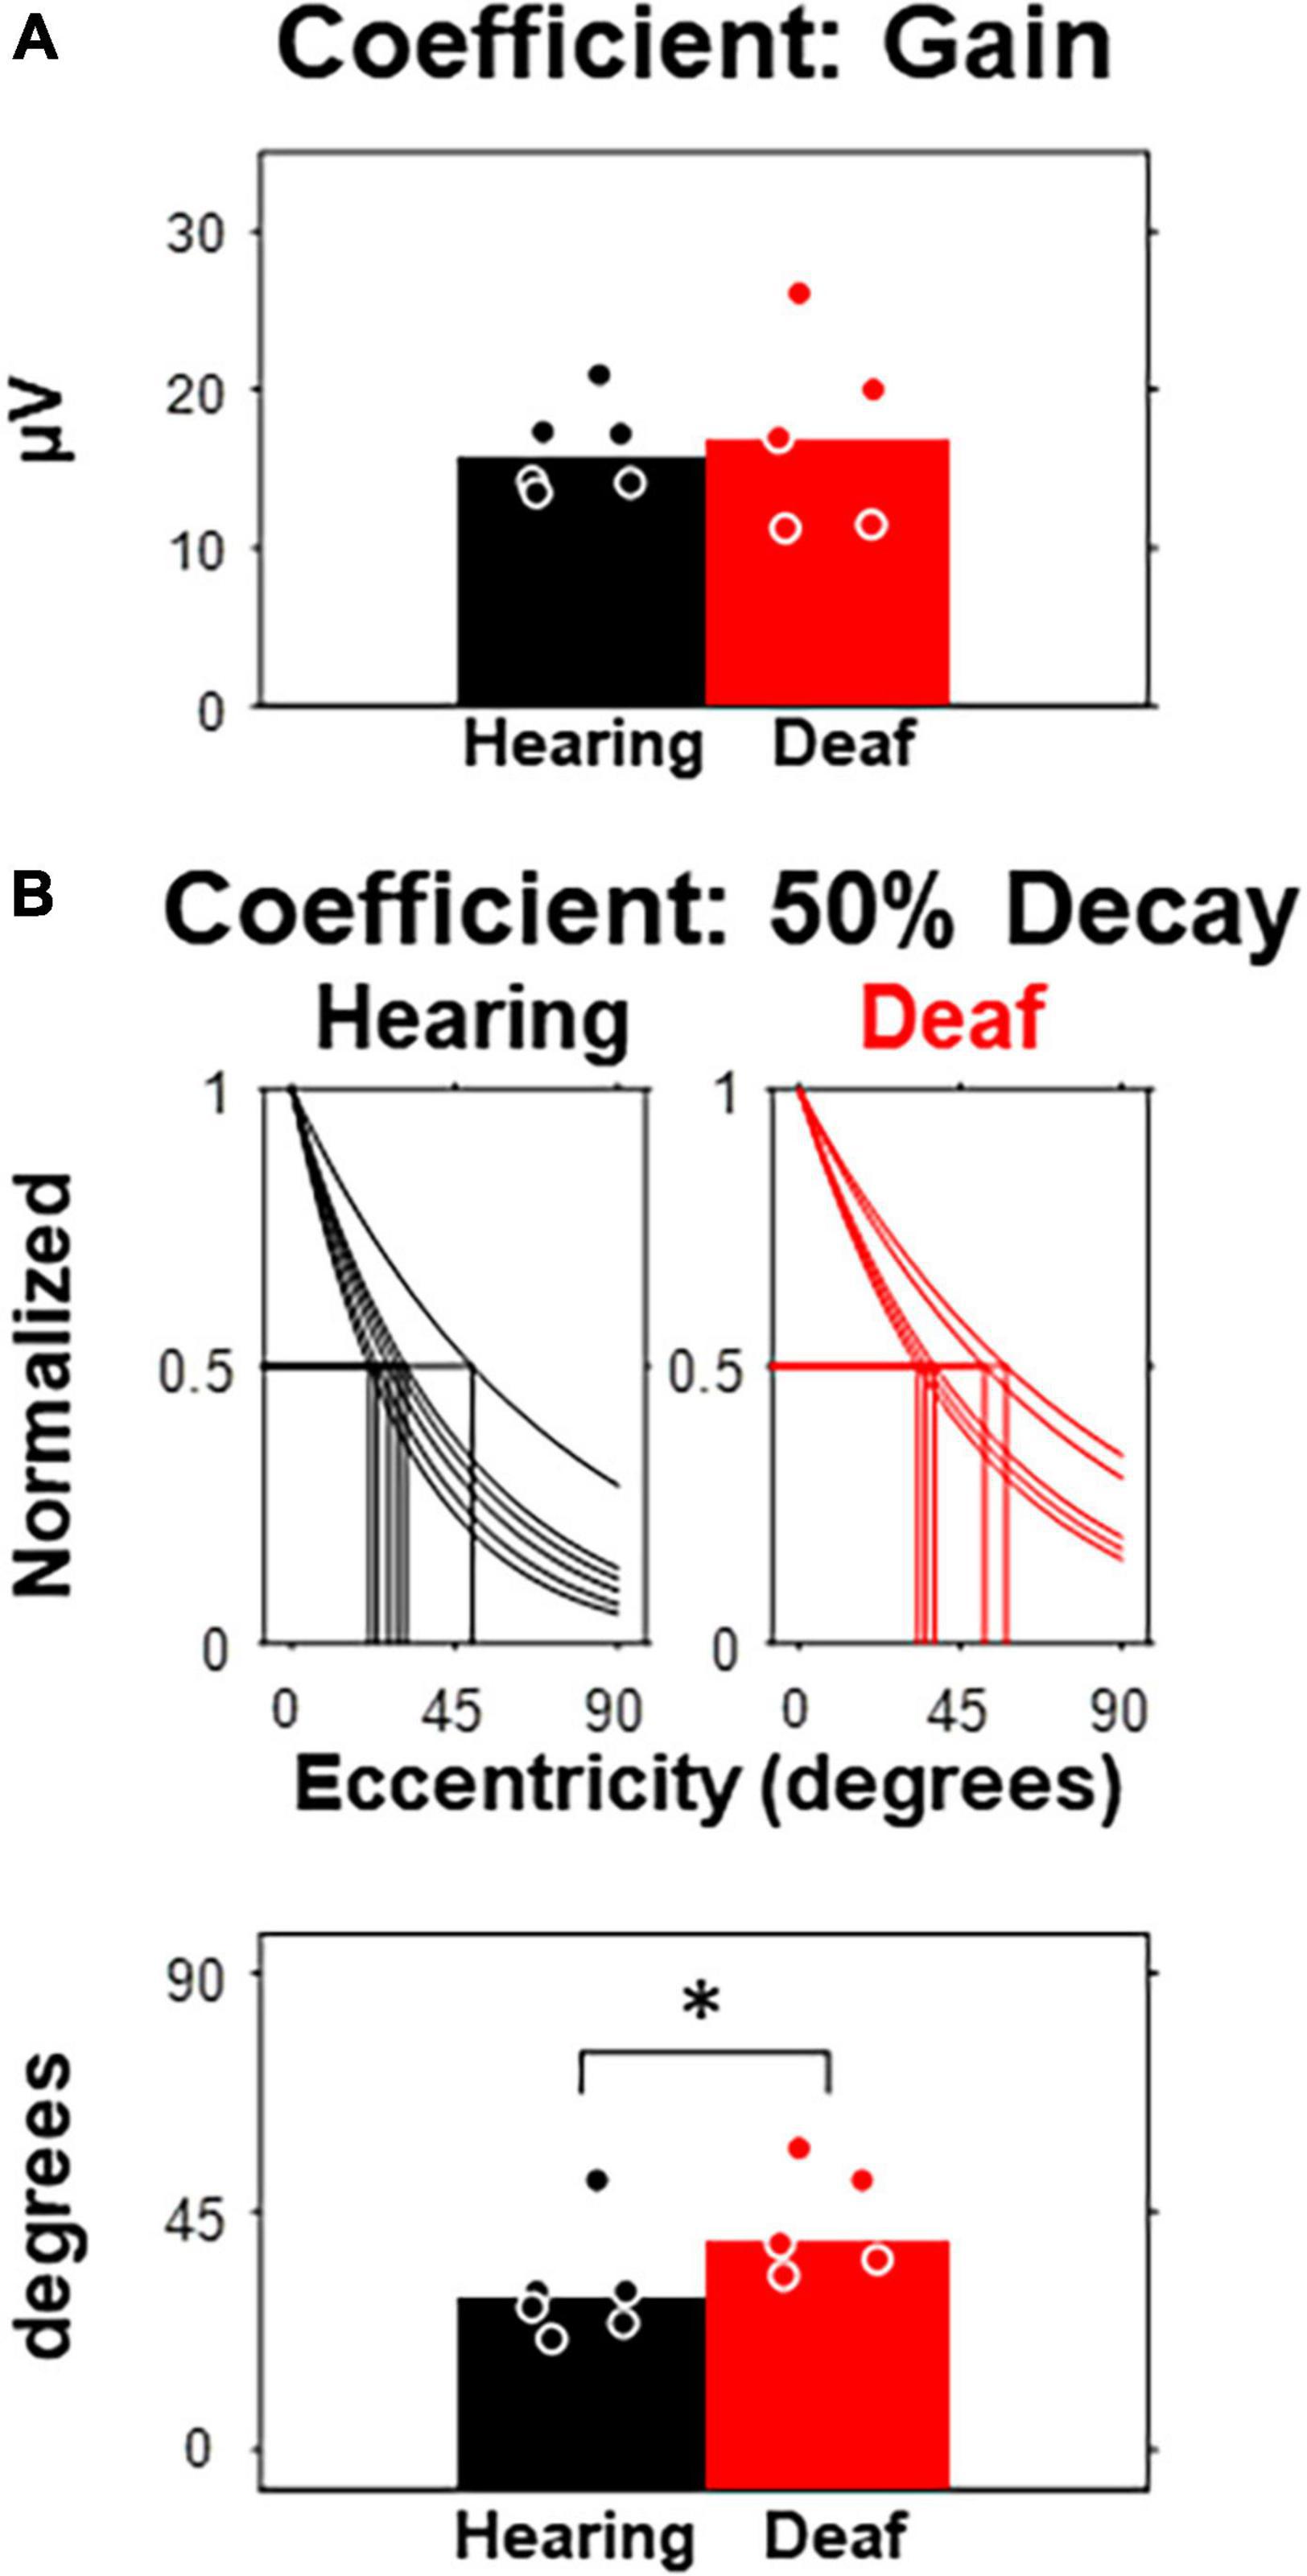
Figure 4. Comparison of model parameters between hearing and deaf subjects. (A) The fitting coefficient representing the gain of the model, which is equivalent to the model-estimated RMS at central eccentricity. (B) The fitting coefficient representing the rate of decay, which is equivalent to the amount of eccentricity increase that predicts 50% of RMS at central eccentricity. Top, model and 50% thresholds for each subject separated by group. Bottom, 50% threshold compared between hearing and deaf. *p < 0.05.
From the analysis of RMSs, we found that there was no main effect of early deafness on the overall amount of cortical activation by the checkerboard stimuli. The visual activation, however, was modulated by stimulus eccentricity exponentially, in an analogous way for both hearing and early deaf cats.
N1-P1-N2 complex
Next, we investigated the VEPs by different peak components. The VEP waveforms of all subjects showed at least 3 components, which are referred as N1-P1-N2 complex and characterized by the pattern of their peak polarities, relative amplitudes, and peak latencies. According to the VEPs from the total 12 subjects in the current study, it started with a negative component N1 peaking at 54∼144 ms, followed by a positive component P1 peaking at 86 ∼ 189 ms, and ends with a second negative component N2 peaking at 178∼367 ms. In four subjects (3 hearing and 1 deaf), there were extra peaks between N1 and P1, which were not further analyzed.
We started with the exploration on how the peak amplitude of each component was affected by the stimulus eccentricity and early deafness (Figure 5). All three components showed a clear trend of decrease in amplitude with increasing eccentricity [N1: F(6,54) = 27.07, p < 0.001; P1: F(6,54) = 21.73, p < 0.001; N2: F(6,54) = 20.98, p < 0.001]. However, the difference between the hearing and deaf groups was not significant. For individual stimulus eccentricity, the deaf group showed larger peak amplitude with a large effect size (a) in the N1 component for stimuli present at 30-degree eccentricity, (b) in the P1 component for stimuli present at 30-, 45-, and 60-degree eccentricity, and (c) in the N2 component for stimuli present at 45-degree eccentricity, when compared to the hearing group (see Table 1).
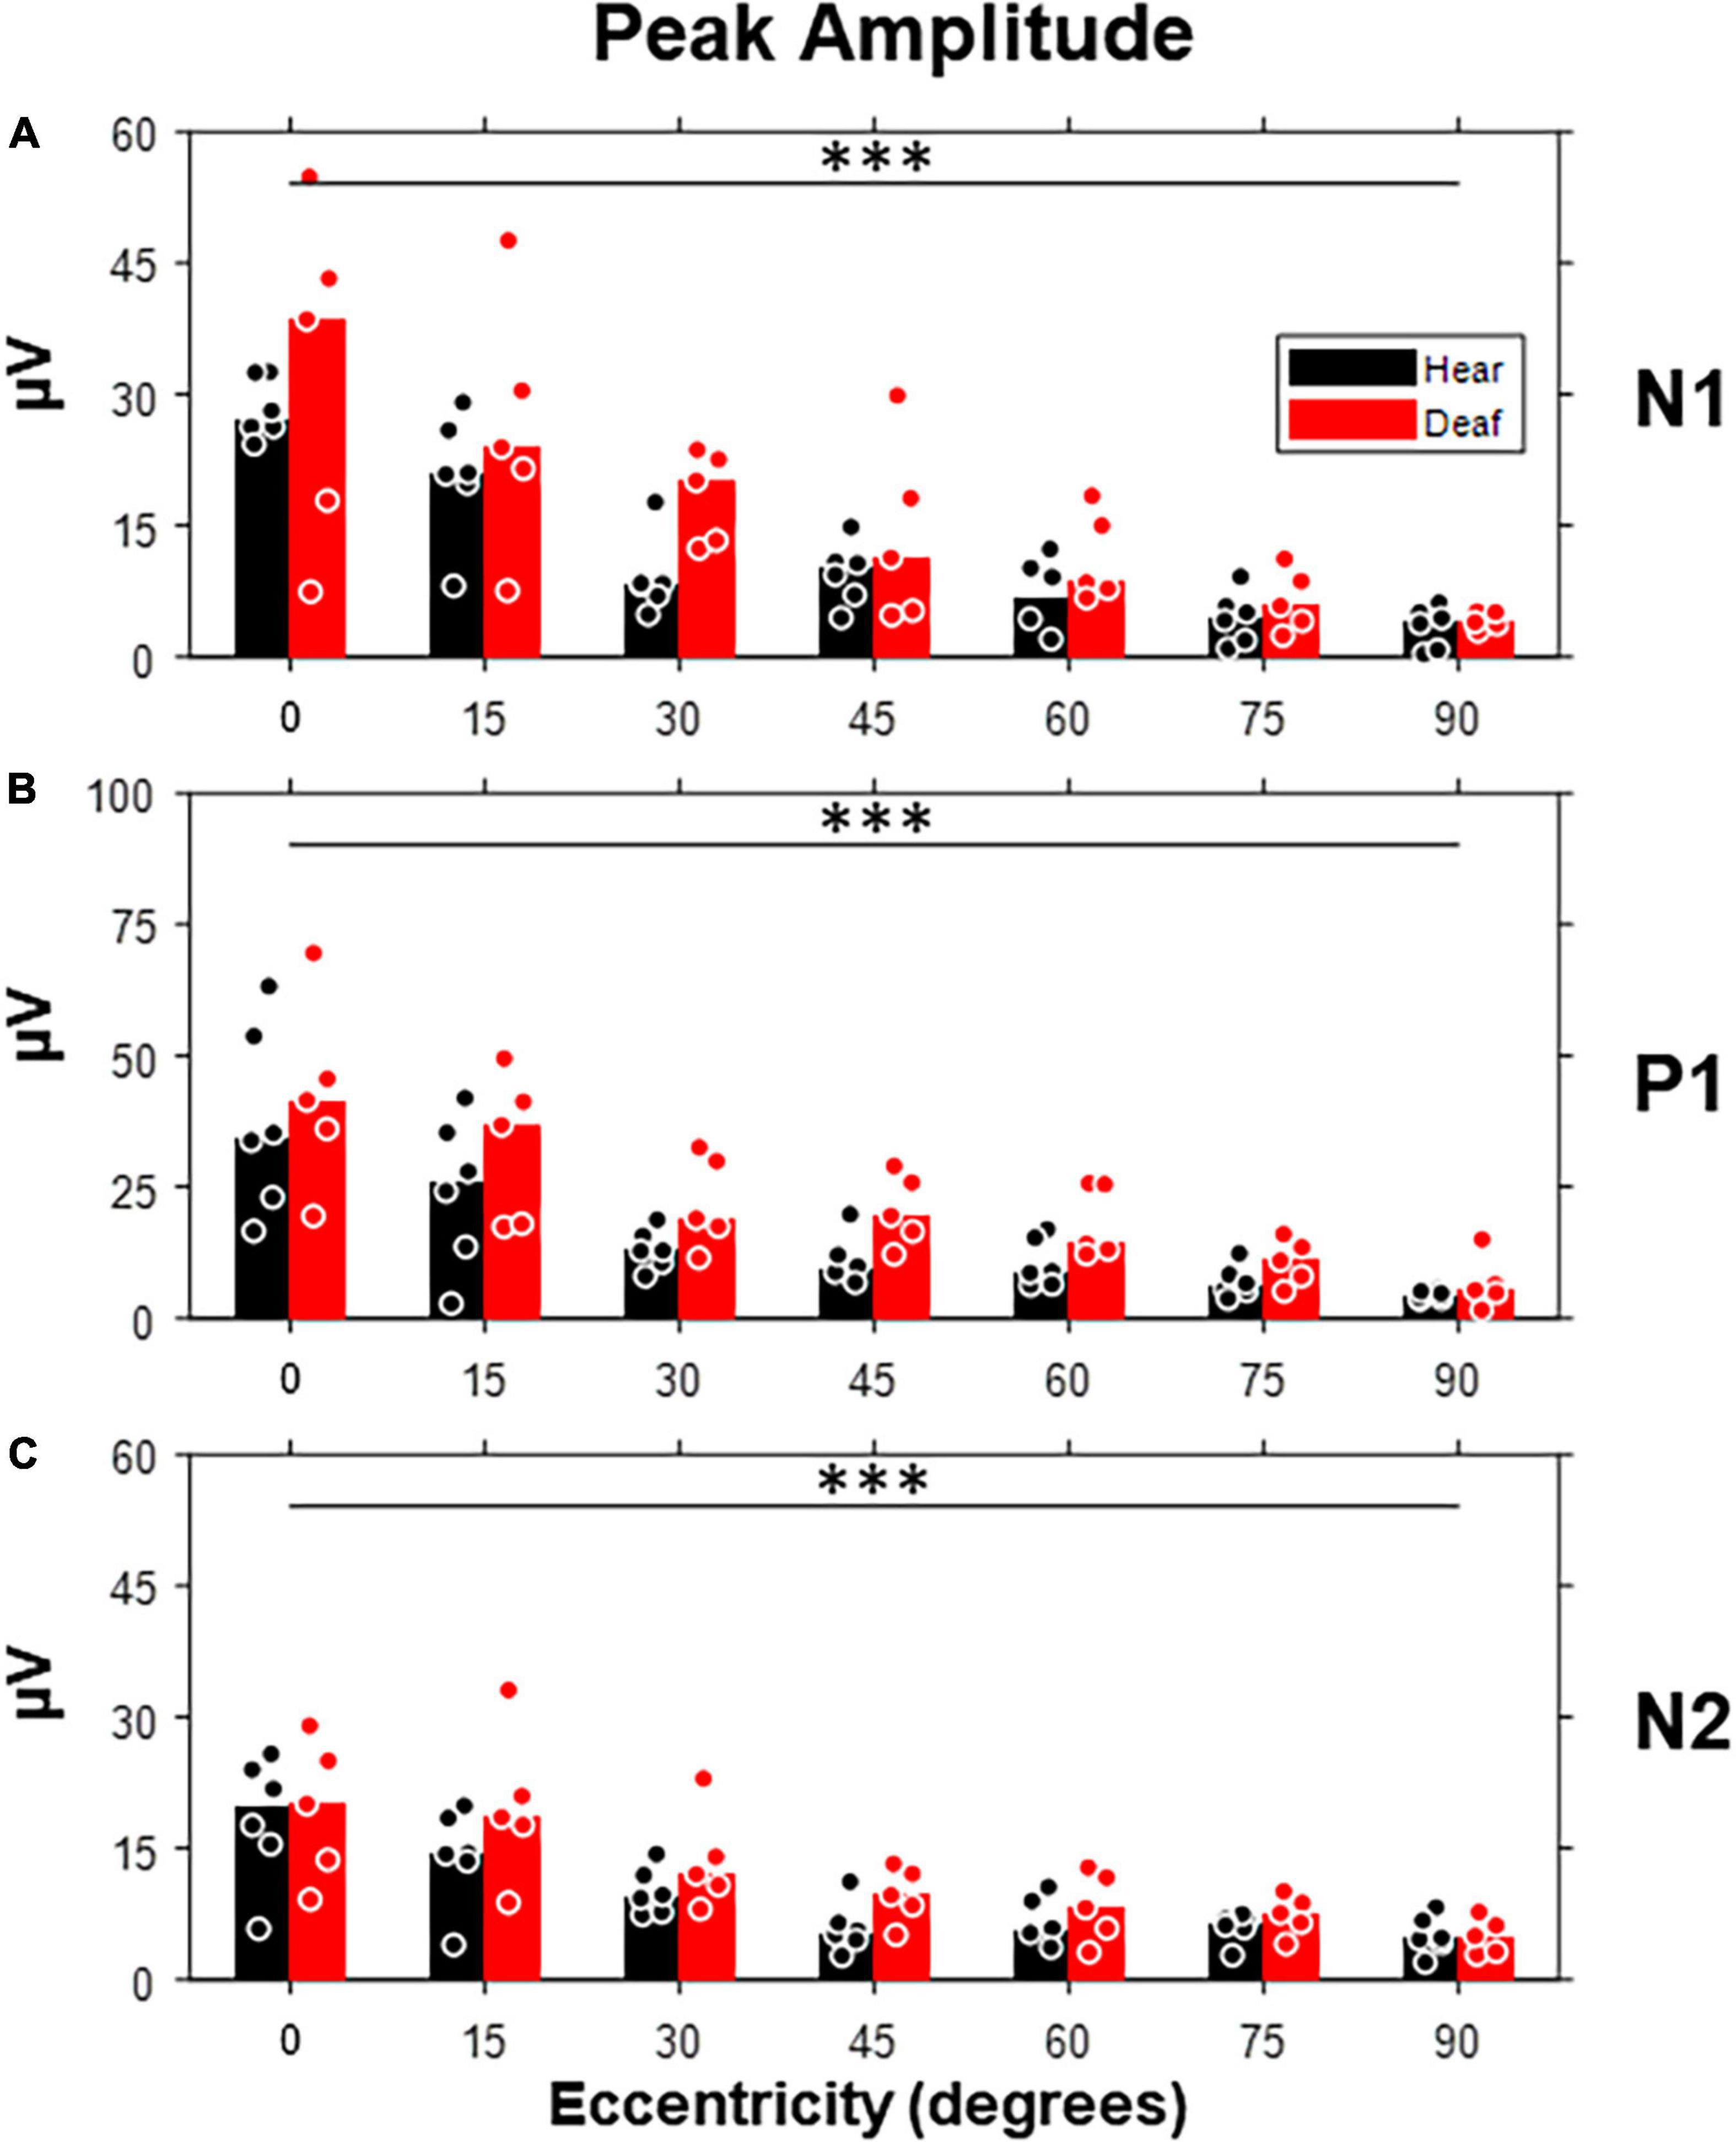
Figure 5. Peak amplitudes of three VEP components (N1, P1, and N2) as a function of stimulus eccentricity. (A) Peak amplitudes quantified from the N1 component, which is defined as the first negative deflection after stimulus onset. (B) Peak amplitudes quantified from the P1 component, which is defined as the first positive deflection after N1. (C) Peak amplitudes quantified from the N2 component, which is defined as the last negative deflection. Dot, individual subject; bar, median; ***p < 0.001 for the main effect of eccentricity.
We also examined how the peak latency of each component was affected by the stimulus eccentricity and deafness (Figure 6). Both N1 and P1, but not N2, showed prolonged latency with increasing eccentricity [N1: F(6,54) = 5.38, p < 0.001; P1: F(6,54) = 12.36, p < 0.001]. For individual stimulus eccentricity, only N2 component revealed a shorter peak latency in the deaf group than the hearing group [F(1,9) = 7.49, p = 0.023 < 0.05], especially for stimuli present at 30- and 45-degree eccentricity (see Table 1).
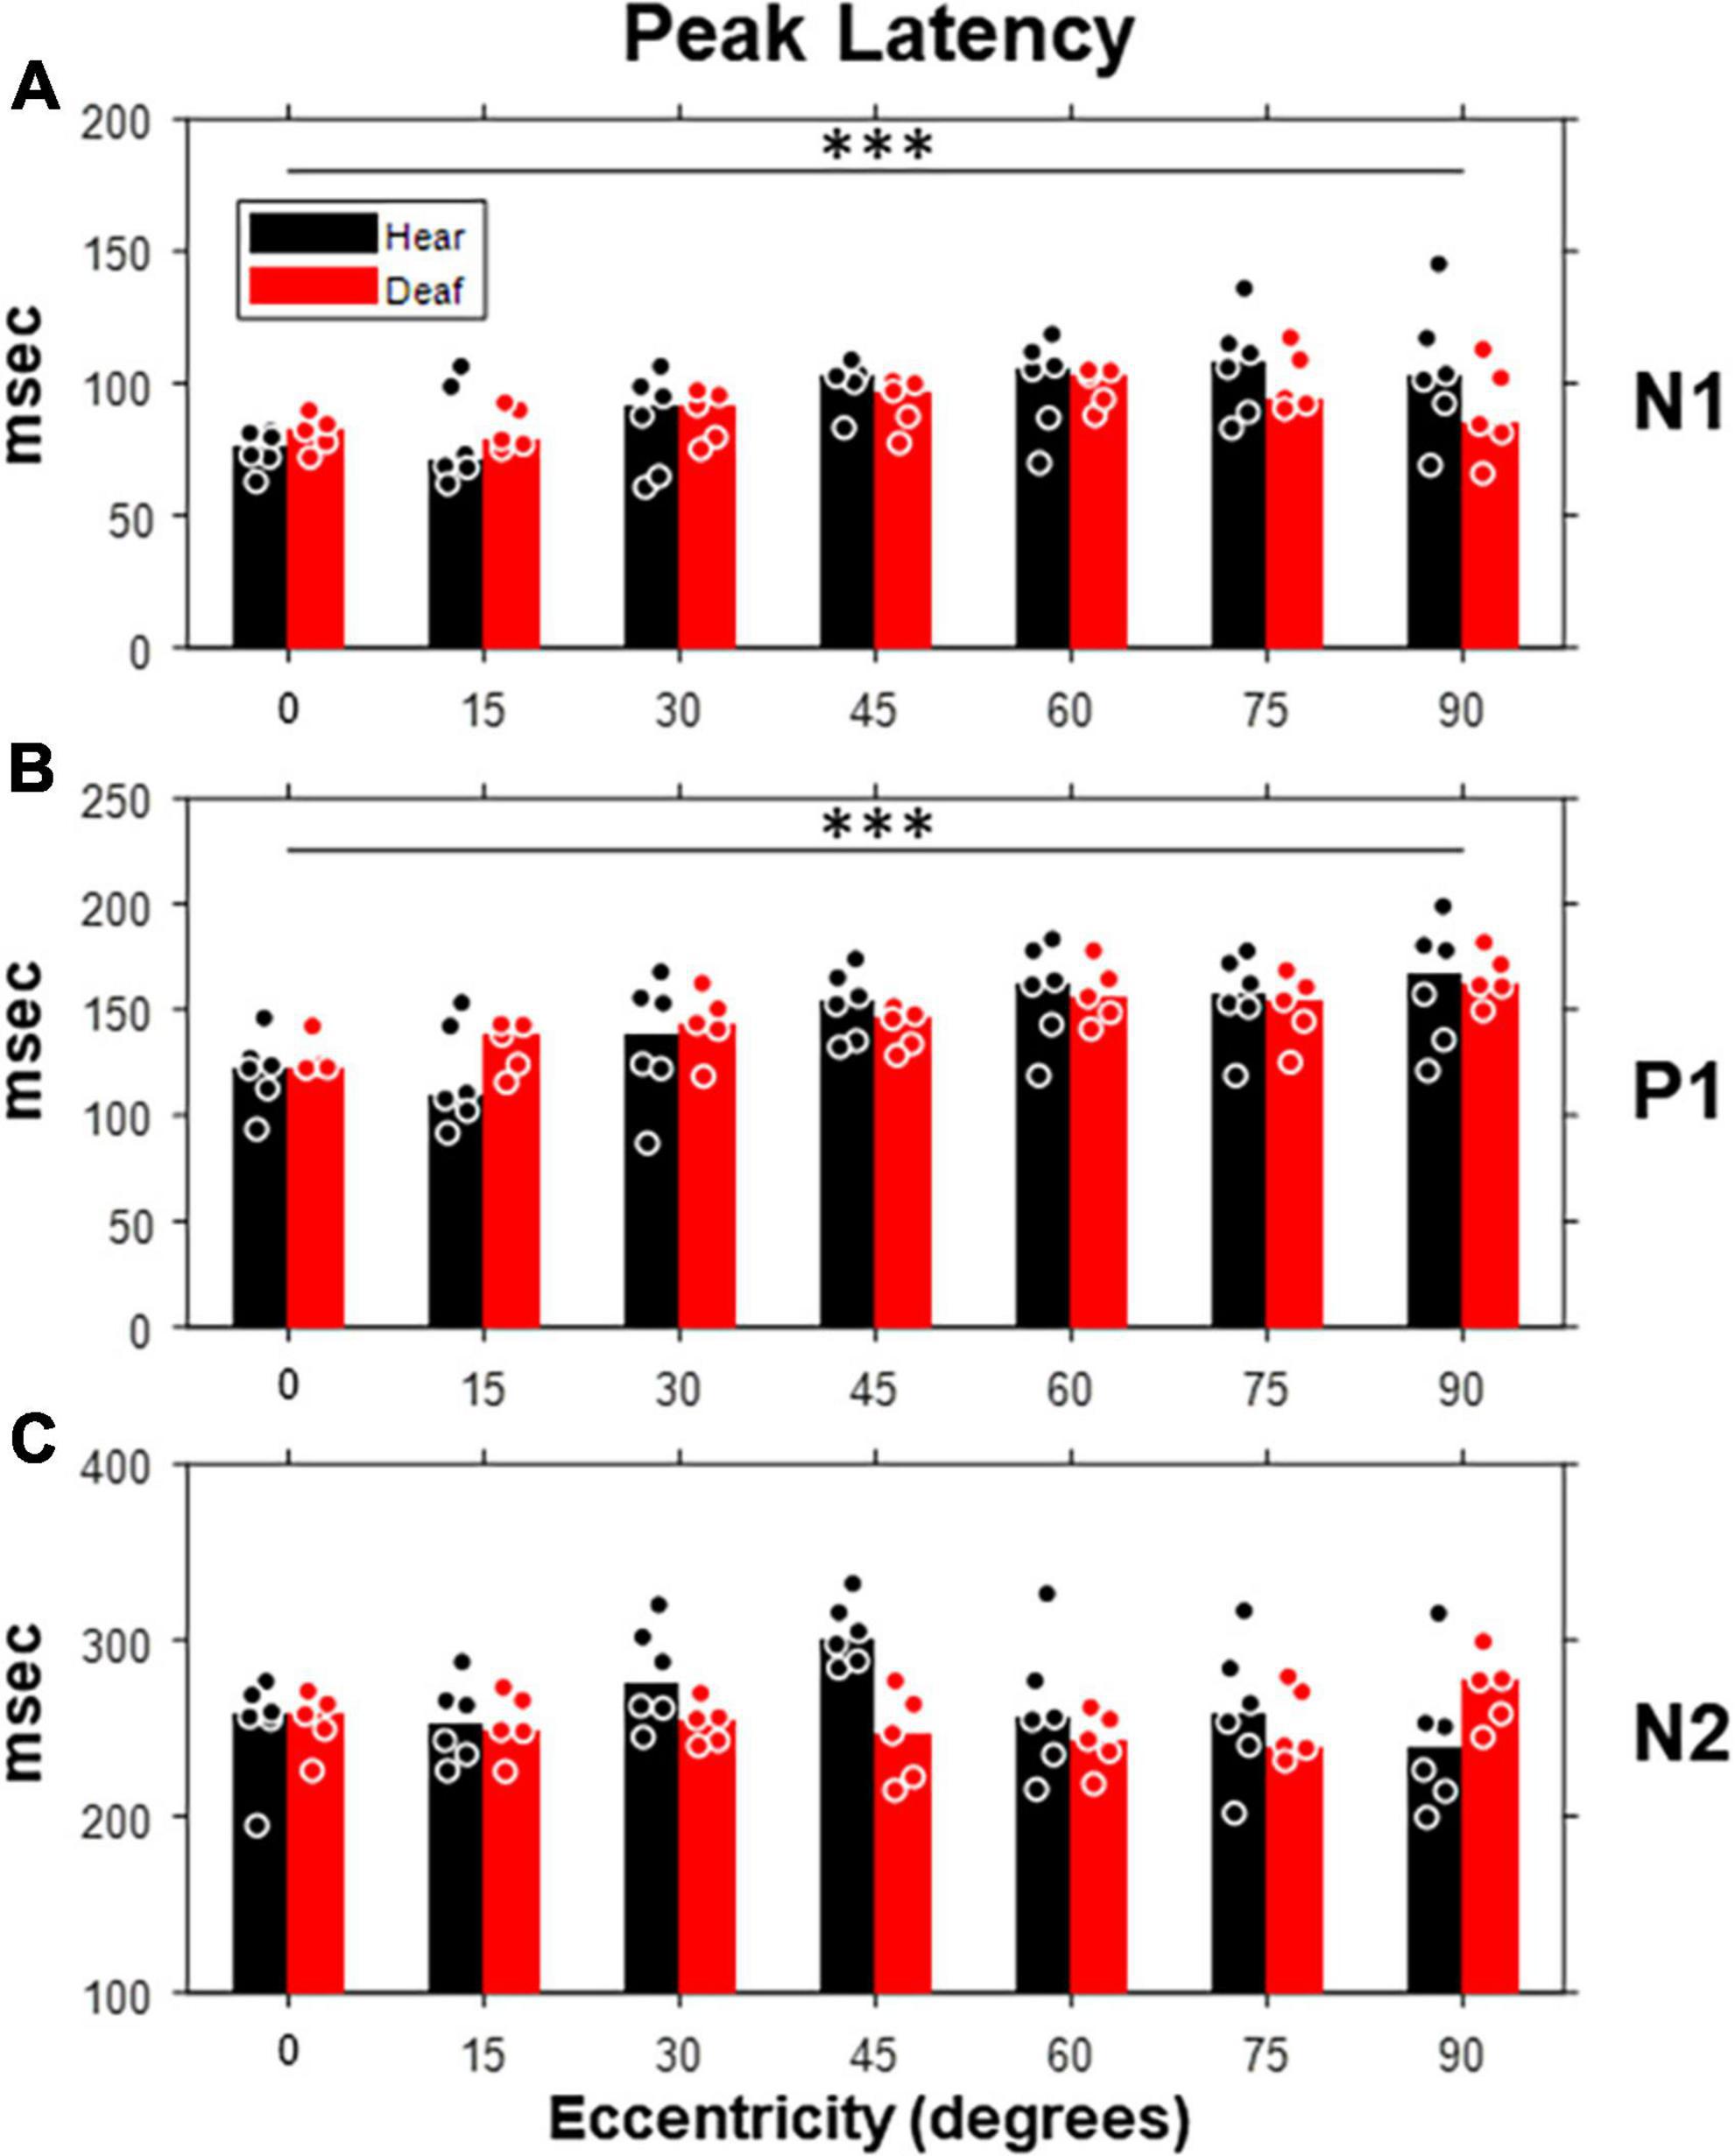
Figure 6. Peak latencies of three VEP components (N1, P1, and N2) as a function of stimulus eccentricity. Same layout of panels (A–C) as in Figure 5 but for peak latency. Dot, individual subject; bar, median; ***p < 0.001 for main effect of eccentricity.
Although the increase of peak amplitude and shorter peak latency in early deaf cats reported above showed minimal statistical significance, they seemed to preferably occur for middle-peripheral visual field (e.g., 30-, and 45-degree eccentricities). In contrast to the lack of group differences found with RMS level, the trend of an increase in peak amplitude and a shorter peak latency suggests that the signal morphology was more sensitive to the effect of early deafness than the RMS values of VEPs. The trend we found is also consistent with previous studies of VEPs in deaf human subjects (Neville et al., 1983).
Inter-sweep variability
Finally, we explored the inter-sweep variability of the peak latencies of N1 and P1 components. For each subject, 190 re-samples were taken by averaging 90% of the sweeps (i.e., with 2 sweeps per session excluded for each resampling average). The jitters of the resampled peak latencies followed a bell-shape distribution, with its width becoming larger as stimulus eccentricity increases (Figure 7A), because of larger inter-sweep variability. Hearing cats showed a smaller inter-sweep variability, especially at near-peripheral visual field (15- and 30-degree eccentricities) than deaf cats. This trend was even more apparent when the mean absolute deviations (MADs) of the jitters were quantified and plot as a function of the peak amplitude (Figure 7B). We performed an ANCOVA analysis regarding the effect of early deafness on MADs of latency jitter with peak amplitude as a covariate. We found a significant increase of MADs in early deaf cats compared to hearing cats for only P1 component [F(1,72) = 8.52, p = 0.005 < 0.01]. N1 component did not reveal such difference of statistical significance, neither was P1 component without holding peak amplitude as a covariate. Our findings revealed an increase in VEP variability for early deafness that is specific to the P1 component. The larger variation identified within each deaf cat subject was similar to the larger individual differences in the VEP topographical distribution found in cochlear implanted subjects (Buckley and Tobey, 2011).
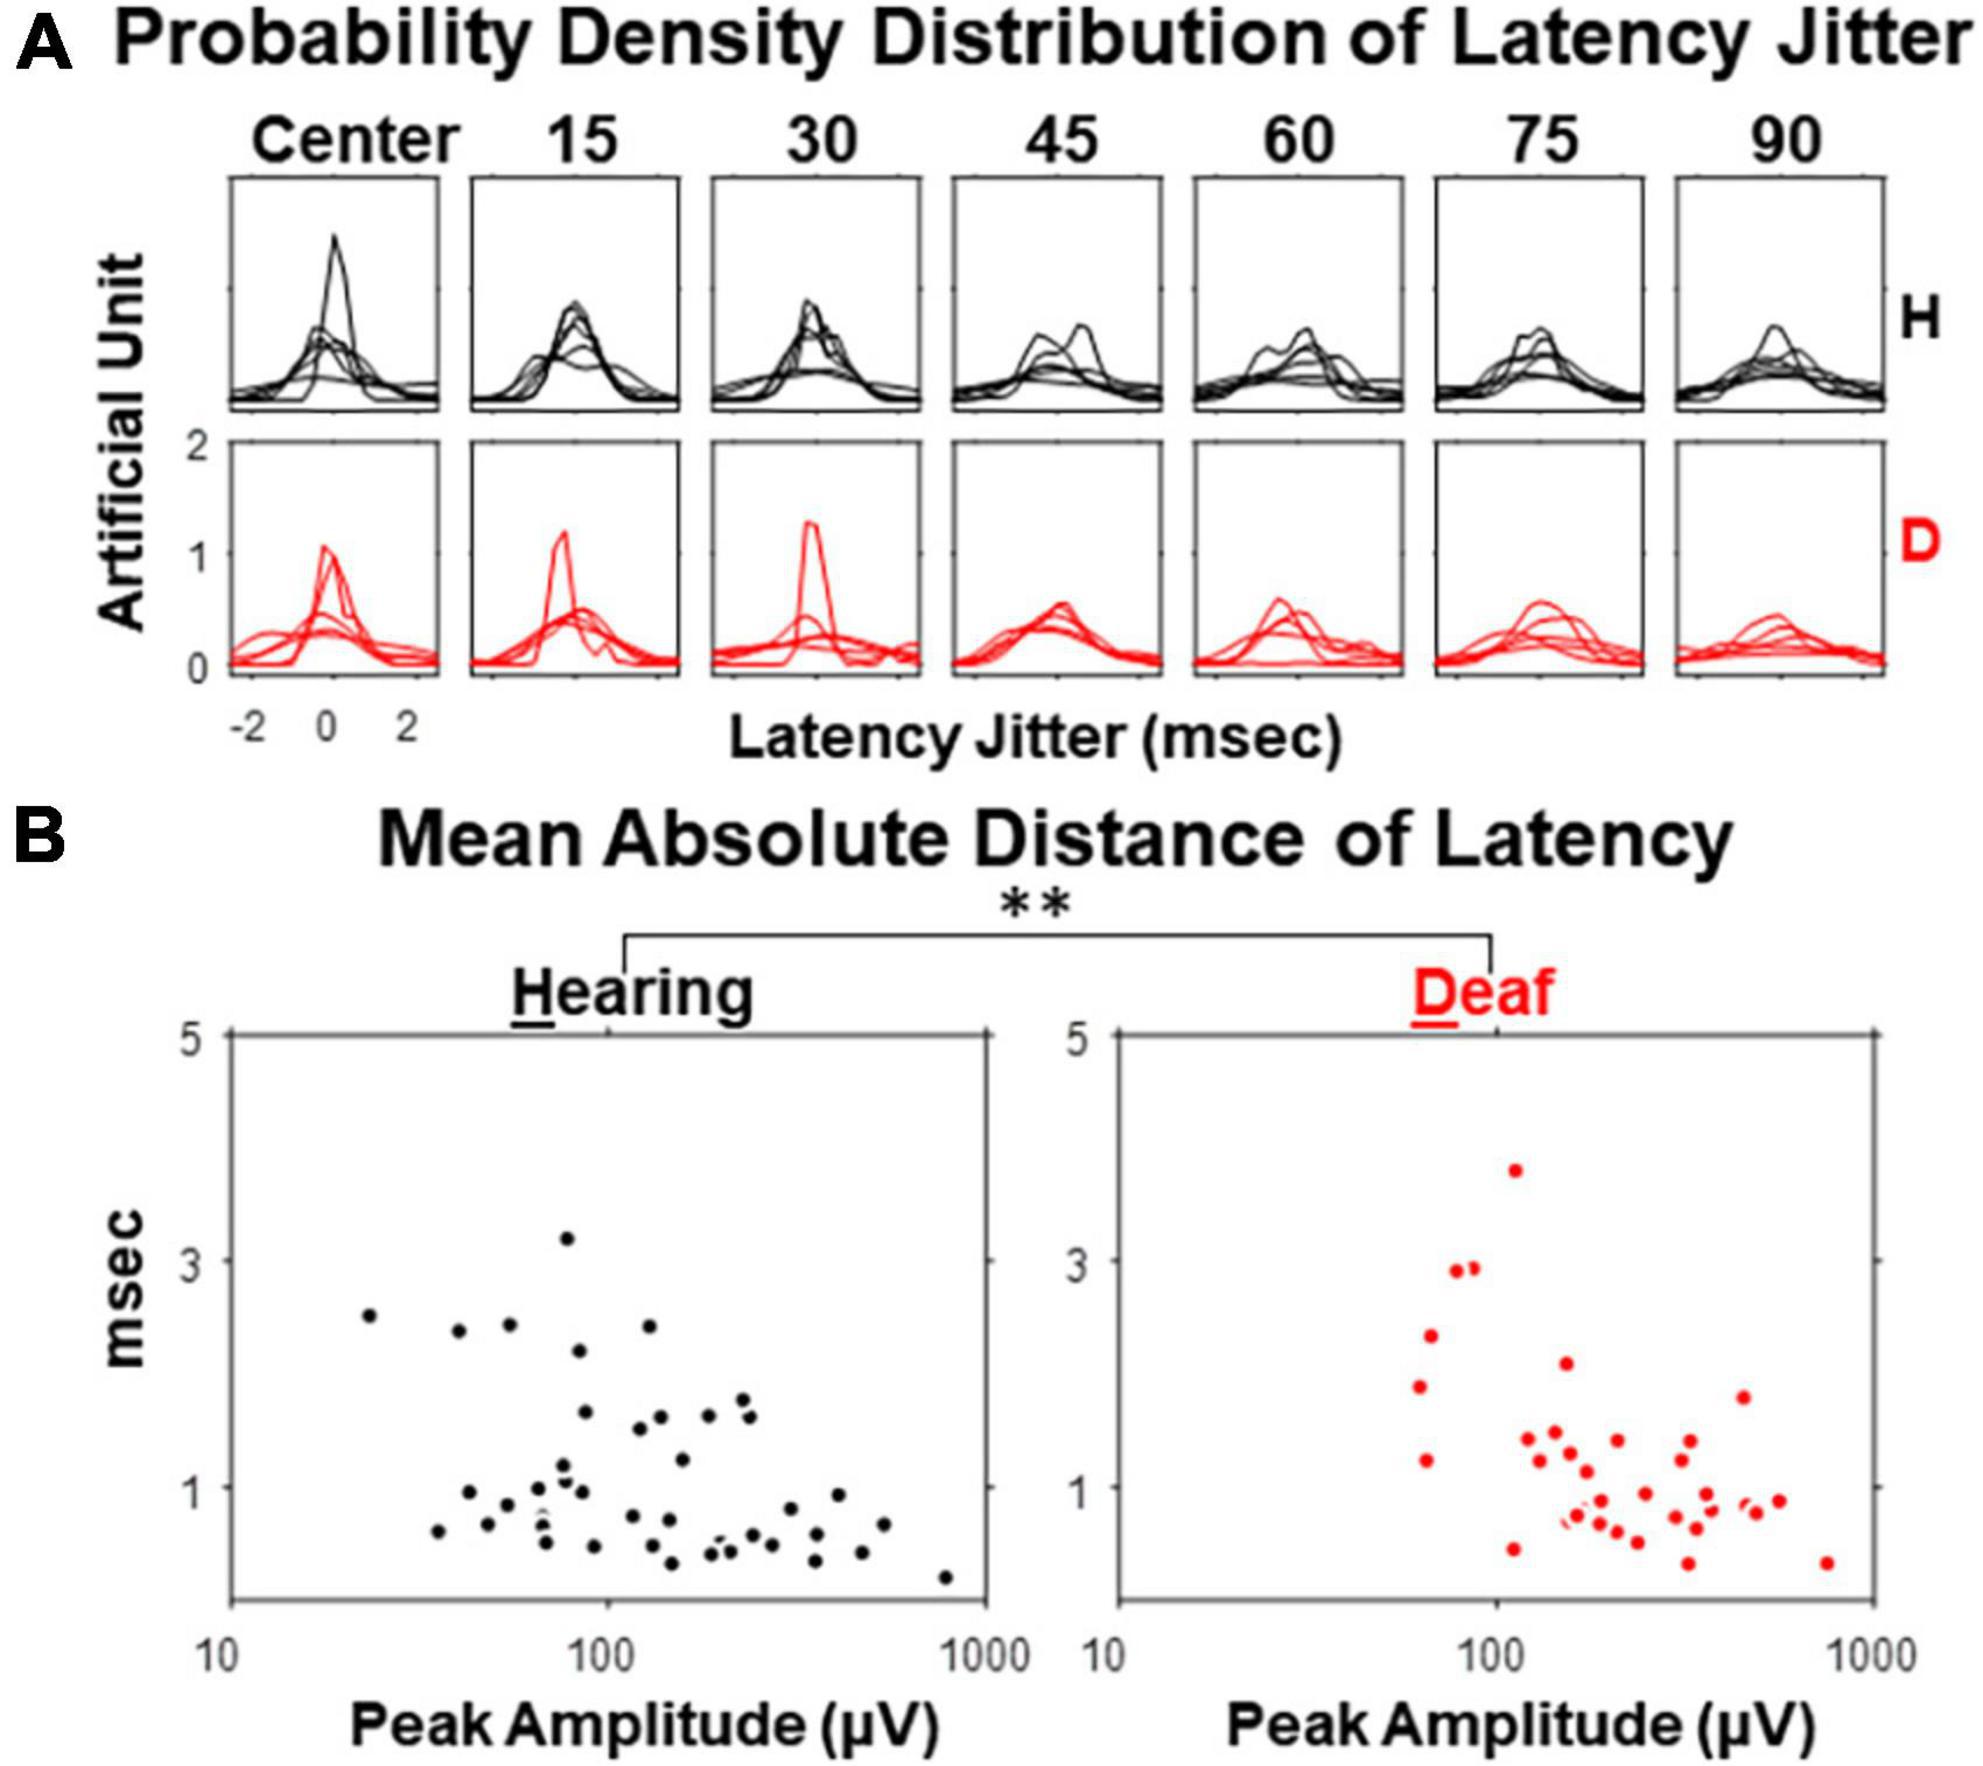
Figure 7. Jitter of peak latency for VEP P1 component in hearing and early deaf cats. (A) The estimated probability density for each of 7 stimulus eccentricities. Each line represents one of the subjects in both groups. (B) Mean absolute deviation (MAD) of resampled latency plot against the peak amplitude of the averaged waveform. Left, hearing. Right, deaf. Each dot represents one stimulus eccentricity in one subject. **p < 0.01 for the main effect of deafness in ANCOVA.
Discussion
In this study, we presented a checkerboard stimulus at seven different eccentricities, ranging from 0 to 90 degrees away from the midline, and compared the pattern-reversal visually evoked potentials (VEPs) between hearing and deaf cats. Overall, we observed no significant difference in response RMS values between the two groups, although some waveform components had larger amplitudes and shorter latencies in the deaf group, particularly for near- or mid-peripheral eccentricities. However, the inter-sweep variation analysis showed more variable latency in the deaf group for the peak component occurring about 100-ms post-stimulus.
The effect of deafness on VEPs
Considering previous findings in both behavioral studies (Lomber et al., 2010) as well as human VEP studies (Neville et al., 1983; Hauthal et al., 2014), it might be expected that VEPs would be larger in the deaf compared to hearing cats, especially at far-peripheral (60-, 75-, 90-degree) eccentricities. However, as we proposed in the introduction and evidenced by our data, that may not be the case.
In the visual localization task of an earlier study (Lomber et al., 2010), animal subjects were alert and motivated by reward in orienting/approaching the locations of visual stimuli, where the visual stimuli had small size (less than 1-degree) and locations randomized trial to trial. In the VEP recording of the current study, animal subjects were sedated, not previously trained on a visual localization task, and the stimuli were larger in size (6 degree) and repeated for 20 trials at the same location.
When subjects are neither alert nor responsive, visual neurons with motor functions involved in eye movement tasks may make no or little contribution to the visual responses evoked by stimulus. While there is little information on how head movements modulate cortical visual neurons in cats (Straschill and Schick, 1977), many studies have shown the effect of eye movements on visual neuron in both cats (Guitton and Mandl, 1978a,b; Toyama et al., 1984; Yin and Greenwood, 1992; Weyand and Gafka, 1998) and non-human primates (Colby and Goldberg, 1999; Glimcher, 2001; Munoz, 2002).
In macaque monkeys, a large proportion of neurons in the frontal eye field (FEF) show no response to visual stimuli but reliable pre-saccadic activities for certain areas of the visual field, which are therefore deemed “movement” neurons (Glimcher, 2001). In contrast, most neurons in the lateral intraparietal area (LIP) demonstrate visual receptive field and their responses are modulated by stimulus saliency and task-relevance (Colby and Goldberg, 1999).
Compared to hearing cats, visual orienting behavior is improved in deaf cats, where accuracies of orienting to peripheral targets is increased (Lomber et al., 2010). This implies that neuronal function must be enhanced in visual representations and/or motor planning. The deactivation of deaf PAF eliminated the improved performance in the peripheral visual field (Lomber et al., 2010), which suggests that neurons in PAF acquire some functions in visual representations and/or motor planning. While there is still no evidence of visual responsiveness of PAF neurons in either hearing or deaf cats, cortical deactivation experiments show that PAF in hearing animals is involved in auditory localization (Malhotra et al., 2004; Malhotra and Lomber, 2007) and that PAF neurons are better tuned for sound location than A1 or AAF (Harrington et al., 2008). Therefore, neurons in PAF in hearing cats may already carry information of space required for the motor planning in visually guided orienting behavior, and may acquire functions in processing visual inputs following deafness.
Cat area 6 has been suggested as a homologue to primate FEF. Microstimulation in the banks and fundus of the perisylvian sulcus or the ventral bank of the cruciate sulcus in anesthetized cats produces saccadic eye movements, neck EMG activity (Guitton and Mandl, 1978a,b), and neuronal activity in superior colliculus (Meredith, 1999). However, only a small fraction of neurons in these areas demonstrated pre-saccadic activity in alert cats, but with a larger population being visually responsive (Weyand and Gafka, 1998). Although some neurons showed preference for certain eye movement direction, there is a lack of evidence for the behavioral relevance of these neurons as in primate FEF. However, area 6 may still serve as another potential target of cross-modal plasticity following deafness, by actively participating in the motor planning of eye and head movement.
While further investigation is still needed to support this hypothesis, we propose that a large proportion of functional cross-modal plasticity in cortex following deafness may reside in neural circuits associated with motor planning rather than those associated with visual processing.
It is also worth noting that neuromodulation systems, such as the dopaminergic (Anderson et al., 1994; Weil et al., 2010) and noradrenergic (McLean and Waterhouse, 1994; Treviño et al., 2019) systems, associated with reward and alertness, respectively, are actively involved in visually guided behaviors, as well as general task performance. Therefore, another possible explanation for the increased accuracy of peripheral visual localization in deaf cats may be found during the task training process, where reward are used to maintain subjects’ alertness and motivation to perform the task.
The influence of dexmedetomidine
We did not attribute our negative results to the use of anesthetic agent, i.e., dexmedetomidine, because the anesthesia or sedation induced by dexmedetomidine is uniquely different from the other anesthetics, such as propofol and isoflurane, which directly interact with the GABAergic system (Hemmings et al., 2005) and may profoundly attenuate VEPs depending on their dosage (Sebel et al., 1986; Tanaka et al., 2020). One study has shown that the administration of dexmedetomidine does not affect VEPs in spine surgery patients undergoing general anesthesia with propofol (Rozet et al., 2015).
Although the VEPs recorded under dexmedetomidine cannot explain the enhanced performance in visual localization, our data is still the first report in cats on how early deafness changes VEPs that reflects stimulus-driven, bottom-up neural processing of visual inputs. Except when stimuli were positioned at central location or with 90-deg eccentricity, the medians of RMS and peak amplitude from the deaf group were almost unanimously larger than those from the hearing group. Although no main effect of deafness was revealed by ANOVA tests, a trend to increase in RMS and peak amplitude as well as decrease in peak latency seemed to appear at certain stimulus eccentricities with medium to large effect size worth being reported. Considering the low statistical power caused by small sample size used in the current study, a large effect size should have been expected to reveal statistical significance and avoid false negative. Similar cases were reported with a comparable sample size in previous histological investigations (Kok et al., 2014; Chabot et al., 2015; Wong et al., 2015; Meredith et al., 2016; Butler et al., 2018). Whereas a number of cat visual areas demonstrated increased or decreased number of afferents in several auditory areas in deaf cats when compared to hearing cats, only a few of such changes were statistically significant, such as the projections from posterolateral lateral suprasylvian area (PLLS) to the dorsal zone (DZ) of auditory cortex (Kok et al., 2014) and the projections from anterolateral lateral suprasylvian area (ALLS) to the anterior auditory fields (Wong et al., 2015).
Over all seven quantifications of VEPs and all seven stimulus eccentricities, the effect size values derived from the comparisons between the hearing and the deaf groups are mostly smaller than 1.5, and correspondingly led to a statistic power less than 59.8%. According to our calculation, at least 60% more than the current sample size in the deaf group is needed to achieve a statistic power higher than 80%, with the estimate of the current effect size assumed.
Regardless of the discussion above, we cannot completely exclude the possibility that the cross-modal plasticity shown in congenitally deaf cats is absent in early deaf cats or not sensitive to EEG recording technique. However, we consider these are the least likely, since several previous human ERP studies revealed different VEPs between hearing and deaf subjects (Neville et al., 1983; Hauthal et al., 2014; Campbell and Sharma, 2016; Corina et al., 2017).
We did find a statistically significant increase of latency variation in deaf subjects. The variability in neural activity in response to visual stimuli can be contributed by both neural and non-neural factors. Synaptic transmission is proposed to be a main source of neural variability due to its cascade nature of cellular and molecular process (Ribrault et al., 2011). Although we did not reveal a distinctive response amplitude in VEP from the deaf group, the reorganized auditory cortex may still participate in the early visual processing subtly, which involves synaptic transmission with less time precision. The increase we found in inter-sweep variability in deaf subjects, differentiating with respect to different VEP components, suggests a potential temporal specificity along the timeline of cortical sensory processing. Several neurological disorders (e.g., autism) have been associated with the increase in neural variability, which may share a similar underlying mechanism with this finding (Dinstein et al., 2015).
The effect of stimulus eccentricity
In this study, we also examined the effect of stimulus eccentricity on VEPs. This has been explored in previous studies (Albus, 1975; Van Essen et al., 1984; Harvey and Dumoulin, 2011; Ziccardi et al., 2015), but not at a range of eccentricity covering the entire quarter-sphere. To investigate the peripheral-specificity of cross-modal plasticity after deafness using VEPs, it is critical to understand how VEPs are affected by stimulus eccentricity in normal hearing subjects.
The contralateral visual field in the cat is represented by multiple cortical visual areas. Extracellular recording shows that whereas all of the visual areas studied are responsive to stimuli presented near central vision, only areas 17, 19, PMLS, and 21b are responsive to stimuli present beyond 70-degree eccentricity along the horizontal meridian (Tusa et al., 1981). Except for area 17, the visual field represented in other cortical areas is more limited to the horizontal meridian at more peripheral positions (Tusa et al., 1981).
In this study, we quantified the effect of stimulus eccentricity on VEPs with an exponential model and found good fitness. This was in good consistent with a recent study in human subjects, where P1-N1 peak-to-peak amplitudes per squared-degree visual field as a function of stimulus eccentricities up to 20 degrees were exponentially modeled (Ziccardi et al., 2015). Our results suggest that the exponential model for the effect of stimulus eccentricity on VEPs can be generalized to the full range of quarter-sphere on the horizontal in non-primate species.
The attenuated VEP to stimulus present at peripheral field compared to central field that we observed is most likely due to cortical magnification, first observed with extracellular recording, where a larger proportion of visual cortical area were found representing a rather small central (foveal) visual field (Daniel and Whitteridge, 1961). Alternatively, it can also be argued that, because neurons in the peripheral visual field also have larger receptive field size in comparison to the central field (Albus, 1975; Van Essen et al., 1984), peripheral visual input can activate additional neurons as non-optimal stimulus as an advantage over central visual inputs. In virtue of such a trade-off, the product of cortical magnification factor (distance in cortex per degree in visual field) and receptive field size, also known as point-image size, was approximately constant for varying eccentricity (Harvey and Dumoulin, 2011). Our data showed that cortical activity measured using VEPs was not constant for varying eccentricity as point-image size.
One of the factors that interplays with cortical magnification in the effect of stimulus eccentricity is the respective participation of parvocellular and magnocellular pathways. Compared to the magnocellular pathway, the parvocellular pathway has a larger dynamic range for luminance contrast. It has been shown that VEPs to foveal stimuli (<2.5-degree eccentricity) demonstrate a broader range in response amplitude to various checkerboard contrasts when compared with peripheral stimuli (Laron et al., 2009), suggesting a maximized participation of the parvocellular pathway for the central visual field. Although its dominance decreases with eccentricity, the parvocellular pathway remains the major contributor in terms of the signal energy of VEPs as peripheral as 6.4 degrees (Baseler and Sutter, 1997). Given this majority position and high contrast stimuli being used, the results presented here reflect the unequal participation of both pathways, with the parvocellular pathway playing a greater part. However, it would be of interest for future studies to quantify the contribution of the parvocellular pathway for central versus peripheral visual field visual localization in deaf subjects.
It is also expected that there may be mutual benefits between future cat VEPs studies of this type and the development of source estimation algorithms for cat EEG signals. In humans, source estimation has been applied to VEPs with prior knowledge of generator locations derived from other brain imaging techniques such as PET (Woldorff et al., 1997) and fMRI (Hagler et al., 2009). Both human and cat cerebral cortex are gyrencephalic, which is a significant factor that compromises the performance of the source estimation algorithms using the concentric multi-sphere head models (Whittingstall et al., 2003). Although the smaller size of the cat head would raise the required spatial resolution of the scanners, such disadvantage is in the trade-off with an easier accessibility to invasive techniques such as extracellular recordings. In the current study, the error in VEP measurements regarding the lack of spatial resolution and unknown locations and orientation of VEP generators inevitably complicated the interpretation of our results. However, we speculate that the use of VEPs in assessing visual functions across visual fields in human and animal subjects is a promising approach.
In conclusion, our investigation of pattern reversal VEPs in response to peripherally present checkerboards in hearing and deaf cats demonstrated little functional plasticity in cortical activity driven by visual stimuli, suggesting that the enhanced visual localization previously reported in congenitally deaf cats is primarily due to plasticity in the neural circuit controlling orientation behavior instead of the lower-level visual system. In the future, we hope to use VEP techniques (1) to dissociate perception from orientation action, and (2) to adopt multi-channel recording and source localization.
Data availability statement
The raw data supporting the conclusions of this article will be made available by the authors, without undue reservation.
Ethics statement
The animal study was reviewed and approved by McGill University Animal Care Committee–DOWB.
Author contributions
TM, XB, and SL contributed to the conception of research question and design of the experiment. TM and PB carried out data collection and participated in editing the manuscript. XB and TM performed the data analysis. XB and SL drafted the manuscript. All authors contributed to the article and approved the submitted version.
Funding
This work was supported by grants from the Canadian Institutes of Health Research, the Natural Sciences and Engineering Research Council of Canada, and the Canada Foundation for Innovation.
Conflict of interest
The authors declare that the research was conducted in the absence of any commercial or financial relationships that could be construed as a potential conflict of interest.
Publisher’s note
All claims expressed in this article are solely those of the authors and do not necessarily represent those of their affiliated organizations, or those of the publisher, the editors and the reviewers. Any product that may be evaluated in this article, or claim that may be made by its manufacturer, is not guaranteed or endorsed by the publisher.
References
Albus, K. (1975). A quantitative study of the projection area of the central and the paracentral visual field in area 17 of the cat. Exp. Brain Res. 24, 159–179. doi: 10.1007/BF00234062
Anderson, T. J., Jenkins, I. H., Brooks, D. J., Hawken, M. B., Frackowiak, R. S., and Kennard, C. (1994). Cortical control of saccades and fixation in man. A PET study. Brain 117, 1073–1084. doi: 10.1093/brain/117.5.1073
Baseler, H. A., and Sutter, E. E. (1997). M and P components of the VEP and their visual field distribution. Vision Res. 37, 675–690. doi: 10.1016/S0042-6989(96)00209-X
Bavelier, D., Tomann, A., Hutton, C., Mitchell, T., Corina, D., Liu, G., et al. (2000). Visual attention to the periphery is enhanced in congenitally deaf individuals. J. Neurosci. 20:RC93–RC93. doi: 10.1523/JNEUROSCI.20-17-j0001.2000
Buckley, K. A., and Tobey, E. A. (2011). Cross-modal plasticity and speech perception in pre- and postlingually deaf cochlear implant users. Ear. Hear. 32, 2–15. doi: 10.1097/AUD.0b013e3181e8534c
Butler, B. E., de la Rua, A., Ward-Able, T., and Lomber, S. G. (2018). Cortical and thalamic connectivity to the second auditory cortex of the cat is resilient to the onset of deafness. Brain Struct. Funct. 223, 819–835. doi: 10.1007/s00429-017-1523-y
Campbell, J., and Sharma, A. (2016). Visual cross-modal re-organization in children with cochlear implants. PLoS One 11:e0147793. doi: 10.1371/journal.pone.0147793
Chabot, N., Butler, B. E., and Lomber, S. G. (2015). Differential modification of cortical and thalamic projections to cat primary auditory cortex following early- and late-onset deafness. J. Comp. Neurol. 523, 2297–2320. doi: 10.1002/cne.23790
Colby, C. L., and Goldberg, M. E. (1999). Space and attention in parietal cortex. Annu. Rev. Neurosci. 22, 319–349. doi: 10.1146/annurev.neuro.22.1.319
Corina, D. P., Blau, S., LaMarr, T., Lawyer, L. A., and Coffey-Corina, S. (2017). Auditory and visual electrophysiology of deaf children with cochlear implants: Implications for cross-modal plasticity. Front. Psychol. 8:59. doi: 10.3389/fpsyg.2017.00059
Daniel, P. M., and Whitteridge, D. (1961). The representation of the visual field on the cerebral cortex in monkeys. J. Physiol. 159, 203–221. doi: 10.1113/jphysiol.1961.sp006803
Dinstein, I., Heeger, D. J., and Behrmann, M. (2015). Neural variability: Friend or foe? Trends Cogn. Sci. 19, 322–328. doi: 10.1016/j.tics.2015.04.005
Fine, I., Finney, E. M., Boynton, G. M., and Dobkins, K. R. (2005). Comparing the effects of auditory deprivation and sign language within the auditory and visual cortex. J. Cogn. Neurosci. 17, 1621–1637. doi: 10.1162/089892905774597173
Finney, E. M., Clementz, B. A., Hickok, G., and Dobkins, K. R. (2003). Visual stimuli activate auditory cortex in deaf subjects: Evidence from MEG. Neuroreport 14, 1425–1427. doi: 10.1097/00001756-200308060-00004
Finney, E. M., Fine, I., and Dobkins, K. R. (2001). Visual stimuli activate auditory cortex in the deaf. Nat. Neurosci. 4, 1171–1173. doi: 10.1038/nn763
Glimcher, P. W. (2001). Making choices: The neurophysiology of visual-saccadic decision making. Trends Neurosci. 24, 654–659. doi: 10.1016/s0166-2236(00)01932-9
Guitton, D., and Mandl, G. (1978a). Frontal ‘oculomotor’area in alert cat. I. Eye movements and neck activity evoked by stimulation. Brain Res. 149, 295–312. doi: 10.1016/0006-8993(78)90477-8
Guitton, D., and Mandl, G. (1978b). Frontal ‘oculomotor’area in alert cat. II. Unit discharges associated with eye movements and neck muscle activity. Brain Res. 149, 313–327. doi: 10.1016/0006-8993(78)90478-x
Hagler, D. J. Jr., Halgren, E., Martinez, A., Huang, M., Hillyard, S. A., and Dale, A. M. (2009). Source estimates for MEG/EEG visual evoked responses constrained by multiple, retinotopically-mapped stimulus locations. Hum. Brain Mapp. 30, 1290–1309. doi: 10.1002/hbm.20597
Harrington, I. A., Stecker, G. C., Macpherson, E. A., and Middlebrooks, J. C. (2008). Spatial sensitivity of neurons in the anterior, posterior, and primary fields of cat auditory cortex. Hear. Res. 240, 22–41. doi: 10.1016/j.heares.2008.02.004
Harvey, B. M., and Dumoulin, S. O. (2011). The relationship between cortical magnification factor and population receptive field size in human visual cortex: Constancies in cortical architecture. J. Neurosci. 31, 13604–13612. doi: 10.1523/JNEUROSCI.2572-11.2011
Hauthal, N., Thorne, J. D., Debener, S., and Sandmann, P. (2014). Source localisation of visual evoked potentials in congenitally deaf individuals. Brain Topogr. 27, 412–424.
Hemmings, H. C. Jr., Akabas, M. H., Goldstein, P. A., Trudell, J. R., Orser, B. A., and Harrison, N. L. (2005). Emerging molecular mechanisms of general anesthetic action. Trends Pharmacol. Sci. 26, 503–510.
King, A. J. (2004). The superior colliculus. Curr. Biol. 14:R335–R338. doi: 10.1016/j.cub.2004.04.018
Kleiner, M., Brainard, D. H., and Pelli, D. (2007). What’s new in psychtoolbox-3? Perception 36, 1–16. doi: 10.1177/03010066070360S101
Kok, M. A., Chabot, N., and Lomber, S. G. (2014). Cross-modal reorganization of cortical afferents to dorsal auditory cortex following early- and late-onset deafness. J. Comp. Neurol. 522, 654–675. doi: 10.1002/cne.23439
Laron, M., Cheng, H., Zhang, B., and Frishman, L. J. (2009). The effect of eccentricity on the contrast response function of multifocal visual evoked potentials (mfVEPs). Vision Res. 49, 1711–1716. doi: 10.1016/j.visres.2009.03.021
Leake, P. A., Hradek, G. T., Rebscher, S. J., and Snyder, R. L. (1991). Chronic intracochlear electrical stimulation induces selective survival of spiral ganglion neurons in neonatally deafened cats. Hear. Res. 54, 251–271. doi: 10.1016/0378-5955(91)90120-x
Leake, P. A., Kuntz, A. L., Moore, C. M., and Chambers, P. L. (1997). Cochlear pathology induced by aminoglycoside ototoxicity during postnatal maturation in cats. Hear. Res. 113, 117–132. doi: 10.1016/s0378-5955(97)00133-0
Lee, C. C., and Middlebrooks, J. C. (2013). Specialization for sound localization in fields A1, DZ, and PAF of cat auditory cortex. J. Assoc. Res. Otolaryngol. 14, 61–82. doi: 10.1007/s10162-012-0357-9
Lisberger, S. G., and Fuchs, A. F. (1978a). Role of primate flocculus during rapid behavioral modification of vestibuloocular reflex. I. Purkinje cell activity during visually guided horizontal smooth-pursuit eye movements and passive head rotation. J. Neurophysiol. 41, 733–763. doi: 10.1152/jn.1978.41.3.733
Lisberger, S. G., and Fuchs, A. F. (1978b). Role of primate flocculus during rapid behavioral modification of vestibuloocular reflex. II. Mossy fiber firing patterns during horizontal head rotation and eye movement. J. Neurophysiol. 41, 764–777. doi: 10.1152/jn.1978.41.3.764
Lomber, S. G., Meredith, M. A., and Kral, A. (2010). Cross-modal plasticity in specific auditory cortices underlies visual compensations in the deaf. Nat. Neurosci. 13, 1421–1427. doi: 10.1038/nn.2653
Lomber, S. G., and Payne, B. R. (2004). Cerebral areas mediating visual redirection of gaze: Cooling deactivation of 15 loci in the cat. J. Comp. Neurol. 474, 190–208. doi: 10.1002/cne.20123
Malhotra, S., Hall, A. J., and Lomber, S. G. (2004). Cortical control of sound localization in the cat: Unilateral cooling deactivation of 19 cerebral areas. J. Neurophysiol. 92, 1625–1643. doi: 10.1152/jn.01205.2003
Malhotra, S., and Lomber, S. G. (2007). Sound localization during homotopic and heterotopic bilateral cooling deactivation of primary and nonprimary auditory cortical areas in the cat. J. Neurophysiol. 97, 26–43. doi: 10.1152/jn.00720.2006
Marino, R. A., and Munoz, D. P. (2009). The effects of bottom-up target luminance and top-down spatial target predictability on saccadic reaction times. Exp. Brain Res. 197, 321–335. doi: 10.1007/s00221-009-1919-x
McLean, J., and Waterhouse, B. D. (1994). Noradrenergic modulation of cat area 17 neuronal responses to moving visual stimuli. Brain Res. 667, 83–97. doi: 10.1016/0006-8993(94)91716-7
Meredith, M. A. (1999). The frontal eye fields target multisensory neurons in cat superior colliculus. Exp. Brain Res. 128, 460–470. doi: 10.1007/s002210050869
Meredith, M. A., Clemo, H. R., Corley, S. B., Chabot, N., and Lomber, S. G. (2016). Cortical and thalamic connectivity of the auditory anterior ectosylvian cortex of early-deaf cats: Implications for neural mechanisms of crossmodal plasticity. Hear. Res. 333, 25–36. doi: 10.1016/j.heares.2015.12.007
Meredith, M. A., Kryklywy, J., McMillan, A. J., Malhotra, S., Lum-Tai, R., and Lomber, S. G. (2011). Crossmodal reorganization in the early deaf switches sensory, but not behavioral roles of auditory cortex. Proc. Natl. Acad. Sci. U.S.A. 108, 8856–8861. doi: 10.1073/pnas.1018519108
Mize, R. R., and Murphy, E. H. (1976). Alterations in receptive field properties of superior colliculus cells produced by visual cortex ablation in infant and adult cats. J. Comp. Neurol. 168, 393–424. doi: 10.1002/cne.901680306
Munoz, D. P. (2002). Commentary: Saccadic eye movements: Overview of neural circuitry. Prog. Brain Res. 140, 89–96. doi: 10.1016/S0079-6123(02)40044-1
Neville, H. J., and Lawson, D. (1987). Attention to central and peripheral visual space in a movement detection task: An event-related potential and behavioral study. II. Congenitally deaf adults. Brain Res. 405, 268–283. doi: 10.1016/0006-8993(87)90296-4
Neville, H. J., Schmidt, A., and Kutas, M. (1983). Altered visual-evoked potentials in congenitally deaf adults. Brain Res. 266, 127–132. doi: 10.1016/0006-8993(83)91314-8
O’Keefe, L. P., and Berkley, M. A. (1991). Binocular immobilization induced by paralysis of the extraocular muscles of one eye: Evidence for an interocular proprioceptive mechanism. J. Neurophysiol. 66, 2022–2033. doi: 10.1152/jn.1991.66.6.2022
Pelli, D. G. (1997). The videotoolbox software for visual psychophysics: Transforming numbers into movies. Spat. Vis. 10, 437–442. doi: 10.1163/156856897x00366
Ribrault, C., Sekimoto, K., and Triller, A. (2011). From the stochasticity of molecular processes to the variability of synaptic transmission. Nat. Rev. Neurosci. 12, 375–387. doi: 10.1038/nrn3025
Rozet, I., Metzner, J., Brown, M., Treggiari, M. M., Slimp, J. C., Kinney, G., et al. (2015). Dexmedetomidine does not affect evoked potentials during spine surgery. Anesth. Analg. 121, 492–501. doi: 10.1213/ANE.0000000000000840
Schiller, P. H., Stryker, M., Cynader, M., and Berman, N. (1974). Response characteristics of single cells in the monkey superior colliculus following ablation or cooling of visual cortex. J. Neurophysiol. 37, 181–194. doi: 10.1152/jn.1974.37.1.181
Schwaber, M. K., Garraghty, P. E., and Kaas, J. H. (1993). Neuroplasticity of the adult primate auditory cortex following cochlear hearing loss. Am. J. Otol. 14, 252–258.
Scott, G. D., Karns, C. M., Dow, M. W., Stevens, C., and Neville, H. J. (2014). Enhanced peripheral visual processing in congenitally deaf humans is supported by multiple brain regions, including primary auditory cortex. Front. Hum. Neurosci. 8:177. doi: 10.3389/fnhum.2014.00177
Sebel, P. S., Ingram, D. A., Flynn, P. J., Rutherfoord, C. F., and Rogers, H. (1986). Evoked potentials during isoflurane anaesthesia. Br. J. Anaesth. 58, 580–585. doi: 10.1093/bja/58.6.580
Stecker, G. C., Mickey, B. J., Macpherson, E. A., and Middlebrooks, J. C. (2003). Spatial sensitivity in field PAF of cat auditory cortex. J. Neurophysiol. 89, 2889–2903. doi: 10.1152/jn.00980.2002
Straschill, M., and Schick, F. (1977). Discharges of superior colliculus neurons during head and eye movements of the alert cat. Exp. Brain Res. 27, 131–141. doi: 10.1007/BF00237694
Szentesi, A., Hopkins, T. L., and Collins, R. D. (1996). Orientation responses of the grasshopper, Melanoplus sanguinipes, to visual, olfactory and wind stimuli and their combinations. Entomol. Exp. Appl. 80, 539–549. doi: 10.1111/j.1570-7458.1996.tb00970.x
Tanaka, R., Tanaka, S., Ichino, T., Ishida, T., Fuseya, S., and Kawamata, M. (2020). Differential effects of sevoflurane and propofol on an electroretinogram and visual evoked potentials. J. Anesth. 34, 298–302. doi: 10.1007/s00540-020-02733-7
Thompson, K. G., Bichot, N. P., and Sato, T. R. (2005). Frontal eye field activity before visual search errors reveals the integration of bottom-up and top-down salience. J. Neurophysiol. 93, 337–351. doi: 10.1152/jn.00330.2004
Toyama, K., Komatsu, Y., and Shibuki, K. (1984). Integration of retinal and motor signals of eye movements in striate cortex cells of the alert cat. J. Neurophysiol. 51, 649–665. doi: 10.1152/jn.1984.51.4.649
Treviño, M., Medina-Coss y León, R., and Lezama, E. (2019). Adrenergic modulation of visually-guided behavior. Front. Synaptic Neurosci. 11:9. doi: 10.3389/fnsyn.2019.00009
Tusa, R. J., Palmer, L. A., and Rosenquist, A. C. (1981). “Multiple cortical visual areas,” in Multiple visual areas, ed. C. Woolsey (Berlin: Springer), 1–31.
Van Essen, D. C., Newsome, W. T., and Maunsell, J. H. (1984). The visual field representation in striate cortex of the macaque monkey: Asymmetries, anisotropies, and individual variability. Vision Res. 24, 429–448. doi: 10.1016/0042-6989(84)90041-5
Weil, R. S., Furl, N., Ruff, C. C., Symmonds, M., Flandin, G., Dolan, R. J., et al. (2010). Rewarding feedback after correct visual discriminations has both general and specific influences on visual cortex. J. Neurophysiol. 104, 1746–1757. doi: 10.1152/jn.00870.2009
Weyand, T. G., and Gafka, A. C. (1998). Activity of neurons in area 6 of the cat during fixation and eye movements. Vis. Neurosci. 15, 123–140. doi: 10.1017/s0952523898151088
Whittingstall, K., Stroink, G., Gates, L., Connolly, J. F., and Finley, A. (2003). Effects of dipole position, orientation and noise on the accuracy of EEG source localization. Biomed. Eng. Online 2:14. doi: 10.1186/1475-925X-2-14
Woldorff, M. G., Fox, P. T., Matzke, M., Lancaster, J. L., Veeraswamy, S., Zamarripa, F., et al. (1997). Retinotopic organization of early visual spatial attention effects as revealed by PET and ERPs. Hum. Brain Mapp. 5, 280–286. doi: 10.1002/(SICI)1097-0193(1997)5:4<280::AID-HBM13>3.0.CO;2-I
Wong, C., Chabot, N., Kok, M. A., and Lomber, S. G. (2015). Amplified somatosensory and visual cortical projections to a core auditory area, the anterior auditory field, following early- and late-onset deafness. J. Comp. Neurol. 523, 1925–1947. doi: 10.1002/cne.23771
Yin, T. C., and Greenwood, M. (1992). Visuomotor interactions in responses of neurons in the middle and lateral suprasylvian cortices of the behaving cat. Exp. Brain Res. 88, 15–32. doi: 10.1007/BF02259125
Ziccardi, L., Parisi, V., Giannini, D., Sadun, F., de Negri, A. M., Barboni, P., et al. (2015). Multifocal VEP provide electrophysiological evidence of predominant dysfunction of the optic nerve fibers derived from the central retina in Leber’s hereditary optic neuropathy. Graefes Arch. Clin. Exp. Ophthalmol. 253, 1591–1600. doi: 10.1007/s00417-015-2979-1
Keywords: deafness, hearing loss, cross-modal plasticity, cortical magnification, EEG
Citation: Mitzelfelt T, Bao X, Barnes P and Lomber SG (2023) Visually evoked potentials (VEPs) across the visual field in hearing and deaf cats. Front. Neurosci. 17:997357. doi: 10.3389/fnins.2023.997357
Received: 18 July 2022; Accepted: 24 January 2023;
Published: 03 March 2023.
Edited by:
Maurice Ptito, University of Montreal, CanadaReviewed by:
Matthew William Geoffrey Dye, Rochester Institute of Technology, United StatesAmir Amedi, Interdisciplinary Center Herzliya, Israel
Copyright © 2023 Mitzelfelt, Bao, Barnes and Lomber. This is an open-access article distributed under the terms of the Creative Commons Attribution License (CC BY). The use, distribution or reproduction in other forums is permitted, provided the original author(s) and the copyright owner(s) are credited and that the original publication in this journal is cited, in accordance with accepted academic practice. No use, distribution or reproduction is permitted which does not comply with these terms.
*Correspondence: Stephen G. Lomber, c3RldmUubG9tYmVyQG1jZ2lsbC5jYQ==
†These authors have contributed equally to this work and share first authorship