
94% of researchers rate our articles as excellent or good
Learn more about the work of our research integrity team to safeguard the quality of each article we publish.
Find out more
REVIEW article
Front. Neurosci., 06 December 2023
Sec. Brain Imaging Methods
Volume 17 - 2023 | https://doi.org/10.3389/fnins.2023.1301778
This article is part of the Research TopicProbing Brain-Behavior Relationship with Multimodal Imaging: Methods and Clinical ApplicationsView all 17 articles
 Hao Xie1†
 Ying Yu1†
 Yang Yang1†
 Qian Sun1
 Ze-Yang Li1
 Min-Hua Ni1
 Si-Ning Li1,2Pan Dai1,2Yan-Yan Cui1,3Xin-Yu Cao1,4Nan Jiang1Li-Juan Du1Wen Gao5Jia-Jun Bi5
 Lin-Feng Yan1*
 Guang-Bin Cui1*
Background: Alzheimer’s disease (AD) and type 2 diabetes mellitus (T2DM) are aging related diseases with high incidence. Because of the correlation of incidence rate and some possible mechanisms of comorbidity, the two diseases have been studied in combination by many researchers, and even some scholars call AD type 3 diabetes. But the relationship between the two is still controversial.
Methods: This study used seed-based d mapping software to conduct a meta-analysis of the whole brain resting state functional magnetic resonance imaging (rs-fMRI) study, exploring the differences in amplitude low-frequency fluctuation (ALFF) and cerebral blood flow (CBF) between patients (AD or T2DM) and healthy controls (HCs), and searching for neuroimaging evidence that can explain the relationship between the two diseases.
Results: The final study included 22 datasets of ALFF and 22 datasets of CBF. The results of T2DM group showed that ALFF increased in both cerebellum and left inferior temporal gyrus regions, but decreased in left middle occipital gyrus, right inferior occipital gyrus, and left anterior central gyrus regions. In the T2DM group, CBF increased in the right supplementary motor area, while decreased in the middle occipital gyrus and inferior parietal gyrus. The results of the AD group showed that the ALFF increased in the right cerebellum, right hippocampus, and right striatum, while decreased in the precuneus gyrus and right superior temporal gyrus. In the AD group, CBF in the anterior precuneus gyrus and inferior parietal gyrus decreased. Multimodal analysis within a disease showed that ALFF and CBF both decreased in the occipital lobe of the T2DM group and in the precuneus and parietal lobe of the AD group. In addition, there was a common decrease of CBF in the right middle occipital gyrus in both groups.
Conclusion: Based on neuroimaging evidence, we believe that T2DM and AD are two diseases with their respective characteristics of central nervous activity and cerebral perfusion. The changes in CBF between the two diseases partially overlap, which is consistent with their respective clinical characteristics and also indicates a close relationship between them.
Systematic review registration: PROSPERO [CRD42022370014].
Diabetes is a chronic metabolic disease characterized by hyperglycemia (Zheng et al., 2018), and type 2 diabetes mellitus (T2DM) characterized by insulin dysfunction accounts for the majority (about 95%) (Bruno et al., 2005; Holman et al., 2015). It is estimated that the prevalence rate of diabetes will gradually increase from 6.3% in 2019 to 10.2% in 2030, when the population will reach 578 million, becoming a serious global public health problem (Saeedi et al., 2019). The complications of diabetes include retinopathy, renal failure, heart disease, cerebrovascular disease (Kautzky-Willer et al., 2016; Zheng et al., 2018). In addition, the cognitive impairment caused by diabetes is also increasingly concerned. Research reports that about 25–36% of diabetes patients have cognitive impairment (Geijselaers et al., 2015), and progress to dementia more quickly than healthy people (Exalto et al., 2013; Biessels and Despa, 2018), among which the risk of Alzheimer’s disease (AD) increases by about 45–90% (Arvanitakis et al., 2004; Wang et al., 2012).
AD is a chronic neurodegenerative disease with hidden onset (Liu et al., 2019). It is the most common type of dementia, accounting for about 70% (Burns and Iliffe, 2009), and the incidence rate is increasing year by year (Alzheimer’s Association, 2021; Scheltens et al., 2021). The pathological feature of AD is hyperphosphorylated TAU protein deposition in the cells, and forms the neurofibrillary tangles when occurring in the nerve cells (Ballard et al., 2011; Scheltens et al., 2021). According to previous studies, T2DM and AD share many common characteristics, including being highly prevalent age-related diseases with a long prodromal period and being chronic complex diseases (Kubis-Kubiak et al., 2019; Diniz Pereira et al., 2021). In addition, T2DM and AD have many pathological mechanisms in common caused by insulin resistance (Janson et al., 2004), such as metabolic syndrome (Więckowska-Gacek et al., 2021), advanced glycation end products (AGEs) (Byun et al., 2017), insulin signal transduction disorder (De Felice et al., 2022), etc. Therefore, some researchers believe that AD is a late complication with the development of T2DM, which can even be called type 3 diabetes (de la Monte et al., 2018; Nguyen et al., 2020). However, another group of scholars believe that the two diseases are different, and T2DM is only a high-risk factor for AD (Moran et al., 2015), which leads to faster disease progress (Chornenkyy et al., 2019). At present, the relationship between T2DM and AD is still unclear, especially the brain damage caused by the two diseases. However, central insulin resistance and signal transduction abnormalities caused by these two diseases are becoming the mainstream (Diehl et al., 2017; Kellar and Craft, 2020).
In clinical studies, researchers tried to use various methods such as electroencephalogram (EEG), positron emission tomography (PET), single photon emission computed tomography (SPECT) and magnetic resonance imaging (MRI) to clarify the process of brain changes in T2DM or AD (Bucerius et al., 2012; Chen and Zhong, 2013; Brundel et al., 2014; Matsuda, 2016; Benwell et al., 2020). The resting-state functional MRI (rs-fMRI) has been increasingly used because of its non-invasive, efficient, high spatial resolution in detecting central nervous system. Amplitude low-frequency fluctuation (ALFF) and cerebral blood flow (CBF) are more widely used indicator derived from fMRI. ALFF is a measure of resting state blood oxygen level dependent (BOLD) signal changes, reflecting local neural activity (Zou et al., 2008), while CBF measured by arterial spin labeling (ASL) technique which can reflect cerebral perfusion (Williams et al., 1992). ALFF and CBF have always been regarded as two independent indicators, but studies have confirmed that CBF was involved in regulating the change of BOLD signal (Kannurpatti et al., 2008; Tak et al., 2014), and they can reflect the intensity of local neural activity in direct and indirect ways (Kim and Lee, 2004; Yu-Feng et al., 2007), respectively. Furthermore, these two indicators can be combined for analysis to represent the neurovascular coupling status of brain regions (Hu et al., 2019; Yu et al., 2019). Therefore, it is necessary to conduct research and analysis on these two indicators.
Since the application of fMRI technology, a lot of scientific achievements have been published on ALFF and CBF alteration in T2DM or AD. However, differences in sample size, demographic information, image acquisition techniques and analysis methods among different studies lead to heterogeneity of results. Meta-analysis has emerged to identify abnormal brain activity from a large number of studies. For example, a published meta-analysis in T2DM patients showed a decrease of ALFF in the parietal lobe, occipital lobe, and cingulate gyrus (Macpherson et al., 2017). The meta-analysis in AD patients showed a general decrease of CBF in whole brain, especially in the posterior cingulate gyrus and temporal parietal lobe (Zhang et al., 2021), while the meta-analysis in T2DM patients showed that CBF decreased in bilateral occipital lobe but increased in right prefrontal lobe and supplementary motor area (Liu et al., 2022). Due to differences of literature inclusion criteria and specific analysis methods, the level of evidence from the combined analysis of the above two indicators might decrease. In summary, it is essential to combine ALFF and CBF for further analysis by using neurovascular coupling coefficient, in order to explore the alteration of brain neural activity in T2DM and AD, and to analyze the similarities and differences of brain damage caused by the two diseases.
The aim of this study is, to perform a voxel-based meta-analysis of ALFF and CBF changes in patients with T2DM and AD, by taking advantage of the large number of whole-brain rs-fMRI studies published in recent years, and to explore whether there are similarities in brain alterations in the two diseases. This is not only helpful to understand the pathophysiology of T2DM and AD more accurately, but also can provide evidence of brain damages from the perspective of imaging, which is helpful to reveal the pathogenesis and to find the promising biomarkers.
The meta-analysis was conducted in accordance with the guidelines of the Preferred Reporting Items for Systematic Reviews and Meta-Analyses (PRISMA) and 10 simple rules for neuroimaging meta-analysis (Müller et al., 2018; Page et al., 2021). The protocol of this neuroimaging meta-analysis was registered on PROSPERO (CRD42022370014).1
We used a systematic search strategy to identify published relevant studies in databases including PubMed, Web of Science, from Jan 1, 2007 to Sep 1, 2022. Divided the search process into two parts based on the type of indicator. The first part used keywords (“Diabetes Mellitus, Type 2” OR “Type 2 Diabetes” OR “Diabetes Mellitus, Type II” OR “NIDDM” OR “T2DM” OR “Alzheimer Disease” OR “Alzheimer*” OR “dement*” OR “AD”) AND (“amplitude of low frequency fluctuation” OR “ALFF” OR “low frequency fluctuation” OR “LFF” OR “amplitude of low frequency oscillation” OR “LFO”). The second part used keywords (“Diabetes Mellitus, Type 2” OR “Type 2 Diabetes” OR “Diabetes Mellitus, Type II” OR “NIDDM” OR “T2DM” OR “Alzheimer Disease” OR “Alzheimer*” OR “dement*” OR “AD”) AND (“Cerebrovascular Circulation” OR “arterial spin labeling” OR “ASL” OR “Cerebral Blood Flow” OR “CBF”).
After completing the search, duplicate studies were first excluded. When extracting information in the study by reading the full text, if there was important information that could not be found, such as coordinate values, non-online manuscripts, etc., we contacted the corresponding author by email. After information extraction, studies conforming to the research will be included in the following: (1) an article was published, rather than the abstract, lecture or letters; (2) assessed CBF or ALFF in whole brain analysis; (3) participants were classified into healthy controls (HCs) and T2DM and/or AD groups in cross-sectional and at the baseline of longitudinal studies; (4) the article clearly reported peak coordinates in stereotactic three-dimensional coordinates (MNI or Talairach); (5) be able to extract the t value, z values or p values; and (6) subjects were adults (18–75 years old). Exclusion criteria will be: (1) the study participants were individuals diagnosed with dementia other than AD; (2) other neuropsychiatric disorders, macrovascular complications, craniocerebral trauma, and inflammatory lesions of the central nervous system; (3) no HCs; (4) not related to ALFF and CBF; (5) studies with ROI analysis; (6) research on minors; (7) secondary study; and (8) neuroimaging quality score<16 or JBI score<12.
We referred to the previous high-quality literature and used the methodological assessment checklist which was specific for neuroimaging meta-analysis to evaluate the quality of the included study (Pan et al., 2017; Supplementary Figure S1; Supplementary Tables S4, S5). In addition, only cross-sectional information was extracted after the study was included, so we introduced the Joanna Briggs Institute (JBI) critical appraisal checklist of the cross-sectional study for secondary assessment (Ma et al., 2020; Supplementary Figure S2; Supplementary Table S6). The quality of the study was first independently evaluated by two reviewers (H.X and ZY.L, Radiologist), and the consistent evaluation results would be adopted. If there were differences in the evaluation results, the third reviewer (LF.Y, Deputy Chief Radiologist and Associate Professor) would evaluate and make final decision.
The meta-analyses of ALFF and CBF were performed in the “Gray Matter” templates of the anisotropic effect size-signed differential mapping (AES-SDM) (Radua and Mataix-Cols, 2009; Radua et al., 2012; Radua and Mataix-Cols, 2012; Radua et al., 2014), which has been widely used in the meta-analysis of neuroimaging (Barona et al., 2019; Li et al., 2022). The specific research process has been reported in detail in previous studies (Radua and Mataix-Cols, 2009; Ferreira and Busatto, 2010; Radua et al., 2012), so we summarized the methods as follows: First, extracting the effective coordinates of CBF or ALFF abnormalities (increased or decreased) between T2DM patients or AD patients and HCs in each data set and the size of their brain impacts, and using various heterotypic Gaussian kernels to reconstruct the statistical map on MNI coordinates. Then, the study combined the random effect model considering sample size, intra-study variability and between-study heterogeneity to generate a mean map. Finally, MRICRON2 software were used to visualize the data.
According to the research of software developers, we have adopted the recommended settings (FWHM = 20 mm, p = 0.005, peak height Z = 1, and cluster extent ≥20 voxels) in this study (Radua et al., 2012). When extracting data from research, if only z value or p value was provided, it can be analyzed by converting it to t value through https://www.sdmproject.com/utilities/?show=Statistics. According to the software instruction, the following five standard steps will be followed when processing data: (1) Global analysis, (2) Pre-processing, (3) Mean analysis, (4) Threshold analysis, and (5) Extract peak coordinates and Bias Test.
Next, we compared the covariant brain regions (increased or decreased) of ALFF and CBF in T2DM compared with HCs through quantitative meta-analysis of brain regions with differences among groups obtained from previous analysis, and used standard randomization test to determine statistical significance. The same analysis was performed for AD group. In this process, we took demographic information with statistical differences as covariates. In addition, by combining the result graph of threshold element analysis, we studied the increase/decrease overlap of ALFF between T2DM and AD, and compared the voxel number and z value in the actual interaction area and visualized results. Similarly, we conducted the same analysis on covariant of CBF between T2DM and AD.
Extract the MNI peak coordinates with statistical differences, and obtain the standard heterogeneity test I2. If I2 ≥ 50%, it means significant heterogeneity (Egger et al., 1997). Funnel plots were used to test whether there was publication bias. Asymmetric funnels or p < 0.05 were considered to have publication bias (Sterne et al., 2011). These analyses were performed using the SDM-PSI version 6.21.3 Finally, jackknife sensitivity was used for sensitivity analysis of whole brain voxels. The specific method was to check the stability of results by repeating the same analysis process after excluding one data set each time (Radua et al., 2014). This procedure aimed to analyze the repeatability of the results. If a result was significant different in all or most (>50%) of the study combinations, we believed that the result was highly replicable (Radua and Mataix-Cols, 2009).
In the study, the linear regression in AES-SDM was used for meta-regression to explore the impact of demographic information and clinical variables such as years of education, course of disease, and clinical evaluation scale scores on the results. Regression analysis could exclude the regions outside the brain obtained from principal component analysis (Yao et al., 2021).
A total of 634 studies were obtained from the first part of the search. After preliminary removing the duplicates and reviewing the titles and abstracts, 44 studies were retained and considered potentially eligible for inclusion. Then, after a detailed reading of the full article text, another 22 studies were excluded. Finally, 22 studies including 22 data sets met the criteria and were included to analyze the ALFF differences between T2DM and AD patients, including 11 studies on AD patients and 11 studies on T2DM patients (Figure 1). A total of 6,366 studies were obtained from the second part of the search. After preliminary removing the duplicates and reviewing the titles and abstracts, 86 studies were retained and considered potentially eligible for inclusion. Then, after a detailed reading of the full article text, another 65 studies were excluded. Finally, 21 studies including 21 data sets met the criteria and were included to analyze the CBF differences between T2DM and AD patients, including 13 studies on AD patients and 8 studies on T2DM patients. A total of 43 studies were included for this meta-analysis (Figure 1).
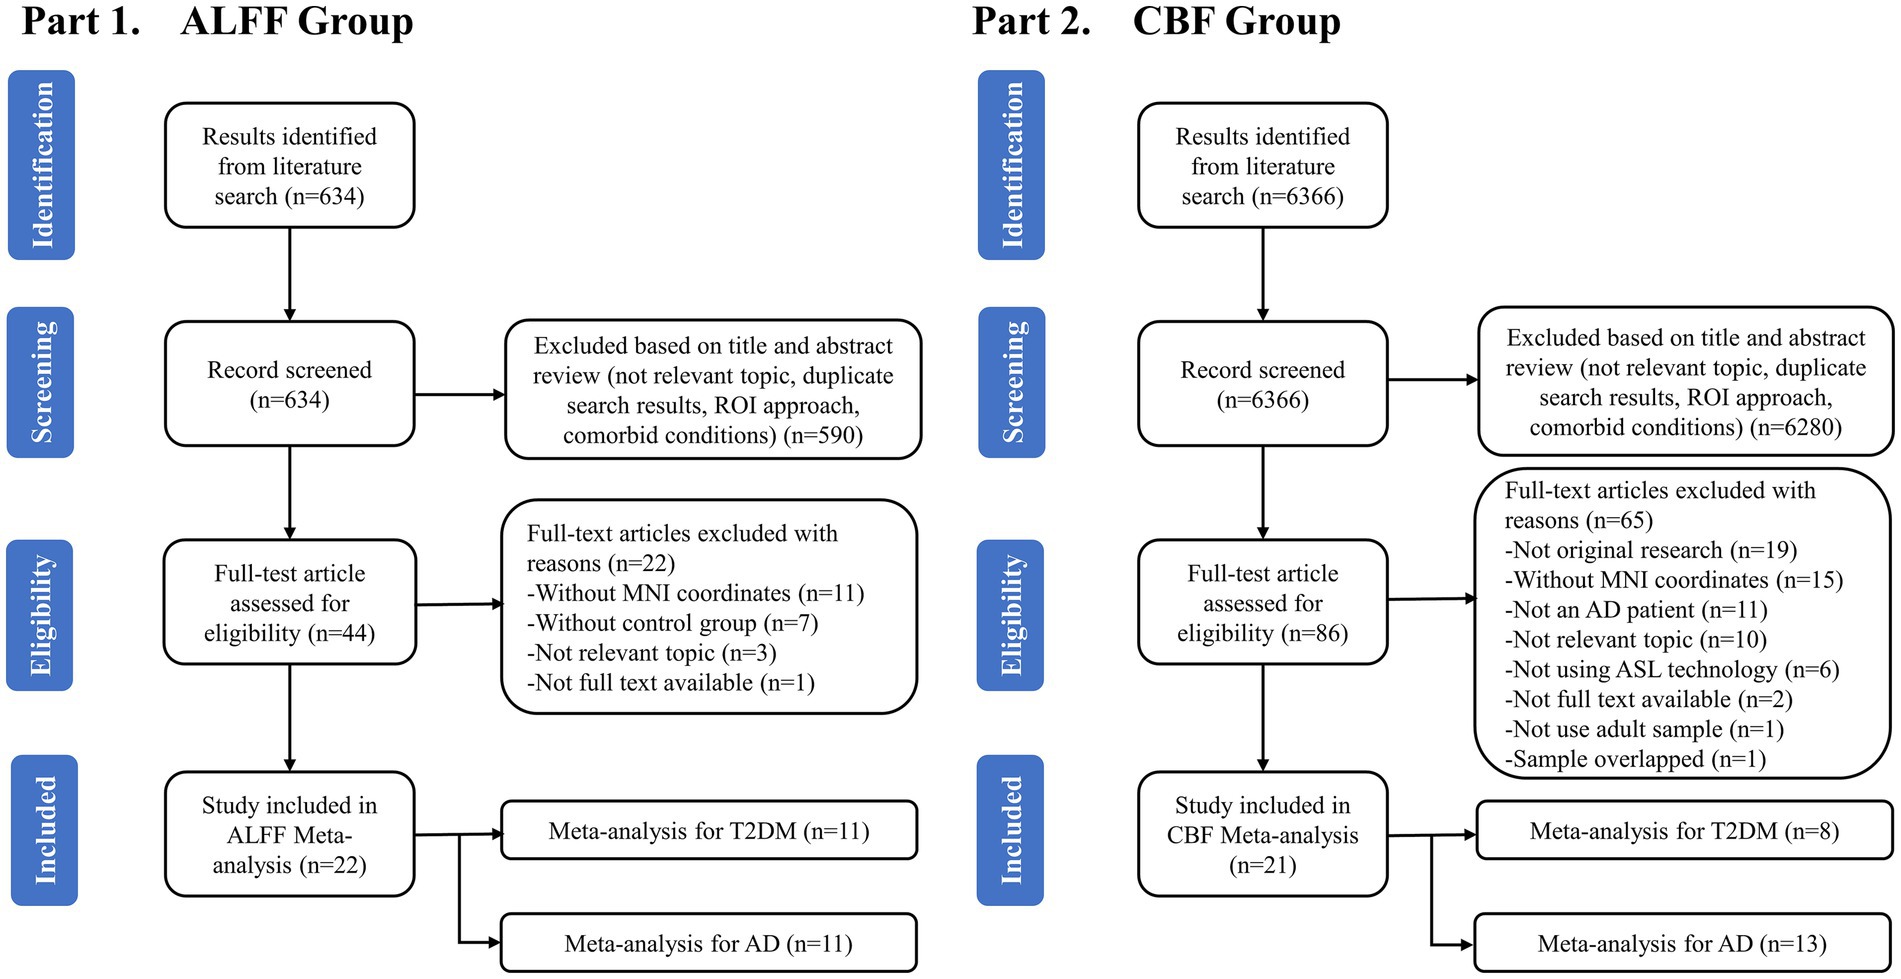
Figure 1. Flowchart for identifying studies to be included in the meta-analysis.
In all of T2DM studies included in ALFF analysis, 302 patients with T2DM (171 males and 131 females, mean age = 56.00 years) and 302 HCs (153 males and 149 females, mean age = 55.36 years) were included (Detailed demographic and clinical information is shown in Table 1, and radiological parameters are shown in Supplementary Tables S2, S3). There was no significant difference in gender (χ2 = 2.157, p = 0.14) and age (standardized mean difference [SMD] = 0.11; 95% confidence interval [CI] = [−0.05, 0.27], Z = 1.30, p = 0.19) distribution between the two groups. Among all included CBF related studies, 286 T2DM patients (150 males and 136 females) and 280 HCs (131 males and 149 females) were included. No significant difference was observed between patients with T2DM and HCs in gender (χ2 = 1.814, p = 0.18) and age (SMD = 0.91; CI = [−0.34, 2.16], Z = 1.43, p = 0.15) distribution.
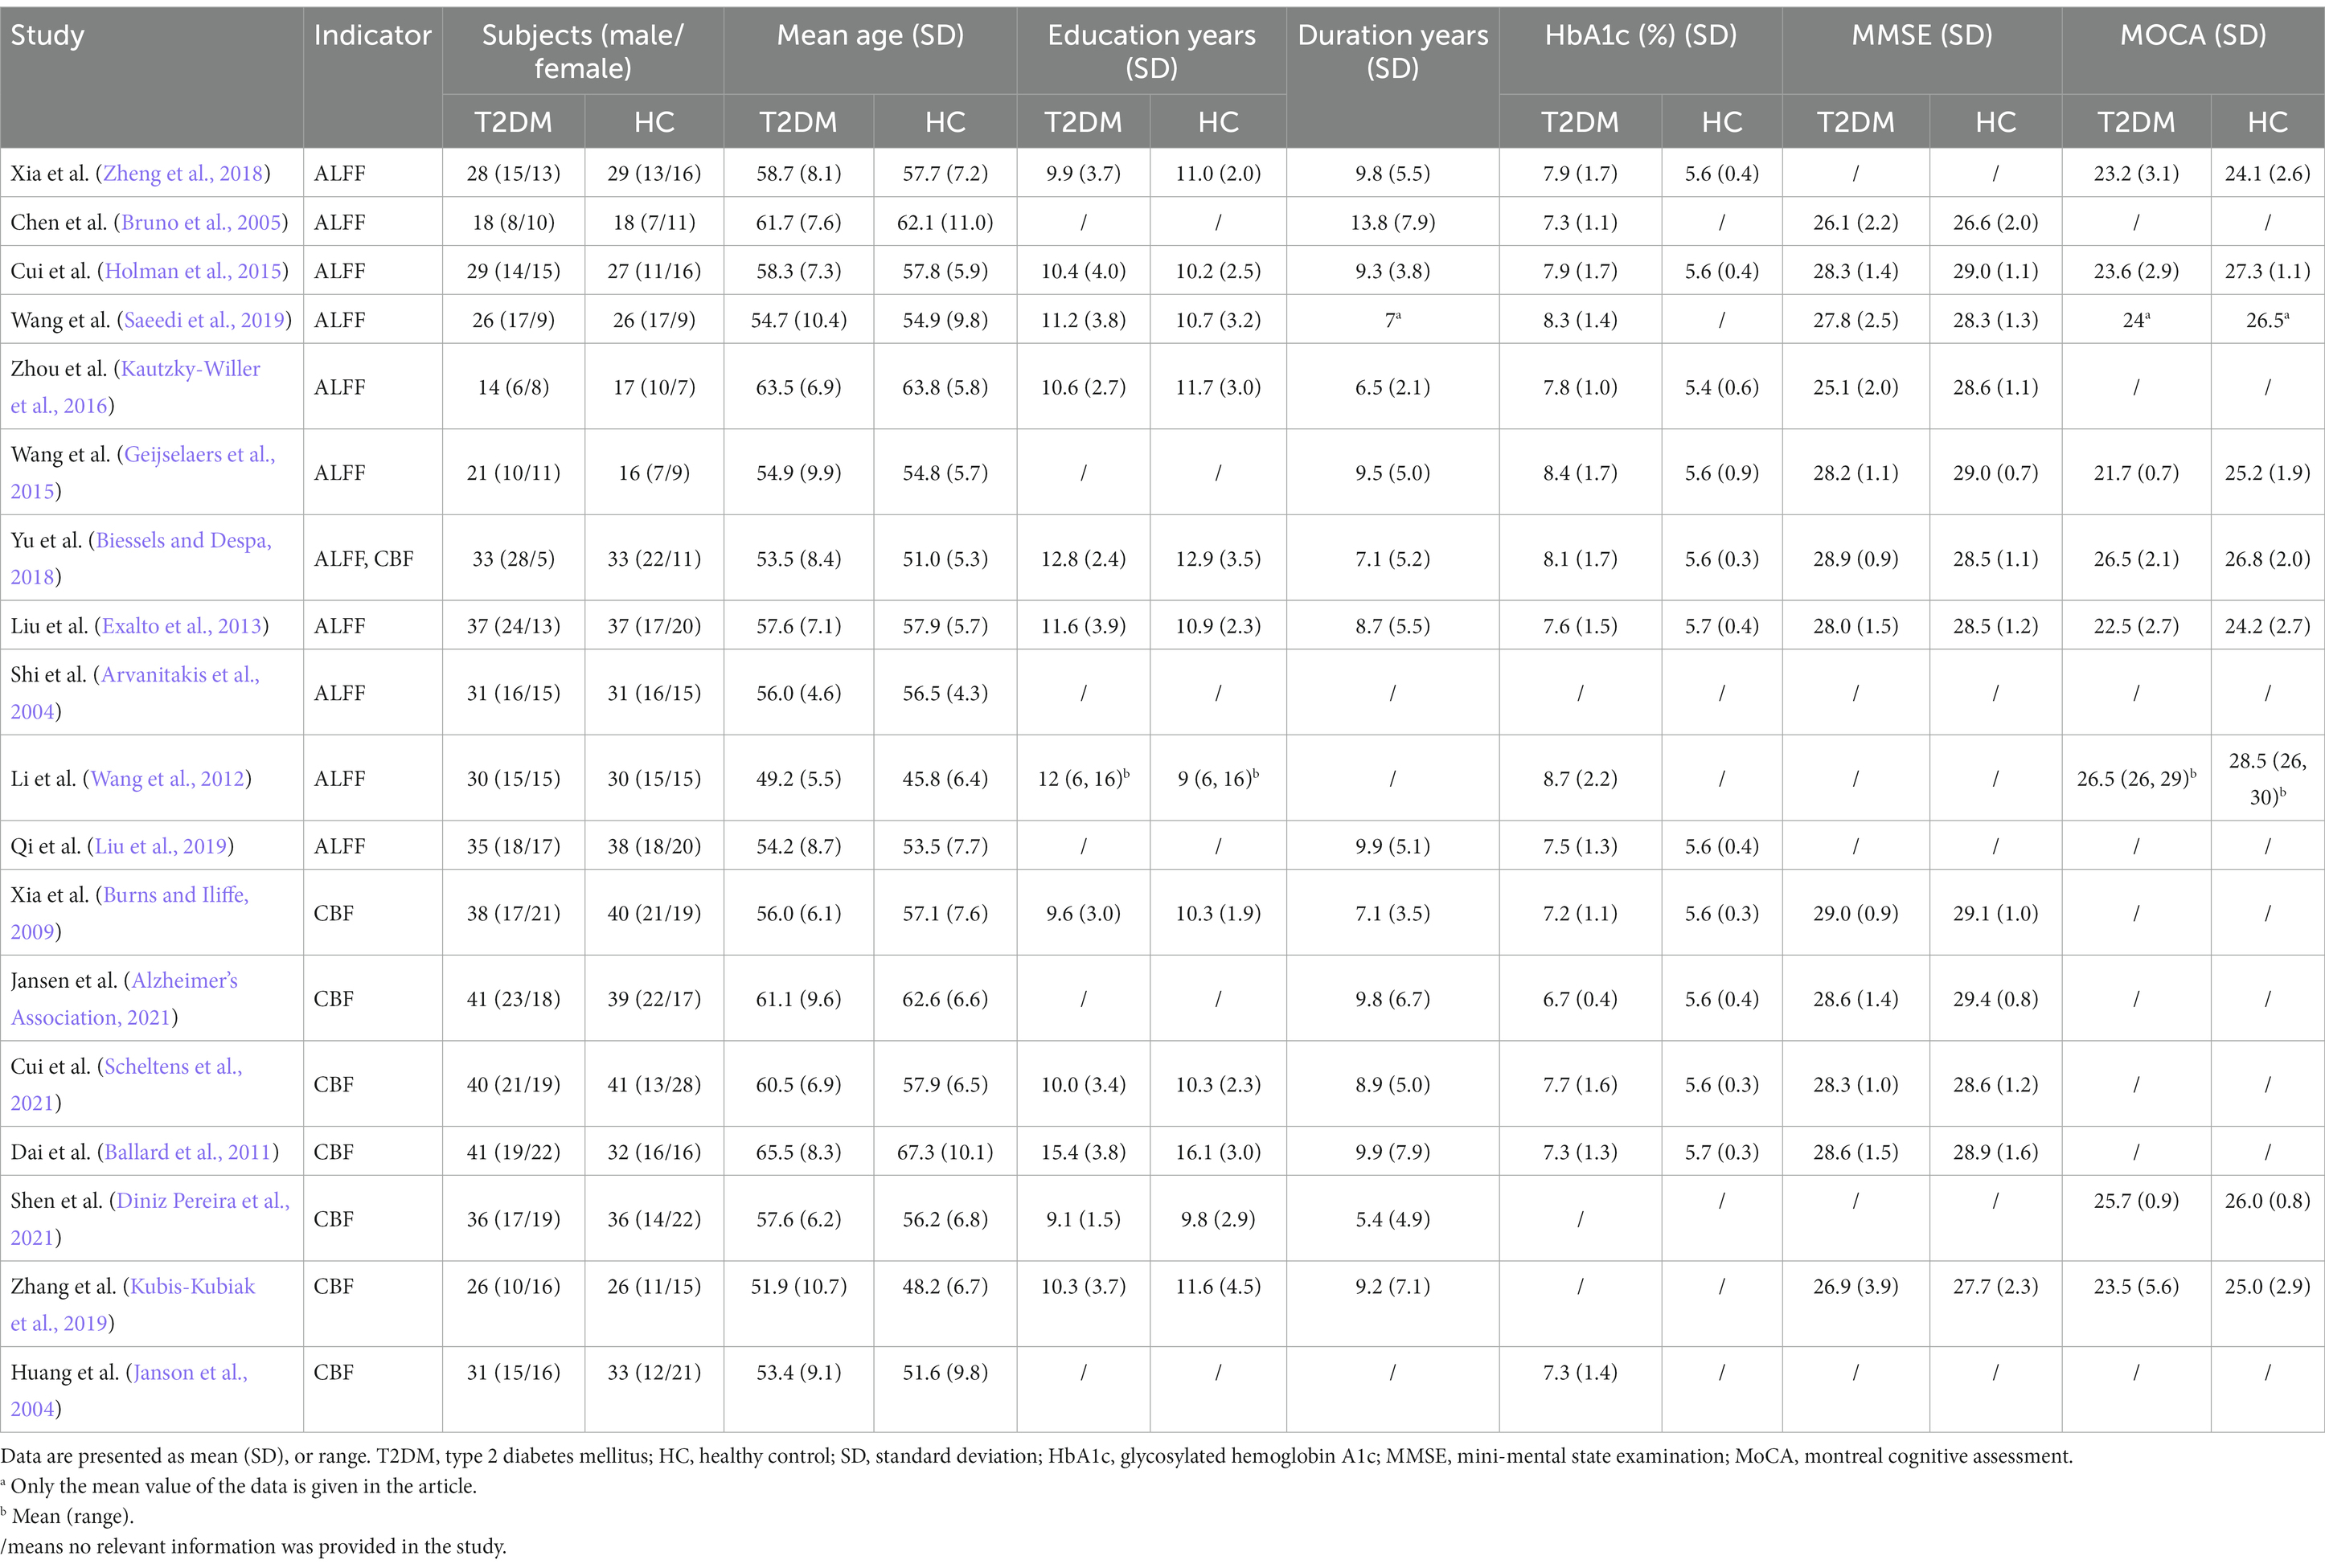
Table 1. Demographic, clinical and cognitive characteristics of T2DM patients and HCs included in the meta-analysis.
In all of AD studies included in ALFF analysis, 390 patients with AD (160 males and 230 females, mean age = 69.23 years) and 492 HCs (183 males and 309 females, mean age = 68.93 years) were included (Detailed demographic and clinical information is shown in Table 2, and radiological parameters are shown in Supplementary Tables S2, S3). No significant difference were observed between the two groups in gender (χ2 = 1.343, p = 0.25), but there was significant difference in age distribution (SMD = 2.74; CI = [1.56, 3.92], Z = 4.56, p < 0.00001). Among all included CBF related studies, 310 AD patients (121 males and 189 females) and 335 HCs (142 males and 193 females) were included. No significant difference were observed between AD patients and HCs in gender (χ2 = 0.751, p = 0.39), while there was significant difference in age (SMD = 1.73; CI = [0.90, 2.56], Z = 4.10, p < 0.0001).
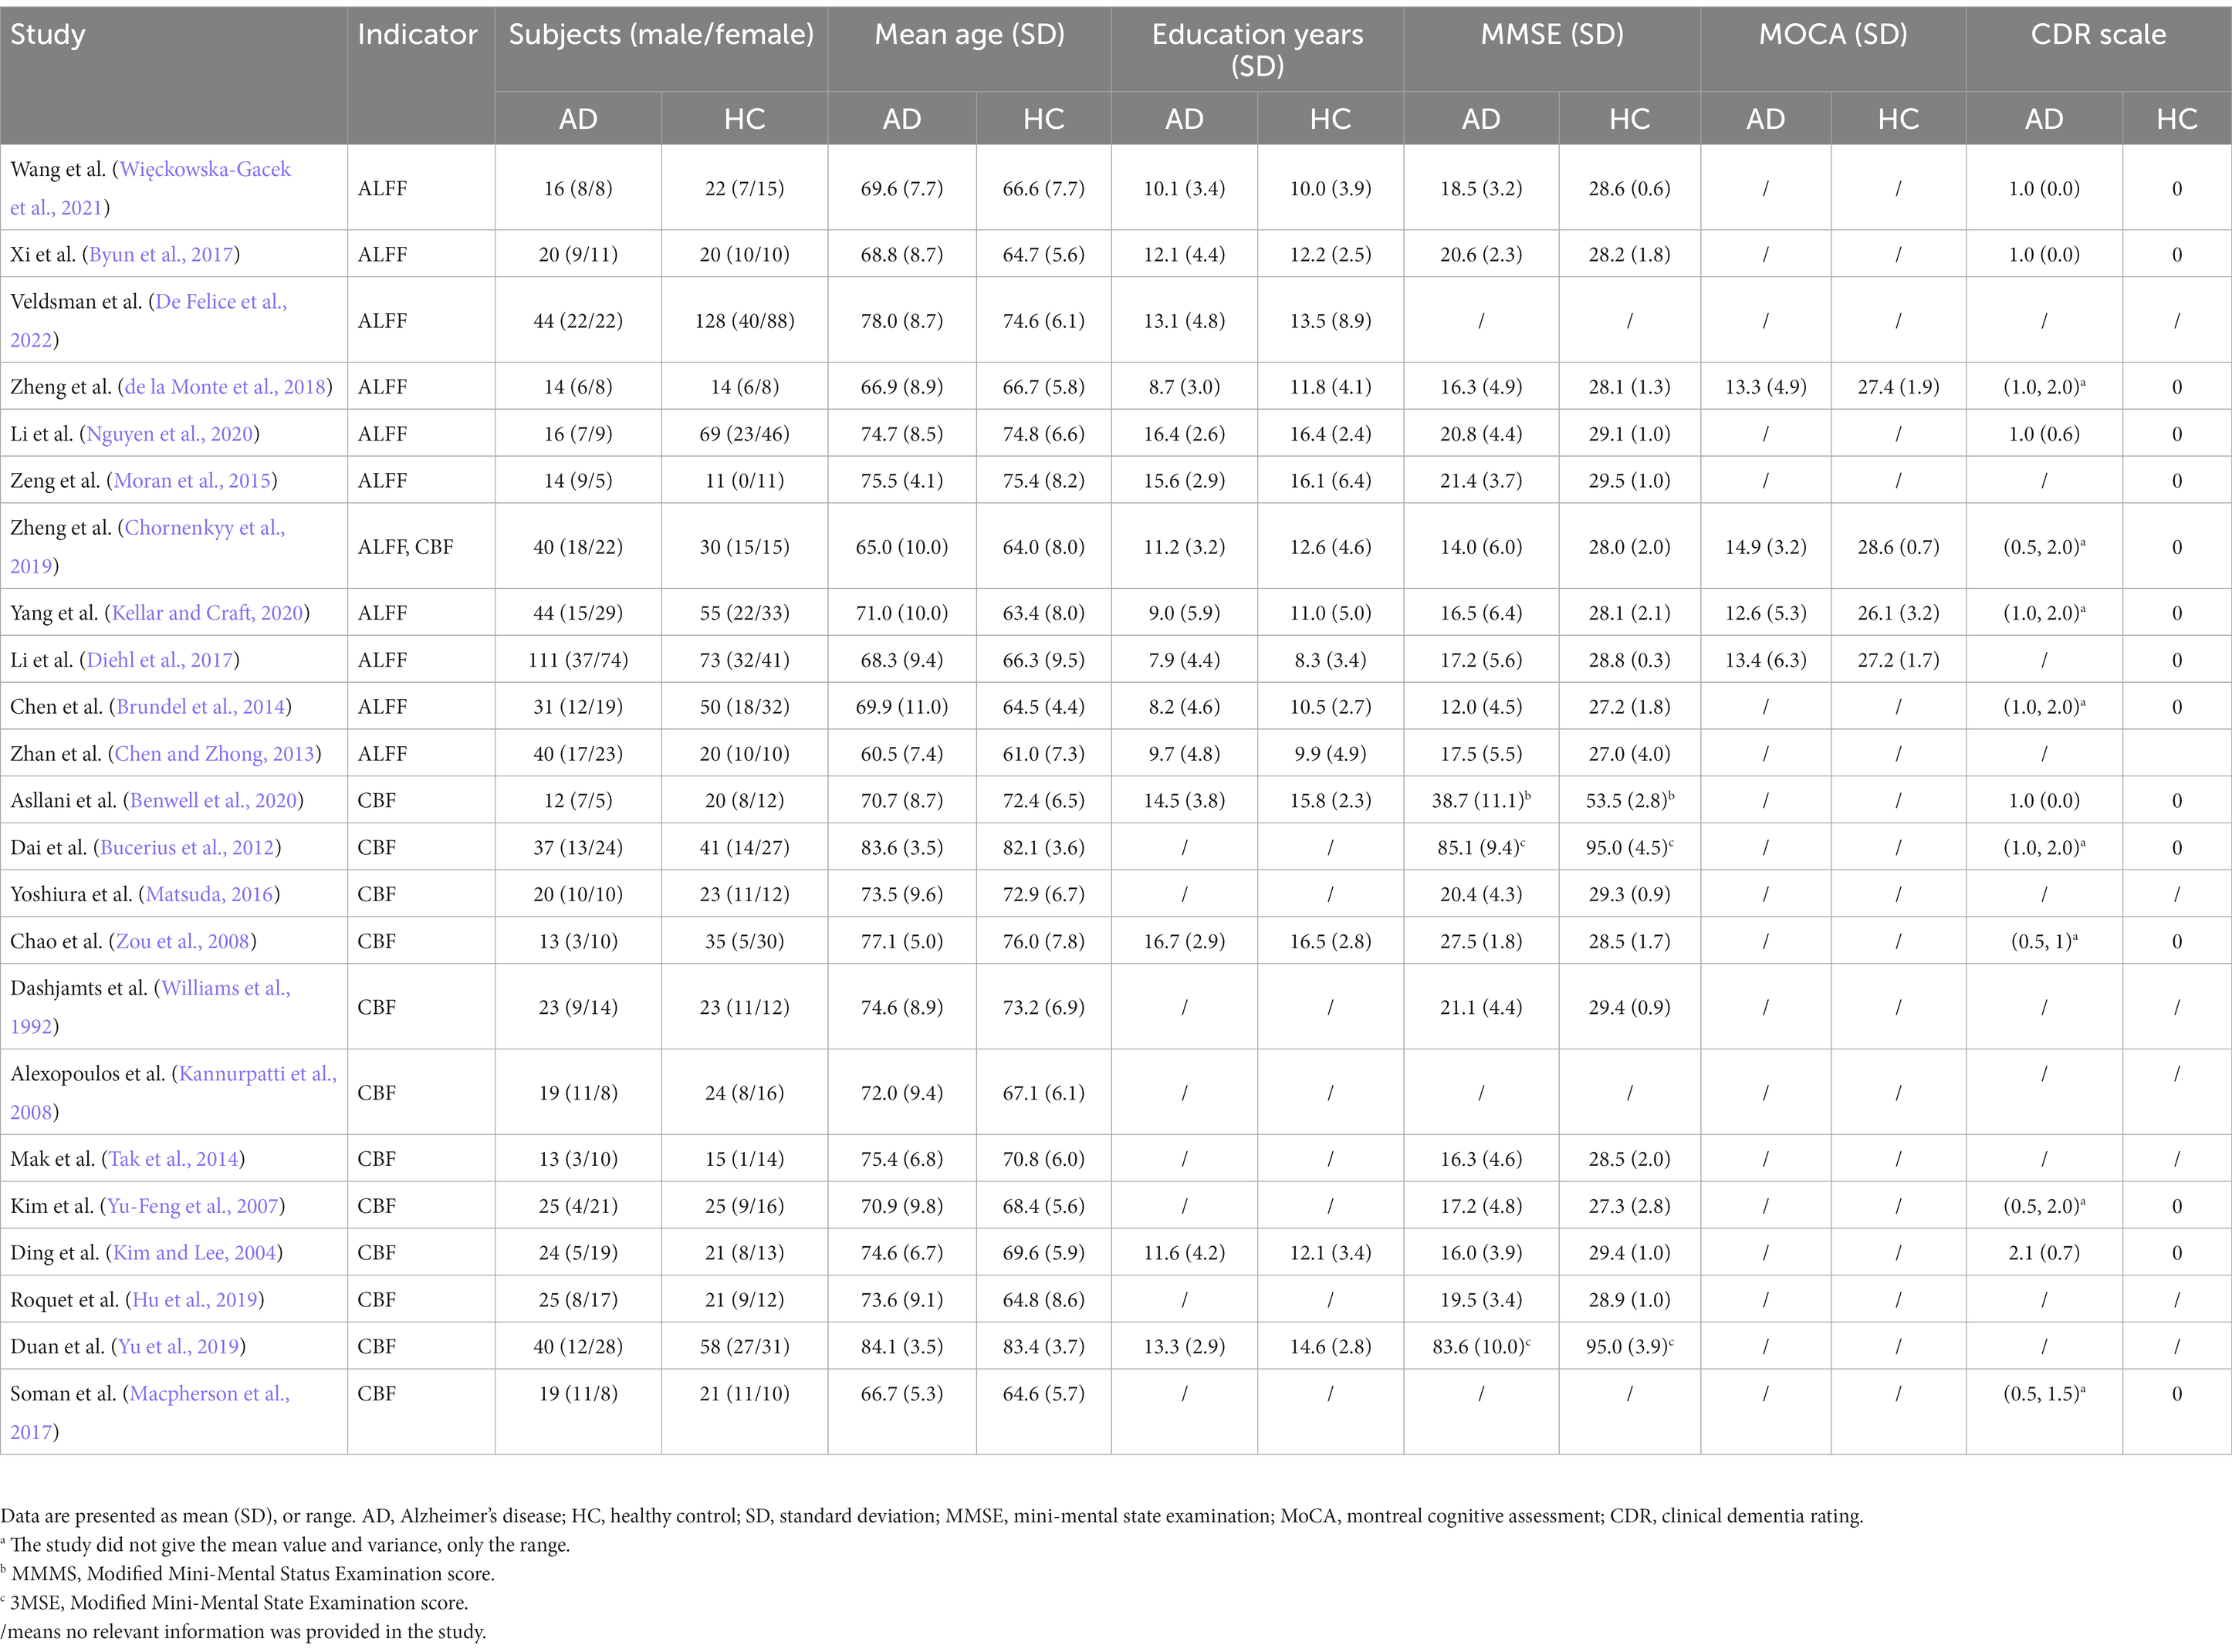
Table 2. Demographic, clinical and cognitive characteristics of AD patients and HCs included in the meta-analysis.
The brain map derived from meta-analysis showed that compared to HCs, ALFF in the T2DM group increased in the cerebellum (CER) and left inferior temporal gyrus (ITG. L), while decreased in the left middle occipital gyrus (MOG. L), right inferior occipital gyrus (IOG. R), and left precentral gyrus (preCG. L) (Figure 2). These regions existed significant heterogeneity (I2 > 50%), so random effect model was selected for analysis. Except for preCG.L, there was no publication bias in other brain regions. The research of Zhou et al. (2014) led to publication bias in preCG.L. Jackknife sensitivity analysis showed that the above brain regions were highly repeatable and the results were reliable (Supplementary Table S7).
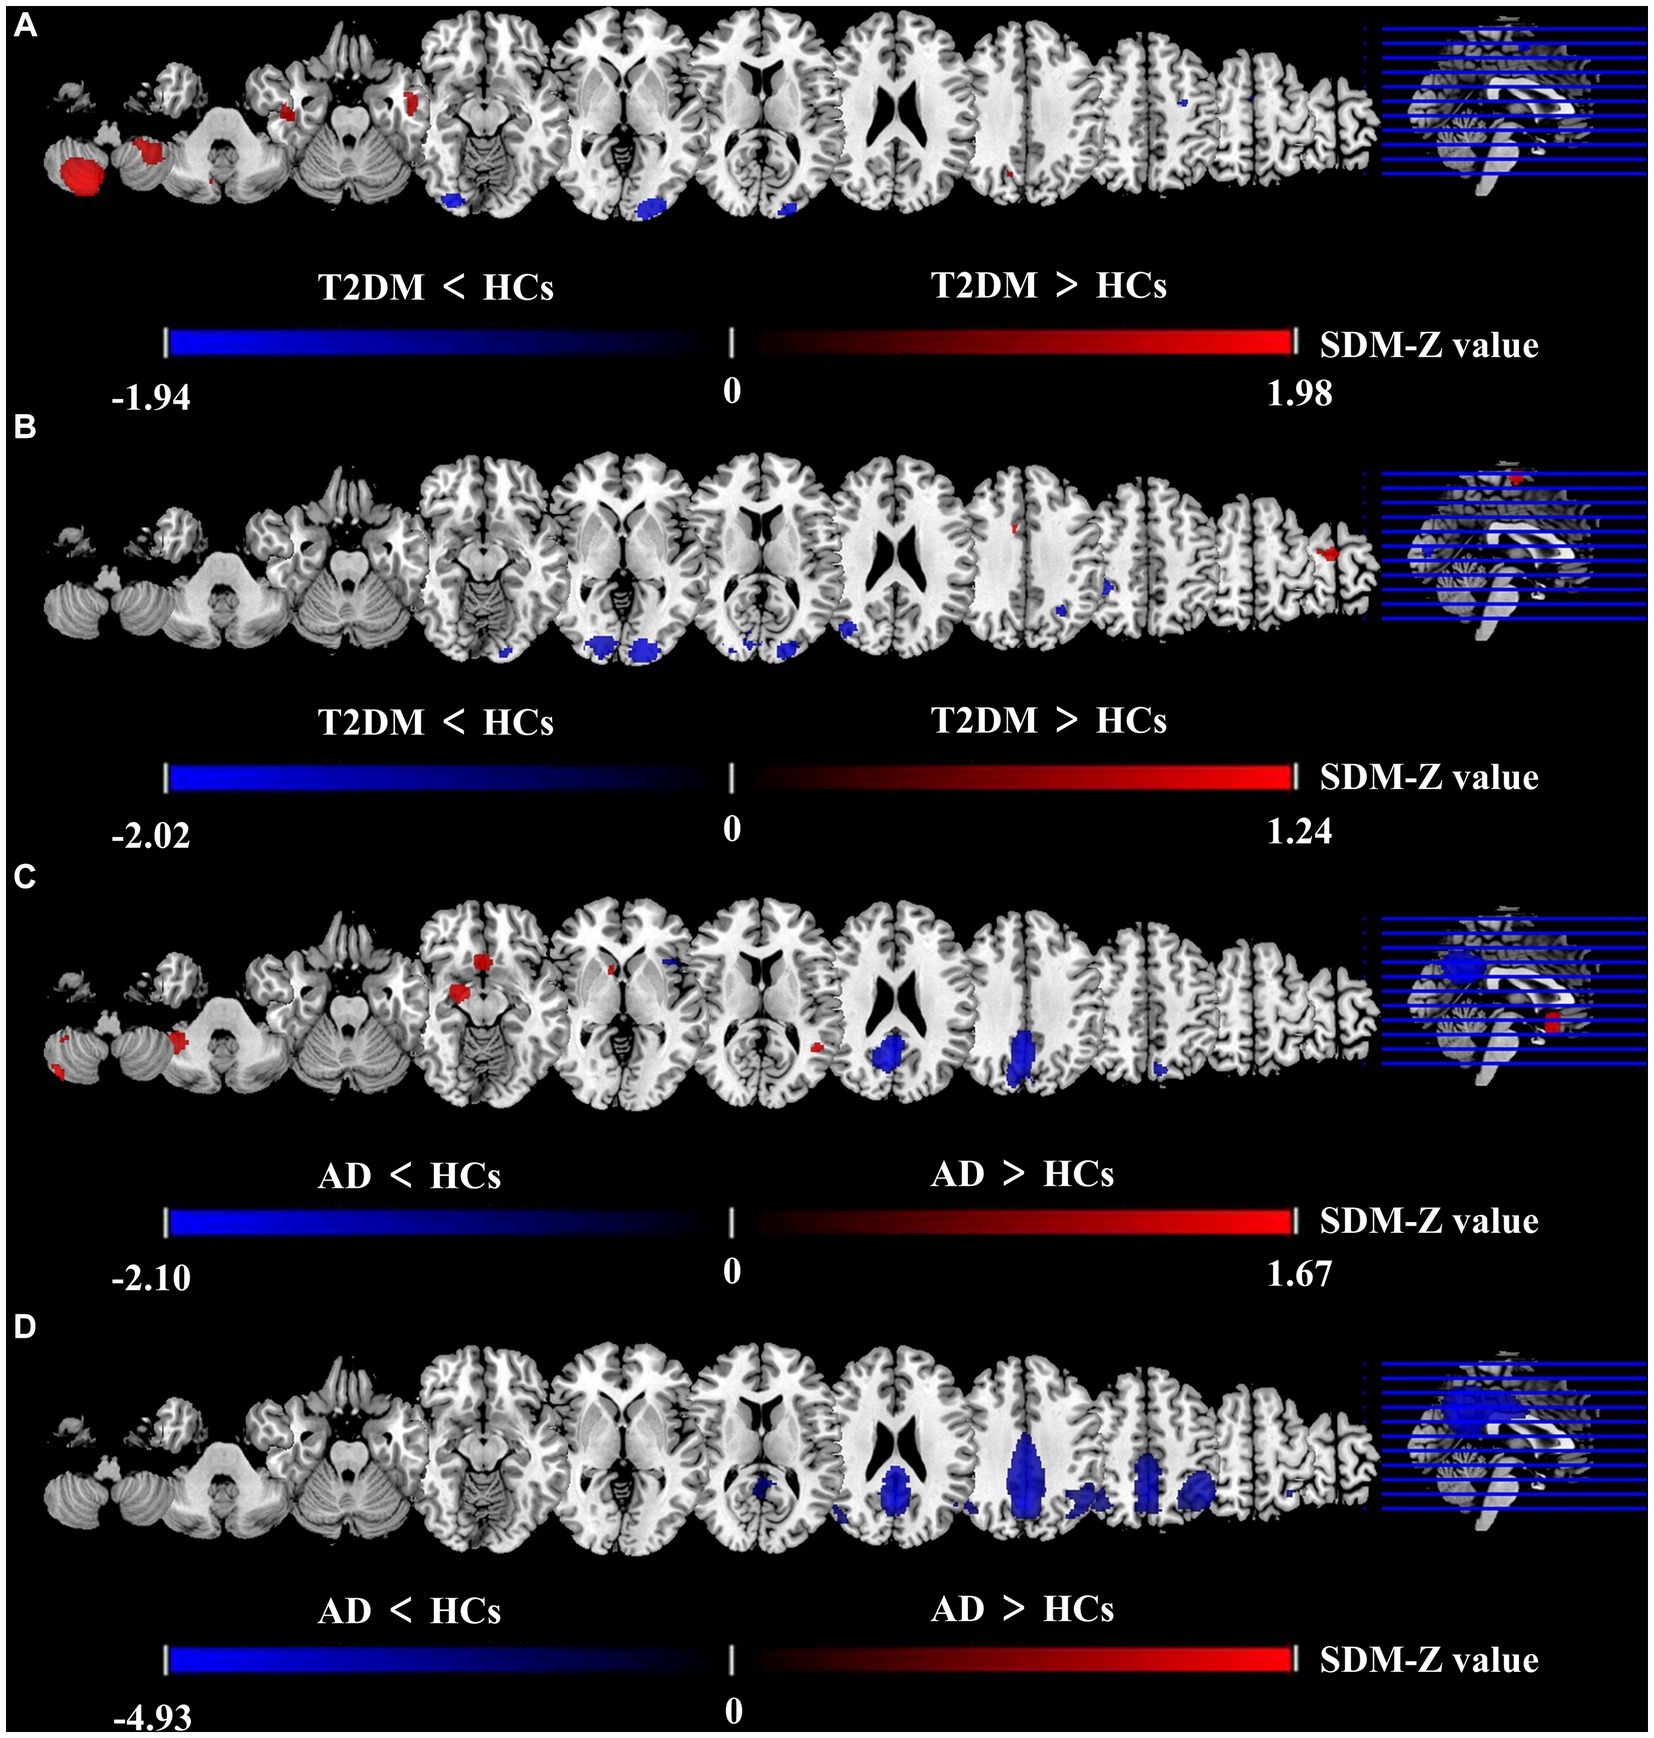
Figure 2. Differences between two groups in CBF and ALFF in meta-analysis results. Results of the meta-analysis (A) ALFF difference between T2DM and HCs. (B) CBF difference between T2DM and HCs. (C) ALFF difference between AD and HCs. (D) CBF difference between AD and HCs.
The meta-analysis brain maps showed that compared to HC, ALFF in the AD group increased in CER. R, right striatum, and right hippocampus (HIP. R), while decreased in the precuneus gyrus (PCUN) and right superior temporal gyrus (STG. R) (Figure 2). These regions existed significant heterogeneity (I2 > 50%), so random effect model was selected for analysis. There was no publication bias in all brain regions. Jackknife sensitivity analysis showed that the above brain regions were highly repeatable and the results were reliable (Supplementary Table S8).
The results of a joint two parts analysis showed that compared to HCs, T2DM and AD did not have brain regions where ALFF increased or decreased simultaneously.
The meta-analysis brain maps showed that compared to HCs, the T2DM group had an increase of CBF in the right supplementary motor area (SMA. R), while a decrease of CBF in the middle occipital gyrus (MOG) and inferior parietal gyri (IPG) (Figure 2). These regions existed significant heterogeneity (I2 > 50%), so random effect model was selected for analysis. There was no publication bias in all brain regions. Jackknife sensitivity analysis indicated that the most reliable data had been obtained in the above brain regions (Supplementary Table S9).
The brain maps showed that in CBF meta-analysis, compared to HC, the AD group’s CBF decreased in PCUN and IPG (Figure 2). These regions existed significant heterogeneity (I2 > 50%), so random effect model was selected for analysis. There was no publication bias in all brain regions. Jackknife sensitivity analysis indicated that the most reliable data had been obtained in the above brain regions (Supplementary Table S10).
Compared with HCs, CBF of both T2DM patients and AD patients decreased in the MOG.R (peak MNI coordinate: 44, −74, 26, Z = −3.059, 56 voxels) (Figure 3). The subgroup analysis of T2DM and AD in this brain region showed significant heterogeneity (I2 > 50%), so a random effect model was used for analysis. In subgroup analysis, there was no publication bias in this brain region (Figure 4 and Table 3).
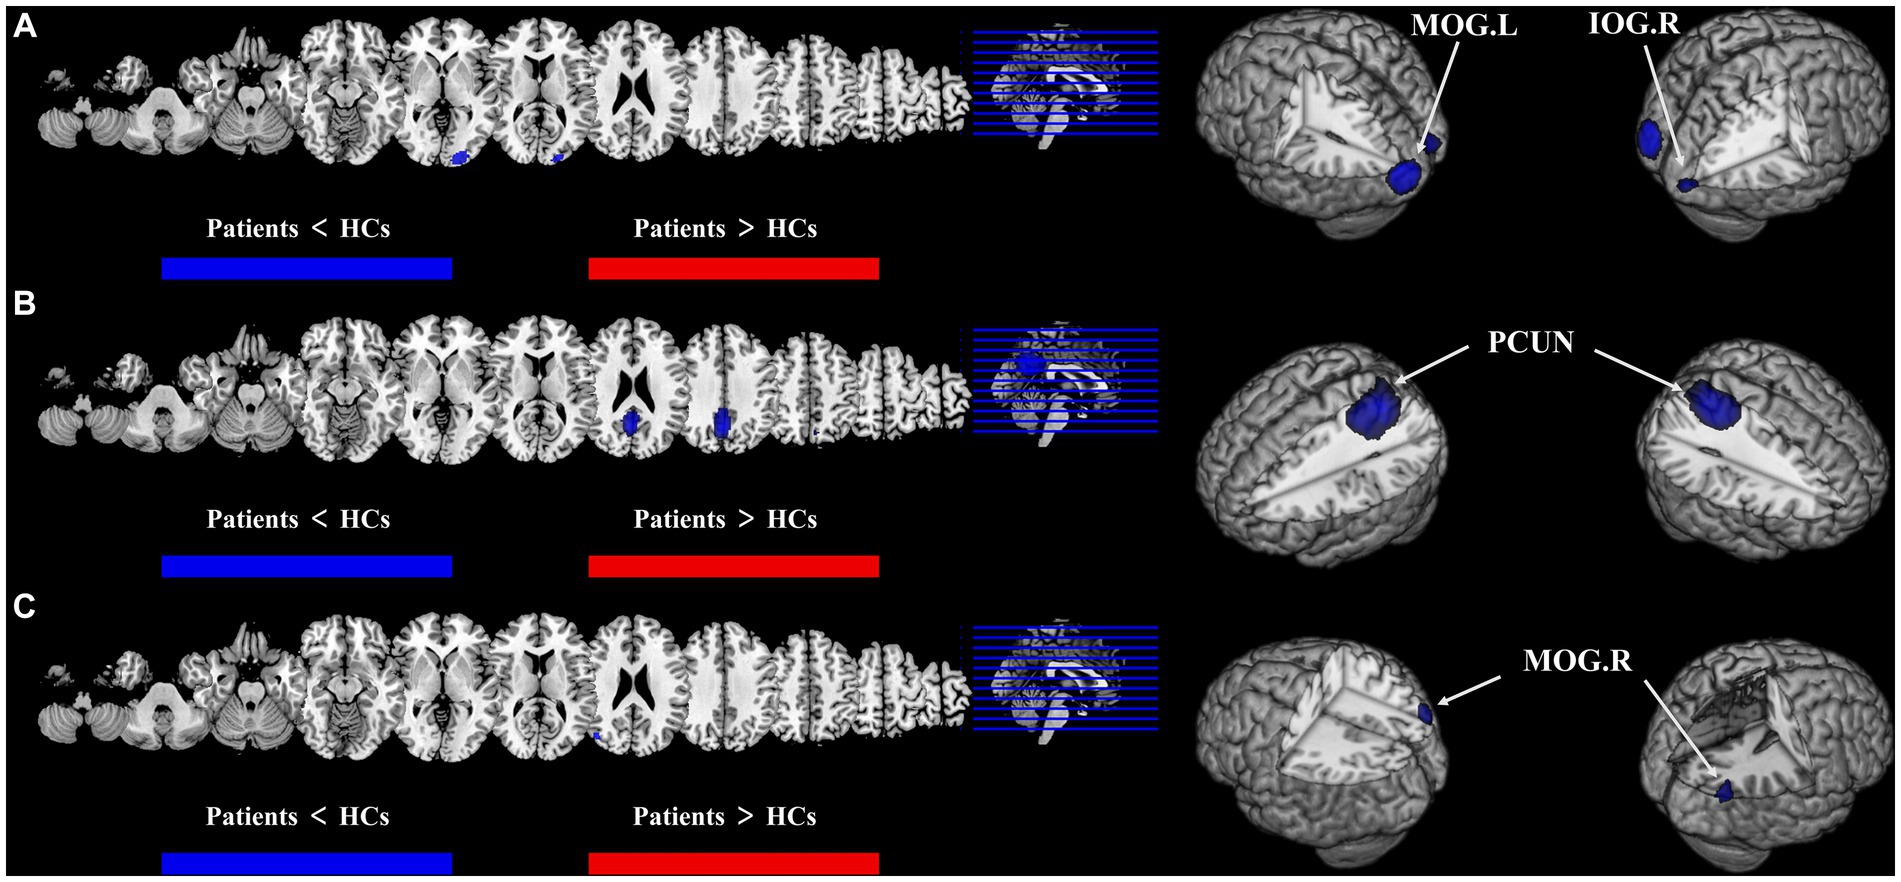
Figure 3. Results of multimodal analysis within a disease and joint analysis between diseases. Results of the meta-analysis (A) both ALFF and CBF decreased in T2DM. (B) Both ALFF and CBF decreased in AD. (C) CBF reduction in both T2DM and AD.
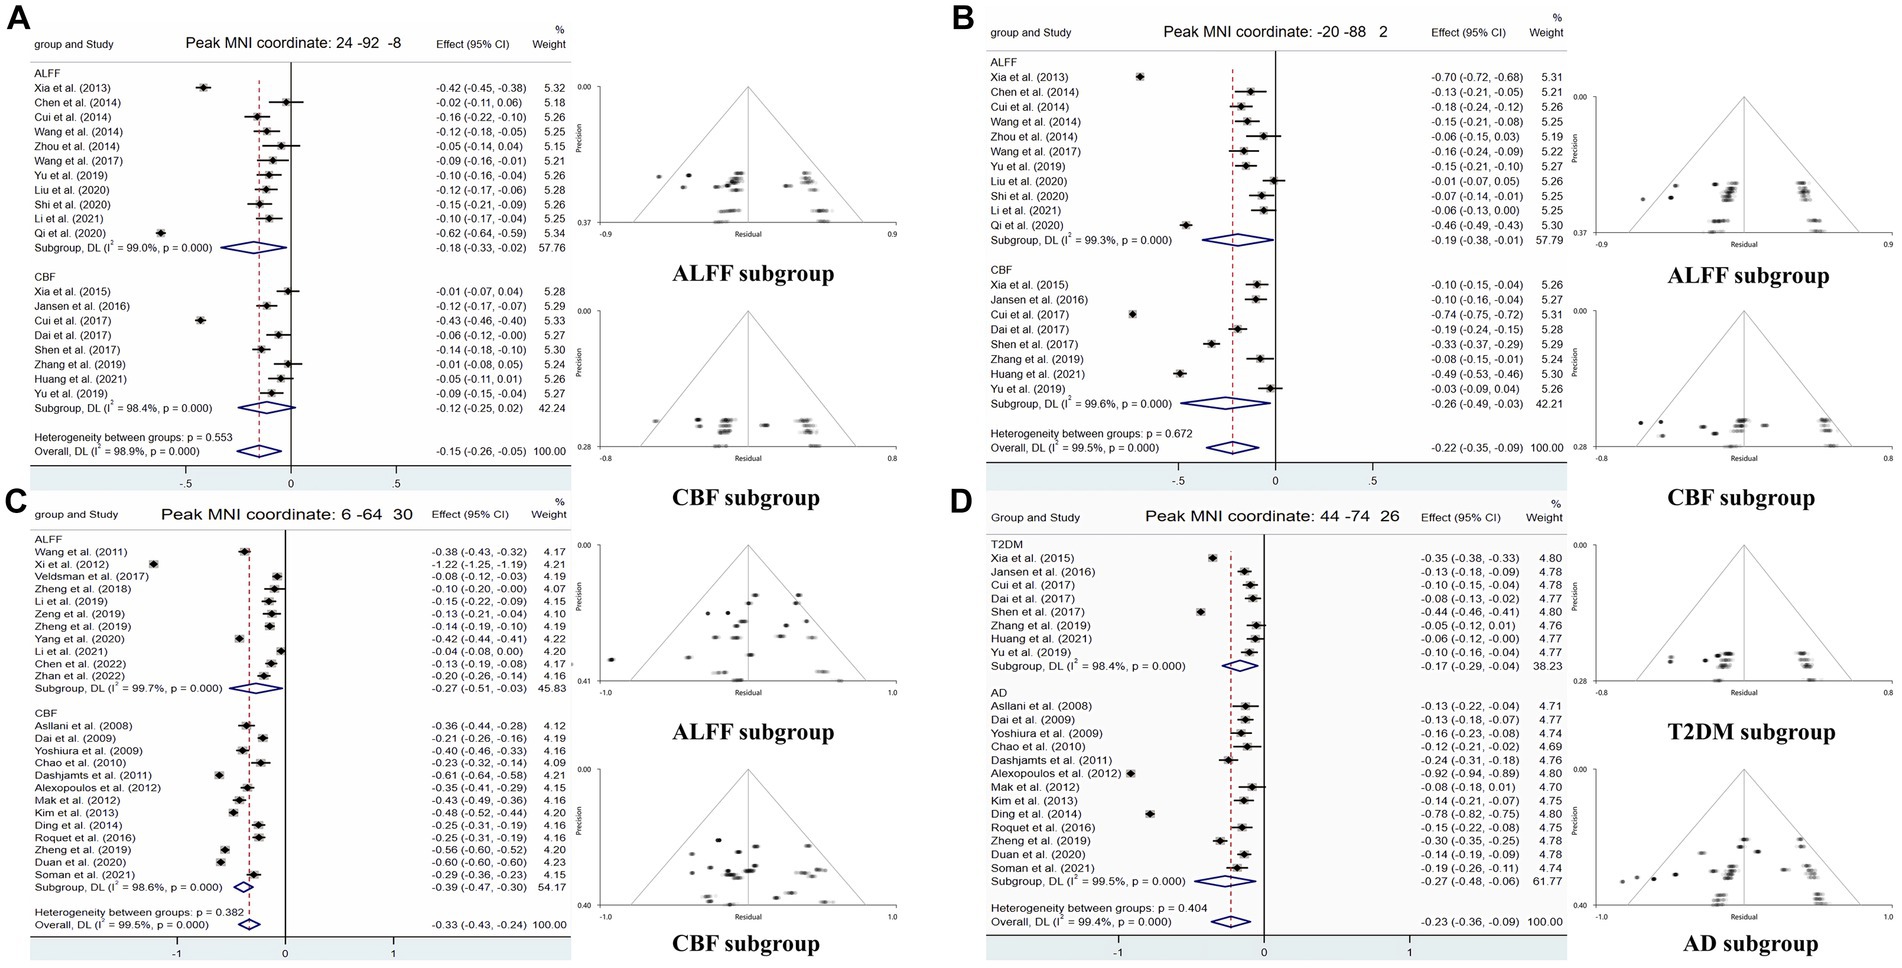
Figure 4. Forest and funnel plots of peak MNI coordinates. Peak MNI coordinate regarding (A,B) both ALFF and CBF decreased in T2DM and subgroup results. (C) Both ALFF and CBF decreased in AD and subgroup results. (D) CBF reduction in both T2DM and AD and subgroup results.
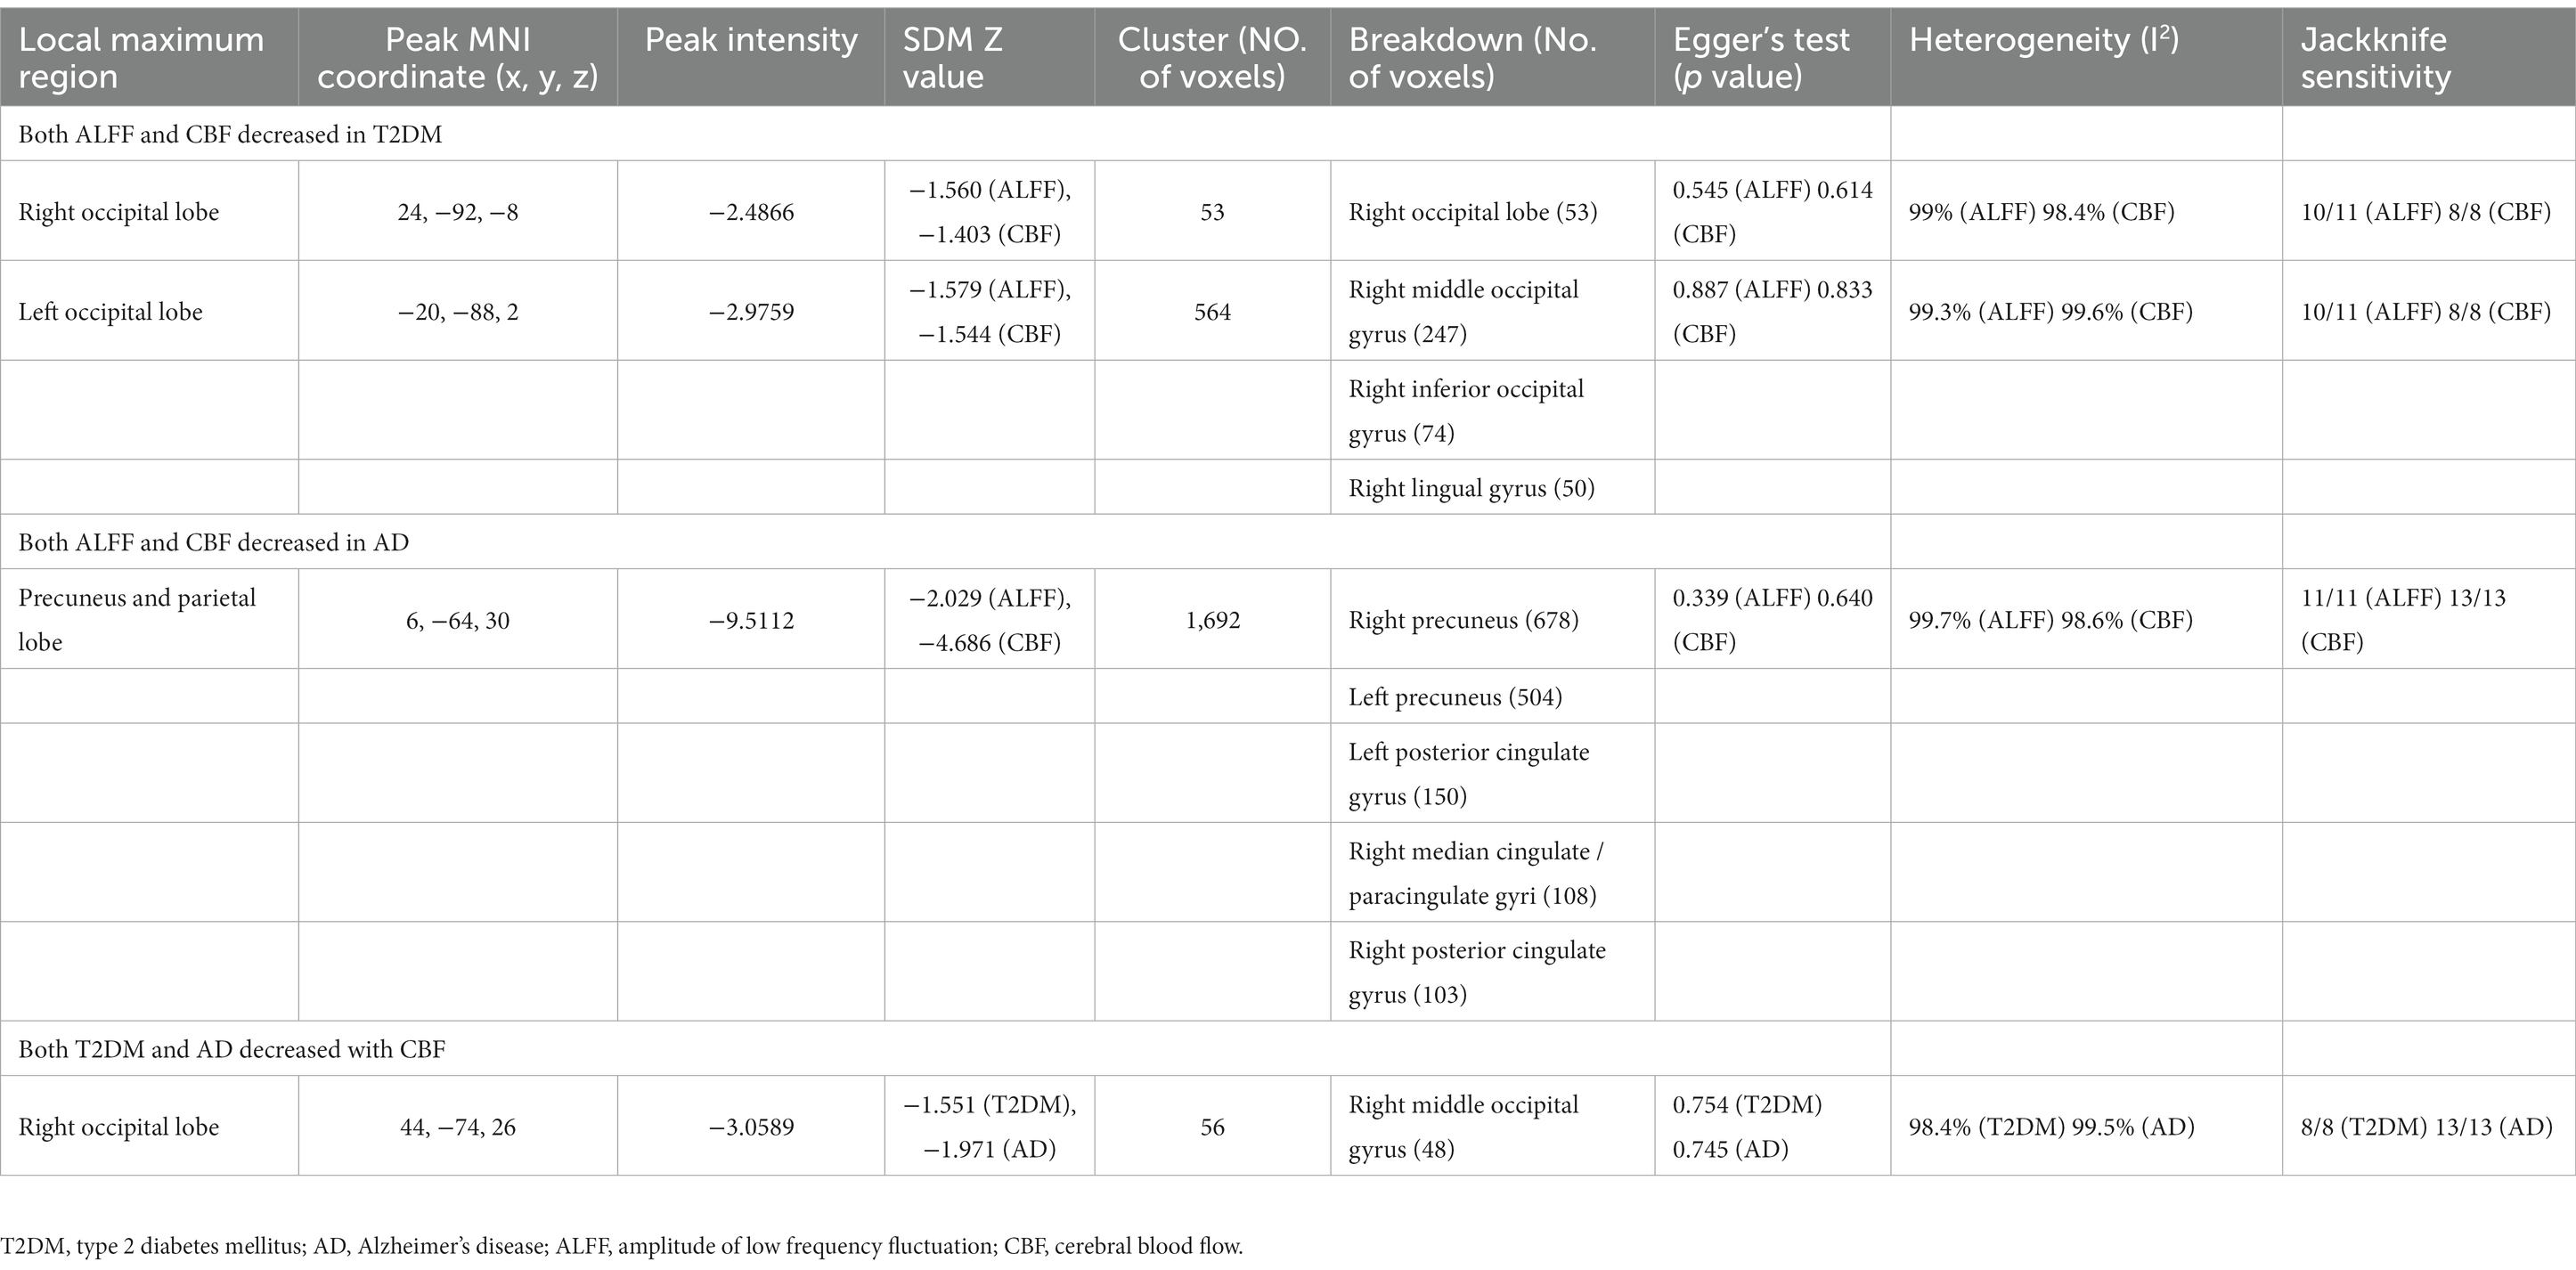
Table 3. Results of multimodal analysis within a disease and combined analysis between diseases.
For T2DM, there were two brain regions where CBF and ALFF decreased together, respectively in right occipital lobe (peak MNI coordinate: 24, −92, −8, Z = −2.487, 53 voxels) and left occipital lobe (peak MNI coordinate: −20, −88, 2, Z = −2.976, 564 voxels) (Figure 3). For AD group, there was a brain region where ALFF and CBF decreased together in bilateral precuneus and parietal lobes (peak MNI coordinate: 6, −64, 30, Z = −9.511, 1,692 voxels) (Figure 3). The subgroup analysis of ALFF and CBF in these brain regions showed significant heterogeneity (I2 > 50%), so a random effect model was used for analysis. In subgroup analysis, there were no publication bias in these brain regions (Figure 4 and Table 3).
In the regression analysis, we excluded the abnormal brain regions outside the main results. Meta regression analysis showed that general demographic statistics (age and gender) had no significant impact on the main results in both T2DM and AD patients, even if there was a difference in the age of patients of AD. However, in T2DM patients, lower MMSE scores were associated with lower ALFF in the left frontal lobe (peak MNI coordinate: −30, −4, 56, Z = 6.432, 115 voxels) and lower CBF in the right parietal lobe (peak MNI coordinate: 38, −36, 44, Z = 4.045, 41 voxels).
In this paper, we conducted a multimodal voxel based meta-analysis of T2DM and AD, and obtained the following results: (1) In T2DM patients, ALFF in the CER and ITG.L as well as CBF in the SMA.R increased, while ALFF in the MOG.L, IOG.R, and preCG.L as well as CBF in the MOG and IPL decreased. (2) In AD patients, ALFF in the CER.R, right striatum and HIP.R increased, while ALFF in the PCUN and STG.R as well as CBF in the PCUN and IPG decreased. (3) During multimodal analysis of ALFF and CBF, it was found that in T2DM patients, there was a simultaneous decrease of neural activity and blood perfusion in the area of both occipital lobes, while in AD patients, there was a simultaneous decrease of neural activity and blood perfusion in the parietal lobe. Except for decreased CBF in MOG. R in both type of patients, there were no common changes in other brain regions between the two diseases. (4) Regression analysis showed that general demographic information had no impact on the main results of the meta-analysis, while the MMSE scores of T2DM had an impact on ALFF in the left frontal lobe and CBF in the right parietal lobe.
The results of this meta-analysis showed that both ALFF and CBF of T2DM in occipital region were significantly reduced. As a key area of the visual cortex, the occipital lobe has decreased blood perfusion and neural activity, which was consistent with the view that visual spatial impairment was one of the main manifestations of T2DM (Cheung et al., 2010; Zeng et al., 2020). The preCG mainly manages the movement of skeletal muscles throughout the body (Li et al., 2015), which is called the motor area. Although the publication bias of this result leads to a decrease in the level of evidence, decreased motor and peripheral sensory abilities in T2DM patients with peripheral neuropathy may be due to a decrease in the neural impulses received by the preCG (Selvarajah et al., 2019), specifically manifested as a decrease in ALFF in T2DM. In addition, the CBF of T2DM reduced in IPG, which played an important role in the integration of human senses and the neural activity of determining the spatial position of objects, as well as in information processing in working memory (Koenigs et al., 2009). Working memory is an important process in brain cognition, especially in higher order cognition (Baddeley, 2003), and cognitive impairment in T2DM patients may be related to it. The regression analysis results of T2DM on MMSE also support this viewpoint.
We found that the ALFF of T2DM increased in CER and ITG.L. The cerebellar hemisphere is closely related to motor learning and coordination (Stoodley and Schmahmann, 2009), and the temporal lobe is related to memory, language fluency, language processing and language production, which are important components of cognitive ability (McCrimmon et al., 2012). Many studies have confirmed that T2DM patients would cause cognitive decline (McCrimmon et al., 2012; Biessels and Despa, 2018). Among the 11 T2DM studies we included in the analysis of ALFF, 6/11 were patients with MCI, 3/11 were patients with normal cognition, and 2/11 did not give cognitive assessment results. Therefore, we considered that the enhanced neural activity in these regions may play a role of compensation or supplement in T2DM patients, so that their cognitive performance can be retained or delayed to a certain extent. In addition, the CBF of T2DM increased in the SMA.R, which played an important role in precise control of motion, especially in fine movements such as finger movements (Tanji and Shima, 1994). Sensory and motor dysfunction caused by peripheral neuropathy complications in T2DM patients may be associated with an increase in CBF in this region (Allen et al., 2016).
This study showed that ALFF and CBF of PCUN, parietal lobe and occipital lobe in AD patients existed a consistent decline. The PCUN and parietal lobe are both the main brain regions that constitute the default pattern network (Bathelt and Geurts, 2021; Yeshurun et al., 2021), and are closely related to cognition (Smallwood et al., 2021). As a core brain region that affects visual spatial ability, the occipital lobe region also exhibits a covariate decrease in ALFF and CBF in AD patients, which may be related to perceptual impairments in visual and spatial abilities that are manifested early in AD patients (Mendez et al., 1990; Binetti et al., 1996; Zeng et al., 2020). In addition, studies have confirmed that normal visual ability had a significant impact on the development and persistence of cognitive ability. The parietal lobe and its adjacent occipital lobe are closely related to the temporal spatial structure function and graphic visual attention function (Sakkalou et al., 2021; Zhao et al., 2021). These changes in brain nerve activity and blood flow were closely related to the clinical manifestations of AD patients, such as acquired and persistent mental disorders, memory and cognitive dysfunction, speech and visual spatial skills disorders, and affected their social activities (Burns and Iliffe, 2009; Liu et al., 2019; Scheltens et al., 2021).
The results also showed that the ALFF of the CER.R, HIP.R and right striatum was higher in AD group than that in HCs, indicating that the neural activity in relevant brain regions was enhanced. The cerebellar hemisphere is closely related to motor learning (Stoodley and Schmahmann, 2009), HIP and striatum are important regions in the memory encoding pathway (Pennartz et al., 2011; Chersi and Burgess, 2015), and their anatomical relationship makes them more closely related. HIP and striatum can guide memory and behavior through cooperation or competition, and can regulate when other pathways in the brain are affected (Poldrack and Packard, 2003; Ghiglieri et al., 2011; Squire and Dede, 2015). The above brain regions are mainly related to learning and memory in cognitive activities. Due to the fact that memory impairment is the most significant clinical manifestation of AD patients (Burns and Iliffe, 2009), the above changes can be seen as a compensatory manifestation after memory related brain nerve activity damage.
After analyzing the brain regions with the same changes in T2DM patients and AD patients, the CBF of the two groups decreased uniformly only in the MOG.R region. As a key area of visual cortex, T2DM patients have visual space disorder and the occurrence of diabetes retinopathy also attributes to this change. The change of visual cortex in AD patients as a mediator, which further leaded to the impairment of advanced cognitive function, was also the focus of researchers.
After analyzing the neuroimaging evidence provided by the results of this study, we tend to believe that T2DM and AD are two diseases with their own characteristics of brain activity damage. The main damage area of T2DM was the bilateral occipital lobe, which mainly affects visual spatial function and other functions extended by visual function impairment. However, AD was mainly injured in bilateral PCUN and partial lobes, including posterior cingulate gyrus, PCUN, parietal lobe and part of occipital lobe, resulting in multi-dimensional functional damage in language, memory, learning, vision, etc. Only a small proportion (56 voxels in total) of MOG.R belonged to a part of the visual cortex were found in these two diseases, which was consistent with the clinical characteristics of them, and also suggested that T2DM was a risk factor for AD.
The reason why AD is considered as type 3 diabetes in some studies is briefly discussed tentatively. The main reason is that T2DM and AD have a high epidemiological correlation (Arvanitakis et al., 2004; Wang et al., 2012). However, as a high-risk factor for cerebrovascular diseases, T2DM can increase the risk of cerebral infarction and cerebral hemorrhage, which has achieved clinical consensus (Kannel and McGee, 1979). And as a complication of T2DM, cerebrovascular disease also has a higher incidence rate among T2DM patients (Gregg et al., 2016). Many clinical studies have shown that the occurrence of cerebrovascular events is significantly correlated with cognitive impairment and dementia (Vermeer et al., 2007; Troncoso et al., 2008; Rost et al., 2022). This correlation may help explain the epidemiological correlation between T2DM and AD (Sutherland et al., 2017). Researchers believe that another main reason why AD should be called type 3 diabetes is that T2DM and AD have many common pathophysiological bases, such as central insulin resistance (Janson et al., 2004; De Felice et al., 2022), AGEs and metabolic syndrome (Byun et al., 2017; Więckowska-Gacek et al., 2021). Firstly, lipid metabolism is an important component of metabolic syndrome. There is metabolic syndrome caused by insulin resistance in T2DM (Zheng et al., 2018), and autopsy findings of lipid particles in the brain of AD patients have also led researchers to suspect that lipid metabolism is involved in the pathogenesis of AD (Foley, 2010). In subsequent studies, it was found that sulfatides, an important subtype of sphingolipids, may play an important role in the pathogenesis of AD. Sulfatides are an important part of the myelin sheath and oligodendrocytes (Takahashi and Suzuki, 2012), and their consumption in AD patients is as high as 93% (Han et al., 2002). This change is a specific change of AD, but the pathogenesis of AD is more complex and still under study (Han, 2010; Cheng et al., 2013), and there is no clear evidence to confirm its correlation with abnormal lipid metabolism in diabetes. Secondly, in the past, there have been many studies on hyperglycemia leading to tissue damage through the production of AGEs, altering cell activation functions, and resulting in cognitive impairment (Klein and Waxman, 2003; Brownlee, 2005; Byun et al., 2017), but most of them are based on basic experiments (Batkulwar et al., 2018; Volpina et al., 2021). The impact of these findings on the human body is uncertain, and more evidence is needed to confirm whether this theory has a comorbidity pathway in T2DM and AD. Finally, there is increasing evidence that insulin resistance, especially central insulin resistance is related to the pathogenesis of AD (Janson et al., 2004; Neth and Craft, 2017; De Felice et al., 2022). Intranasal injection of insulin can alleviate memory deficits in some AD patients (Novak et al., 2014; Craft et al., 2017). However, the mechanism of insulin resistance on cognitive impairment in the brain is still unclear. The above results confirm that T2DM and AD are two closely related diseases, but it is still too early to call AD type 3 diabetes. In comparison, T2DM is a more appropriate high-risk factor for AD, and the relationship between the two diseases still needs further research.
It should be noted that the following limitations still exist in this study. Firstly, all the literature was cross-sectional and lacked longitudinal tracking of disease progression. Secondly, this study conducted a meta-analysis based on the reported coordinates provided by the article or the corresponding author. Research results that do not provide coordinates are not included, which may cause bias. Thirdly, lack of sufficient data to correct the differences in data processing and the gray matter volume of subjects in the original study (Supplementary Tables S2, S3), which may potentially contribute to the high heterogeneity of our results. Fourthly, because most articles in the AD group did not provide the comorbidity of AD and T2DM, more detailed subgroup analysis cannot be performed. In the future, it is necessary to update the meta-analysis to eliminate the confounding factors of comorbidity and make the level of evidence higher. Fifthly, the population included in the study is mainly concentrated in the East Asian population, resulting in limited universality of the research results. Finally, it was hoped that in future studies, a larger sample of meta-analysis would be conducted, and attention will be paid to longitudinal studies from T2DM to T2DM with AD. Provide more core evidence for the occurrence and mechanism of comorbidity of the two diseases.
In summary, after analyzing the evidence provided by neuroimaging, T2DM and AD are two diseases with their own characteristics of brain neural activity and blood flow changes. Even if there is a small common area of reduced blood flow in both diseases, this is consistent with the clinical characteristics of both diseases and suggests a close relationship between the two diseases. This provided an idea for us to study the brain damage and the relationship between these two diseases in the future, and provided new insights for understanding the pathophysiology of brain changes in these two diseases and developing effective early intervention methods.
HX: Data curation, Formal analysis, Investigation, Methodology, Software, Visualization, Writing – original draft, Writing – review & editing. YYu: Funding acquisition, Supervision, Validation, Software, Writing – original draft. YYa: Conceptualization, Methodology, Software, Validation, Writing – original draft. QS: Data curation, Validation, Writing – original draft. Z-YL: Conceptualization, Funding acquisition, Resources, Supervision, Validation, Writing – original draft. M-HN: Methodology, Project administration, Software, Writing – original draft. S-NL: Data curation, Software, Writing – original draft. PD: Data curation, Formal analysis, Writing – original draft. Y-YC: Software, Writing – original draft. X-YC: Software, Writing – original draft. NJ: Data curation, Methodology, Writing – original draft. L-JD: Supervision, Validation, Writing – original draft. WG: Data curation, Writing – original draft. J-JB: Software, Writing – original draft. L-FY: Resources, Software, Visualization, Writing – original draft, Writing – review & editing. G-BC: Conceptualization, Funding acquisition, Resources, Supervision, Validation, Writing – review & editing.
The author(s) declare financial support was received for the research, authorship, and/or publication of this article. This work was supported by the Key Research and Development Projects of Shaanxi (Grant number 2023-YBSF-331) and “Rapid response” research project of Air Force Military Medical University (Grant number 2023KXKT025).
The authors wish to thank the Neurology Department and Endocrinology Department of Tangdu Hospital for providing advice and guidance in support of this study.
The authors declare that the research was conducted in the absence of any commercial or financial relationships that could be construed as a potential conflict of interest.
All claims expressed in this article are solely those of the authors and do not necessarily represent those of their affiliated organizations, or those of the publisher, the editors and the reviewers. Any product that may be evaluated in this article, or claim that may be made by its manufacturer, is not guaranteed or endorsed by the publisher.
The Supplementary material for this article can be found online at: https://www.frontiersin.org/articles/10.3389/fnins.2023.1301778/full#supplementary-material
Allen, M. D., Doherty, T. J., Rice, C. L., and Kimpinski, K. (2016). Physiology in medicine: neuromuscular consequences of diabetic neuropathy. J. Appl. Physiol. 121, 1–6. doi: 10.1152/japplphysiol.00733.2015
Alzheimer’s Association (2021). 2021 Alzheimer’s disease facts and figures. Alzheimers Dement. 17, 327–406. doi: 10.1002/alz.12328
Arvanitakis, Z., Wilson, R. S., Bienias, J. L., Evans, D. A., and Bennett, D. A. (2004). Diabetes mellitus and risk of Alzheimer disease and decline in cognitive function. Arch. Neurol. 61, 661–666. doi: 10.1001/archneur.61.5.661
Baddeley, A. (2003). Working memory: looking back and looking forward. Nat. Rev. Neurosci. 4, 829–839. doi: 10.1038/nrn1201
Ballard, C., Gauthier, S., Corbett, A., Brayne, C., Aarsland, D., and Jones, E. (2011). Alzheimer's disease. Lancet 377, 1019–1031. doi: 10.1016/S0140-6736(10)61349-9
Barona, M., Brown, M., Clark, C., Frangou, S., White, T., and Micali, N. (2019). White matter alterations in anorexia nervosa: evidence from a voxel-based meta-analysis. Neurosci. Biobehav. Rev. 100, 285–295. doi: 10.1016/j.neubiorev.2019.03.002
Bathelt, J., and Geurts, H. M. (2021). Difference in default mode network subsystems in autism across childhood and adolescence. Autism 25, 556–565. doi: 10.1177/1362361320969258
Batkulwar, K., Godbole, R., Banarjee, R., Kassaar, O., Williams, R. J., and Kulkarni, M. J. (2018). Advanced glycation end products modulate amyloidogenic APP processing and tau phosphorylation: a mechanistic link between glycation and the development of Alzheimer's disease. ACS Chem. Neurosci. 9, 988–1000. doi: 10.1021/acschemneuro.7b00410
Benwell, C. S. Y., Davila-Pérez, P., Fried, P. J., Jones, R. N., Travison, T. G., Santarnecchi, E., et al. (2020). EEG spectral power abnormalities and their relationship with cognitive dysfunction in patients with Alzheimer's disease and type 2 diabetes. Neurobiol. Aging 85, 83–95. doi: 10.1016/j.neurobiolaging.2019.10.004
Biessels, G. J., and Despa, F. (2018). Cognitive decline and dementia in diabetes mellitus: mechanisms and clinical implications. Nat. Rev. Endocrinol. 14, 591–604. doi: 10.1038/s41574-018-0048-7
Binetti, G., Cappa, S. F., Magni, E., Padovani, A., Bianchetti, A., and Trabucchi, M. (1996). Disorders of visual and spatial perception in the early stage of Alzheimer's disease. Ann. N. Y. Acad. Sci. 777, 221–225. doi: 10.1111/j.1749-6632.1996.tb34422.x
Brownlee, M. (2005). The pathobiology of diabetic complications: a unifying mechanism. Diabetes 54, 1615–1625. doi: 10.2337/diabetes.54.6.1615
Brundel, M., Kappelle, L. J., and Biessels, G. J. (2014). Brain imaging in type 2 diabetes. Eur. Neuropsychopharmacol. 24, 1967–1981. doi: 10.1016/j.euroneuro.2014.01.023
Bruno, G., Runzo, C., Cavallo-Perin, P., Merletti, F., Rivetti, M., Pinach, S., et al. (2005). Incidence of type 1 and type 2 diabetes in adults aged 30-49 years: the population-based registry in the province of Turin, Italy. Diabetes Care 28, 2613–2619. doi: 10.2337/diacare.28.11.2613
Bucerius, J., Mani, V., Moncrieff, C., Rudd, J. H. F., Machac, J., Fuster, V., et al. (2012). Impact of noninsulin-dependent type 2 diabetes on carotid wall 18F-fluorodeoxyglucose positron emission tomography uptake. J. Am. Coll. Cardiol. 59, 2080–2088. doi: 10.1016/j.jacc.2011.11.069
Byun, K., Yoo, Y., Son, M., Lee, J., Jeong, G. B., Park, Y. M., et al. (2017). Advanced glycation end-products produced systemically and by macrophages: a common contributor to inflammation and degenerative diseases. Pharmacol. Ther. 177, 44–55. doi: 10.1016/j.pharmthera.2017.02.030
Chen, Z., and Zhong, C. (2013). Decoding Alzheimer's disease from perturbed cerebral glucose metabolism: implications for diagnostic and therapeutic strategies. Prog. Neurobiol. 108, 21–43. doi: 10.1016/j.pneurobio.2013.06.004
Cheng, H., Wang, M., Li, J. L., Cairns, N. J., and Han, X. (2013). Specific changes of sulfatide levels in individuals with pre-clinical Alzheimer's disease: an early event in disease pathogenesis. J. Neurochem. 127, 733–738. doi: 10.1111/jnc.12368
Chersi, F., and Burgess, N. (2015). The cognitive architecture of spatial navigation: hippocampal and striatal contributions. Neuron 88, 64–77. doi: 10.1016/j.neuron.2015.09.021
Cheung, N., Mitchell, P., and Wong, T. Y. (2010). Diabetic retinopathy. Lancet 376, 124–136. doi: 10.1016/S0140-6736(09)62124-3
Chornenkyy, Y., Wang, W. X., Wei, A., and Nelson, P. T. (2019). Alzheimer's disease and type 2 diabetes mellitus are distinct diseases with potential overlapping metabolic dysfunction upstream of observed cognitive decline. Brain Pathol. 29, 3–17. doi: 10.1111/bpa.12655
Craft, S., Claxton, A., Baker, L. D., Hanson, A. J., Cholerton, B., Trittschuh, E. H., et al. (2017). Effects of regular and Long-acting insulin on cognition and Alzheimer's disease biomarkers: a pilot clinical trial. J. Alzheimers Dis. 57, 1325–1334. doi: 10.3233/JAD-161256
De Felice, F. G., Goncalves, R. A., and Ferreira, S. T. (2022). Impaired insulin signalling and allostatic load in Alzheimer disease. Nat. Rev. Neurosci. 23, 215–230. doi: 10.1038/s41583-022-00558-9
de la Monte, S. M., Tong, M., and Wands, J. R. (2018). The 20-year voyage aboard the journal of Alzheimer's disease: docking at 'Type 3 Diabetes', environmental/exposure factors, pathogenic mechanisms, and potential treatments. J. Alzheimers Dis. 62, 1381–1390. doi: 10.3233/JAD-170829
Diehl, T., Mullins, R., and Kapogiannis, D. (2017). Insulin resistance in Alzheimer's disease. Transl. Res. 183, 26–40. doi: 10.1016/j.trsl.2016.12.005
Diniz Pereira, J., Gomes Fraga, V., Morais Santos, A. L., Carvalho, M. G., Caramelli, P., and Braga Gomes, K. (2021). Alzheimer's disease and type 2 diabetes mellitus: a systematic review of proteomic studies. J. Neurochem. 156, 753–776. doi: 10.1111/jnc.15166
Egger, M., Smith, G. D., Schneider, M., and Minder, C. (1997). Bias in meta-analysis detected by a simple, graphical test. BMJ 315, 629–634. doi: 10.1136/bmj.315.7109.629
Exalto, L. G., Biessels, G. J., Karter, A. J., Huang, E. S., Katon, W. J., Minkoff, J. R., et al. (2013). Risk score for prediction of 10 year dementia risk in individuals with type 2 diabetes: a cohort study. Lancet Diabetes Endocrinol. 1, 183–190. doi: 10.1016/S2213-8587(13)70048-2
Ferreira, L. K., and Busatto, G. F. (2010). Heterogeneity of coordinate-based meta-analyses of neuroimaging data: an example from studies in OCD. Br. J. Psychiatry 197, 76–77; author reply 77. doi: 10.1192/bjp.197.1.76a
Foley, P. (2010). Lipids in Alzheimer's disease: a century-old story. Biochim. Biophys. Acta 1801, 750–753. doi: 10.1016/j.bbalip.2010.05.004
Geijselaers, S. L. C., Sep, S. J. S., Stehouwer, C. D. A., and Biessels, G. J. (2015). Glucose regulation, cognition, and brain MRI in type 2 diabetes: a systematic review. Lancet Diabetes Endocrinol. 3, 75–89. doi: 10.1016/S2213-8587(14)70148-2
Ghiglieri, V., Sgobio, C., Costa, C., Picconi, B., and Calabresi, P. (2011). Striatum-hippocampus balance: from physiological behavior to interneuronal pathology. Prog. Neurobiol. 94, 102–114. doi: 10.1016/j.pneurobio.2011.04.005
Gregg, E. W., Sattar, N., and Ali, M. K. (2016). The changing face of diabetes complications. Lancet Diabetes Endocrinol. 4, 537–547. doi: 10.1016/S2213-8587(16)30010-9
Han, X. (2010). The pathogenic implication of abnormal interaction between apolipoprotein E isoforms, amyloid-beta peptides, and sulfatides in Alzheimer's disease. Mol. Neurobiol. 41, 97–106. doi: 10.1007/s12035-009-8092-x
Han, X., M Holtzman, D., McKeel, D. W. Jr., Kelley, J., and Morris, J. C. (2002). Substantial sulfatide deficiency and ceramide elevation in very early Alzheimer's disease: potential role in disease pathogenesis. J. Neurochem. 82, 809–818. doi: 10.1046/j.1471-4159.2002.00997.x
Holman, N., Young, B., and Gadsby, R. (2015). Current prevalence of type 1 and type 2 diabetes in adults and children in the UK. Diabet. Med. 32, 1119–1120. doi: 10.1111/dme.12791
Hu, B., Yan, L. F., Sun, Q., Yu, Y., Zhang, J., Dai, Y. J., et al. (2019). Disturbed neurovascular coupling in type 2 diabetes mellitus patients: evidence from a comprehensive fMRI analysis. Neuroimage Clin. 22:101802. doi: 10.1016/j.nicl.2019.101802
Janson, J., Laedtke, T., Parisi, J. E., O’Brien, P., Petersen, R. C., and Butler, P. C. (2004). Increased risk of type 2 diabetes in Alzheimer disease. Diabetes 53, 474–481. doi: 10.2337/diabetes.53.2.474
Kannel, W. B., and McGee, D. L. (1979). Diabetes and cardiovascular disease. The Framingham study. JAMA 241, 2035–2038. doi: 10.1001/jama.1979.03290450033020
Kannurpatti, S. S., Biswal, B. B., Kim, Y. R., and Rosen, B. R. (2008). Spatio-temporal characteristics of low-frequency BOLD signal fluctuations in isoflurane-anesthetized rat brain. Neuroimage 40, 1738–1747. doi: 10.1016/j.neuroimage.2007.05.061
Kautzky-Willer, A., Harreiter, J., and Pacini, G. (2016). Sex and gender differences in risk, pathophysiology and complications of type 2 diabetes mellitus. Endocr. Rev. 37, 278–316. doi: 10.1210/er.2015-1137
Kellar, D., and Craft, S. (2020). Brain insulin resistance in Alzheimer's disease and related disorders: mechanisms and therapeutic approaches. Lancet Neurol. 19, 758–766. doi: 10.1016/S1474-4422(20)30231-3
Kim, S.-G., and Lee, S.-P. (2004). Cortical layer-dependent CBF changes induced by neural activity. Int. Congr. Ser. 1265, 201–210. doi: 10.1016/j.ics.2004.04.024
Klein, J. P., and Waxman, S. G. (2003). The brain in diabetes: molecular changes in neurons and their implications for end-organ damage. Lancet Neurol. 2, 548–554. doi: 10.1016/S1474-4422(03)00503-9
Koenigs, M., Barbey, A. K., Postle, B. R., and Grafman, J. (2009). Superior parietal cortex is critical for the manipulation of information in working memory. J. Neurosci. 29, 14980–14986. doi: 10.1523/JNEUROSCI.3706-09.2009
Kubis-Kubiak, A. M., Rorbach-Dolata, A., and Piwowar, A. (2019). Crucial players in Alzheimer's disease and diabetes mellitus: friends or foes? Mech. Ageing Dev. 181, 7–21. doi: 10.1016/j.mad.2019.03.008
Li, N., Chen, T. W., Guo, Z. V., Gerfen, C. R., and Svoboda, K. (2015). A motor cortex circuit for motor planning and movement. Nature 519, 51–56. doi: 10.1038/nature14178
Li, L., Zhang, Y., Zhao, Y., Li, Z., Kemp, G. J., Wu, M., et al. (2022). Cortical thickness abnormalities in patients with post-traumatic stress disorder: a vertex-based meta-analysis. Neurosci. Biobehav. Rev. 134:104519. doi: 10.1016/j.neubiorev.2021.104519
Liu, P. P., Xie, Y., Meng, X. Y., and Kang, J. S. (2019). History and progress of hypotheses and clinical trials for Alzheimer's disease. Signal Transduct. Target. Ther. 4:29. doi: 10.1038/s41392-019-0063-8
Liu, J., Yang, X., Li, Y., Xu, H., Ren, J., and Zhou, P. (2022). Cerebral blood flow alterations in type 2 diabetes mellitus: a systematic review and meta-analysis of arterial spin labeling studies. Front. Aging Neurosci. 14:847218. doi: 10.3389/fnagi.2022.847218
Ma, L. L., Wang, Y. Y., Yang, Z. H., Huang, D., Weng, H., and Zeng, X. T. (2020). Methodological quality (risk of bias) assessment tools for primary and secondary medical studies: what are they and which is better? Mil. Med. Res. 7:7. doi: 10.1186/s40779-020-00238-8
Macpherson, H., Formica, M., Harris, E., and Daly, R. M. (2017). Brain functional alterations in type 2 diabetes - a systematic review of fMRI studies. Front. Neuroendocrinol. 47, 34–46. doi: 10.1016/j.yfrne.2017.07.001
Matsuda, H. (2016). MRI morphometry in Alzheimer's disease. Ageing Res. Rev. 30, 17–24. doi: 10.1016/j.arr.2016.01.003
McCrimmon, R. J., Ryan, C. M., and Frier, B. M. (2012). Diabetes and cognitive dysfunction. Lancet 379, 2291–2299. doi: 10.1016/S0140-6736(12)60360-2
Mendez, M. F., Tomsak, R. L., and Remler, B. (1990). Disorders of the visual system in Alzheimer's disease. J. Clin. Neuroophthalmol. 10, 62–69.
Moran, C., Beare, R., Phan, T. G., Bruce, D. G., Callisaya, M. L., Srikanth, V., et al. (2015). Type 2 diabetes mellitus and biomarkers of neurodegeneration. Neurology 85, 1123–1130. doi: 10.1212/WNL.0000000000001982
Müller, V. I., Cieslik, E. C., Laird, A. R., Fox, P. T., Radua, J., Mataix-Cols, D., et al. (2018). Ten simple rules for neuroimaging meta-analysis. Neurosci. Biobehav. Rev. 84, 151–161. doi: 10.1016/j.neubiorev.2017.11.012
Neth, B. J., and Craft, S. (2017). Insulin resistance and Alzheimer's disease: bioenergetic linkages. Front. Aging Neurosci. 9:345. doi: 10.3389/fnagi.2017.00345
Nguyen, T. T., Ta, Q. T. H., Nguyen, T. K. O., Nguyen, T. T. D., and van Giau, V. (2020). Type 3 diabetes and its role implications in Alzheimer's disease. Int. J. Mol. Sci. 21:3165. doi: 10.3390/ijms21093165
Novak, V., Milberg, W., Hao, Y., Munshi, M., Novak, P., Galica, A., et al. (2014). Enhancement of vasoreactivity and cognition by intranasal insulin in type 2 diabetes. Diabetes Care 37, 751–759. doi: 10.2337/dc13-1672
Page, M. J., McKenzie, J. E., Bossuyt, P. M., Boutron, I., Hoffmann, T. C., Mulrow, C. D., et al. (2021). The PRISMA 2020 statement: an updated guideline for reporting systematic reviews. BMJ 372:n71. doi: 10.1136/bmj.n71
Pan, P., Zhu, L., Yu, T., Shi, H. C., Zhang, B., Qin, R., et al. (2017). Aberrant spontaneous low-frequency brain activity in amnestic mild cognitive impairment: a meta-analysis of resting-state fMRI studies. Ageing Res. Rev. 35, 12–21. doi: 10.1016/j.arr.2016.12.001
Pennartz, C. M., Ito, R., Verschure, P. F., Battaglia, F. P., and Robbins, T. W. (2011). The hippocampal-striatal axis in learning, prediction and goal-directed behavior. Trends Neurosci. 34, 548–559. doi: 10.1016/j.tins.2011.08.001
Poldrack, R. A., and Packard, M. G. (2003). Competition among multiple memory systems: converging evidence from animal and human brain studies. Neuropsychologia 41, 245–251. doi: 10.1016/S0028-3932(02)00157-4
Radua, J., and Mataix-Cols, D. (2009). Voxel-wise meta-analysis of grey matter changes in obsessive-compulsive disorder. Br. J. Psychiatry 195, 393–402. doi: 10.1192/bjp.bp.108.055046
Radua, J., and Mataix-Cols, D. (2012). Meta-analytic methods for neuroimaging data explained. Biol Mood Anxiety Disord. 2:6. doi: 10.1186/2045-5380-2-6
Radua, J., Mataix-Cols, D., Phillips, M. L., el-Hage, W., Kronhaus, D. M., Cardoner, N., et al. (2012). A new meta-analytic method for neuroimaging studies that combines reported peak coordinates and statistical parametric maps. Eur. Psychiatry 27, 605–611. doi: 10.1016/j.eurpsy.2011.04.001
Radua, J., Rubia, K., Canales-Rodríguez, E. J., Pomarol-Clotet, E., Fusar-Poli, P., and Mataix-Cols, D. (2014). Anisotropic kernels for coordinate-based meta-analyses of neuroimaging studies. Front. Psych. 5:13. doi: 10.3389/fpsyt.2014.00013
Rost, N. S., Brodtmann, A., Pase, M. P., van Veluw, S. J., Biffi, A., Duering, M., et al. (2022). Post-stroke cognitive impairment and dementia. Circ. Res. 130, 1252–1271. doi: 10.1161/CIRCRESAHA.122.319951
Saeedi, P., Petersohn, I., Salpea, P., Malanda, B., Karuranga, S., Unwin, N., et al. (2019). Global and regional diabetes prevalence estimates for 2019 and projections for 2030 and 2045: results from the international diabetes federation diabetes atlas, 9(th) edition. Diabetes Res. Clin. Pract. 157:107843. doi: 10.1016/j.diabres.2019.107843
Sakkalou, E., O’Reilly, M. A., Sakki, H., Springall, C., de Haan, M., Salt, A. T., et al. (2021). Mother-infant interactions with infants with congenital visual impairment and associations with longitudinal outcomes in cognition and language. J. Child Psychol. Psychiatry 62, 742–750. doi: 10.1111/jcpp.13308
Scheltens, P., de Strooper, B., Kivipelto, M., Holstege, H., Chételat, G., Teunissen, C. E., et al. (2021). Alzheimer's disease. Lancet 397, 1577–1590. doi: 10.1016/S0140-6736(20)32205-4
Selvarajah, D., Kar, D., Khunti, K., Davies, M. J., Scott, A. R., Walker, J., et al. (2019). Diabetic peripheral neuropathy: advances in diagnosis and strategies for screening and early intervention. Lancet Diabetes Endocrinol. 7, 938–948. doi: 10.1016/S2213-8587(19)30081-6
Smallwood, J., Bernhardt, B. C., Leech, R., Bzdok, D., Jefferies, E., and Margulies, D. S. (2021). The default mode network in cognition: a topographical perspective. Nat. Rev. Neurosci. 22, 503–513. doi: 10.1038/s41583-021-00474-4
Squire, L. R., and Dede, A. J. (2015). Conscious and unconscious memory systems. Cold Spring Harb. Perspect. Biol. 7:a021667. doi: 10.1101/cshperspect.a021667
Sterne, J. A., Sutton, A. J., Ioannidis, J. P., Terrin, N., Jones, D. R., Lau, J., et al. (2011). Recommendations for examining and interpreting funnel plot asymmetry in meta-analyses of randomised controlled trials. BMJ 343:d4002. doi: 10.1136/bmj.d4002
Stoodley, C. J., and Schmahmann, J. D. (2009). Functional topography in the human cerebellum: a meta-analysis of neuroimaging studies. NeuroImage 44, 489–501. doi: 10.1016/j.neuroimage.2008.08.039
Sutherland, G. T., Lim, J., Srikanth, V., and Bruce, D. G. (2017). Epidemiological approaches to understanding the link between type 2 diabetes and dementia. J. Alzheimers Dis. 59, 393–403. doi: 10.3233/JAD-161194
Tak, S., Wang, D. J., Polimeni, J. R., Yan, L., and Chen, J. J. (2014). Dynamic and static contributions of the cerebrovasculature to the resting-state BOLD signal. Neuroimage 84, 672–680. doi: 10.1016/j.neuroimage.2013.09.057
Takahashi, T., and Suzuki, T. (2012). Role of sulfatide in normal and pathological cells and tissues. J. Lipid Res. 53, 1437–1450. doi: 10.1194/jlr.R026682
Tanji, J., and Shima, K. (1994). Role for supplementary motor area cells in planning several movements ahead. Nature 371, 413–416. doi: 10.1038/371413a0
Troncoso, J. C., Zonderman, A. B., Resnick, S. M., Crain, B., Pletnikova, O., and O'Brien, R. J. (2008). Effect of infarcts on dementia in the Baltimore longitudinal study of aging. Ann. Neurol. 64, 168–176. doi: 10.1002/ana.21413
Vermeer, S. E., Longstreth, W. T. Jr., and Koudstaal, P. J. (2007). Silent brain infarcts: a systematic review. Lancet Neurol. 6, 611–619. doi: 10.1016/S1474-4422(07)70170-9
Volpina, O. M., Koroev, D. O., Serebryakova, M. V., Volkova, T. D., Kamynina, A. V., and Bobkova, N. V. (2021). Proteolytic degradation patterns of the receptor for advanced glycation end products peptide fragments correlate with their neuroprotective activity in Alzheimer's disease models. Drug Dev. Res. 82, 1217–1226. doi: 10.1002/ddr.21836
Wang, K. C., Woung, L. C., Tsai, M. T., Liu, C. C., Su, Y. H., and Li, C. Y. (2012). Risk of Alzheimer’s disease in relation to diabetes: a population-based cohort study. Neuroepidemiology 38, 237–244. doi: 10.1159/000337428
Więckowska-Gacek, A., Mietelska-Porowska, A., Wydrych, M., and Wojda, U. (2021). Western diet as a trigger of Alzheimer's disease: from metabolic syndrome and systemic inflammation to neuroinflammation and neurodegeneration. Ageing Res. Rev. 70:101397. doi: 10.1016/j.arr.2021.101397
Williams, D. S., Detre, J. A., Leigh, J. S., and Koretsky, A. P. (1992). Magnetic resonance imaging of perfusion using spin inversion of arterial water. Proc. Natl. Acad. Sci. U. S. A. 89, 212–216. doi: 10.1073/pnas.89.1.212
Yao, L., Yang, C., Zhang, W., Li, S., Li, Q., Chen, L., et al. (2021). A multimodal meta-analysis of regional structural and functional brain alterations in type 2 diabetes. Front. Neuroendocrinol. 62:100915. doi: 10.1016/j.yfrne.2021.100915
Yeshurun, Y., Nguyen, M., and Hasson, U. (2021). The default mode network: where the idiosyncratic self meets the shared social world. Nat. Rev. Neurosci. 22, 181–192. doi: 10.1038/s41583-020-00420-w
Yu, Y., Yan, L. F., Sun, Q., Hu, B., Zhang, J., Yang, Y., et al. (2019). Neurovascular decoupling in type 2 diabetes mellitus without mild cognitive impairment: potential biomarker for early cognitive impairment. Neuroimage 200, 644–658. doi: 10.1016/j.neuroimage.2019.06.058
Yu-Feng, Z., Yong, H., Chao-Zhe, Z., Qing-Jiu, C., Man-Qiu, S., Meng, L., et al. (2007). Altered baseline brain activity in children with ADHD revealed by resting-state functional MRI. Brain and Development 29, 83–91. doi: 10.1016/j.braindev.2006.07.002
Zeng, H., Fink, G. R., and Weidner, R. (2020). Visual size processing in early visual cortex follows lateral occipital cortex involvement. J. Neurosci. 40, 4410–4417. doi: 10.1523/JNEUROSCI.2437-19.2020
Zhang, H., Wang, Y., Lyu, D., Li, Y., Li, W., Wang, Q., et al. (2021). Cerebral blood flow in mild cognitive impairment and Alzheimer's disease: a systematic review and meta-analysis. Ageing Res. Rev. 71:101450. doi: 10.1016/j.arr.2021.101450
Zhao, X., Zhou, Y., Wei, K., Bai, X., Zhang, J., Zhou, M., et al. (2021). Associations of sensory impairment and cognitive function in middle-aged and older Chinese population: the China health and retirement longitudinal study. J. Glob. Health 11:08008. doi: 10.7189/jogh.11.08008
Zheng, Y., Ley, S. H., and Hu, F. B. (2018). Global aetiology and epidemiology of type 2 diabetes mellitus and its complications. Nat. Rev. Endocrinol. 14, 88–98. doi: 10.1038/nrendo.2017.151
Zhou, X., Zhang, J., Chen, Y., Ma, T., Wang, Y., Wang, J., et al. (2014). Aggravated cognitive and brain functional impairment in mild cognitive impairment patients with type 2 diabetes: a resting-state functional MRI study. J. Alzheimers Dis. 41, 925–935. doi: 10.3233/JAD-132354
Keywords: functional neuroimaging, Alzheimer’s disease, type 2 diabetes mellitus, functional magnetic resonance imaging, coordinated-based meta-analysis
Citation: Xie H, Yu Y, Yang Y, Sun Q, Li Z-Y, Ni M-H, Li S-N, Dai P, Cui Y-Y, Cao X-Y, Jiang N, Du L-J, Gao W, Bi J-J, Yan L-F and Cui G-B (2023) Commonalities and distinctions between the type 2 diabetes mellitus and Alzheimer’s disease: a systematic review and multimodal neuroimaging meta-analysis. Front. Neurosci. 17:1301778. doi: 10.3389/fnins.2023.1301778
Edited by:
Ye Wu, Nanjing University of Science and Technology, ChinaReviewed by:
Wenjiao Lyu, Guangzhou University of Chinese Medicine, ChinaCopyright © 2023 Xie, Yu, Yang, Sun, Li, Ni, Li, Dai, Cui, Cao, Jiang, Du, Gao, Bi, Yan and Cui. This is an open-access article distributed under the terms of the Creative Commons Attribution License (CC BY). The use, distribution or reproduction in other forums is permitted, provided the original author(s) and the copyright owner(s) are credited and that the original publication in this journal is cited, in accordance with accepted academic practice. No use, distribution or reproduction is permitted which does not comply with these terms.
*Correspondence: Guang-Bin Cui, Y3VpZ2J0ZEBmbW11LmVkdS5jbg==; Y2didGRAMTI2LmNvbQ==; Lin-Feng Yan, eWxmODM0MkAxNjMuY29t
†These authors have contributed equally to this work
Disclaimer: All claims expressed in this article are solely those of the authors and do not necessarily represent those of their affiliated organizations, or those of the publisher, the editors and the reviewers. Any product that may be evaluated in this article or claim that may be made by its manufacturer is not guaranteed or endorsed by the publisher.
Research integrity at Frontiers
Learn more about the work of our research integrity team to safeguard the quality of each article we publish.