 Łucja Bieleninik1,2,3
 Gabriela Gradys1,4
 Angel M. Dzhambov5,6,7,8
 Tamara Walczak-Kozłowska1
 Kornelia Lipowska9
 Ariadna Łada-Maśko1
 Katarzyna Sitnik-Warchulska4
 Paulina Anikiej-Wiczenbach1
 Michał Harciarek1
 Małgorzata Lipowska1,4*
- 1Institute of Psychology, Faculty of Social Sciences, University of Gdańsk, Gdańsk, Poland
- 2GAMUT-The Grieg Academy Music Therapy Research Centre, NORCE Norwegian Research Centre AS, Bergen, Norway
- 3Institute of Pedagogy and Languages, University of Applied Sciences in Elbla̧g, Elbla̧g, Poland
- 4Institute of Applied Psychology, Faculty of Management and Social Communication, Jagiellonian University, Kraków, Poland
- 5Environmental Health Division, Research Institute at Medical University of Plovdiv, Medical University of Plovdiv, Plovdiv, Bulgaria
- 6Research Group “Health and Quality of Life in a Green and Sustainable Environment,” Strategic Research and Innovation Program for the Development of MU–Plovdiv, Medical University of Plovdiv, Plovdiv, Bulgaria
- 7Department of Hygiene, Faculty of Public Health, Medical University of Plovdiv, Plovdiv, Bulgaria
- 8Institute of Highway Engineering and Transport Planning, Graz University of Technology, Graz, Austria
- 9Department of Psychology, Faculty of Social and Behavioural Sciences, University of Amsterdam, Amsterdam, Netherlands
Objective: To review and meta-analyze patterns of attention deficit in primary-school-age children with ADHD measured with the neuropsychological attention network test (ANT).
Methods: Six electronic databases were searched to 5.05.2022. Selection criteria included prospective cohort and intervention studies; ANT used; primary-school-age; diagnosis of ADHD/at high risk.
Results: Seven studies met inclusion criteria (N = 3,826). Compared with controls, children with ADHD had higher scores for Reaction Time (Hedges’ g = 0.433; 95% CI: 0.135–0.731), Reaction Time Variability (Hedges’ g = 0.334; 95% CI: 0.012–0.657), and Alerting Network (Hedges’ g = 0.235; 95% CI: 0.021–0.449) while children at high risk had higher Alerting Network scores (Hedges’ g = 0.176; 95% CI: 0.003–0.349) and Correctness scores (Hedges’ g = 1.956; 95% CI: 0.020–3.892).
Conclusions: Children with ADHD and at risk of ADHD had different ANT results from children without ADHD only for the alerting network. There were no significant differences for executive and orienting outcomes. Children at risk of ADHD also made more errors (commission and omission) measured with the ANT compared with children without ADHD. Reaction time was longer and reaction time variability higher in children with ADHD than in children without ADHD, and in children at risk of ADHD compared with children without ADHD.
Preregistration: A protocol has been registered with the International Prospective Register of Systematic Reviews (PROSPERO) database (registration number: CRD42021249768).
1 Introduction
1.1 Background
Attention deficit hyperactivity disorder (ADHD) is a neurodevelopmental disorder that can take one or both of two forms: attention deficit disorder (ADD) and/or hyperactivity and impulsiveness (American Psychiatric Association, 2013). ADHD is one of the most common neurodevelopmental disorders in school-aged children, mostly between 6 and 9 years of age; however, symptoms can also manifest in adulthood (Roberts et al., 2015). According to Thomas et al. (2015), ADHD affects approx. 6.7–7.8% of the population; as such, there are typically 1–3 individuals with ADHD symptoms in a class of 25–30 children (DuPaul et al., 2014). ADHD is a significant risk factor for poor academic achievement (Daley and Birchwood, 2010): in comparison with students without disabilities, students with ADHD more frequently repeat a grade, are referred for special education services, are suspended from school, and drop out of school (Siqueira and Gurge-Giannetti, 2011). It seems that efficient attentional abilities are a prerequisite for good school outcomes. Moreover, ADHD affects other areas of a person’s functioning (both in childhood and adolescence). Children with ADHD may experience relationship difficulties: they are more often excluded from groups and make fewer friends compared to their typically-developing peers. Additionally, as pointed out by Lee et al. (2021), the friendships they do make are of poorer quality–they tend to last for a shorter period of time. According to Harpin (2005), children with ADHD, in comparison to their typically-developing peers, more often present difficulties in relations with their parents and siblings. Furthermore, parents of children with ADHD more often suffer from depression and experience less satisfaction with their role than do parents of children without this disorder (Harpin, 2005). These problems that children with ADHD experience in their lives can lead to lower self-esteem as well as difficulties regulating behavior and dealing with emotions. In adult life, they are more often dismissed from employment, have interpersonal issues with their colleagues, and are at greater risk of drug and substance abuse as well as other mental diseases (Harpin, 2005).
The attentional deficits have significant negative impact on the everyday lives of those diagnosed with ADHD. So far, the neurological basis of ADHD has not been clearly identified (Weyandt and Gudmundsdottir, 2015). According to the American Psychiatric Association (2013), ADHD may result from deficits in various attentional capabilities. Brandt (2019) indicates that there is a lack of neuropsychological methods in specialist diagnostics that would allow reliable distinctions between “endogenous” attentional deficits in ADHD (resulting from abnormal brain development) and “exogenous” attentional deficits, which can appear during the lifespan as a result of exposure to toxins, unhealthy habits such as suboptimal nutrition (Brandt, 2019), spending a lot of time in front of screens, poor sleep, other neurodevelopmental and psychiatric disorders (Krakowski et al., 2020; Rutter and Arnett, 2021), challenging life experiences (Barnow et al., 2007; Bouchard and Saint-Aubin, 2014), or acute brain damages (Roberts et al., 2019). Moreover, it is a challenge to distinguish between attentional deficits associated directly with the efficiency of attentional networks observed at the neurological level (using clinical judgment based on clinical trials) with those observed at behavioral level (using self-reported instruments such as difficulties in staying alert during lecture or following the instructions, trouble getting organized, always “on the go,” talkative). There are few clinical instruments that are used in the diagnosis of attentional deficits in children at behavioral level (e.g., the Continuous Performance Test, Child Behavior Checklist), and there are no measurements available for the diagnosis of attentional deficits at the neurological level (specifically, the efficiency of attentional networks). The attention network test (ANT) is a neuropsychological tool that can be useful in the measurement of this capacity; however, efforts are needed to investigate the performance of this test more thoroughly (Vázquez-Marrufo et al., 2019).
1.2 Attention network test
The ANT is a computer-based task predicated on the neuropsychological theory of the attention system (Posner and Petersen, 1990). In this approach, the attention system consists of three independent and integrated attentional networks: the alerting network–the ability to maintain increased sensitivity to new incoming stimuli; the orienting network–the ability to select stimuli and focus attention on the stimulus of interest; and the conflict or executive network–the ability to control a behavioral response in response to a stimulus that enables two alternative responses. As indicated by Fan et al. (2002), the ANT measures the efficiency of the three attentional networks by gathering information on the correctness and the reaction time of a participant’s responses to presented stimuli. In this task, participants react to the target arrows by pressing arrow keys on a keyboard (pointing in the same direction as the arrow on the screen). In some trials, the arrows are preceded by various visual cues and/or warning tones. There are three types of flankers (neutral, compliant, and inconsistent) that are preceded by one of four types of clues (none, double, center, and spatial). Researchers can make adjustments to the rules, such as the time of presentation of the fixation, signal, target, and final fixation slides. There are several versions of the ANT that have been developed over the past two decades: ANT-C (Rueda et al., 2004), LANT (Greene et al., 2008), ANT-R (Fan et al., 2009), ANT-I (Callejas et al., 2004), and ANTI-V (Roca et al., 2011). Although these versions measure in general the same outcome, the differences from the original version concern the terminology used, and some aspects and characteristics of the task. In the child version of the ANT (Child-ANT or ANT-C), the target presented is a fish that, in some trials, is surrounded by four distractor fish (Rueda et al., 2004). Gradys et al. (2022) shows a diagram based on the original ANT (Fan et al., 2002) and another previous research (Rueda et al., 2004; Vázquez-Marrufo et al., 2019).
1.3 Rationale
To the best of our knowledge, few studies have been conducted on the measurement of attentional deficits in children with ADHD using the Attentional Network Test. Deficits in attentional capabilities in children with ADHD do not necessarily apply to the entire attention system. They may refer to specific sub-components of that system. Careful investigation of deficits in the three attentional networks allow the precise identification of the areas of attention that function sub-optimally in children with ADHD. This knowledge may facilitate the use of the most effective treatments. Currently in the literature there exists a single narrative review (Vázquez-Marrufo et al., 2019) and a single meta-analysis (Arora et al., 2020) on this subject; however, the results of these papers were inconsistent and neither of them followed the Preferred Reporting Items for Systematic Review and Meta-analysis (PRISMA) statement (Liu et al., 2019). Moreover, Mullane and Klein (2008) conducted systematic review with a meta-analysis in children with and without ADHD, but they focused in general on flanker and Simon task performance (they did not include ‘ANT’ or ‘Attention Network Test’ or ‘Attention Network Task’ in search terms)–probably because the authors were focused mainly on interference control effects in this cohort. Among the 12 studies included by Mullane and Klein (2008) only two used ANT (in child and adult versions). The outcomes included in meta-analysis were computed using Reaction Time variability and percentage of correct answers for congruent and incongruent trails, but did not include Reaction Time and percentage of correct answers for trails with warning cues (probably because in other than ANT type of flanker task no warning cues were provided). Of note, this systematic review also did not follow the PRISMA statement and authors highlighted in the limitation section that further studies with a more rigorous meta-analytic review should be conducted. Thus, it remains unclear whether there are any differences in ANT performance between children with and without ADHD. It also needs to be elucidated how the differences manifest and the direction of changes.
The aim of this systematic review was to identify a single distinctive pattern of ANT performance in children with ADHD, including the efficiency of attentional networks, reaction time, and numbers of all types of errors. Such an approach would allow the comparison of ANT results obtained in future experimental studies with the pattern observed in ADHD respondents in our systematic review; with this knowledge it would be possible to determine whether such patterns are the result of the heterogeneity of the study group. The results of this review and metanalysis will make it possible to use the ANT in further research and perhaps serve as a basis for standardization of the test, which could make the ANT useful for broad diagnoses of attention.
1.4 Research questions
This meta-analysis seeks to examine patterns of attention deficit using ANT among children with ADHD or at risk of ADHD compared to controls. The primary research question was as follow: Compared to children without ADHD, do primary-school-age children diagnosed with ADHD or at risk of ADHD demonstrate differences in the efficiency of functioning of the three attention networks measured with the ANT?
This meta-analysis addressed the following secondary research questions:
• Compared to children without ADHD, do primary-school-age children diagnosed with ADHD or at risk of ADHD demonstrate differences in Correctness scores (numbers of Commission and Omission Errors) measured with the ANT?
1. Compared to children without ADHD, do primary-school-age children diagnosed with ADHD or at risk of ADHD demonstrate differences in the number of mistakes made in particular clue or flanker tasks measured with the ANT?
2. Compared to children without ADHD, do primary-school-age children diagnosed with ADHD or at risk of ADHD demonstrate differences in reaction times, in particular clue or flanker tasks measured with the ANT?
3. Compared to children without ADHD, do primary-school-age children diagnosed with ADHD or at risk of ADHD demonstrate differences in results of the ANT depending on the version of ANT used, e.g., ANT-C (Rueda et al., 2004), LANT (Greene et al., 2008), ANT-R (Fan et al., 2009), ANT-I (Callejas et al., 2004), ANTI-V (Roca et al., 2011).
2 Methods
The inclusion criteria, search strategy, and analysis methods were specified in advance, published in a protocol (Gradys et al., 2022), and registered with the International Prospective Register of Systematic Reviews (PROSPERO) database (registration number: CRD42021249768). We undertook a comprehensive literature search following the Preferred Reporting Items for Systematic Review and Meta-analysis for Protocols (PRISMA-P) guidelines (Moher et al., 2009; Page et al., 2021b). Amendments of the protocol can be found in Supplementary Table 1. This report has been prepared in accordance with the PRISMA statement (Page et al., 2021a,b). The PRISMA checklist is shown in Supplementary Table 2.
2.1 Eligibility criteria
Studies were selected according to pre-specified eligibility criteria following the Population, Intervention, Comparison, Outcomes, and Study model (PICOS model; see Table 1).
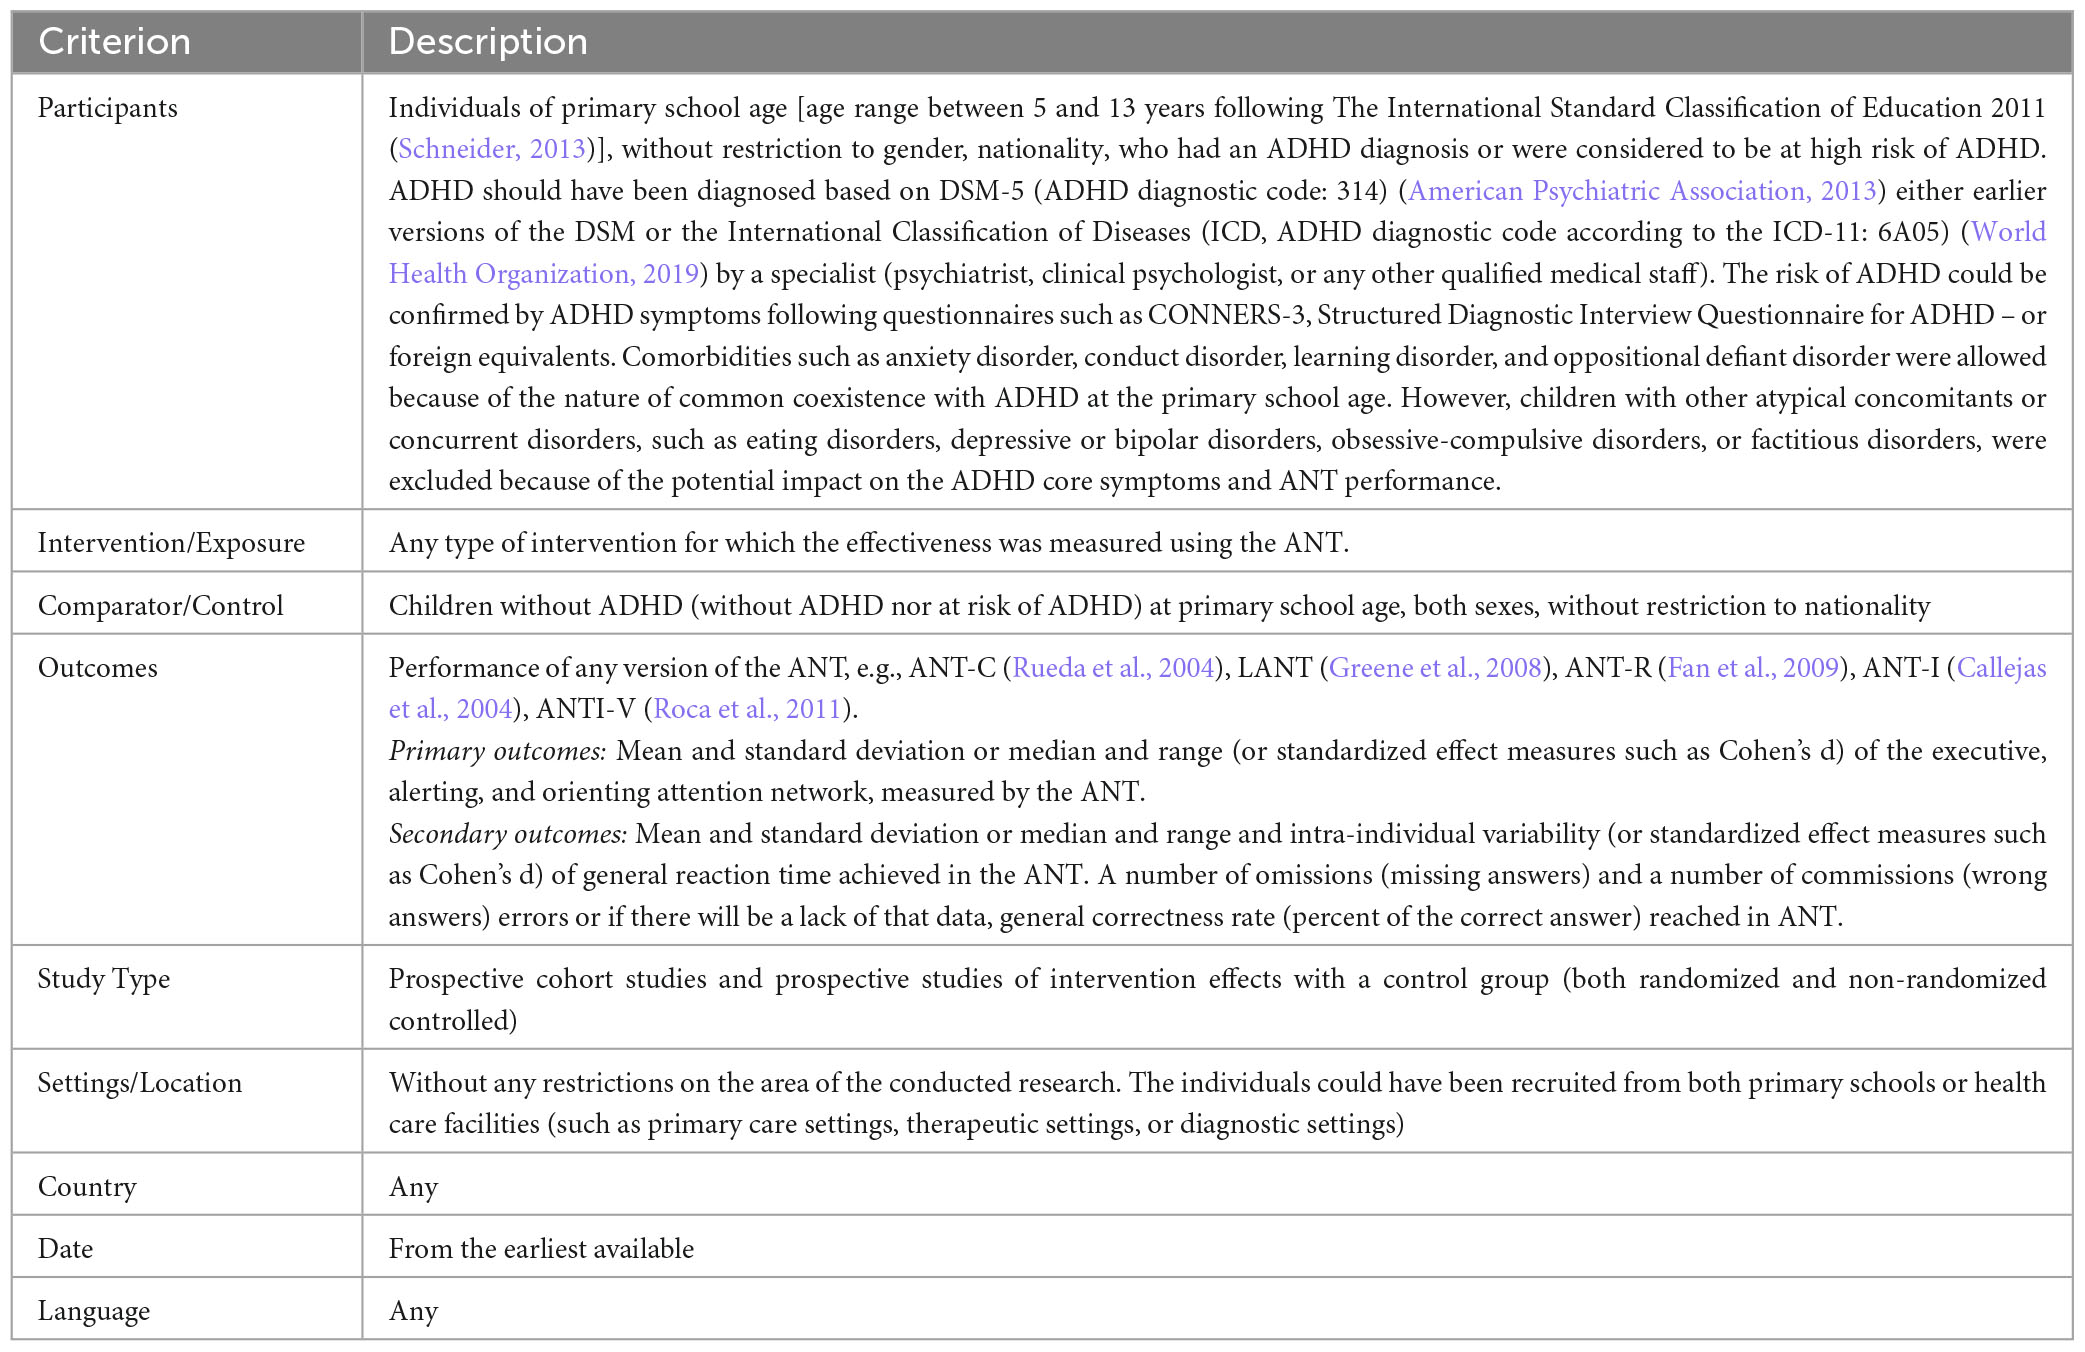
Table 1. Eligibility criteria.
2.2 Information source and search strategy
We searched both electronic databases (PubMed, PsychInfo, Web of Science, EMBASE, DARE, and the Cochrane Library) and the reference lists of included review articles to identify any additional studies. The literature search was conducted up to the 8th of May 2021 and updated on the 5th of May 2022 following the same search strategy. The search was not restricted to any language, sample size, or year of publication. We excluded editorials, letters, case studies, case series, and conference abstracts. The initial search strategy was piloted on PubMed. The following search strings were used: (“attention deficit disorder with hyperactivity” OR ADHD) AND (“Attentional Network Test” OR “Attentional Networks Test” OR “Attentional Network Task” OR “Attentional Networks task” OR “Attention Network Test” OR “Attention Networks Test” OR “Attention Network Task” OR “Attention Networks task”). More details can be found in the protocol (Gradys et al., 2022).
2.3 Selection process
Study selection was carried out by one reviewer (GG) who searched electronic databases and manually searched the reference list of the included review articles. All potentially relevant records were extracted to EndNote reference management software (Eapen, 2006) and duplicates were identified and deleted. At the next stage, titles and abstracts were checked for their eligibility for inclusion by two review authors (GG, TW-K) independently. Then, the full texts of the studies found with the aforementioned eligibility criteria were read by two review authors (GG, TW-K) independently. The review authors provided the reason(s) for rejection. Eligibility criteria for each study were assessed in order of importance, starting with participants, followed by the outcome, intervention/exposure, comparator/control, and study design. In this strategy, the first ‘no’ response constitutes the primary reason for excluding a study, and the remaining criteria are not assessed. Any discrepancies at the screening stage and eligibility phases were resolved by discussion with another reviewer (ŁB). During the study selection, the review authors were not blinded to the journal titles, study authors, or their institutions. To resolve issues with eligibility, the review authors sought additional information from the study’s corresponding authors where necessary.
2.4 Data collection process
Data were extracted from the included studies based on a specifically designed and pre-piloted data extraction form by at least two review authors, working in pairs (KS-W, KL, PA-W, AŁ-M). Data extractors were trained in code entry and procedures. The data extraction stage was performed by area experts from the field of clinical psychology who are familiar with the ANT. Any discrepancies were resolved by consultation with a third reviewer (GG).
2.4.1 Duplicate publications
Multiple reports based on the same study were merged based on matching the following study characteristics: author names, location and setting, number of participants and baseline data, and duration of the study. In the case of multiple reports based on the same project, we extracted data from each report separately and combined information across multiple data collection forms afterward.
2.4.2 Requesting missing data
Corresponding authors were requested to provide any missing data by e-mail. The strategy is described in the study protocol (Gradys et al., 2022). We attempted to contact the authors of 10 of the 18 included studies for clarification or to request missing data. We successfully obtained the requested data only in 3 cases. If we did not receive any feedback, we considered the data to be unobtainable.
2.5 Data items
The following data were extracted.
1. Publication details: author; year of publication; country in which the study was conducted.
2. The number of participants per group (clinical–ADHD/risk of ADHD; control–non-ADHD).
3. Characteristics of the clinical population: age; sex; ADHD group type (ADHD/risk of ADHD); diagnosis provider; diagnosis method(s); diagnosis criteria; comorbidities; pharmacotherapy (yes/no); pharmacotherapy used during ANT assessment (yes/no; withdrawal time before testing).
4. Characteristics of the control population: age, sex.
5. Study design: prospective cohort study/intervention study.
6. ANT results: means and standard deviations or medians and ranges (or standardized effect measures such as Cohen’s d) of the scores for Executive, Alerting, and Orienting attention networks; mean and standard deviation or median and range, as well as intra-individual variability, of general Reaction Time; numbers of Omission Errors (missing answers) and Commission Errors (wrong answers) or, in the absence of this data, general Correctness Rate (percent correct answers). We extracted baseline data in observational studies with repeated measurements or intervention studies with several time points. We gathered data on the version of the ANT used, how the training for the ANT was performed, how the instructions were presented, the person conducting the test and their interventions with the child during the test, as well as any other descriptive data about ANT performance and the administration of the test.
2.6 Synthesis methods
Data analysis included three ANT factors:
(1) Correctness (hereafter referred to as Errors)–measured by the number of Omission Errors (missing answers) and number of Commission Errors (wrong answers) or, in the absence of this data, the general Correctness Rate (percent correct answers) achieved by the children.
(2) Reaction Time–mean and standard deviation or median and range and intra-individual variability of general experiment reaction time.
(3) Attention Network–measured by the difference in mean or median reaction times between:
(a) Double clue vs. no clue or tone vs. no tone (Alerting Network)
(b) Valid clue vs. invalid clue (Orienting Network)
(c) Congruent vs. incongruent trial type (Executive Network).
These three factors (Correctness, Reaction Time, and Attention Network) were plotted in order to compare data between the ADHD clinical group and the control group, as well as between the group at risk of ADHD and the control group, in order to detect potential specific differences in children with ADHD and at risk of ADHD, to thereby establish a characteristic pattern of ANT results for children with ADHD answering the study questions.
We have provided a narrative synthesis of the included studies in a comparative table structured around the type of participants, study design, and ANT performance. Quantitative data were combined when means and standard deviations were available or could be derived from the available data.
2.7 Meta-analysis
We planned to use the fixed-effects estimator in the absence of materially important heterogeneity; otherwise, we would use the restricted maximum likelihood random estimator. We combined only studies for which the effect estimates could be converted to a common metric–specifically, group means and standard deviations into Hedges’ g. Some studies (Booth et al., 2007; Kooistra et al., 2011; Antonini et al., 2016) reported means and SDs separately for ADHD-I and ADHD-C subgroups, so they were combined for the meta-analysis using methods provided in the Cochrane Handbook (Higgins et al., 2022). Kooistra et al. (2011) reported median test scores, but since we lacked sufficient information on the distribution of these scores, we could not convert them to means (Wan et al., 2014). Instead, we used them as means and conducted sensitivity analyses by excluding these estimates to check the robustness of the meta-analysis.
Statistical heterogeneity in the models was suggested by a significant Cochran’s Q at the p < 0.1 level and quantified by the I2 statistic as follows: mild – < 30%, moderate – 30–50%, or high – > 50% (Higgins and Thompson, 2002). We also inspected the direction of individual study effect sizes and the overlap of their confidence intervals. The quantitative synthesis was carried out using Stata v. 17 (College Station, TX: StataCorp LP) and MetaXL v. 5.3 (EpiGear International Pty Ltd., Sunrise Beach, Queensland, Australia).
2.8 Sensitivity analyses
For meta-analysis models with more than 2 studies, we conducted a leave-one-out meta-analysis to determine whether excluding studies one at a time would materially change the pooled effect. This way we could identify studies that had a strong influence on the results.
Given growing concerns about the appropriateness of the random effects model and its potential to yield overly liberal findings, we also re-ran the meta-analysis using the inverse-variance heterogeneity model; this model is built under the fixed effect model assumption with a quasi-likelihood based variance structure to retain correct coverage probability and yield more conservative pooled estimates regardless of heterogeneity (Doi et al., 2015, 2017).
2.9 Study quality assessment
The Newcastle-Ottawa Scale (NOS) for cohort studies was used to assess the study quality by two review authors (ML, MH) independently. Any discrepancies were resolved by experts in the fields of clinical trial methodology (ŁB) or psychology (TW-K). The NOS assesses the following three items: selection – representativeness of the exposed cohort, selection of the non-exposed cohort, ascertainment of exposure, demonstration that the outcome of interest was not present at the start of the study; the comparability of cohorts on the basis of the design or analysis; and the outcome – assessment of outcome, follow-up, adequacy of follow up of cohorts (Wells et al., 2014). Each study can be awarded a maximum of one star for each numbered item within the selection and outcome categories. A maximum of two stars can be given for comparability, giving a maximum of 9 stars. To evaluate the quality of the studies, we applied the “good,” “fair,” and “poor” thresholds for converting NOS assessments to the Agency for Healthcare Research and Quality (AHRQ) guidelines (2012). Studies rated 3 or 4 stars in the selection domain, 1 or 2 stars in the comparability domain, and 2 or 3 stars in the outcome/exposure domain were considered to represent good quality. Studies rated 2 stars in the selection domain, 1 or 2 stars in the comparability domain, and 2 or 3 stars in the outcome/exposure domain were considered to represent fair quality. Papers evaluated as being 0 or 1 stars in the selection domain, 0 stars in the comparability domain, and 0 or 1 stars in the outcome/exposure domain were considered to be poor quality.
2.10 Overall quality of evidence
We followed the Grading of Recommendations, Assessment, Development, and Evaluations (GRADE) approach (Schünemann et al., 2013; McKenzie and Brennan, 2022) to grade the quality of evidence for each outcome. The quality of evidence was assessed by two review authors (ML, KS-W) independently for each outcome based on the following domains: (1) high risk of bias across the studies; (2) indirectness of evidence; (3) high heterogeneity or inconsistency of results across studies; and (4) imprecision of results. Any discrepancies were resolved by a third reviewer (ŁB). The quality of evidence was judged based on the extent to which we could be certain that the pooled effect estimate is close to the true effect as follows: high evidence (the authors had a lot of confidence that the true effect is similar to the estimated effect), moderate evidence (the authors believed that the true effect is probably close to the estimated effect), low evidence (the true effect might be markedly different from the estimated effect), or very low evidence (the true effect is probably markedly different from the estimated effect). The grading process across domains and reasons for up or downgrading can be found in Supplementary Table 3. As established in the systematic review protocol (Gradys et al., 2022), observational studies were assumed to start at “moderate” quality, which could be upgraded or downgraded in subsequent steps.
3 Results
3.1 Study selection
Up to 15th of May 2021, we identified a total of 422 records in our database search (PubMed – 82; PsycINFO – 121; EMBASE – 132; Web of Science – 70; DARE – 0; the Cochrane Library – 23) and 14 studies from searching their reference lists. An update and final search were performed on the 8th of May 2022 and identified 39 additional studies (PubMed – 4; PsycINFO – 7; EMBASE – 21; Web of Science – 6; DARE – 0; Cochrane Library – 1; manual search – 0). The results of both rounds of database searches are presented in Figure 1.
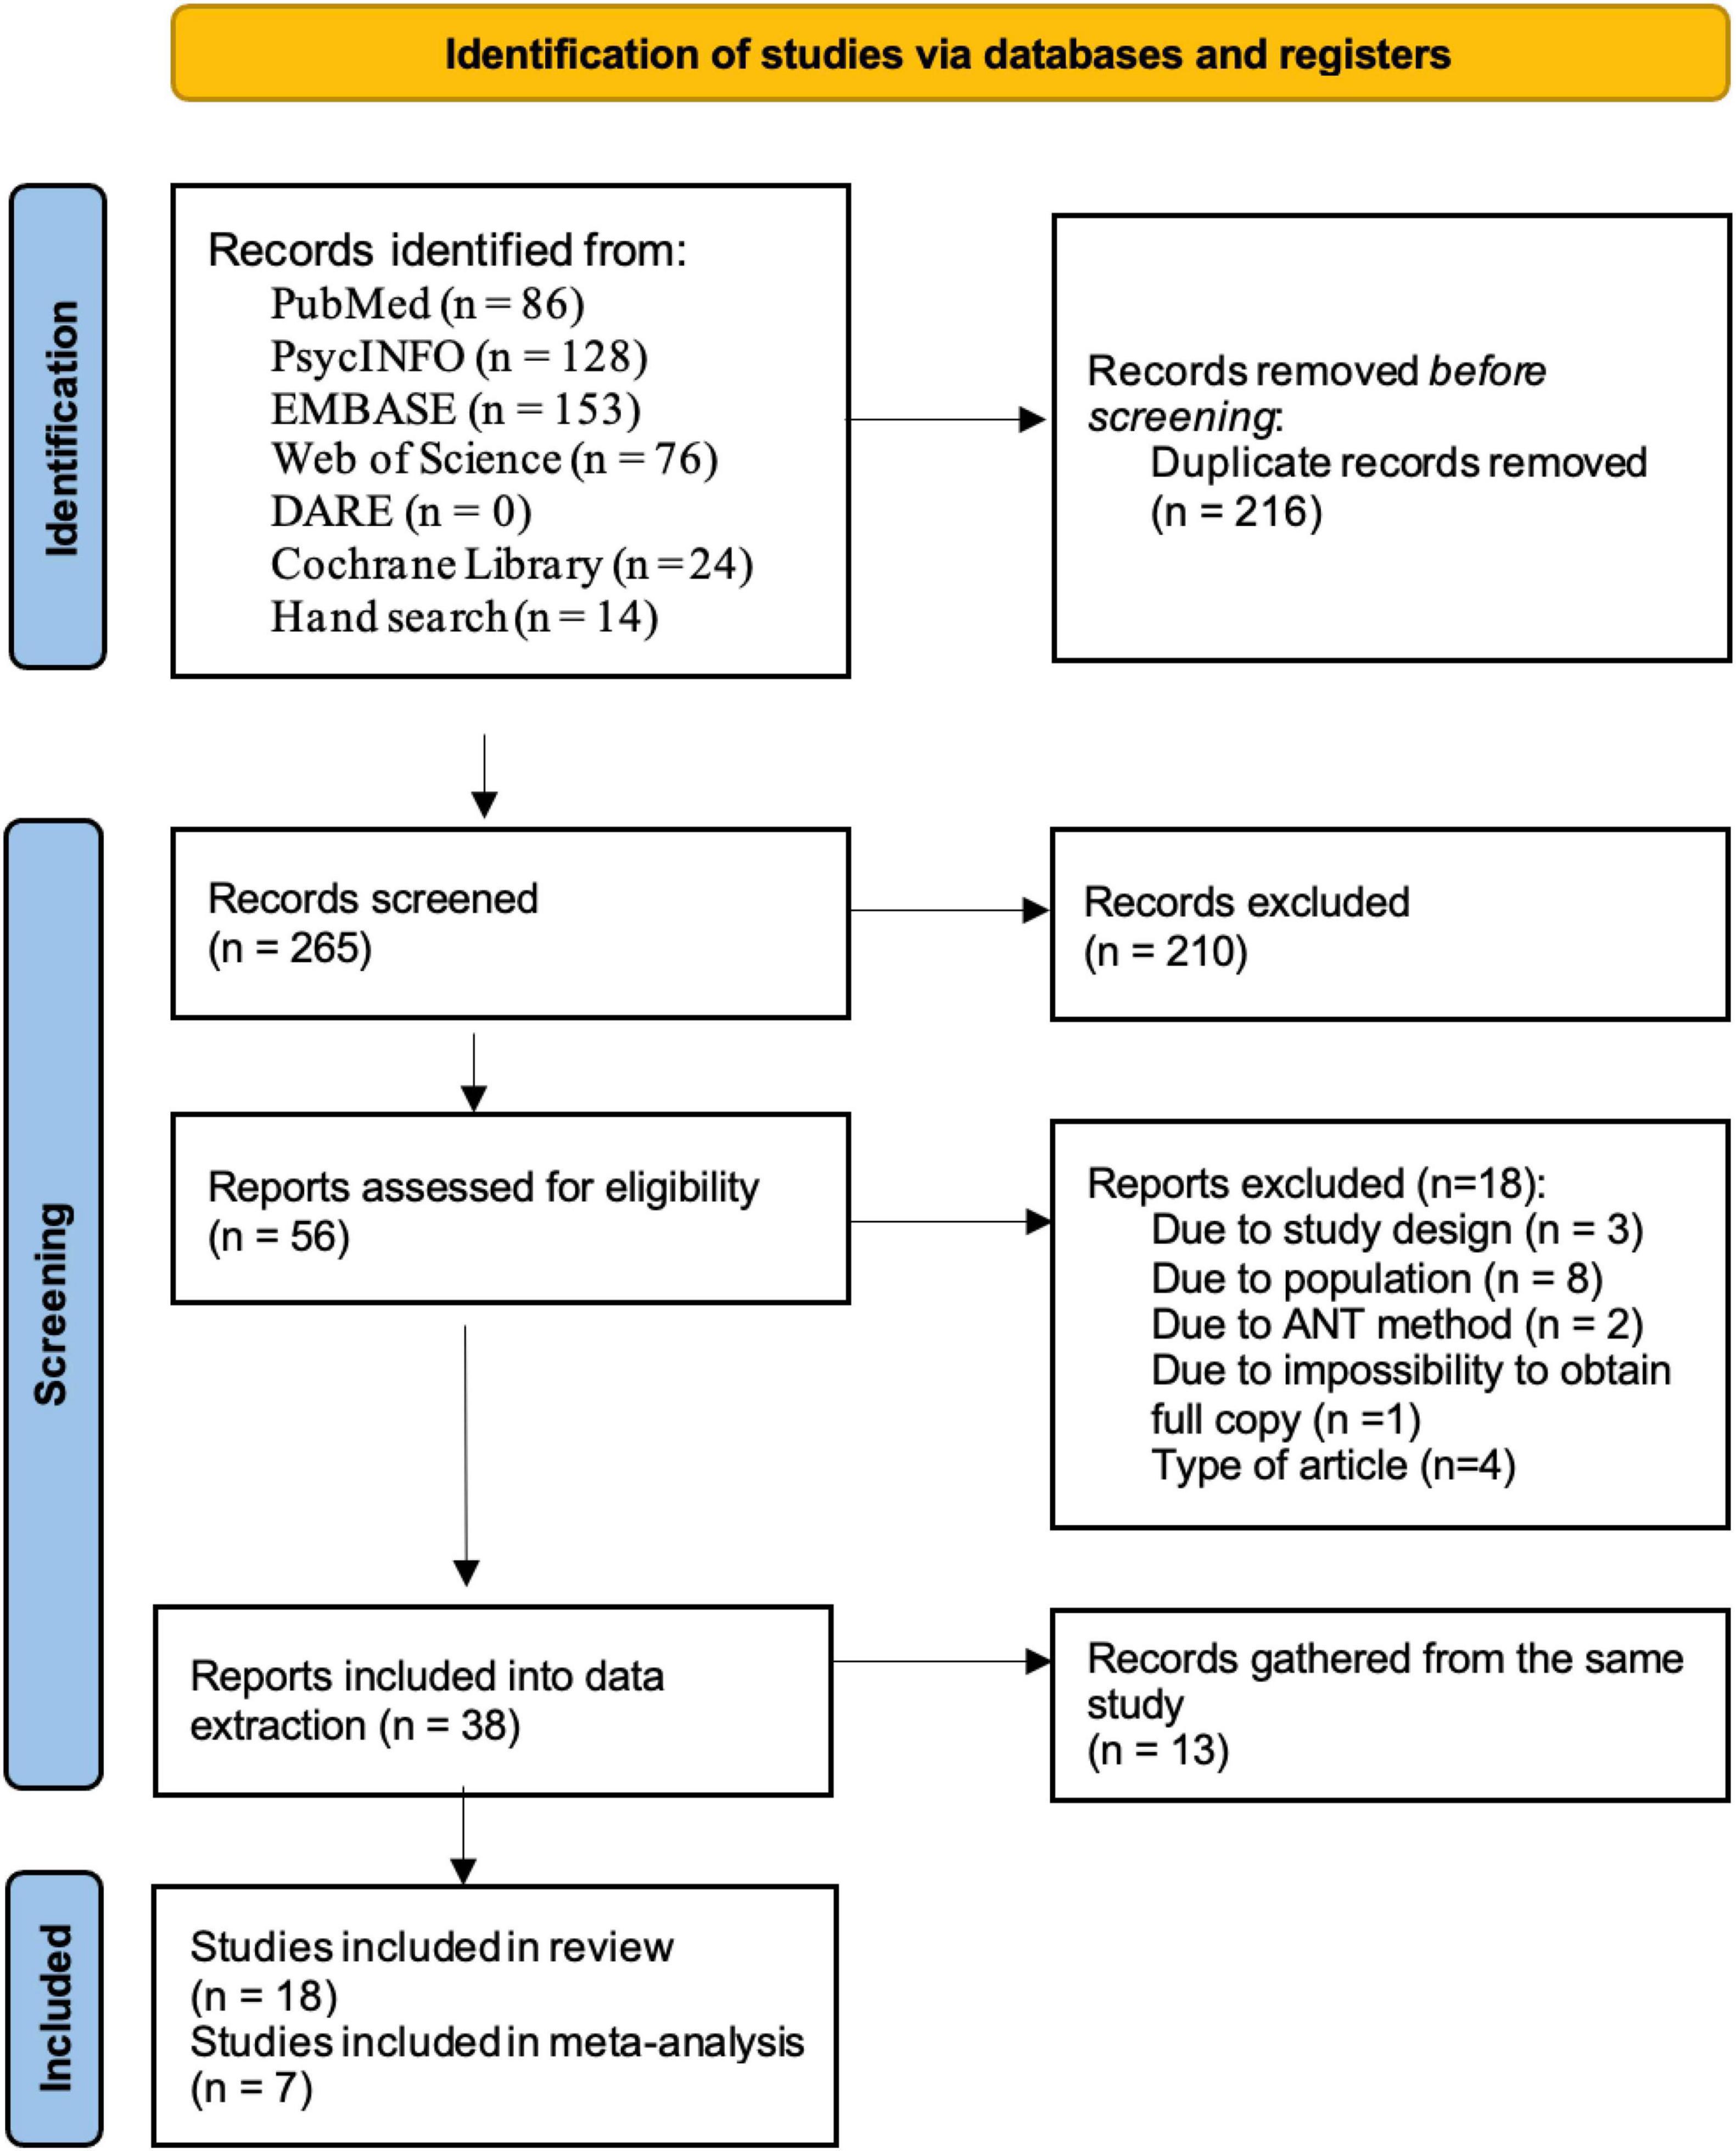
Figure 1. PRISMA flow diagram of the study selection process.
After excluding 216 duplicates, 265 articles were screened and 56 full texts were assessed for eligibility. At this stage, 18 records did not meet the pre-specified eligibility criteria and were excluded (the list of excluded studies along with reasons for exclusion is reported in Supplementary Table 4). A total of 38 reports were advanced to data extraction. Thirteen publications based on data from the same project were merged together (see Supplementary Table 5 for the list of duplicate studies and reasons for merging), leaving 18 studies included in the systematic review (Supplementary Table 6) and seven appropriate for quantitative synthesis/meta-analysis (Booth et al., 2007; Adólfsdóttir et al., 2008; Kooistra et al., 2011; Forns et al., 2014; Hansen et al., 2014; Mogg et al., 2015; Antonini et al., 2016).
3.2 Study characteristics
The final sample for the systematic review included 18 prospective cohort studies (Supplementary Table 6). We did not find studies of intervention effects with a control group, even though we planned to include such studies. Table 2 shows the characteristics of the studies. Of the 18 studies included, three were conducted in Norway (Adólfsdóttir et al., 2008; Forssman et al., 2009; Hansen et al., 2014), three in Canada (Kooistra et al., 2011; Mullane et al., 2011; Waldon et al., 2018), two in the USA (Booth et al., 2007; Antonini et al., 2016), two in Brazil (Mogg et al., 2015; Abramov et al., 2019), two in Spain (Forns et al., 2014; Julvez et al., 2020), two in Germany (Konrad et al., 2010; Kratz et al., 2011), and one each from Ireland (Johnson et al., 2008), Poland (Racicka-Pawlukiewicz et al., 2021), India (Gupta et al., 2011), and China (Chen et al., 2022).
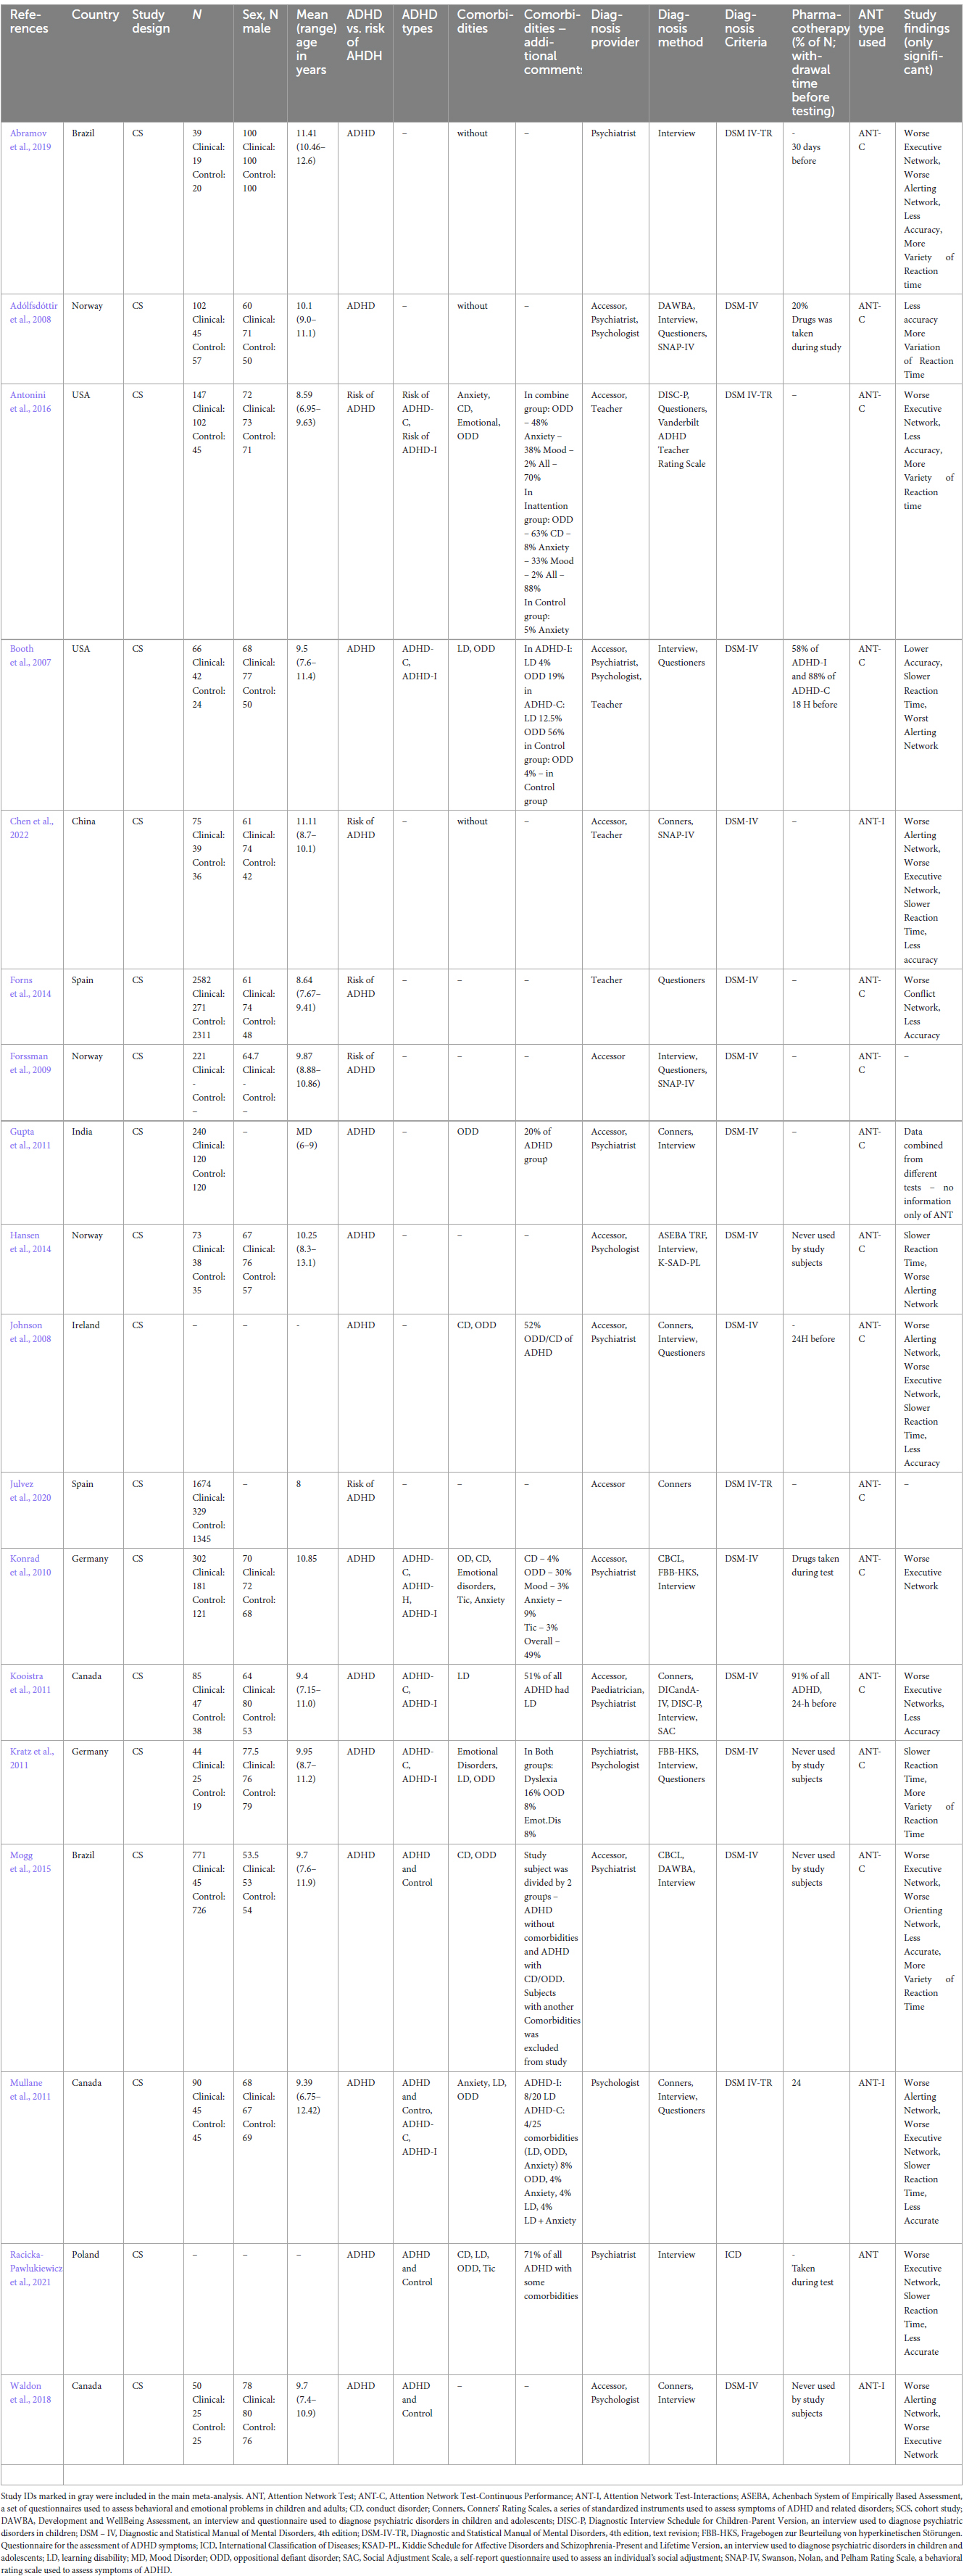
Table 2. Characteristics of the 18 studies included in a systematic review.
3.2.1 Participant characteristics
The pooled sample for meta-analysis included 3,826 participants: 3,236 controls, 217 children diagnosed with ADHD by a specialist (psychiatrist, clinical psychologist, or any other qualified medical practitioner) and 373 children at risk of ADHD recognized by a teacher or parent. The sample sizes ranged from 66 to 2,582 participants with a median of 85. The mean age was 9.45 years (range 6.95–13.1). In the ADHD group, 72% of the participants were boys, but in the control group, the proportion of both sexes was equal. In one of the studies (Adólfsdóttir et al., 2008), the children from the ADHD group did not have any comorbidities; four of the studies (Booth et al., 2007) reported common ADHD-related comorbidities – two (Booth et al., 2007; Kooistra et al., 2011) mentioned learning disorders (LD), three (Booth et al., 2007; Mogg et al., 2015; Antonini et al., 2016) mentioned oppositional defiant disorder (ODD) and two (Booth et al., 2007; Antonini et al., 2016) mentioned conduct disorder (CD). Two studies did not report any information about comorbidities (Forns et al., 2014; Hansen et al., 2014). In summary, 29% of children with ADHD included in this investigation had LD or ODD and at least 21% of children at risk of ADHD had CD or ODD.
3.2.2 ANT characteristics
Most studies included in the systematic review used the ANT version for children – only four studies used a different version: ANT-I (Mullane et al., 2011; Waldon et al., 2018; Chen et al., 2022) or ANT (Racicka-Pawlukiewicz et al., 2021). All seven studies included in the meta-analysis used ANT-C, the version of ANT for children (Rueda et al., 2004), but differed in terms of drug use while taking the ANT. One of these studies (Adólfsdóttir et al., 2008) allowed children with ADHD to take medication during the assessment; two of them (Booth et al., 2007; Kooistra et al., 2011) made sure that children did not take any medication for at least 18 or 24 h before the test; two of the studies (Hansen et al., 2014; Mogg et al., 2015) did not take any medication during the ANT procedure, and the last two of the studies (Antonini et al., 2016) did not mention anything about drug use during the ANT.
3.3 Results
3.3.1 Executive, alerting, and orienting networks
Five of the seven included studies (Booth et al., 2007; Adólfsdóttir et al., 2008; Kooistra et al., 2011; Hansen et al., 2014; Mogg et al., 2015) reported comparisons of Executive, Alerting, and Orienting Network scores between children with ADHD and controls (Figures 2A–F). Two other studies reported comparisons with children at risk of ADHD (Forns et al., 2014; Antonini et al., 2016) were included in the forest plots with the meta-analysis of the mean differences in network scores of ANT for executive, alerting, and orienting networks.
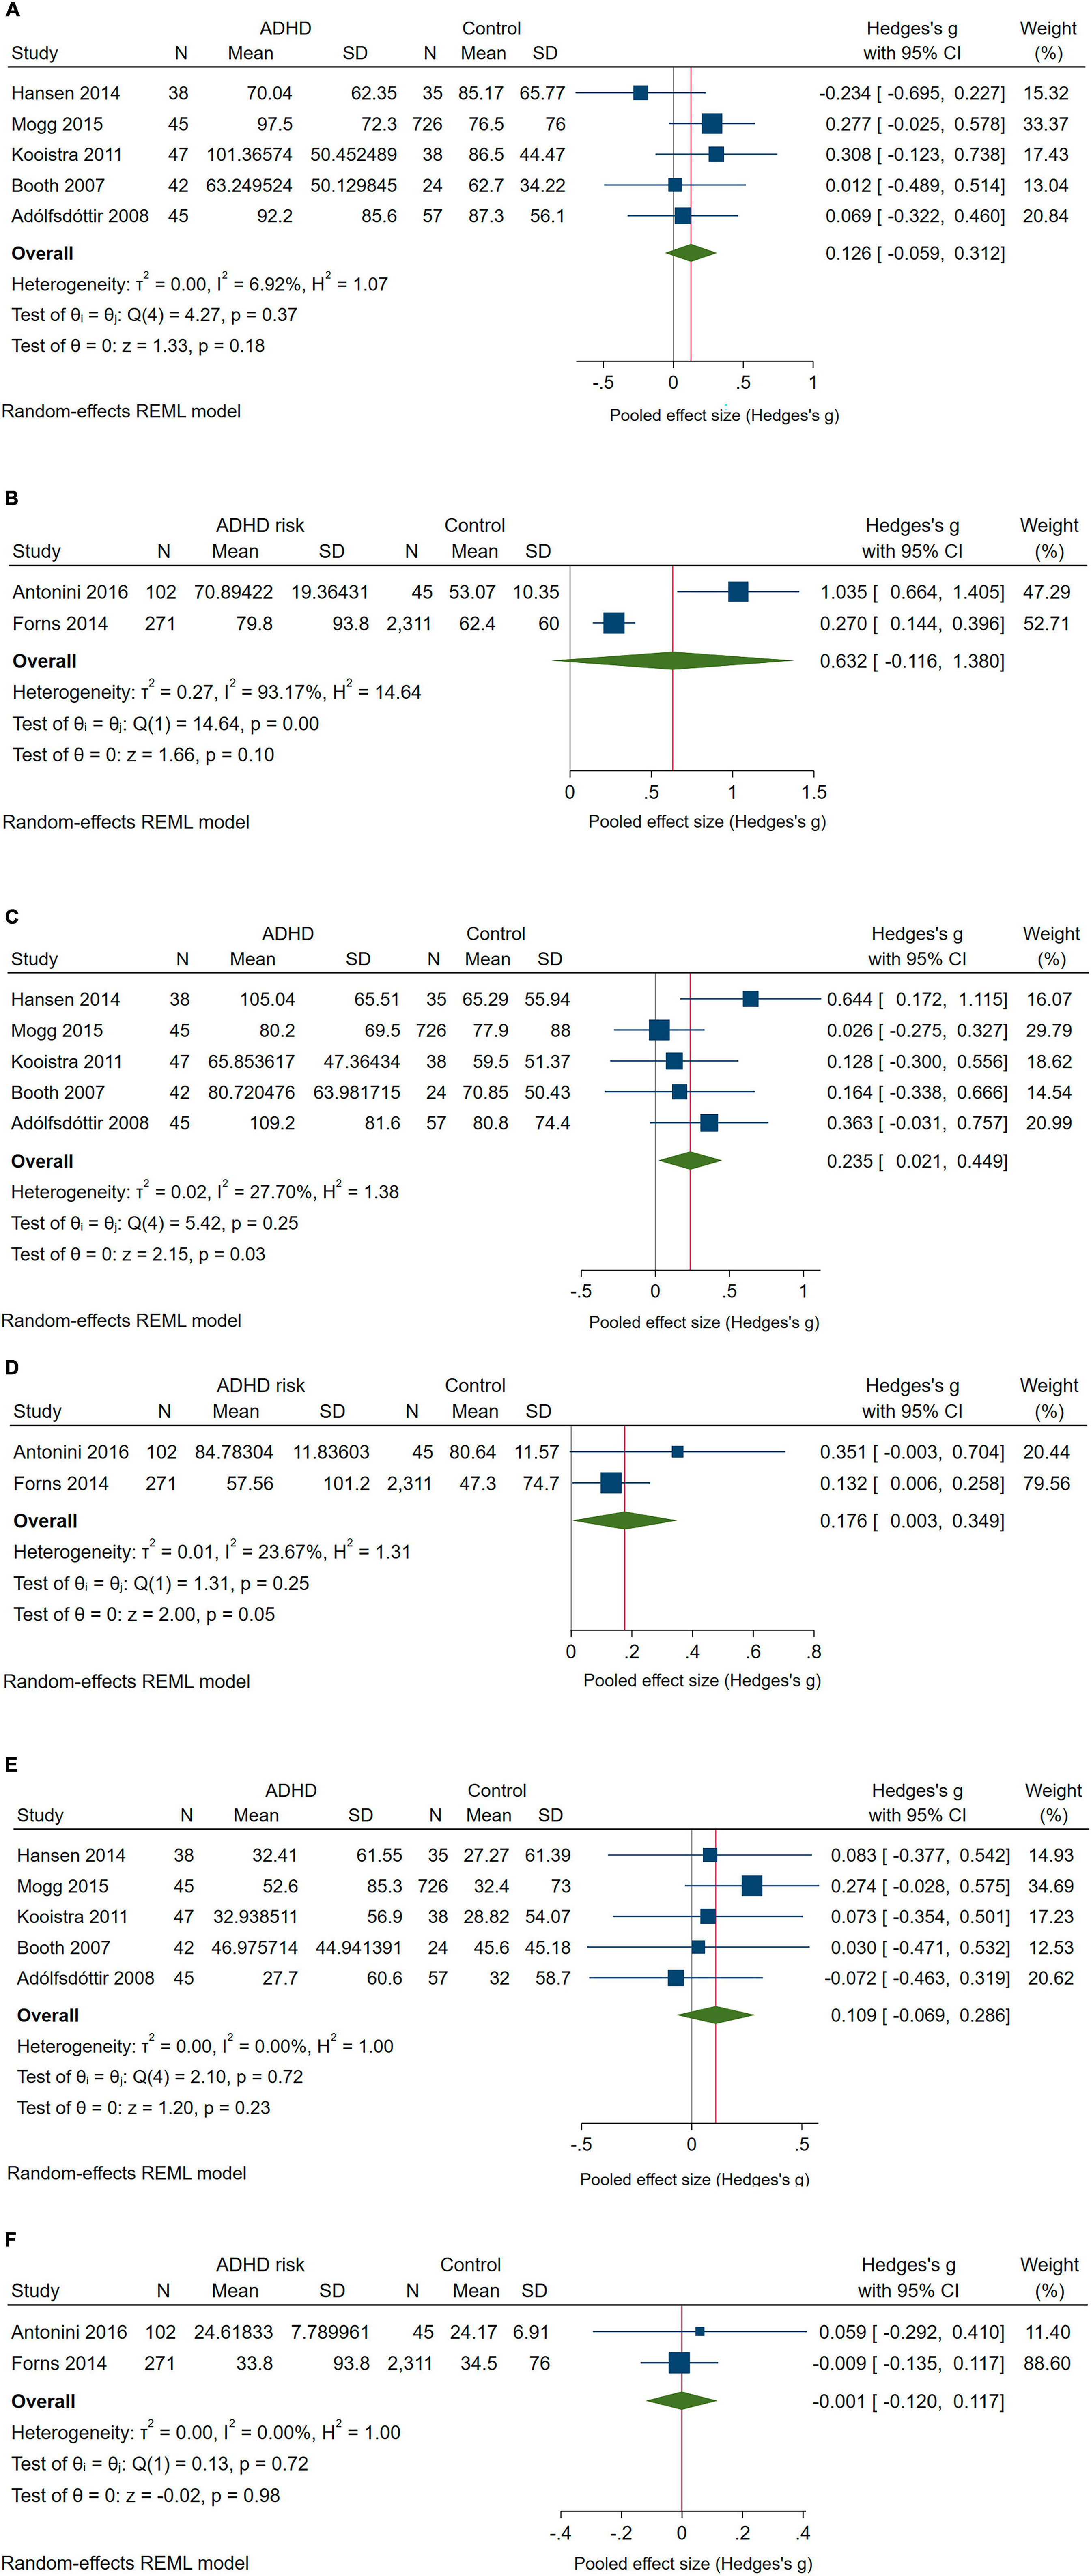
Figure 2. Forest plot with the meta-analysis of the mean differences in Network scores of ANT: (A) Executive Network scores of children with ADHD compared with controls; (B) Executive Network scores of children at risk of ADHD compared with controls; (C) Alerting Network scores of children with ADHD compared with controls. (D) Alerting Network scores of children at risk of ADHD compared with controls; (E) Orienting Network scores of children with ADHD compared with controls. (F) Orienting Network scores of children at risk of ADHD compared with controls.
The pooled difference in Executive Network scores between children with ADHD and controls was not significant in the main meta-analysis (Figure 2A). However, in leave-one-out meta-analysis, excluding the paper by Hansen et al. (2014) – the only study showing lower scores in children with ADHD – increased the effect to g = 0.193 (95% CI: 0.001–0.386). Under the alternative IVhet estimator, the pooled effect was similar to the effect under the random effects model (g = 0.130; 95% CI: −0.055 to 0.315). Comparing children at risk of ADHD to controls did not yield a significant difference (Figure 2B), and, given the high heterogeneity, the IVhet model produced an even smaller pooled effect compared with the main RE meta-analysis (g = 0.349; 95% CI: −0.581 to 1.280).
Significant pooled effects were found for Alerting Network scores, which were higher in both children with ADHD (Figure 2C) and children at risk of ADHD (Figure 2D) compared with their counterparts. However, excluding Booth et al. (2007), Adólfsdóttir et al. (2008), or Hansen et al. (2014) reduced the pooled effect to non-significance, reaching g = 0.148 (95% CI: −0.045 to 0.341) if Hansen et al. (2014) was excluded. However, under the IVhet model, the pooled effect held (g = 0.219; 95% CI: 0.006–0.432). The effect on Alerting Network scores for children at risk of ADHD vs. controls was not significant with the IVhet estimator (g = 0.156; 95% CI: −0.021 to 0.334).
For the Orienting Network, test scores did not differ significantly between children with ADHD or children at risk of ADHD and controls (Figures 2E, F). This did not change if studies were excluded one-at-a-time or if the IVhet estimator was used instead.
3.3.2 Correctness
Three studies (Booth et al., 2007; Adólfsdóttir et al., 2008; Mogg et al., 2015) provided estimates of Error scores for children with ADHD and two studies (Forns et al., 2014; Antonini et al., 2016) did so for children at risk of ADHD (Figures 3A, B). For children with ADHD, the effect was borderline significant and largely driven by the results of Booth et al. (2007). The IVhet model did not change this. However, significantly higher Error scores were observed in children at risk of ADHD vs. controls, with Hedges’ g indicative of a large effect (Figure 3B); this effect became non-significant under the IVhet model (g = 1.110; 95% CI: −1.439 to 3.659).

Figure 3. Forest plot with the meta-analysis of the mean differences in Error scores (A) of children with ADHD compared with controls (B) of children at risk of ADHD compared with controls.
3.3.3 Reaction time and reaction time variability
Five studies compared Reaction Time between children with ADHD and controls (Booth et al., 2007; Adólfsdóttir et al., 2008; Kooistra et al., 2011; Hansen et al., 2014; Mogg et al., 2015); for the other three outcomes, only two studies provided useful estimates (Forns et al., 2014; Antonini et al., 2016). Figures 4A–D show the pooled results for Reaction Time and Reaction Time Variability. Reaction Time was longer and Reaction Time Variability higher in children with ADHD than in controls (Figures 4A, B). The pooled effect for Reaction Time in children with ADHD was driven by Booth et al. (2007), the exclusion of which reduced it to g = 0.292 (95% CI: 0.102–0.483), and the IVhet model also produced a smaller effect size (g = 0.383; 95% CI: 0.086–0.681) but remained significant in both sensitivity analyses. As for the effect on Reaction Time Variability, it became borderline significant with the IVhet model (g = 0.315; 95% CI: −0.009 to 0.640).
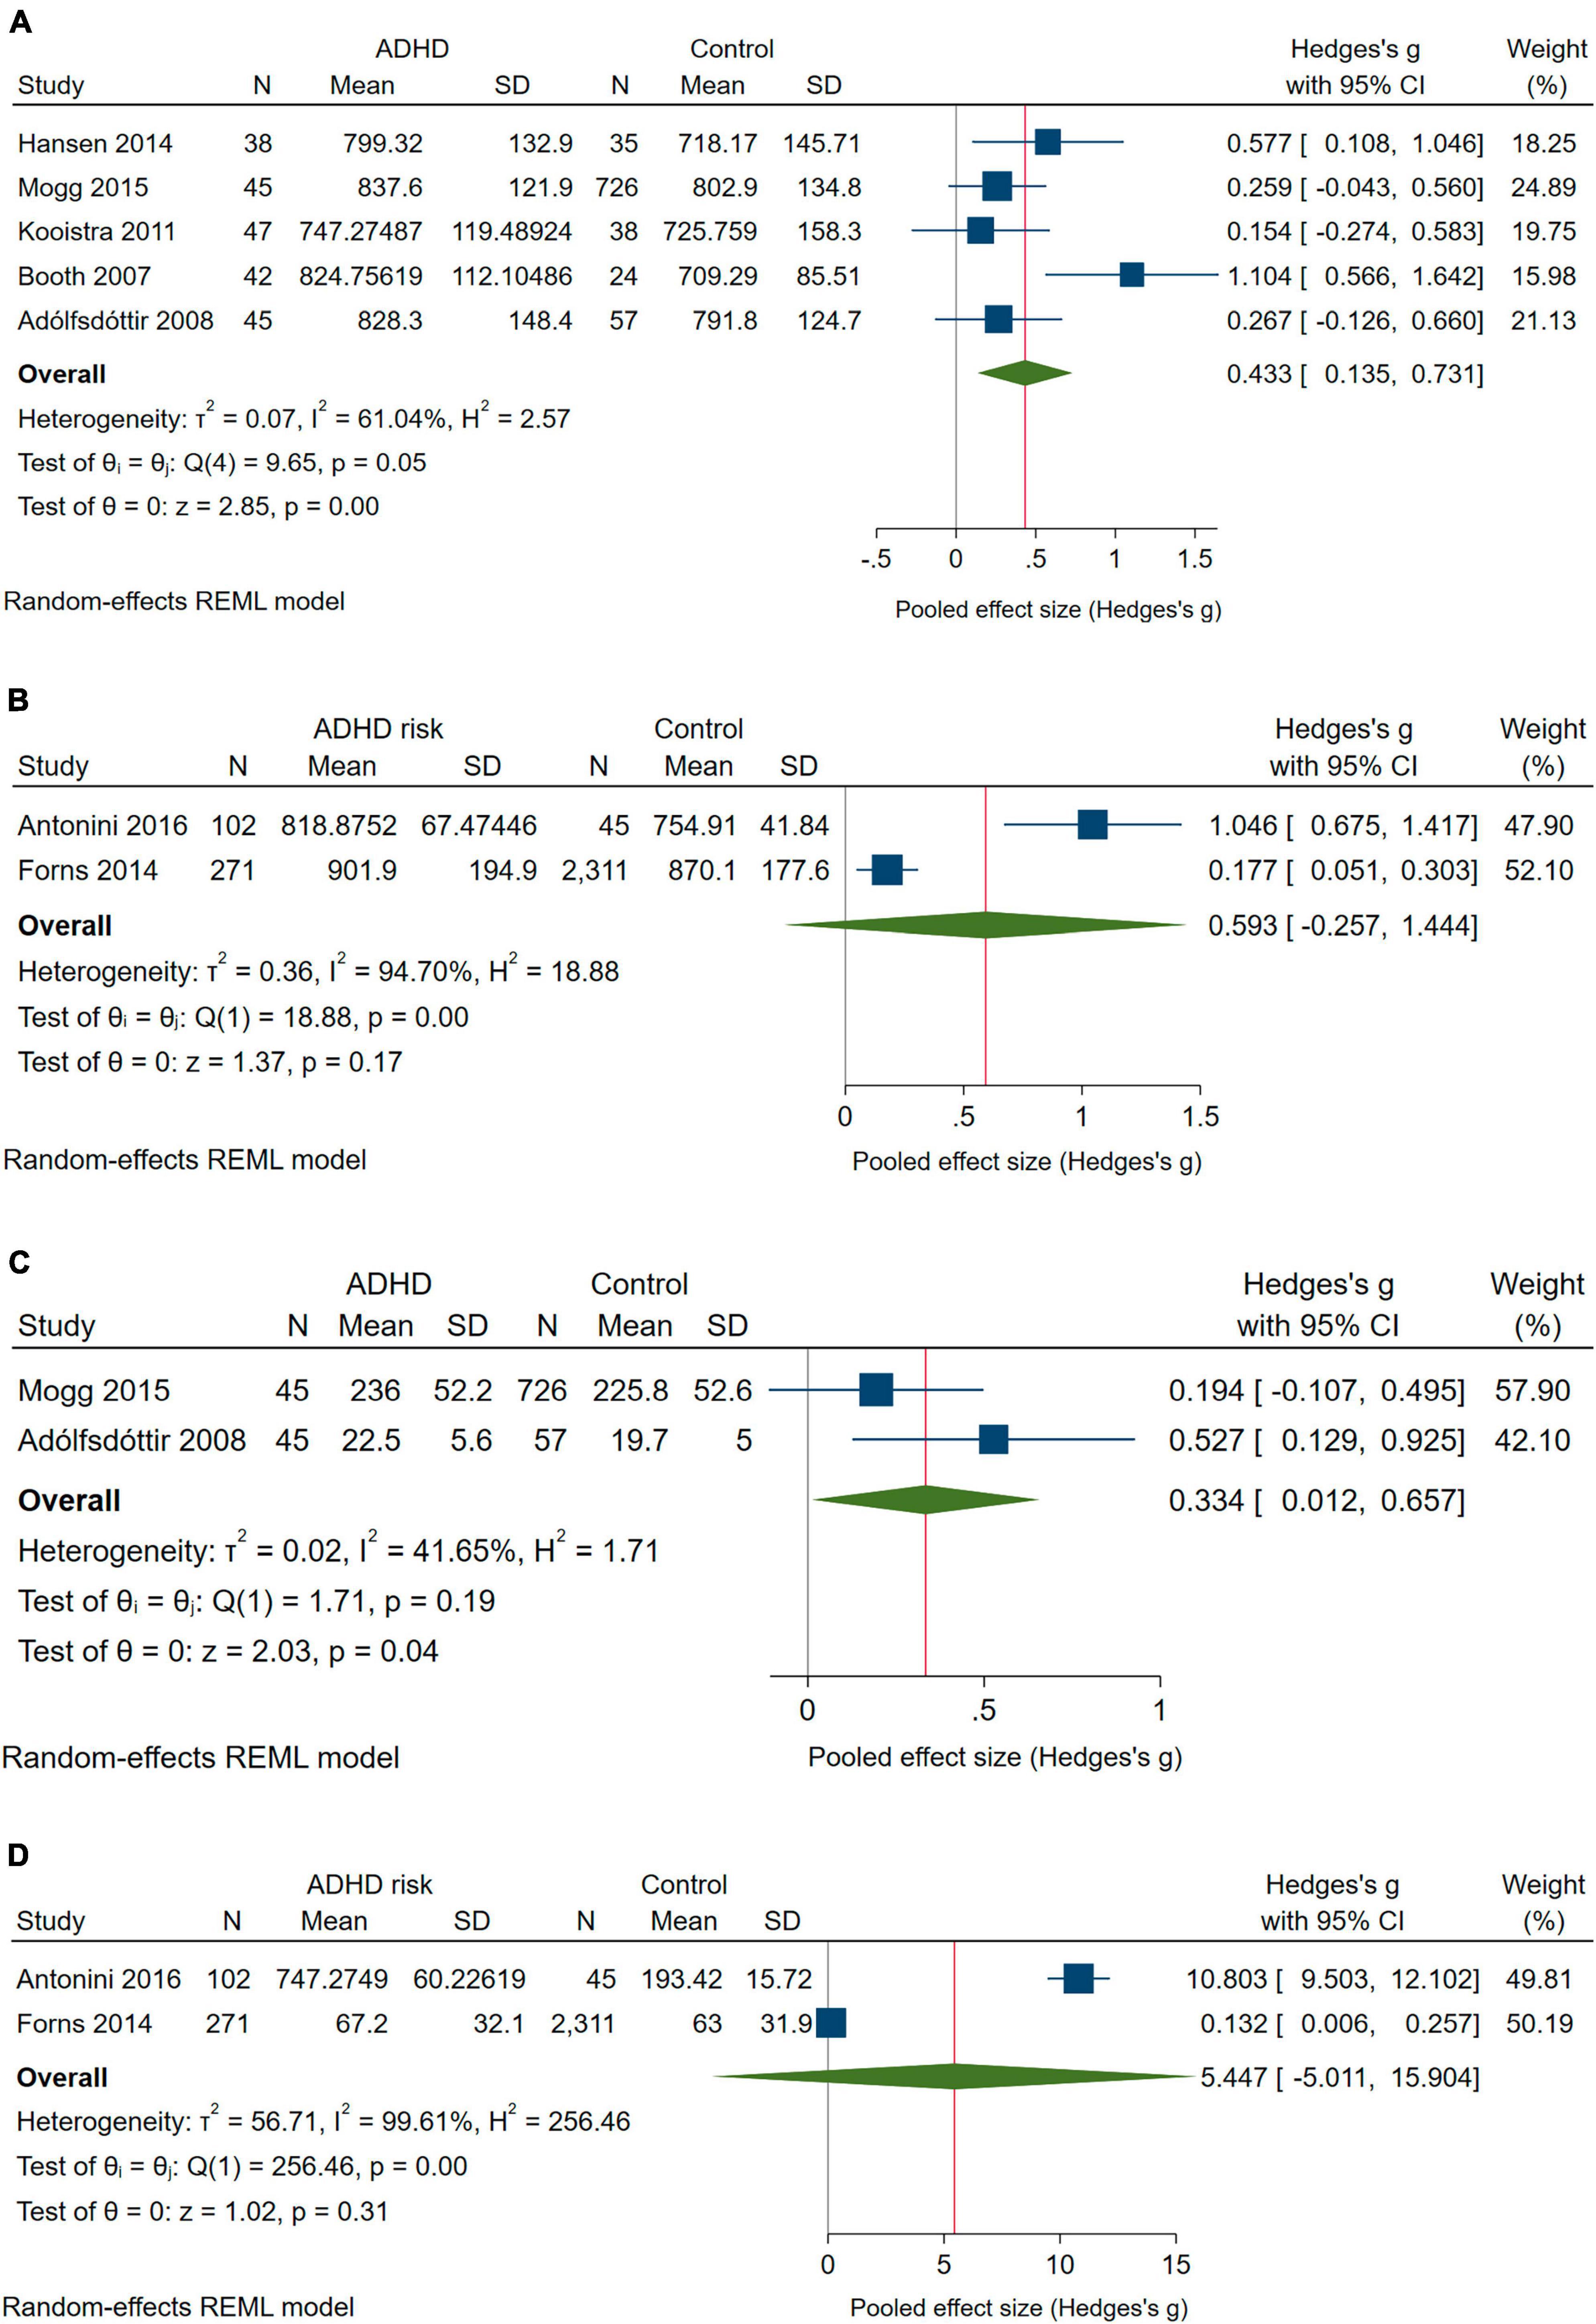
Figure 4. Forest plot with the meta-analysis of the mean differences in Reaction time and Reaction time variability: (A) Reaction time of children with ADHD compared with controls. (B) Reaction time of children at risk of ADHD compared with controls. (C) Reaction Time Variability scores of children with ADHD compared with controls. (D) Reaction Time Variability scores of children at risk of ADHD compared with controls.
For children at risk of ADHD, the pooled effects went in the same direction but were not significant (Figures 4C, D). The IVhet model reduced the pooled effect for Reaction Time to g = 0.267 (95% CI: −0.797 to 1.331) and even more so the pooled effect for Reaction Time Variability (g = 0.231; 95% CI: −14.394 to 14.855).
3.3.4 ANT version
We were not able to get an answer to the fourth research question. We could not conduct a separate meta-analysis on the type of ANT used due to the lack of relevant data. We found out that only 1 study on ANT-RPs was included in the systematic review and there were two ANT-I studies, but the results were not comparable since one of them was made on the ADHD-diagnosed group and the second on the group of risk of ADHD.
3.4 Subgroup analysis
We aimed to compare symptoms of ADHD at intensity A against symptoms at intensity B to check whether the severity of the symptoms of attention disorders is reflected in the results of the ANT. We assumed that children with ADHD diagnoses are a heterogeneous group with different intensities of attention deficit. Even in the DSM 5 diagnostic criteria, a child should obtain a minimum of 6 out of 9 criteria of inattention to gain an ADHD diagnosis. However, due to the lack of relevant data we could not conduct a subgroup analysis.
We planned to compare type A of ADHD associated with characteristics of inattention vs. type B of ADHD associated with characteristics of hyperactivity to check whether the results of the ANT are different for each ADHD type. Each type of ADHD is tied to one or more core symptoms. If such a difference were identified, it would be possible to predict the ADHD type based on the ANT results and to describe the pattern of the ANT results for every type of ADHD. Because the distinction between different types of ADHD was not reported in almost all studies included, we could not conduct a subgroup analysis.
3.5 Study quality
Results for the evaluation of study quality are presented in Table 3. The majority of the studies included in the meta-analysis were of high quality (the scores ranged from 5 to 9, with an average score of 7.89). Three studies (Forssman et al., 2009; Forns et al., 2014; Julvez et al., 2020) were assessed as poor quality due to the comparability of cohorts on the basis of the design or analysis. We judged the study quality in selection of participants for the study (representativeness of the exposed cohort) to be good for 15 studies and poor for 3 studies (Forssman et al., 2009; Forns et al., 2014; Julvez et al., 2020). Selection of the non-exposed cohort was assessed as having a low risk of bias (good quality) for 16 studies and high risk (poor quality) for two studies (Waldon et al., 2018; Abramov et al., 2019). Ascertainment of exposure was judged as having good for 13 studies and poor for 4 studies (Forssman et al., 2009; Forns et al., 2014; Antonini et al., 2016; Chen et al., 2022) implicated that in the majority of the included studies ADHD diagnosis was based on secure record according to psychiatrics’ or psychologists’ judgment (e.g., the subjects were evaluated jointly by a psychiatrist and a neuropediatric in an interview based on the DSM criteria and associated with the application of these criteria to the children’s parents), structured interview or self-repotted questioners (such the CONNERS 3 – Questionnaires for ADHD assessment). Demonstration that outcome of interest was not present at the start of the study was applied to all studies, where the ANT performance was provided during data collection period, not at the same time point as diagnosis of ADHD was made. In terms of bias due to comparability, the comparability of cohorts on the basis of the design or analysis was assessed as being good for 15 studies and poor for 3 studies (Forssman et al., 2009; Forns et al., 2014; Julvez et al., 2020). This means that selection of exposed and unexposed in cohort studies was from similar populations in relation to age and gender (which were established as the most important factor). The cohorts were not comparable for confounding factors in only three studies. In assessing potential bias due to ANT outcome misclassification, the review authors assessed all four domains (assessment of ANT outcome, length of follow-up, adequacy of follow up of cohorts) as having low risk of bias (good quality) for all 18 studies and high risk for no studies. In all studies assessment of ANT was based on the application of standard version of ANT (such as: ANT, ANT-C), follow-up was long enough for outcome to occur and the number of lost to follow up less or equal to 20% or description of those who lost suggested not different from those who were followed.
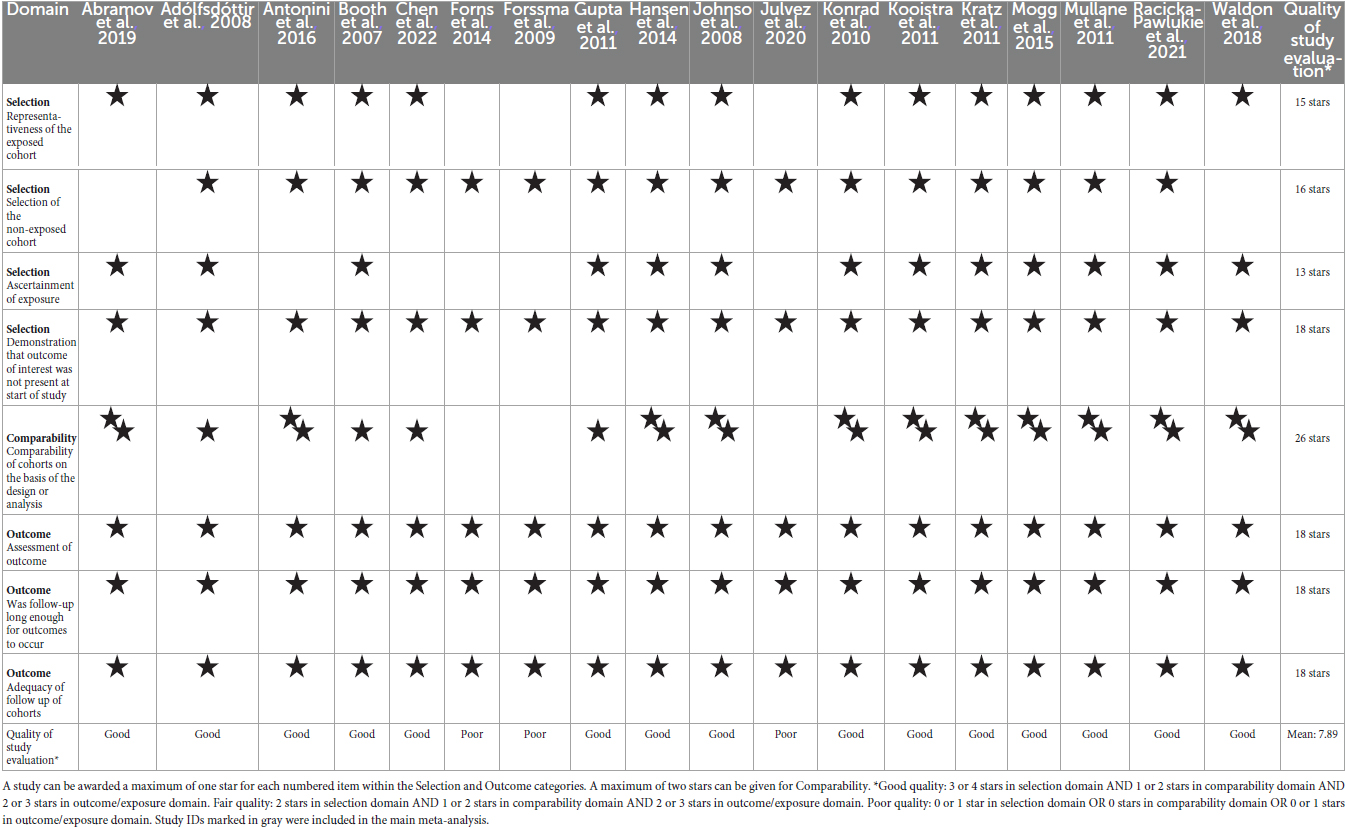
Table 3. Summary of the study quality based on the Newcastle – Ottawa quality assessment scale for cohort studies.
3.6 Certainty of evidence
Overall quality of evidence with the GRADE evaluation along with the results are presented in Table 4. Because only observational studies were included, we started the rating with “moderate” quality for all outcomes. In the end, the evidence for three outcomes (Executive Network scores; Alerting Network scores and Orienting Network Scores, all for ADHD) was judged to be “moderate,” while other for the two outcomes (Reaction time and Reaction time variability, both for ADHD) it was “low.” Executive Network scores, Alerting Network scores, Orienting Network Scores, Correctness, Reaction time and Reaction time variability (all for risk of ADHD) were of “very low evidence.”
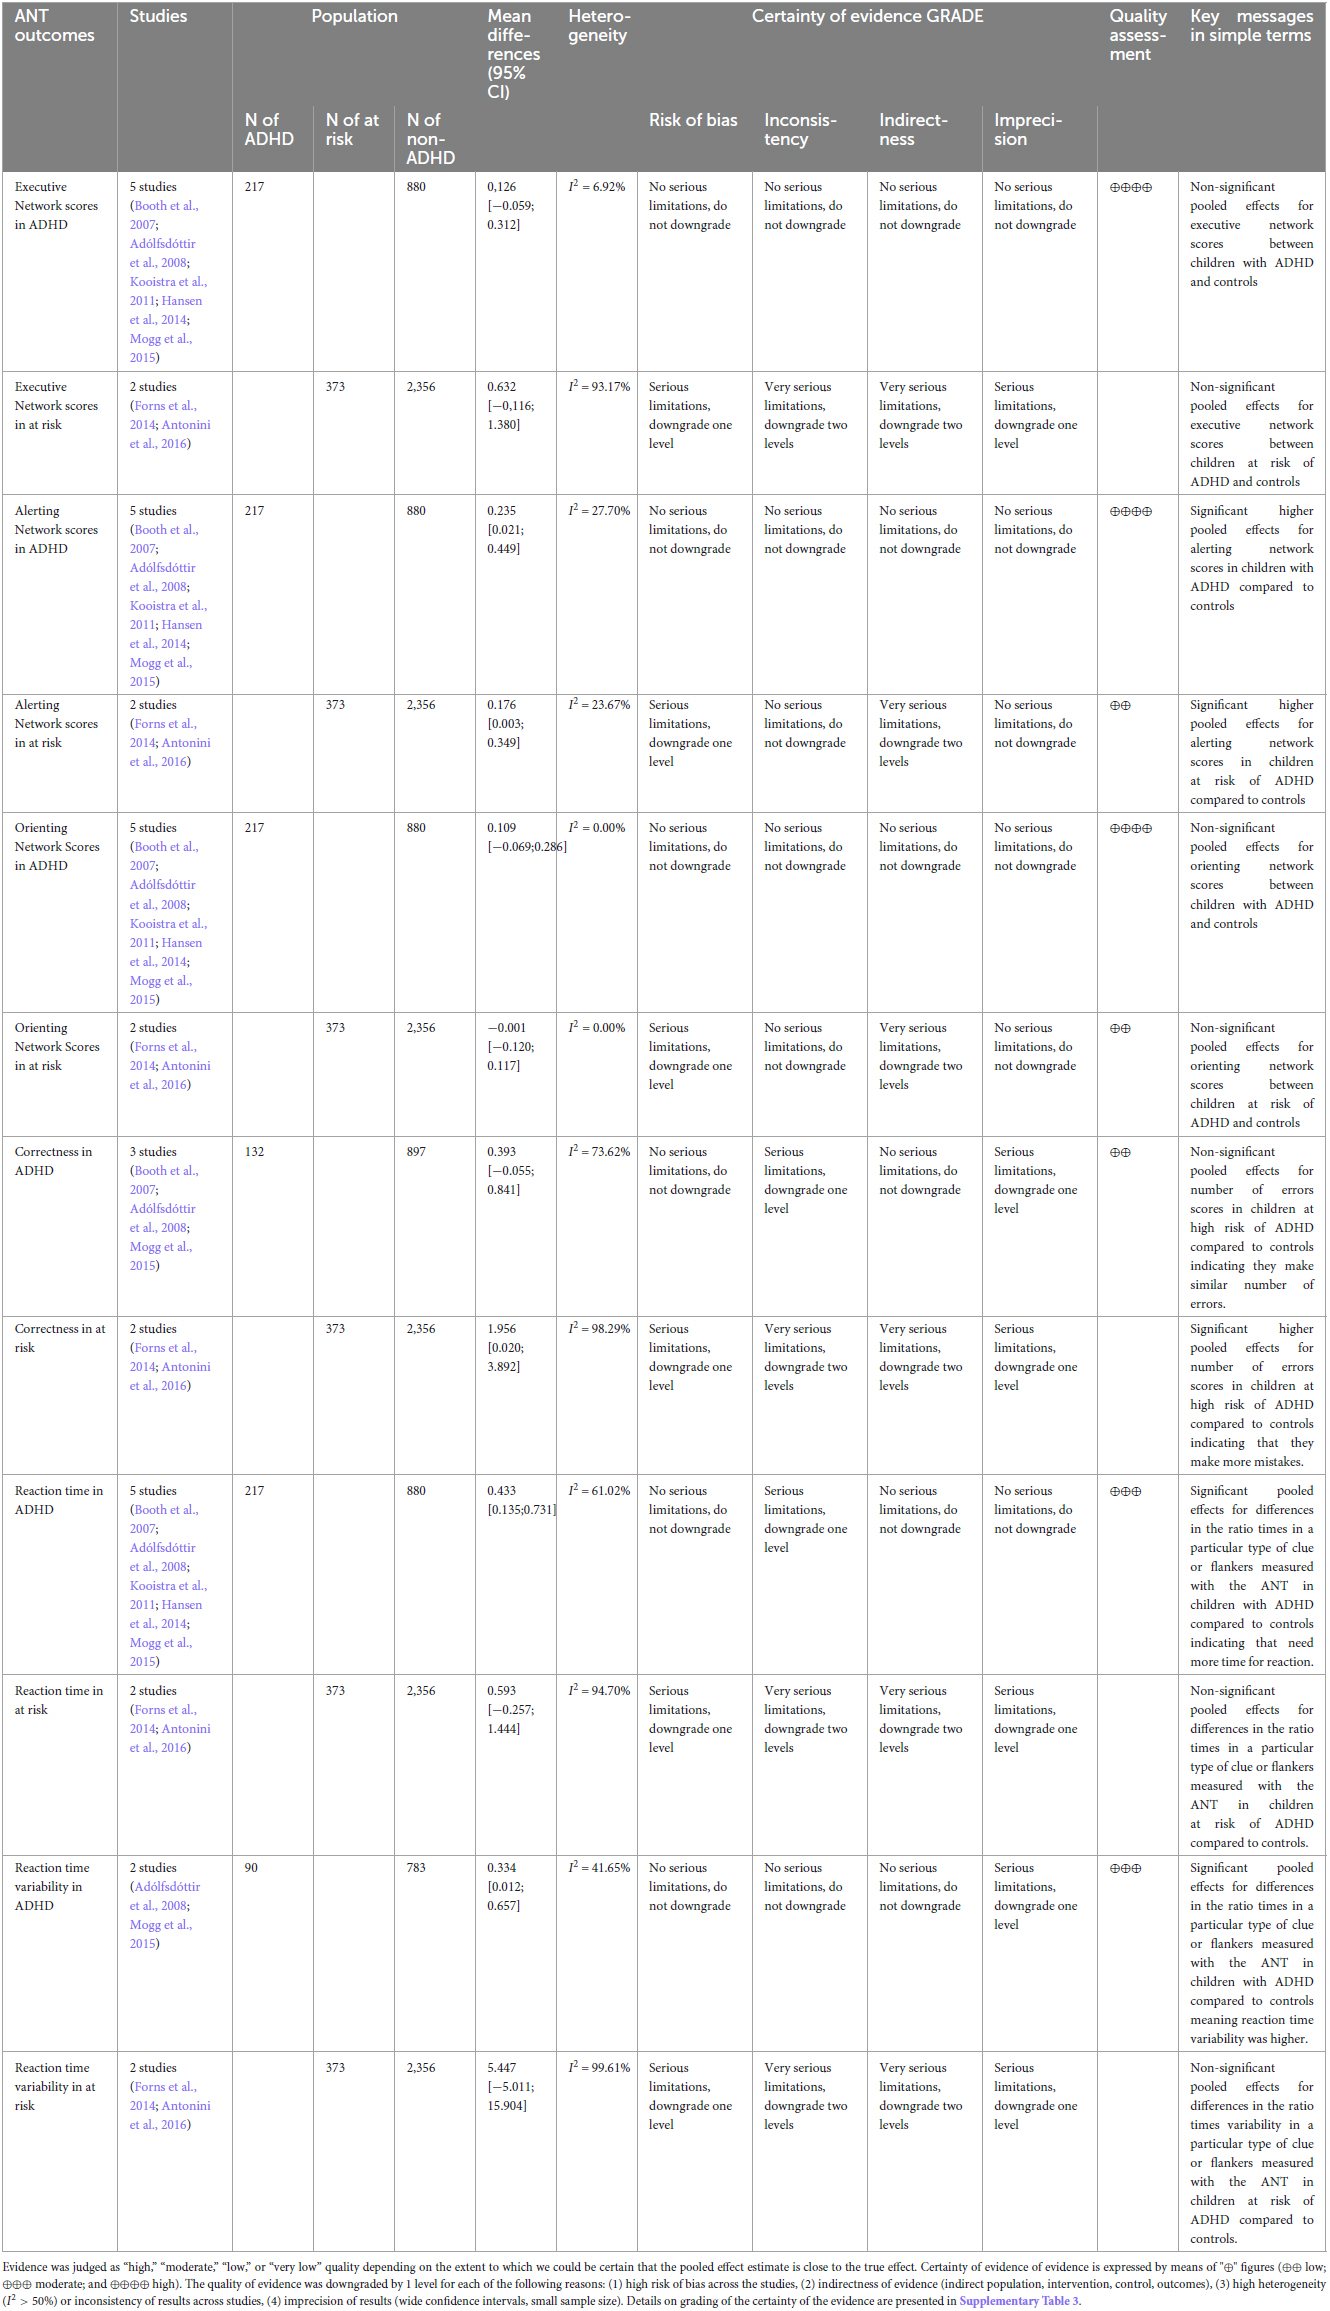
Table 4. Overall quality of evidence and the GRADE evaluation.
4 Discussion
Although ADHD and attention measured with the attention network test (ANT) has long been of interest (Vázquez-Marrufo et al., 2019; Arora et al., 2020); to the best of our knowledge, this is the first meta-analysis to examine patterns of ANT performance results for children with ADHD and at risk of ADHD including the efficiency of the attention network, reaction time, and number of all types of errors.
4.1 Executive, alerting, and orienting networks
Our primary question pertained to differences in the efficiency of functioning of the three attention networks measured with the ANT between children diagnosed with ADHD, at risk of ADHD, and children without ADHD. Based on our pooled data, we did not observe significant differences in Executive Network scores between children with ADHD and controls nor children at risk of ADHD and controls. Interestingly, there were significant pooled effects for Alerting Network scores, which were significantly higher in both children with ADHD and children at risk of ADHD compared to children without ADHD. The most surprising result is that no significant differences were found between children with ADHD or children at risk of ADHD and children without ADHD for the orienting network. Taken together, these results seem to suggest that children with ADHD and at risk of ADHD perform the ANT differently to children without ADHD only in terms of the alerting network, while executive and orienting outcomes did not manifest in any difference in behaviors. There are several possible explanations for this result.
Focusing on an attentional alerting network, one study by Hansen et al. (2014) stands out from other studies involved in the analyses (an outliner). We believe that this is due to the methodological issues such as diagnostic measurement tool used (the Schedule for Affective Disorders and Schizophrenia for School-age Children - Present and Lifetime Version) dedicated to anxiety, depression, mania, obsessive-compulsive disorder, anorexia nervosa, etc., rather than ADHD. In addition, the version of the diagnostic tool used in this study dates back to 1997 – as we know, quite a bit in the diagnosis of ADHD has moved forward since then. Third, we assume that the target population might not fully reflect a typical group of children with ADHD because of the more inclusive diagnostic criteria used for the study purpose.
The between-group differences in the efficiency of alerting indicate the specific dysfunction of this attentional network in ADHD. Rueda et al. (2004) and Posner et al. (2012) maintain that older children and adults should rely on internal tonic alertness rather than external signal warnings (typical for younger children). In younger children, they observed much higher scores for attentional alerting on the ANT-C, while the scores for older children and adults were much smaller. For instance, in the study of Rueda et al. (2004), children aged 10 years had greater scores than adults for attentional alerting on ANT-C, as they had longer response times for conditions with no alerting clues. Thus, the obtained result in our meta-analysis may reflect underdevelopment of the alerting network in children with ADHD.
Attentional alerting has a neural basis in the posterior area, thalamus, locus coeruleus, and frontal area (Posner and Rothbart, 2007; Posner and Fan, 2008). The meta-analysis of Dickstein et al. (2006) found that individuals with ADHD present with hypoactivation mostly in the fronto-striatal and parietal regions. In a study conducted by Cortese et al. (2012), children with ADHD, in comparison to controls, presented hypoactivation in the frontoparietal attention network (including the lateral frontal pole, dorsal anterior cingulate, dorsolateral anterior prefrontal cortex, lateral cerebellum, anterior insula, and inferior parietal lobe) and ventral attention network (including the temporoparietal junction, the supramarginal gyrus, frontal operculum, and anterior insula). Hyperactivation was observed predominantly in the default network, but also in the somatomotor and visual systems. This observation is consistent with the classical model of ADHD as a disorder of deficient fronto-striatal activation (Castellanos, 1997) and supports a model of ADHD based on interrelationships among neural networks (Cortese et al., 2012). Banich et al. (2009) found that young adults with ADHD performing attentional tasks present neural dysregulation across brain regions, including those involved in overall arousal, top-down attentional control, response selection, and inhibition. For sustained attentional control, the dysregulation was the greatest in lateral areas of the dorsolateral prefrontal cortex, while for transient aspects of attentional control it was greatest in medial regions of the dorsolateral prefrontal cortex. Furthermore, using a fNIRS-based method, Ikeda et al. (2022) found robustly lower hemodynamic responses in the right prefrontal cortex during an inhibition task (a go/no-go task) in children with ADHD in comparison to controls. According to Castellanos and Proal (2012) as well as Makris et al. (2009), in ADHD, we can observe disturbed connectivity within and among several neural networks, rather than abnormalities of discrete, isolated brain regions.
The obtained results have clinical implication. The significant differences in the attentional alerting in comparison with non-significant differences in executive attention and orienting point out that children with ADHD or at risk of ADHD experience particular difficulties in maintaining internal tonic alertness during prolonged cognitive activities. While the ability to orient attention to external stimuli as well as the ability to deal with distracting stimulus seems to be less affected. From the diagnostic point of view, the results stress that the assessor should be focused more on specific diagnostic criteria dedicated to inattentive such us: experience difficulties staying alert on tasks or activities (e.g., reading or writing), following instructions and completing ongoing schoolwork, losing quickly focus, avoiding assignments requiring sustained mental effort. Because these aforementioned diagnostic symptoms in the light of obtained outcomes seem to be key symptoms helping to differencing children from clinical group from non-ADHD group. It follows from this as well, intervention should be focused on resources linked with being able to maintain alertness rather than executive attention or orienting of attention.
4.2 Correctness
One of the secondary questions in this meta-analysis was whether primary-school-age children diagnosed with ADHD or at risk of ADHD show differences in Correctness scores compared to children without ADHD, including numbers of Commission and Omission Errors, measured with ANT. The current review found that children at risk of ADHD had higher error scores compared with controls, indicating that they make more mistakes; this was not observed in the group of children diagnosed with ADHD. A possible explanation might be that children who had already been diagnosed with ADHD participate in therapies focused on improving such abilities. There are, however, other possible explanations. Although other researchers (Klee and Garfinkel, 1983; Eliason and Richman, 1987; Barkley, 1991; Halperin et al., 1991; Corkum and Siegel, 1993; Lassiter et al., 1994; Epstein et al., 1998; Inoue et al., 1998) have indicated that omission errors reflect symptoms of inattention, Barkley (1991) found that correlations between omission errors and measures of inattention are low to moderate. Moreover, according to Losier et al. (1996), children with ADHD treated with methylphenidate present significant reductions in the rate of omission errors. Perhaps this is why such errors manifested only in the ADHD risk group in our meta-analysis, as these children participate in therapies (incl. pharmacotherapy) more rarely than diagnosed children and thus symptoms of inattention are much greater in this cohort. The obtained results have also clinical implication. From therapeutic perspective, it would be more effective if therapy would have focused on reflective and slower work approach, which would contribute to less errors made.
4.3 Reaction time and reaction time variability
The next secondary question was whether primary-school-aged children diagnosed with ADHD or who are at risk of ADHD demonstrate differences relative to children without ADHD in reaction times on a particular type of clue or flanker task measured with the ANT. The interesting and clinically relevant finding was that Reaction Time was longer and Reaction Time Variability higher in children with ADHD than in children without ADHD and children at risk of ADHD compared with children without ADHD. Of note, Epstein et al. (2011) as well as Karalunas et al. (2012) described these findings earlier in their studies. It seems possible that this general slowing might indicate a variety of unspecified difficulties with basic cognitive processes (Hervey et al., 2006), and higher Reaction Time Variability reflects greater fluctuations and lapses of attention among children with ADHD (Van der Molen, 1996). Several researchers (Douglas, 1999) have noted that performance variability is important in ADHD and reaction time is an important reflection of attention. The results of our meta-analysis indicate that it is not the case that children with ADHD cannot pay attention at all, but rather they present attention lapses more frequently than do controls. According to Castellanos and Tannock (2002), performance variability is the essence of ADHD and temporal and contextual variables play an important role in this inconsistency. Neuroimaging studies (Giedd et al., 2001) have identified that response variability is related to a distributed brain network including the frontal lobes, which is consistently implicated in the pathophysiology of ADHD.
All activities that require time control or are under time limit will make challenge for the school-age children due to their limitations. The obtained results have practical implication suggesting that children from clinical group (ADHD and at risk of ADHD) will need more time to follow instructions, complete ongoing tasks or experience challenges in time managing. It also refers to the observation of high prevalence of learning disorders comorbidity among children with ADHD.
4.4 Implications for research and practice
The findings of this review have important implications for future practice. It may be possible that the characteristic patterns of ANT results in children with ADHD can be used as a reference point to help determine whether a given intervention (psychological, pharmacological, or other) used to reduce attention deficits in children is effective and results in actual, statistically significant differences in the efficiency of the attention networks. We anticipate that our review could bring rationale for researchers to furthering research into the use of the ANT for more comprehensive diagnosis of attention disorders in children, including ADHD.
4.5 Limitations
Some limitations of these results must be acknowledged, both at the review level and at the study level.
First, we used a comprehensive search strategy including both searching electronic databases and manually searching the reference lists of the included studies; as such, we believe this systematic review contains all relevant studies that have been conducted in this field. However, the searching strategy was limited to MeSH heading for Attention Deficit Disorder with Hyperactivity according to DSM-V. In addition, it is possible that there are unpublished studies (e.g., conference abstracts and other gray literature) of which we are not aware. Unpublished studies can be an important source of studies for inclusion in reviews.
Second, despite an exhaustive search, we were not able to identify intervention studies; thus, only prospective cohort studies were included. Intervention studies measuring treatment effects with ANT do exist, but they failed to meet the rigorous requirements of the pre-specified eligibility criteria.
Originally, we had also planned to extract information about the intensity of ADHD symptoms and use them to check whether ANT results get worse as the severity of ADHD symptoms increases (Gradys et al., 2022). However, there were considerable discrepancies in the types of tools used to diagnose ADHD, which made such a comparison unfeasible.
Forth, we also aimed to extract data on the type of ADHD (type A vs. type B) to check whether the results of the ANT are different for each ADHD type. Despite the effort expended to obtain this data, the articles included in the meta-analysis did not provide it in all cases, preventing evaluation of whether ADHD type predicts the pattern of ANT results.
Further, we aimed to check whether the version of the ANT used affects the results obtained by all children. However, it was not possible to answer this research question because the majority of studies used the same ANT version (namely ANT-C). The fact that we could not meet all the objectives of this systematic review means that further research should be conducted, as some questions still remain unanswered.
Fifth, the limited number of studies per outcome (e.g., only two studies had data on Reaction Time Variability scores for children with ADHD and at risk of ADHD) impacted that we were not able to conduct any sub-group analysis due to the lack of relevant data.
The comprehensiveness of our review was also impacted by the limited sample size of children diagnosed with ADHD or at risk of ADHD compared to controls. Larger sample sizes would allow us to better test the study objectives.
Finally, the generalizability of these results is restricted to children of primary school age. In terms of the study-level limitations, there is a need to acknowledge the high heterogeneity of the internal validity of the individual studies (such as the varied presence of psychiatric comorbidities and wide array of medicated/non-medicated subjects for the ANT); thus, obtained data must be interpreted with caution. Of note, recently there has been a debate among researchers about the problematic use of difference scores, and the treatment of errors and reaction time as separable measures (e.g., Rodebaugh et al., 2016; Hedge et al., 2018). Researchers points that the difference scores (results obtained as a subtractions of basic outcomes such as the result of the subtraction of the RT in one test condition from the outcome from the other test condition) have very low reliability as individuals may present very large differences in overall RTs (for instance the difference between 2,000 ms in one condition and 3,000 ms in another condition for one person would be two times greater than the difference between 1,000 ms in the same one condition and 1,500 ms in the same another condition for the other person; in such a situation a person whose result of subtraction would be greater would be gratified for longer reactions overall). Moreover, they indicate a problem with poor correlation between difference scores made up of RTs when treated as indices of identical cognitive processes. Future studies should consider these caveats.
5 Conclusion
Notwithstanding the limitations, the findings indicate that children with ADHD and at risk of ADHD perform the ANT differently to children without ADHD, getting lower scores only in terms of the alerting network; executive and orienting outcomes did not manifest any difference in behaviors measured with the ANT. The results confirmed that children at risk of ADHD also made more errors (commission and omission) measured with the ANT compared to children without ADHD. Finally, reaction times were longer and reaction time variability higher in children with ADHD than in children without ADHD and in children at risk of ADHD compared with children without ADHD.
Author contributions
ŁB took part in the conceptualization of the project, provided specialist knowledge in the systematic review methodology, conducted the project administration, supervised all the steps, resolved discrepancies during the assessment of the study quality stage, and took part in writing the original draft and the final manuscript. GG searched databases and manually searched the reference list of the included articles, screened titles and abstracts of the papers found, supported data extraction, conducted the project administration, and took part in writing the original draft as well as editing and reviewing the manuscript. ML took part in the conceptualization, assessment of the study and evidence quality, provided specialist knowledge of ADHD, raised funds for the publication of the manuscript, and supported editing and reviewing the manuscript. AMD designed, conducted, and interpreted the meta-analyses, and took part in editing and reviewing the manuscript. TW-K screened titles and abstracts for their eligibility for inclusion, resolved discrepancies during the assessment of the study quality stage, and took part in writing the original draft as well as editing and reviewing the manuscript. KS-W extracted data from the included studies, and assessment of the evidence quality. AŁ-M extracted data from the included studies, editing and reviewing the manuscript. KL and PA-W extracted data from the included studies. MH helped assess study quality. All authors reviewed and accepted the final manuscript.
Funding
The costs of publishing the article was fully financed by “NeuroSmog: the impact of air pollution on the developing brain” no. POIR.04.04.00-00-1763/18 carried out within the TEAM NET programme of the Foundation for Polish Science co-financed by the European Union under the European Regional Development Fund. AMD’s time on this manuscript is partially supported by the “Strategic Research and Innovation Program for the Development of Medical University–Plovdiv” No BG-RRP-2.004-0007-C01, Establishment of a Network of Research Higher Schools, National plan for recovery and resilience, financed by the European Union–NextGenerationEU. The funding bodies do not influence the design of the study and the writing of the manuscript.
Conflict of interest
The authors declare that the research was conducted in the absence of any commercial or financial relationships that could be construed as a potential conflict of interest.
Publisher’s note
All claims expressed in this article are solely those of the authors and do not necessarily represent those of their affiliated organizations, or those of the publisher, the editors and the reviewers. Any product that may be evaluated in this article, or claim that may be made by its manufacturer, is not guaranteed or endorsed by the publisher.
Supplementary material
The Supplementary Material for this article can be found online at: https://www.frontiersin.org/articles/10.3389/fnins.2023.1246490/full#supplementary-material
References
Abramov, D. M., Cunha, C. Q., Galhanone, P. R., Alvim, R. J., de Oliveira, A. M., and Lazarev, V. V. (2019). Neurophysiological and behavioral correlates of alertness impairment and compensatory processes in ADHD evidenced by the Attention Network Test. PLoS One 14:e0219472. doi: 10.1371/journal.pone.0219472
Adólfsdóttir, S., Sørensen, L., and Lundervold, A. J. (2008). The attention network test: a characteristic pattern of deficits in children with ADHD. Behav. Brain Funct. 4:9. doi: 10.1186/1744-9081-4-9
American Psychiatric Association (2013). Diagnostic and Statistical Manual of Mental Disorders, 5th Edn. Washington, DC: American Psychiatric Association, doi: 10.1176/appi.books.9780890425596
Antonini, T. N., Kingery, K. M., Narad, M. E., Langberg, J. M., Tamm, L., and Epstein, J. N. (2016). Neurocognitive and behavioral predictors of math performance in children with and without ADHD. J. Atten. Disord. 20, 108–118. doi: 10.1177/1087054713504620
Arora, S., Lawrence, M. A., and Klein, R. M. (2020). The attention network test database: ADHD and cross-cultural applications [Original Research]. Front. Psychol. 11:388. doi: 10.3389/fpsyg.2020.00388
Banich, M. T., Burgess, G. C., Depue, B. E., Ruzic, L., Bidwell, L. C., Hitt-Laustsen, S., et al. (2009). The neural basis of sustained and transient attentional control in young adults with ADHD. Neuropsychologia 47, 3095–3104. doi: 10.1016/j.neuropsychologia.2009.07.005
Barkley, R. A. (1991). The ecological validity of laboratory and analogue assessment methods of ADHD symptoms. J. Abnorm. Child Psychol. 19, 149–178. doi: 10.1007/bf00909976
Barnow, S., Schuckit, M., Smith, T., Spitzer, C., and Freyberger, H.-J. (2007). Attention problems among children with a positive family history of alcohol abuse or dependence and controls prevalence and course for the period from preteen to early teen years. Eur. Addict. Res. 13, 1–5. doi: 10.1159/000095808
Booth, J. E., Carlson, C. L., and Tucker, D. M. (2007). Performance on a neurocognitive measure of alerting differentiates ADHD combined and inattentive subtypes: a preliminary report. Arch. Clin. Neuropsychol. 22, 423–432. doi: 10.1016/j.acn.2007.01.017
Bouchard, G., and Saint-Aubin, J. (2014). Attention deficits and divorce. Can. J. Psychiatry 59, 480–486. doi: 10.1177/070674371405900904
Brandt, J. (2019). Diet in brain health and neurological disorders: Risk factors and treatments. Brain Sci. 9:234. doi: 10.3390/brainsci9090234
Callejas, A., Lupiáñez, J., and Tudela, P. (2004). The three attentional networks: On their independence and interactions. Brain Cogn. 54, 225–227. doi: 10.1016/j.bandc.2004.02.012
Castellanos, F. X. (1997). Toward a pathophysiology of attention-deficit/hyperactivity disorder. Clin. Pediatr. 36, 381–393. doi: 10.1177/000992289703600702
Castellanos, F. X., and Proal, E. (2012). Large-scale brain systems in ADHD: beyond the prefrontal-striatal model. Trends Cogn. Sci. 16, 17–26. doi: 10.1016/j.tics.2011.11.007
Castellanos, F. X., and Tannock, R. (2002). Neuroscience of attention-deficit/hyperactivity disorder: the search for endophenotypes. Nat. Rev. Neurosci. 3, 617–628. doi: 10.1038/nrn896
Chen, C., Li, Z., Liu, X., Pan, Y., and Wu, T. (2022). Cognitive control deficits in children with subthreshold attention-deficit/hyperactivity disorder [Original Research]. Front. Hum. Neurosci. 16:835544. doi: 10.3389/fnhum.2022.835544
Cohen, J. (1992). Statistical power analysis. Curr. Dir. Psychol. 1, 98–101. doi: 10.1111/1467-8721.ep10768783
Corkum, P. V., and Siegel, L. S. (1993). Is the continuous performance task a valuable research tool for use with children with attention-deficit-hyperactivity disorder? Child Psychol. Psychiatry Allied Discipl. 34, 1217–1239. doi: 10.1111/j.1469-7610.1993.tb01784.x
Cortese, S., Kelly, C., Chabernaud, C., Proal, E., Di Martino, A., Milham, M. P., et al. (2012). Toward systems neuroscience of ADHD: a meta-analysis of 55 fMRI studies. Am. J. Psychiatry 169, 1038–1055. doi: 10.1176/appi.ajp.2012.11101521
Daley, D., and Birchwood, J. (2010). ADHD and academic performance: why does ADHD impact on academic performance and what can be done to support ADHD children in the classroom? Child 36, 455–464. doi: 10.1111/j.1365-2214.2009.01046.x
Dickstein, S. G., Bannon, K., Castellanos, F. X., and Milham, M. P. (2006). The neural correlates of attention deficit hyperactivity disorder: an ALE meta-analysis. J. Child Psychol. Psychiatry 47, 1051–1062. doi: 10.1111/j.1469-7610.2006.01671.x
Doi, S. A. R., Barendregt, J. J., Khan, S., Thalib, L., and Williams, G. M. (2015). Advances in the meta-analysis of heterogeneous clinical trials I: The inverse variance heterogeneity model. Contemp. Clin. Trials 45, 130–138. doi: 10.1016/j.cct.2015.05.009
Doi, S. A. R., Furuya-Kanamori, L., Thalib, L., and Barendregt, J. J. (2017). Meta-analysis in evidence-based healthcare: a paradigm shift away from random effects is overdue. Int. J. Evidence-Based Healthcare 15, 152–160. doi: 10.1097/xeb.0000000000000125
Douglas, V. I. (1999). “Cognitive control processes in attention-deficit/hyperactivity disorder,” in Handbook of disruptive behavior disorders, eds H. C. Quay and A. E. Hogan (Amsterdam: Kluwer Academic), 105–138.
DuPaul, G. J., Reid, R., Anastopoulos, A. D., and Power, T. J. (2014). Assessing ADHD symptomatic behaviors and functional impairment in school settings: impact of student and teacher characteristics. Sch. Psychol. Q. 29, 409–421. doi: 10.1037/spq0000095
Eapen, B. R. (2006). EndNote 7.0. Ind. J. Dermatol. Venereol. Leprol. 72, 165–166. doi: 10.4103/0378-6323.25654
Eliason, M. J., and Richman, L. C. (1987). The continuous performance test in learning disabled and nondisabled children. J. Learn. Disabil. 20, 614–619. doi: 10.1177/002221948702001007
Epstein, J. N., Conners, C. K., Sitarenios, G., and Erhardt, D. (1998). Continuous performance test results of adults with attention deficit hyperactivity disorder. Clin. Neuropsychol. 12, 155–168. doi: 10.1076/clin.12.2.155.2000
Epstein, J. N., Langberg, J. M., Rosen, P. J., Graham, A., Narad, M. E., Antonini, T. N., et al. (2011). Evidence for higher reaction time variability for children with ADHD on a range of cognitive tasks including reward and event rate manipulations. Neuropsychology 25, 427–441.
Fan, J., Gu, X., Guise, K. G., Liu, X., Fossella, J., Wang, H., et al. (2009). Testing the behavioral interaction and integration of attentional networks. Brain Cogn. 70, 209–220. doi: 10.1016/j.bandc.2009.02.002
Fan, J., McCandliss, B. D., Sommer, T., Raz, A., and Posner, M. I. (2002). Testing the efficiency and independence of attentional networks. J. Cogn. Neurosci. 14, 340–347. doi: 10.1162/089892902317361886
Forns, J., Esnaola, M., López-Vicente, M., Suades-González, E., Alvarez-Pedrerol, M., Julvez, J., et al. (2014). The n-back test and the attentional network task as measures of child neuropsychological development in epidemiological studies. Neuropsychology 28, 519–529. doi: 10.1037/neu0000085
Forssman, L., Bohlin, G., Lundervold, A. J., Taanila, A., Heiervang, E., Loo, S., et al. (2009). Independent contributions of cognitive functioning and social risk factors to symptoms of ADHD in two nordic populations-based cohorts. Dev. Neuropsychol. 34, 721–735. doi: 10.1080/87565640903265111
Giedd, J. N., Blumenthal, J., Molloy, E., and Castellanos, F. X. (2001). Brain imaging of attention deficit/hyperactivity disorder. Ann. N. Y. Acad. Sci. 931, 33–49. doi: 10.1111/j.1749-6632.2001.tb05772.x
Gignac, G. E., and Szodorai, E. T. (2016). Effect size guidelines for individual differences researchers. Pers. Individ. Differ. 102, 74–78. doi: 10.1016/j.paid.2016.06.069
Gradys, G., Lipowska, M., and Bieleninik, Ł, and Dzhambov, A. M. (2022). Attention deficit in children with attention deficit hyperactivity disorder at primary school age measured with the attention network test (ANT): A protocol for a systematic review and meta-analysis. PLoS One 17:e0275599. doi: 10.1371/journal.pone.0275599
Greene, D. J., Barnea, A., Herzberg, K., Rassis, A., Neta, M., Raz, A., et al. (2008). Measuring attention in the hemispheres: the lateralized attention network test (LANT). Brain Cogn. 66, 21–31. doi: 10.1016/j.bandc.2007.05.003
Gupta, R., Kar, B. R., and Srinivasan, N. (2011). Cognitive-motivational deficits in ADHD: development of a classification system. Child Neuropsychol. 17, 67–81. doi: 10.1080/09297049.2010.524152
Halperin, J. M., Sharma, V., Greenblatt, E. R., and Schwartz, S. T. (1991). Assessment of the Continuous Performance Test: Reliability and validity in a nonreferred sample. Psychol. Assess. 3, 603–608.
Hansen, B. H., Skirbekk, B., Oerbeck, B., Wentzel-Larsen, T., and Kristensen, H. (2014). Associations between sleep problems and attentional and behavioral functioning in children with anxiety disorders and ADHD. Behav. Sleep Med. 12, 53–68. doi: 10.1080/15402002.2013.764525
Harpin, V. A. (2005). The effect of ADHD on the life of an individual, their family, and community from preschool to adult life. Arch. Dis. Childhood 1, (Suppl. 1), i2–i7. doi: 10.1136/adc.2004.059006
Hedge, C., Powell, G., Bompas, A., Vivian-Griffiths, S., and Sumner, P. (2018). Low and variable correlation between reaction time costs and accuracy costs explained by accumulation models: Meta-analysis and simulations. Psychol. Bull. 144: 1200.
Hervey, A. S., Epstein, J. N., Curry, J. F., Tonev, S., Eugene Arnold, L., Keith Conners, C., et al. (2006). Reaction time distribution analysis of neuropsychological performance in an ADHD sample. Child Neuropsychol. 12, 125–140. doi: 10.1080/09297040500499081
Higgins, J. P., Li, T., and Deeks, J. J. (2022). “Chapter 6: Choosing effect measures and computing estimates of effect, 6.5.2.10 Combining groups,” in Cochrane Handbook for Systematic Reviews of Interventions. Version 6.3 (updated February 2022), eds J. P. T. Higgins, J. Thomas, J. Chandler, M. Cumpston, T. Li, M. J. Paige, et al. (London: Cochrane).
Higgins, J. P., and Thompson, S. G. (2002). Quantifying heterogeneity in a meta-analysis. Stat. Med. 21, 1539–1558. doi: 10.1002/sim.1186
Ikeda, T., Inoue, A., Nagashima-Kawada, M., Tokuda, T., Yamagata, T., Dan, I., et al. (2022). Neural Bases of Executive Function in ADHD Children as Assessed Using fNIRS. Front. Clin. Drug Res. 10:188–225. doi: 10.2174/9789815040678122100006
Inoue, K., Nadaoka, T., Oiji, A., Morioka, Y., Totsuka, S., Kanbayashi, Y., et al. (1998). Clinical Evaluation of Attention-Deficit Hyperactivity Disorder by Objective Quantitative Measures. Child Psychiatry Hum. Dev. 28, 179–188. doi: 10.1023/A:1022885827086
Johnson, K. A., Robertson, I. H., Barry, E., Mulligan, A., Dáibhis, A., Daly, M., et al. (2008). Impaired conflict resolution and alerting in children with ADHD: evidence from the Attention Network Task (ANT). J. Child Psychol. Psychiatry Allied Discipl. 49, 1339–1347. doi: 10.1111/j.1469-7610.2008.01936.x
Julvez, J., Fernández-Barrés, S., Gignac, F., López-Vicente, M., Bustamante, M., Garcia-Esteban, R., et al. (2020). Maternal seafood consumption during pregnancy and child attention outcomes: a cohort study with gene effect modification by PUFA-related genes. Int. J. Epidemiol. 49, 559–571. doi: 10.1093/ije/dyz197
Karalunas, S. L., Huang-Pollock, C. L., and Nigg, J. T. (2012). Decomposing attention-deficit/hyperactivity disorder (ADHD)-related effects in response speed and variability. Neuropsychology 26:684.
Klee, S. H., and Garfinkel, B. D. (1983). The computerized continuous performance task: A new measure of inattention. J. Abnorm. Child Psychol. 11, 487–495. doi: 10.1007/BF00917077
Konrad, K., Dempfle, A., Friedel, S., Heiser, P., Holtkamp, K., Walitza, S., et al. (2010). Familiality and molecular genetics of attention networks in ADHD. Am. J. Med. Genet. Part B: Neuropsychiatr. Genet. 153B, 148–158. doi: 10.1002/ajmg.b.30967
Kooistra, L., Crawford, S., Gibbard, B., Kaplan, B. J., and Fan, J. (2011). Comparing Attentional Networks in fetal alcohol spectrum disorder and the inattentive and combined subtypes of attention deficit hyperactivity disorder. Dev. Neuropsychol. 36, 566–577. doi: 10.1080/87565641.2010.549978
Krakowski, A. D., Cost, K. T., Anagnostou, E., Lai, M.-C., Crosbie, J., Schachar, R., et al. (2020). Inattention and hyperactive/impulsive component scores do not differentiate between autism spectrum disorder and attention-deficit/hyperactivity disorder in a clinical sample. Mol. Autism 11:28. doi: 10.1186/s13229-020-00338-1
Kratz, O., Studer, P., Malcherek, S., Erbe, K., Moll, G. H., and Heinrich, H. (2011). Attentional processes in children with ADHD: An event-related potential study using the attention network test. Int. J. Psychophysiol. 81, 82–90. doi: 10.1016/j.ijpsycho.2011.05.008
Lassiter, K. S., D’Amato, R. C., Raggio, D. J., Whitten, J. C. M., and Bardos, A. N. (1994). The construct specificity of the continuous performance test: Does inattention relate to behavior and achievement? Dev. Neuropsychol. 10, 179–188. doi: 10.1080/87565649409540576
Lee, Y., Mikami, A. Y., and Owens, J. S. (2021). Children’s ADHD Symptoms and Friendship Patterns across a School Year. Res. Child Adolesc. Psychopathol. 49, 643–656. doi: 10.1007/s10802-021-00771-7
Liu, H., Zhou, X., Yu, G., and Sun, X. (2019). The effects of the PRISMA statement to improve the conduct and reporting of systematic reviews and meta-analyses of nursing interventions for patients with heart failure. Int. J. Nurs. Pract. 25, e12729. doi: 10.1111/ijn.12729
Losier, B. J., McGrath, P. J., and Klein, R. M. (1996). Error patterns on the continuous performance test in non-medicated and medicated samples of children with and without ADHD: a meta-analytic review. J. Child Psychol. Psychiatry All Discipl. 37, 971–987. doi: 10.1111/j.1469-7610.1996.tb01494.x
Makris, N., Biederman, J., Monuteaux, M. C., and Seidman, L. J. (2009). Towards conceptualizing a neural systems-based anatomy of attention-deficit/hyperactivity disorder. Dev. Neurosci. 31, 36–49. doi: 10.1159/000207492
McKenzie, J. E., and Brennan, S. E. (2022). “Chapter 12: Synthesizing and presenting findings using other methods,” in Cochrane Handbook for Systematic Reviews of Interventions. Version 6.3 (updated February 2022), eds J. P. T. Higgins, J. Thomas, J. Chandler, M. Cumpston, T. Li, M. J. Paige, et al. (London: Cochrane).
Mogg, K., Salum, G. A., Bradley, B. P., Gadelha, A., Pan, P., Alvarenga, P., et al. (2015). Attention network functioning in children with anxiety disorders, attention-deficit/hyperactivity disorder and non-clinical anxiety. Psychol. Med. 45, 2633–2646. doi: 10.1017/s0033291715000586
Moher, D., Liberati, A., Tetzlaff, J., and Altman, D. G. (2009). Preferred reporting items for systematic reviews and meta-analyses: the PRISMA statement. BMJ 339, b2535. doi: 10.1136/bmj.b2535
Mullane, J. C., and Klein, R. M. (2008). Literature review: Visual search by children with and without ADHD. J. Atten. Disord. 12, 44–53. doi: 10.1177/1087054707305116
Mullane, J. C., Corkum, P. V., Klein, R. M., McLaughlin, E. N., and Lawrence, M. A. (2011). Alerting, Orienting, and Executive Attention in Children With ADHD. J. Attent. Disord. 15, 310–320. doi: 10.1177/1087054710366384
Page, M. J., McKenzie, J. E., Bossuyt, P. M., Boutron, I., Hoffmann, T. C., Mulrow, C. D., et al. (2021a). The PRISMA 2020 statement: an updated guideline for reporting systematic reviews. PLoS Med. 18:e1003583. doi: 10.1371/journal.pmed.1003583
Page, M. J., McKenzie, J. E., Bossuyt, P. M., Boutron, I., Hoffmann, T. C., Mulrow, C. D., et al. (2021b). The PRISMA 2020 statement: an updated guideline for reporting systematic reviews. BMJ 372, n71. doi: 10.1136/bmj.n71
Posner, M. I., and Fan, J. (2008). “Attention as an organ system,” in Topics in Integrative Neuroscience, ed. J. R. Pomerantz (Cambridge, MA: Cambridge University Press).
Posner, M. I., and Petersen, S. E. (1990). The attention system of the human brain. Annu. Rev. Neurosci. 13, 25–42. doi: 10.1146/annurev.ne.13.030190.000325
Posner, M. I., and Rothbart, M. K. (2007). Educating the human brain. Washington, DC: American Psychological Association.
Posner, M. I., Rothbart, M. K., Sheese, B. E., and Voelker, P. (2012). Control networks and neuromodulators of early development. Dev. Psychol. 48, 827–835. doi: 10.1037/a0025530
Racicka-Pawlukiewicz, E., Kuć, K., Bielecki, M., Hanć, T., Cybulska-Klosowicz, A., and Bryńska, A. (2021). The Association between Executive Functions and Body Weight/BMI in Children and Adolescents with ADHD. Brain Sci. 11:20178. doi: 10.3390/brainsci11020178
Roberts, S. D., McDonald, K. P., Danguecan, A., Crosbie, J., Westmacott, R., Andrade, B., et al. (2019). Longitudinal Academic Outcomes of Children with Secondary Attention Deficit/Hyperactivity Disorder following Pediatric Stroke. Dev. Neuropsychol. 44, 368–384. doi: 10.1080/87565641.2019.1613660
Roberts, W., Milich, R., and Barkley, R. A. (2015). “Primary symptoms, diagnostic criteria, subtyping, and prevalence of ADHD,” in Attention-deficit hyperactivity disorder: A handbook for diagnosis and treatment, 4th Edn, ed. R. A. Barkley (London: Guilford Press), 51–80.
Roca, J., Castro, C., López-Ramón, M. F., and Lupiáñez, J. (2011). Measuring vigilance while assessing the functioning of the three attentional networks: the ANTI-Vigilance task. J. Neurosci. Methods 198, 312–324. doi: 10.1016/j.jneumeth.2011.04.014
Rodebaugh, T. L., Scullin, R. B., Langer, J. K., Dixon, D. J., Huppert, J. D., Bernstein, A., et al. (2016). Unreliability as a threat to understanding psychopathology: The cautionary tale of attentional bias. J. Abnorm. Psychol. 125:840.
Rueda, M. R., Fan, J., McCandliss, B. D., Halparin, J. D., Gruber, D. B., Lercari, L. P., et al. (2004). Development of attentional networks in childhood. Neuropsychologia 42, 1029–1040. doi: 10.1016/j.neuropsychologia.2003.12.012
Rutter, T. M., and Arnett, A. B. (2021). Temperament Traits Mark Liability for Coexisting Psychiatric Symptoms in Children With Elevated ADHD Symptoms. J. Attention Disord. 25, 1871–1880. doi: 10.1177/1087054720943282
Schäfer, T., and Schwarz, M. A. (2019). The Meaningfulness of Effect Sizes in Psychological Research: Differences Between Sub-Disciplines and the Impact of Potential Biases. Front. Psychol. 10:813. doi: 10.3389/fpsyg.2019.00813
Schneider, S. L. (2013). “The International Standard Classification of Education 2011,” in Class and Stratification Analysis, Vol. 30, ed. G. Elisabeth Birkelund (Bingley: Emerald Group Publishing Limited), 365–379. doi: 10.1108/S0195-631020130000030017
Schünemann, H., Brożek, J., Guyatt, G., and Oxman, A. (2013). GRADE handbook for grading quality of evidence and strength of recommendations. Updated October 2013. Rochester, MN: The GRADE Working Group.
Siqueira, C. M., and Gurge-Giannetti, J. (2011). Poor school performance: an updated review. Rev. Assoc. Méd. Brasil. 57, 78–86. doi: 10.1016/S2255-4823(11)70021-2
Thomas, R., Sanders, S., Doust, J., Beller, E., and Glasziou, P. (2015). Prevalence of attention-deficit/hyperactivity disorder: a systematic review and meta-analysis. Pediatrics 135, e994–e1001. doi: 10.1542/peds.2014-3482
Van der Molen, M. W. (1996). “Energetics and the reaction process: Running threads through experimental psychology,” in Handbook of Perception and Action, Vol. III, eds O. Neumann and A. F. Sanders (Cambridge, MA: Academic Press), 229–275.
Vázquez-Marrufo, M., García-Valdecasas Colell, M., Galvao-Carmona, A., Sarrias-Arrabal, E., and Tirapu-Ustárroz, J. (2019). The Attention Network Test in the study of cognitive impairment of ADHD patients. Rev. Neurol. 69, 423–432. doi: 10.33588/rn.6910.2019202
Waldon, J., Vriend, J., Davidson, F., and Corkum, P. (2018). Sleep and Attention in Children With ADHD and Typically Developing Peers. J.Attent. Disord. 22, 933–941. doi: 10.1177/1087054715575064
Wan, X., Wang, W., Liu, J., and Tong, T. (2014). Estimating the sample mean and standard deviation from the sample size, median, range and/or interquartile range. BMC Med. Res. Methodol. 14:135. doi: 10.1186/1471-2288-14-135
Wells, G. A., Wells, G., Shea, B., Shea, B., O’Connell, D., Peterson, J., et al. (2014). The Newcastle-Ottawa Scale (NOS) for Assessing the Quality of Nonrandomised Studies in Meta-Analyses. Ottawa, ON: University of Ottawa.
Weyandt, L. L., and Gudmundsdottir, B. G. (2015). “Developmental and neuropsychological deficits in children with ADHD,” in Attention-deficit hyperactivity disorder: A handbook for diagnosis and treatment, 4th Edn, ed. R. A. Barkley (London: The Guilford Press), 116–139.
Keywords: ADHD, attention deficit hyperactivity disorder, attention network task, ANT, a systematic review and meta-analysis
Citation: Bieleninik Ł, Gradys G, Dzhambov AM, Walczak-Kozłowska T, Lipowska K, Łada-Maśko A, Sitnik-Warchulska K, Anikiej-Wiczenbach P, Harciarek M and Lipowska M (2023) Attention deficit in primary-school-age children with attention deficit hyperactivity disorder measured with the attention network test: a systematic review and meta-analysis. Front. Neurosci. 17:1246490. doi: 10.3389/fnins.2023.1246490
Received: 24 June 2023; Accepted: 30 October 2023;
Published: 07 December 2023.
Edited by:
Zengjian Wang, South China Normal University, ChinaReviewed by:
Dea Garic, The University of North Carolina at Chapel Hill, United StatesShuhua Mu, Shenzhen University, China
Copyright © 2023 Bieleninik, Gradys, Dzhambov, Walczak-Kozłowska, Lipowska, Łada-Maśko, Sitnik-Warchulska, Anikiej-Wiczenbach, Harciarek and Lipowska. This is an open-access article distributed under the terms of the Creative Commons Attribution License (CC BY). The use, distribution or reproduction in other forums is permitted, provided the original author(s) and the copyright owner(s) are credited and that the original publication in this journal is cited, in accordance with accepted academic practice. No use, distribution or reproduction is permitted which does not comply with these terms.
*Correspondence: Małgorzata Lipowska, bWFsZ29yemF0YS5saXBvd3NrYUB1Zy5lZHUucGw=