 Yanjing Chen
 Wei Zhao1,2†
 Jun Liu
- 1Department of Radiology, Second Xiangya Hospital, Central South University, Changsha, Hunan, China
- 2Clinical Research Center for Medical Imaging in Hunan Province, Changsha, Hunan, China
Objective: Machine learning (ML) has been widely used to detect and evaluate major depressive disorder (MDD) using neuroimaging data, i.e., resting-state functional magnetic resonance imaging (rs-fMRI). However, the diagnostic efficiency is unknown. The aim of the study is to conduct an updated meta-analysis to evaluate the diagnostic performance of ML based on rs-fMRI data for MDD.
Methods: English databases were searched for relevant studies. The Quality Assessment of Diagnostic Accuracy Studies (QUADAS-2) was used to assess the methodological quality of the included studies. A random-effects meta-analytic model was implemented to investigate the diagnostic efficiency, including sensitivity, specificity, diagnostic odds ratio (DOR), and area under the curve (AUC). Regression meta-analysis and subgroup analysis were performed to investigate the cause of heterogeneity.
Results: Thirty-one studies were included in this meta-analysis. The pooled sensitivity, specificity, DOR, and AUC with 95% confidence intervals were 0.80 (0.75, 0.83), 0.83 (0.74, 0.82), 14.00 (9, 22.00), and 0.86 (0.83, 0.89), respectively. Substantial heterogeneity was observed among the studies included. The meta-regression showed that the leave-one-out cross-validation (loocv) (sensitivity: p < 0.01, specificity: p < 0.001), graph theory (sensitivity: p < 0.05, specificity: p < 0.01), n > 100 (sensitivity: p < 0.001, specificity: p < 0.001), simens equipment (sensitivity: p < 0.01, specificity: p < 0.001), 3.0T field strength (Sensitivity: p < 0.001, specificity: p = 0.04), and Beck Depression Inventory (BDI) (sensitivity: p = 0.04, specificity: p = 0.06) might be the sources of heterogeneity. Furthermore, the subgroup analysis showed that the sample size (n > 100: sensitivity: 0.71, specificity: 0.72, n < 100: sensitivity: 0.81, specificity: 0.79), the different levels of disease evaluated by the Hamilton Depression Rating Scale (HDRS/HAMD) (mild vs. moderate vs. severe: sensitivity: 0.52 vs. 0.86 vs. 0.89, specificity: 0.62 vs. 0.78 vs. 0.82, respectively), the depression scales in patients with comparable levels of severity. (BDI vs. HDRS/HAMD: sensitivity: 0.86 vs. 0.87, specificity: 0.78 vs. 0.80, respectively), and the features (graph vs. functional connectivity: sensitivity: 0.84 vs. 0.86, specificity: 0.76 vs. 0.78, respectively) selected might be the causes of heterogeneity.
Conclusion: ML showed high accuracy for the automatic diagnosis of MDD. Future studies are warranted to promote the potential use of these classification algorithms in clinical settings.
Introduction
Major depressive disorder (MDD) is a global leading cause of emotional disorders with a high recurrence and suicide rate (Mccarron et al., 2021). It can seriously affect the physical and mental health of patients and has brought a huge burden to society (Osler et al., 2015). Even though the complex interactions between genetics and the environment are involved in the cause of the disease, a large number of underlying biomarkers still dominate its development. Up to now, the diagnosis of depression is still based on psychiatrists’ assessments and interviews, which is subjective to some extent. Moreover, the applicability of a depression scale like the Hamilton Depression Scale (Hamilton, 1960) (HDRS/HAMD), which is used to assess the outpatient, is questionable (Uher et al., 2008). The subjective scale may contribute to delayed diagnosis, and then affect prognosis (Pearson et al., 1999; Almeida, 2014; Park and Zarate, 2019). Therefore, objective biomarkers are urgently needed to diagnose MDD.
Neuroimaging, which is widely used in clinical practice, has been proven to provide several objective biomarkers for the diagnosis of MDD. Resting-state functional magnetic resonance imaging (rs-fMRI) is one of the functional neuroimaging modalities that is rapidly being utilized to investigate the brain biomarkers of psychiatric diseases. In rs-fMRI procedures, the brain’s activity is monitored by the changes in blood oxygenation (Le Bihan et al., 1995), which alters the magnetic properties of the blood and then produces the signals. The rs-fMRI has been used as an alternative strategy for the early screening of depression (Kassraian-Fard et al., 2016). Many encouraging biomarkers obtained from rs-fMRI, i.e., amplitude of low frequency fluctuation (ALFF), regional homogeneity (ReHo), and functional connectivity (FC), are used to diagnose MDD; however, the analysis procedure is complex and the results are varied with low specificity. In this context, research on MDD using rs-fMRI is nowadays mostly focused on exploring the biological mechanisms behind depression, and can hardly apply into clinical diagnosis and prediction.
Since the introduction of artificial intelligence, there has been a multitude of studies that have used machine learning to diagnose diseases and predict the efficacy of treatment (Kumar et al., 2022). Apart from saving a certain amount of time and the cost of manual evaluation (Valenstein et al., 2001), a combination of machine learning and rs-fMRI can diagnose mental diseases precisely (Khanna et al., 2015) and is essential to the clinical application of objective neuroimaging in mental diseases (Fernandes et al., 2017; Zhang X. et al., 2020). As a multivariate model, machine learning is able to tap into the complex relationship between brain changes and depression symptoms deeply, which most simple rs-fMRI analysis approaches cannot do (Haynes, 2015). For example, Chekroud et al. (2016) found that clinical non-symptomatic features incorporated in machine learning can be very helpful in predicting the treatment outcome of MDD. Chen et al. (2022) discovered that the diagnostic value of imaging metrics can be partly realized with machine learning. An issue with the current use of rs-fMRI to differentiate psychiatric disorders is that changes may involve the same brain regions for different disorders which induces low specificity. Sha et al. (2018) constructed different support vector machine (SVM) models depending on the same frontal striatal dysfunction to differentiate obsessive–compulsive disorder (OCD) from schizophrenia. Unsupervised learning is used to capture features with higher specificity in samples of a large size, which will be more likely to explain the neural basis of depression (Rutledge et al., 2019).
Despite the many benefits described above, machine learning studies on depression diagnosis using rs-fMRI data are few and immature. Due to the small sample sizes used in previous studies and relying solely on single training and validation methods, The diagnostic performance is not reliable. It is also challenging to select proper features from the high-dimensional rs-fMRI data. As is known, changes in functional connectivity can reflect the ability of information transfer between brain regions. With the introduction of topology, the synchronous changes in the brain have attracted attention, and brain network indicators can reflect the overall or local changes of brain neurons, which is of great significance for the regulation of certain behavioral traits. Therefore, special feature selection is crucial for diagnosing depression and reflecting depressive behavioral traits. According to past findings that used brain anatomy data in machine learning, the key to optimizing the diagnostic model is applying the appropriate subjects rather than modifying the algorithm (De Martino et al., 2008). No studies have ever reported the characteristics and quantitative effects of the sample on the model.
Therefore, our objective is to use meta-analysis to evaluate the diagnostic performance of ML based on rs-fMRI data for MDD and further explore the underlying relevant variables.
Materials and methods
We conducted and report this meta-analysis based on the PRISMA (Preferred Reporting Items for Systematic Reviews and Meta-Analyses) guidelines (Moher et al., 2009).
Literature search
Electronic databases including the PubMed, Embase, Web of Science, and Cochrane Library databases were searched by two observers independently to identify studies. The searches were performed on 23 February 2022. The search terms consisted of the following terms: ((“Machine Learning” [Mesh]) OR (“machine learning”) OR (“ML”)) AND ((“resting-state functional magnetic resonance”) OR (“rs-fMRI scans”) OR (“rs-fMRI”)) AND ((“Major Depressive Disorders”[Mesh]) AND (“Depression”) AND (“MDD”)); ((“Artificial Intelligence” [Mesh]) OR (“artificial intelligence”) OR (“AI”)) AND ((“Functional Magnetic Resonance Imaging” [Mesh]) OR (“fMRI scans”) OR (“fMRI”) OR (“functional MRI”) OR (“functional magnetic resonance imaging”)) AND ((“Major Depressive Disorders”[Mesh]) AND (“depression”) AND (“MDD”)).
Study selection
The titles and abstracts of potentially relevant studies were additionally screened by two reviewers [a doctoral student with 2 years of post-graduate experience in medical image analysis (XX) and a radiologist in the fourth year of training (LB)].
All of the studies were selected according to the following criteria: (a) original research studies; (b) patients with depression were enrolled who were assessed using scales; (c) rs-fMRI was applied to classify MDD and HC using ML; and (d) data were sufficient to reconstruct the 2 × 2 contingency table to estimate the sensitivity and specificity of the diagnosis.
Studies were excluded if: (a) they were reviews, editorials, abstracts, or animal studies; and (b) structural magnetic resonance imaging (sMRI) or task-based fMRI (t-fMRI) was applied to classify MDD and HC by ML; and (c) the information needed could not be calculated from the articles.
Data extraction
Relevant data were extracted from each study, including the names of the authors, year of publication, demographic characteristics of HC and patient groups [group size, age, sex, symptoms as measured by the Hamilton Depression Rating Scale (HDRS/HAMD), the Beck Depression Inventory (Beck et al., 1961) (BDI), or the Patient Health Questionnaire-9 (Kroenke et al., 2001) (PHQ-9), magnetic field strength, training and validation methods, and features selected].
For each study, the true positive (TP), false positive (FP), false negative (FN), and true negative (TN) values were extracted, and a pairwise (2 × 2) contingency table was created.
Data quality assessment
The Quality Assessment of Diagnostic Accuracy Studies (QUADAS-2) was used to assess the methodological quality of the included studies and the risk of bias at the study level (Whiting et al., 2011), which consisted of: (a) patient selection; (b) index test; (c) reference standard; and (d) flow and timing.
Statistical analysis
This meta-analysis was conducted using Stata software, version 16.0, and Review Manager software, version 5.3. The predictive accuracy was quantified using pooled sensitivity, specificity, diagnostic odds ratio (DOR), positive likelihood ratio (PLR), and negative likelihood ratio (NLR) with 95% confidence intervals (CIs). The summary receiver operating characteristic curve (SROC) and area under the curve (AUC) were used to summarize the diagnostic accuracy. Q and I2 were calculated to estimate the heterogeneity among the studies included in this meta-analysis. Pooling and effect size were evaluated using a random-effects model, indicating that estimating the distribution of true effects between studies considered heterogeneity (Deeks et al., 2005). Meta-regression analysis was conducted to further investigate the cause of the heterogeneity. Subgroup analysis was performed to examine the potential effects of different demographic factors, ML algorithms, and types of training and validation.
Publication bias
The publication bias was assessed using Deek’s funnel plot asymmetry test, where a p value <0.05 suggested a potential publication bias. Deek’s funnel plot asymmetry test was performed using Stata 16.0.
Results
Literature search
The complete literature search flowchart is presented in Figure 1. According to the search strategy described above, 455 potentially eligible citations were identified. After screening titles and abstracts, we excluded 135 studies for duplication and 249 studies for non-relevant abstracts or publication types. Finally, after revision, 40 articles were excluded, leaving 31 articles for inclusion in the meta-analysis.
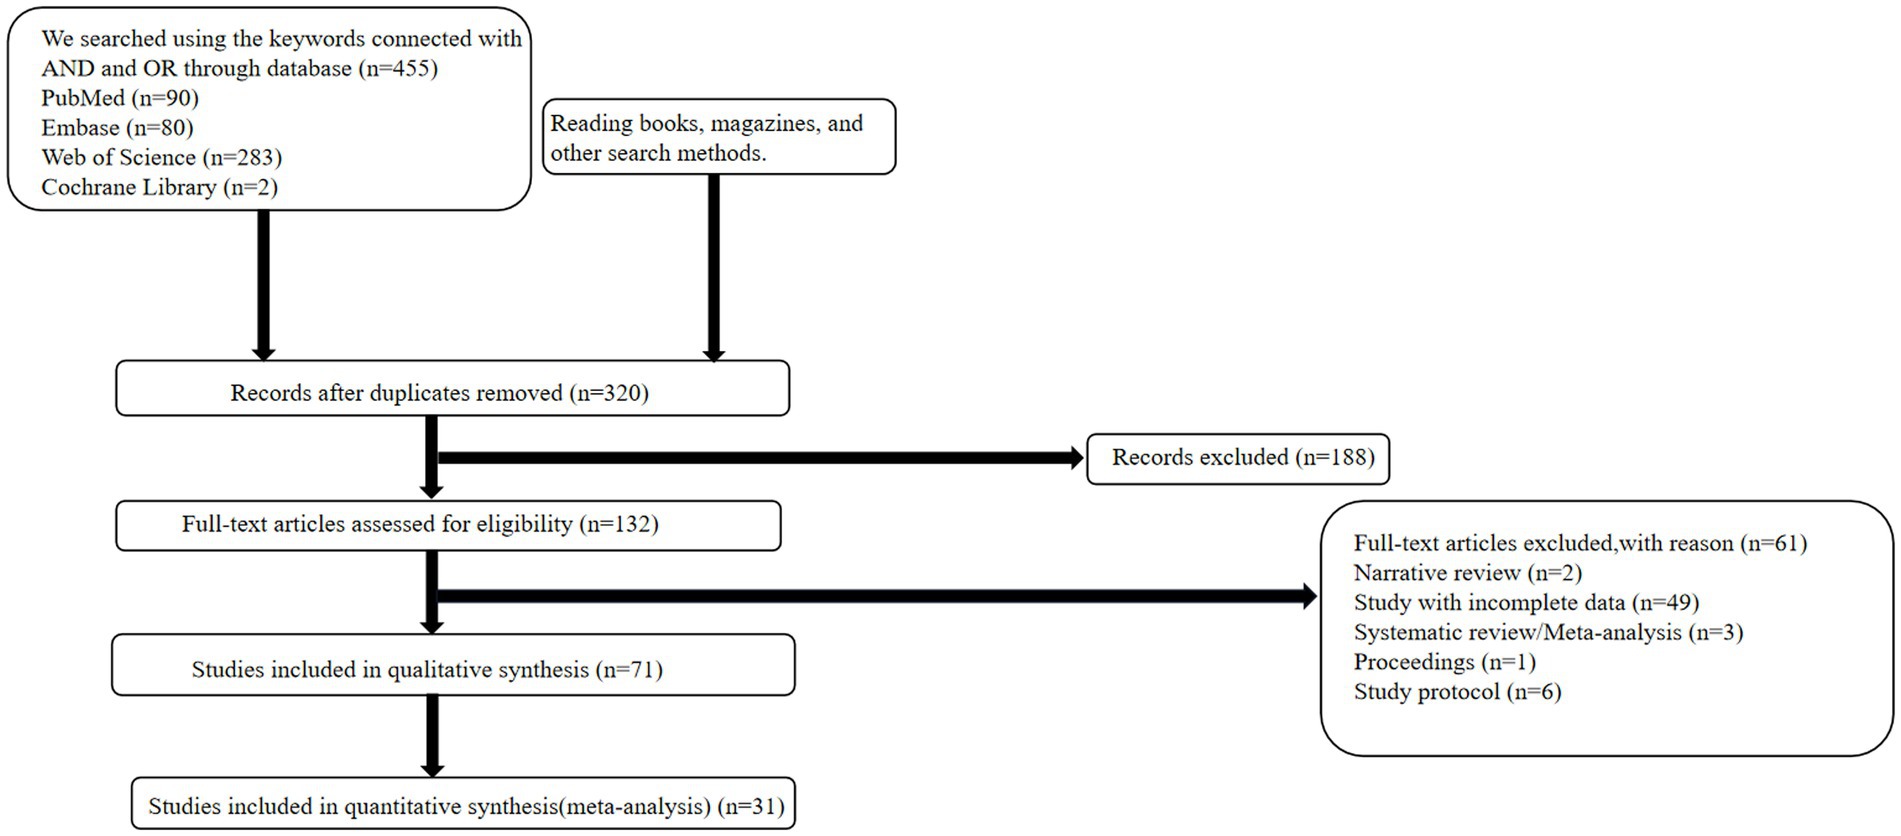
Figure 1. Flow diagram of the study selection for meta-analysis.
Data quality assessment
The quality assessment of the included studies using the QUADAS-2 checklist is presented in Supplementary Figure S1. Overall, generally, the data quality was considered acceptable.
Study characteristics
The characteristics of the included studies are summarized in Table 1. The 31 studies included in this review had 2,699 participants where ML models were used to diagnose MDD. All of the studies used retrospectively collected data. Of these models, the ML algorithm comprised different types of models; most of them were support vector machine models, (SVM) (n = 16). Some articles had multicenter samples referring to several kinds of models such as linear discriminant analysis (LDA) and extreme gradient boosting (Xgboot) (n = 5). The HDRS/HAMD was used in 17 studies, and the BDI/BDIII/PHQ was used in 5 studies. The scores of HDRS/HAMD of current depression can be divided into three severity. Status 18 to 22 ≤22 (n = 5), 22 to 24 (n = 4), or > 24 (n = 5) indicated presenting symptoms were mild, moderate, or severe, respectively. In 31 articles, different kinds of features derived from resting-state were used, including functional connectivity (n = 25), graph theory (n = 5), and ReHo (n = 1). The sample size for MDD of four studies was larger than 100 and the remaining ones (n = 27) were smaller than 100. Eleven studies employed five-fold or ten-fold cross-validation as the test method, and twenty studies employed the leave-one-out cross-validation method. Exclude articles that cannot calculate diagnostic indicators information, there were 16 studies that used 3 T MRI scanners and 6 studies used 1.5 T MRI scanners. Siemens MRI equipment (n = 11) was used more than GE Healthcare MRI equipment (n = 5). The information about the neuropsychological estimates can be seen in Supplementary Table S1.
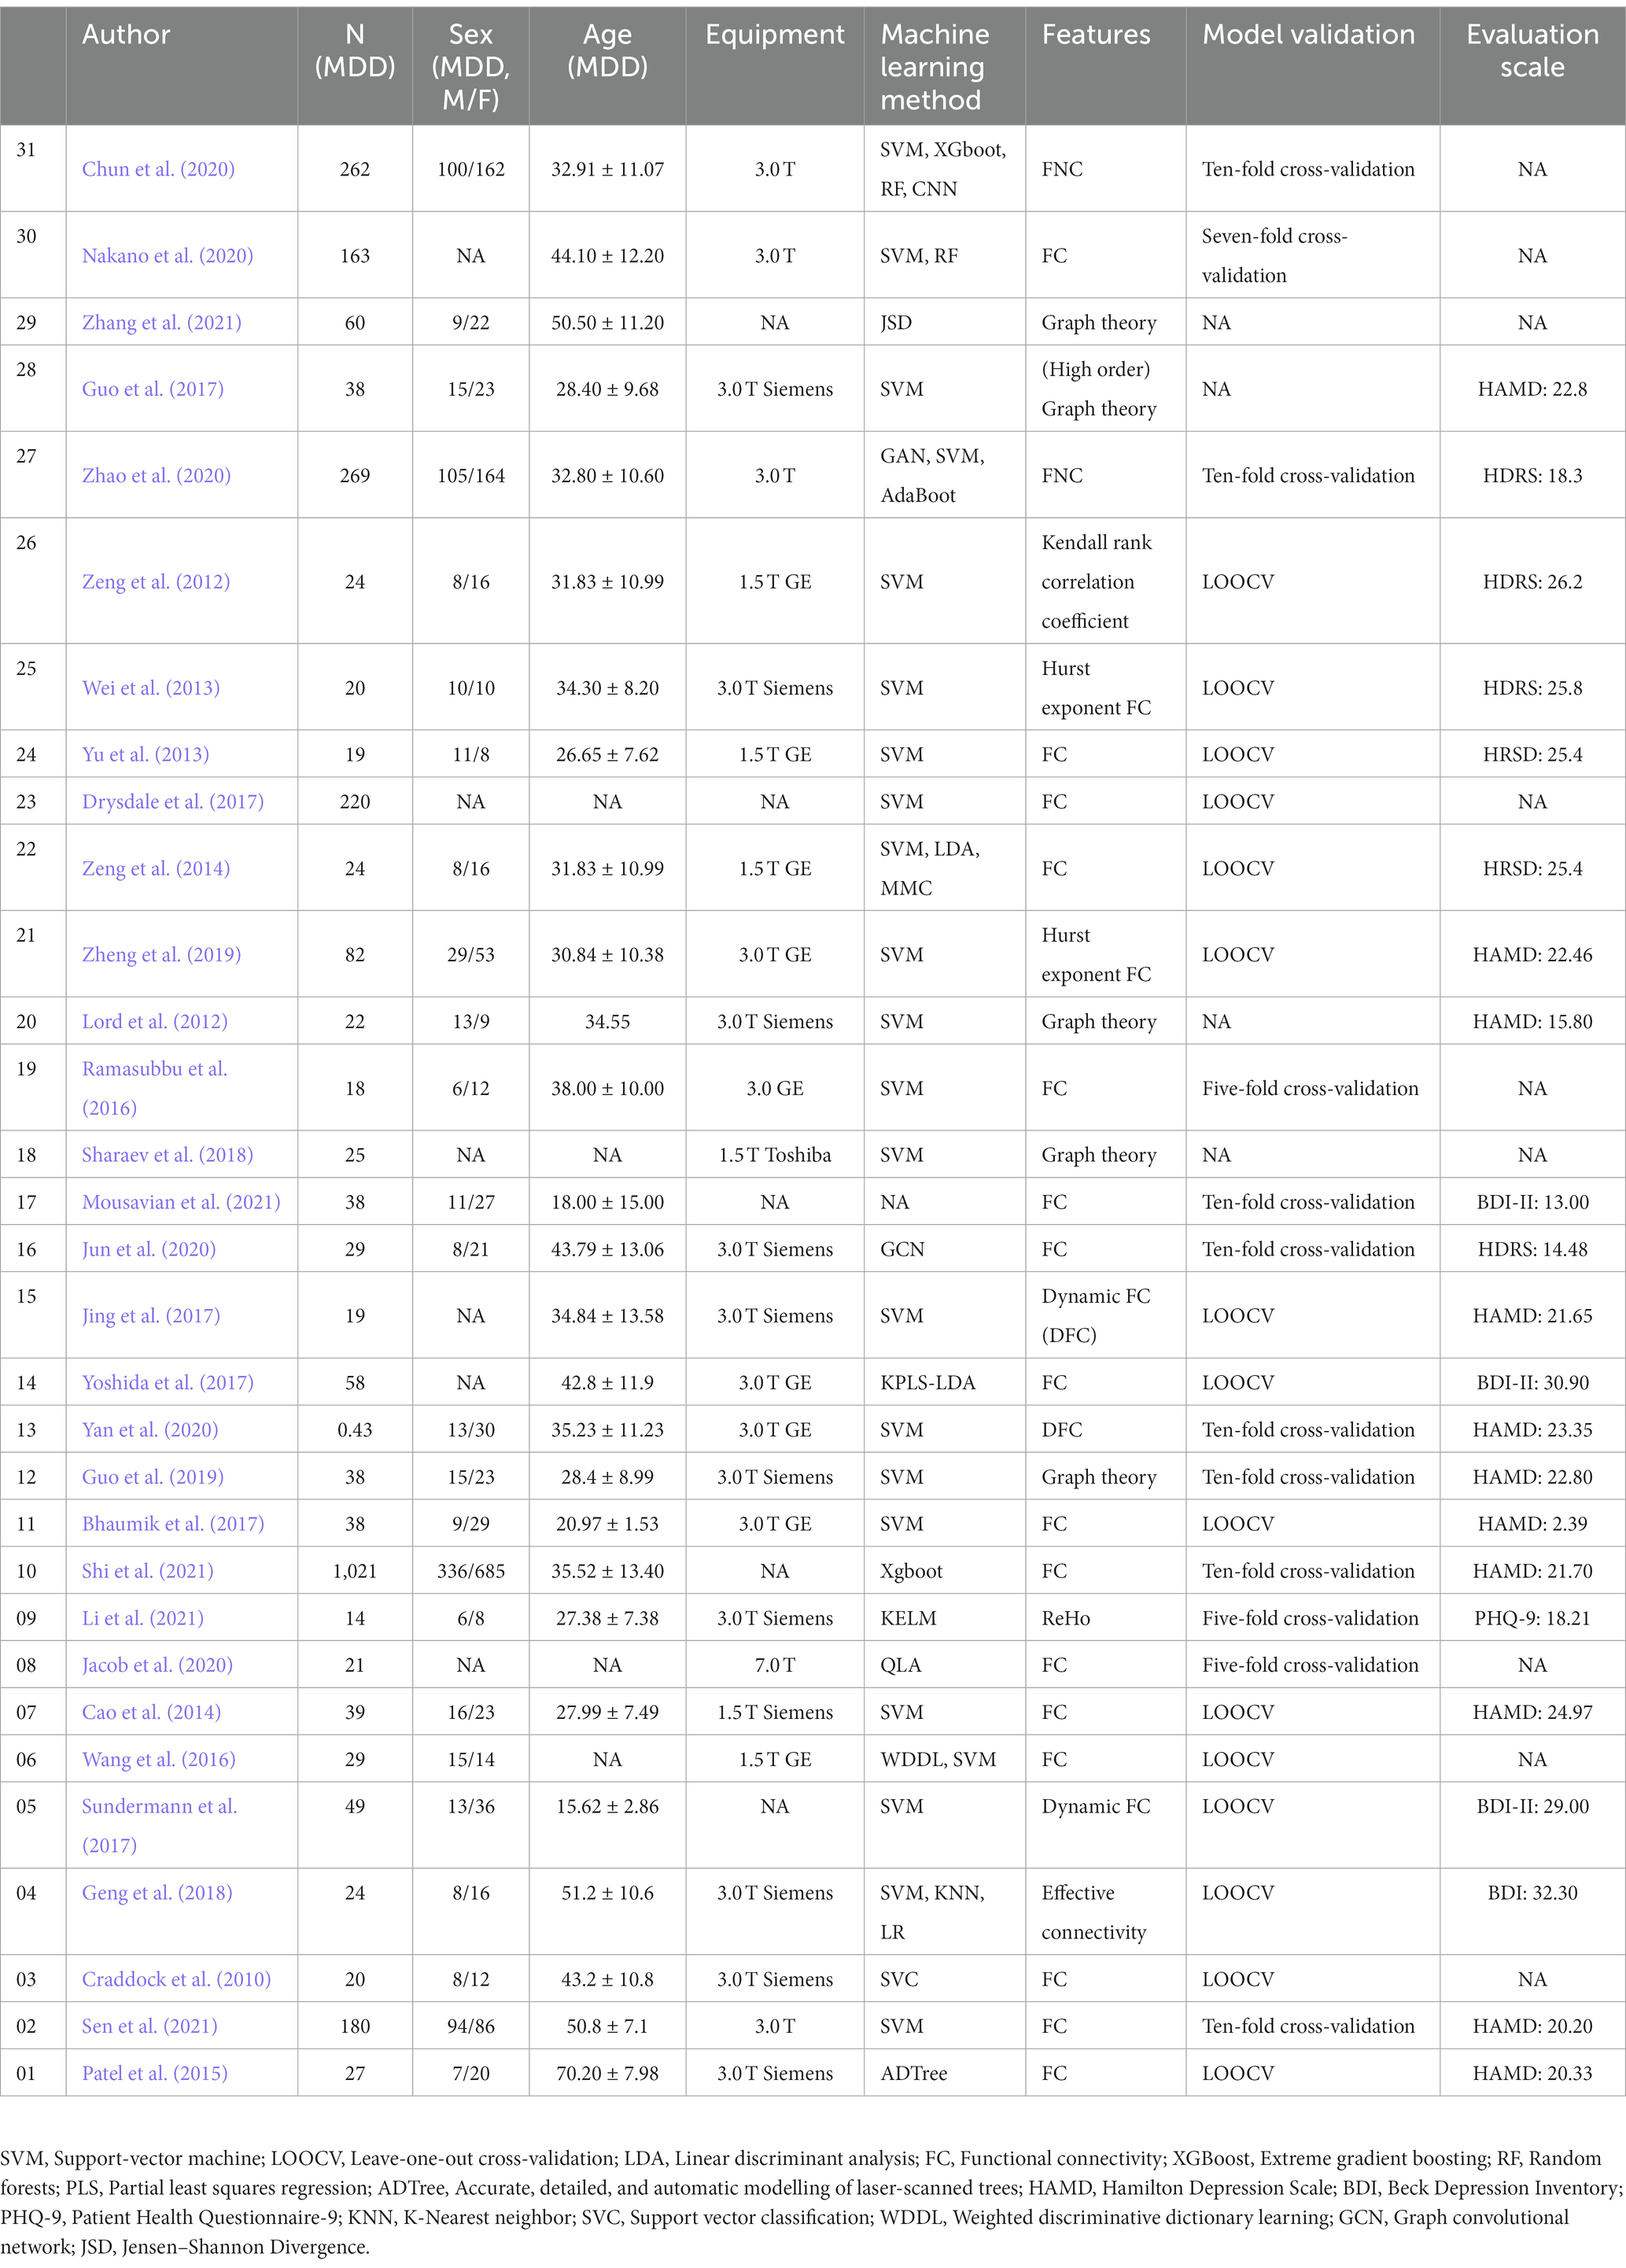
Table 1. rs-fMRI-based machine learning characteristics of studies included in the systematic review.
Pooled results
The pooled sensitivity and specificity of machine learning for discriminating MDD and HC were 0.80 (95% CI: 0.75 to 0.83) and 0.79 (95% CI: 0.74 to 0.82), respectively. The forest plots are shown in Figure 2. The pooled PLR and NLR were 3.7 (95% CI: 3.0 to 4.6) and 0.26 (95% CI: 0.20 to 0.33), respectively. The DOR was 14 (95% CI: 9 to 22). SROC curve analysis was used to summarize the overall diagnostic accuracy. The AUC was 0.86. The SROC curve is shown in Figure 3. The results demonstrated high diagnostic performance in discriminating MDD from HC.
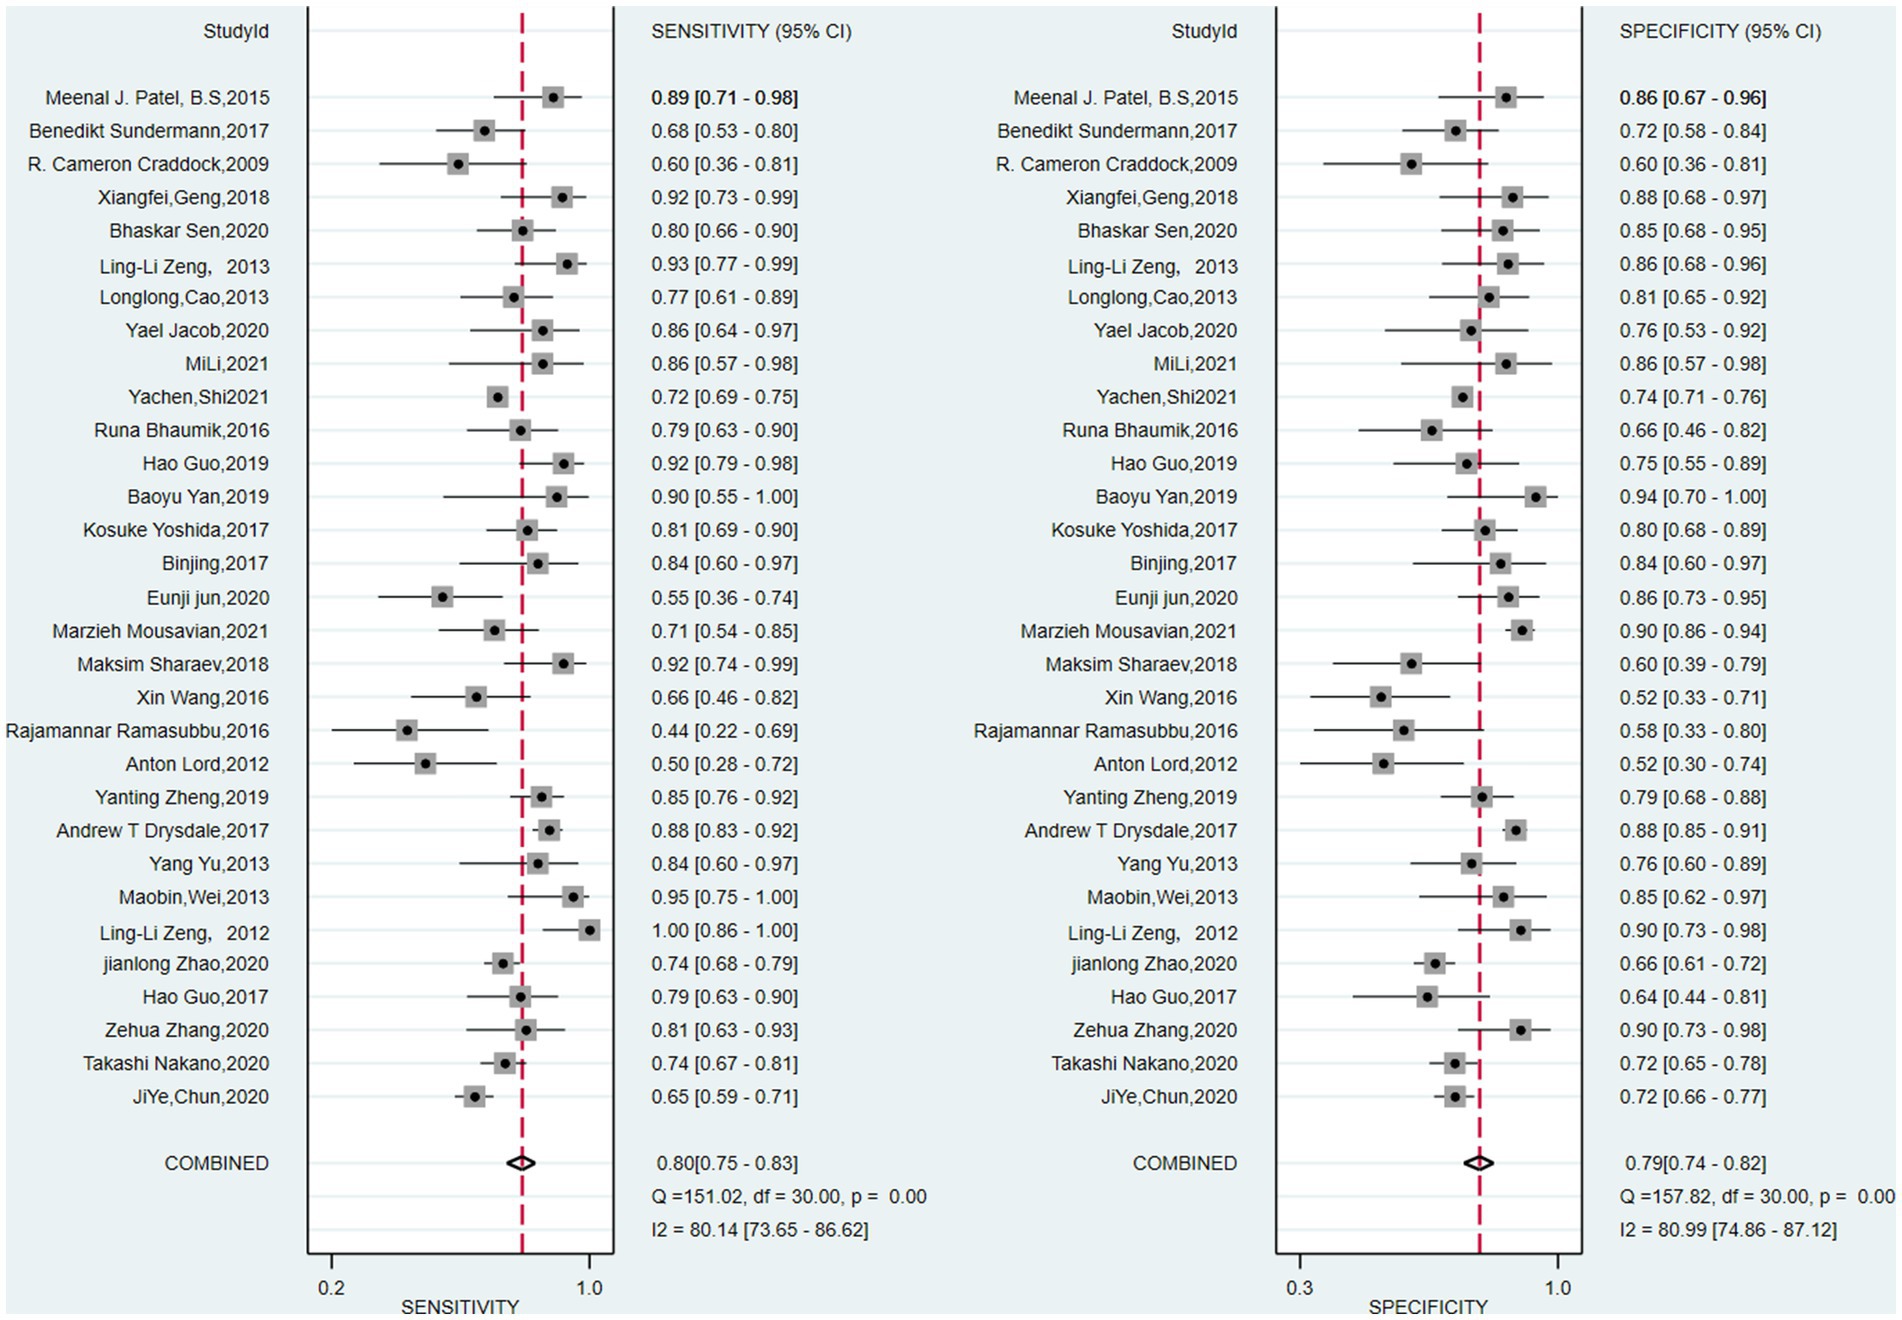
Figure 2. Pooled estimates of sensitivity and specificity of machine learning to differentiate major depressive disorders from healthy controls. On the left represents the annotation for each article, we only use the first name of the first author or the corresponding author.
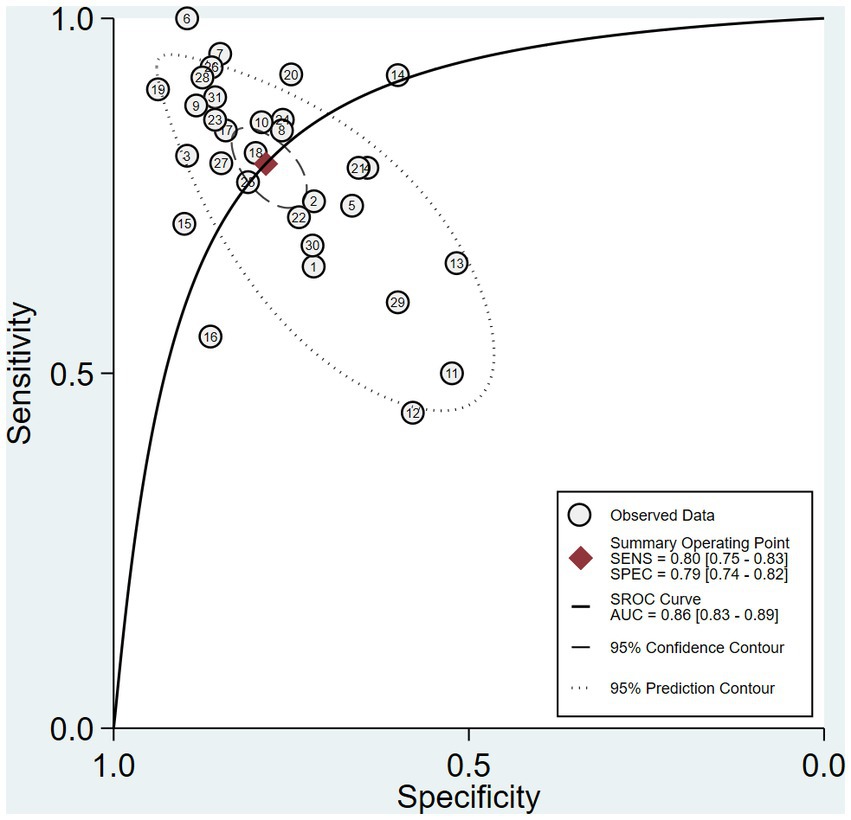
Figure 3. Summary receiver operating characteristic curve (SROC) of the diagnostic performance of ML to distinguish MDD and HC.
Exploration of heterogeneity
There was significant heterogeneity in sensitivity (I2 = 80.14%) and specificity (I2 = 80.99%). Subgroup analysis and meta-analysis were performed by comparing studies with the different variables. Table 2 shows the results of the analysis for subgroups. Studies (n = 4) with a large sample size (>100) after excluding one article had a lower specificity (0.71 vs. 0.81) and lower sensitivity (0.72 vs. 0.79) compared with studies (n = 26) with a small sample size when the symptoms of the patient were similar. The studies that used graph theory had equal sensitivity (0.86 vs. 0.84) and lower specificity (0.76 vs. 0.78) compared with those (n = 8) that used functional connectivity as a feature. Four studies with self-rating scales such as the BDI or PHQ-9 as the evaluation standard had a lower sensitivity (0.86 vs. 0.87) and specificity (0.78 vs. 0.80) than studies (n = 4) using the HDRS/HAMD. Meta-regression (Supplementary Figure S2) using modifiers identified in the systematic review was conducted; we found that the leave-one-out cross-validation (sensitivity: p < 0.01, specificity: p < 0.001), graph theory (sensitivity: p < 0.05, specificity: p < 0.01), BDI (sensitivity: p = 0.04, specificity: 0.06), 3T (sensitivity: p < 0.001, specificity: p = 0.04), n > 100 (sensitivity: p < 0.001, specificity: p < 0.001), and Siemens equipment (sensitivity: p <0.01, specificity: p < 0.001) were the sources of heterogeneity (Figure 4).
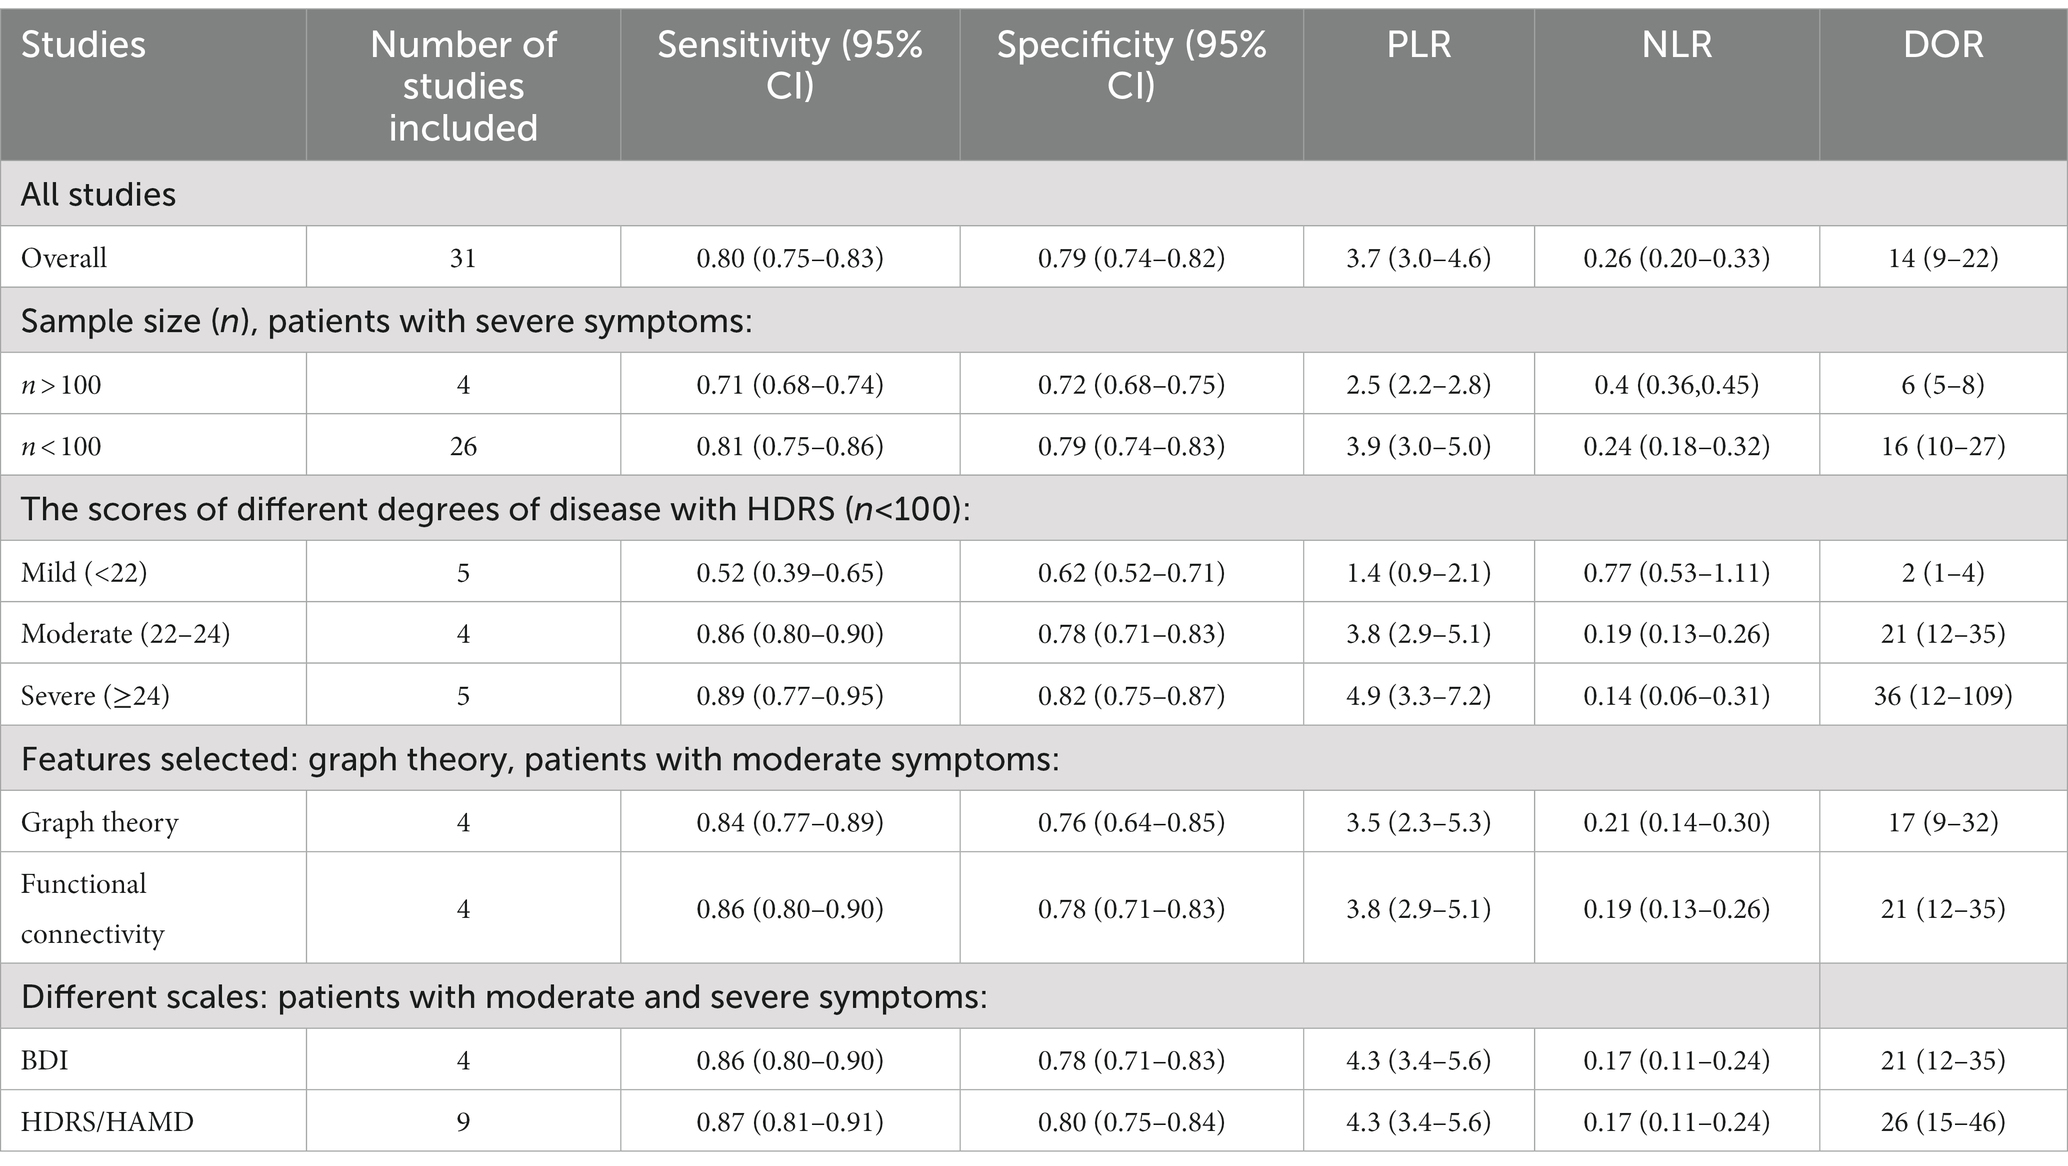
Table 2. Results of pooled estimates of all studies and of different subgroups.
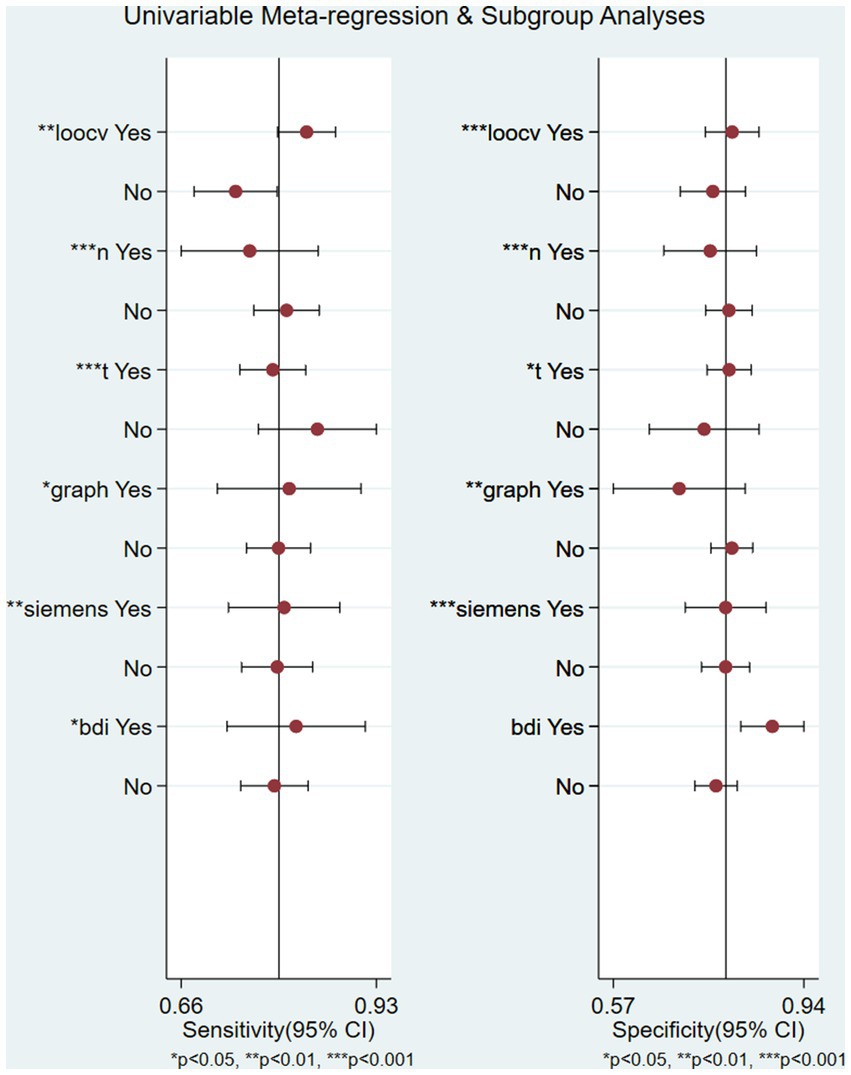
Figure 4. Univariable meta-regression plot of machine learning for the diagnosis of depression in factor of leave-one-out crossvalidation, graph, 3 T field strength, Siemens equipment, and BDI/HDRS scales.
Publication bias
There was no publication bias based on the Deek’s funnel plot (p = 0.07) (Supplementary Figure S2).
Clinical utility
Using an ML-based model increased the post-test probability to 48% from 20% with a PLR of 4 when the pretest was positive and would reduce the post-test probability to 6% with an NLR of 0.26 when the pretest was negative (Supplementary Figure S3).
Discussion
Until now, it has been extremely difficult to make accurate diagnoses and predictions in psychiatry. Although rs-fMRI is a widely available tool for psychiatric research, the lack of specificity has prevented it being effectively applied in clinical practice (Casey et al., 2013). Artificial intelligence (AI) has been shown to improve medical diagnosis and assist in building more accurate and realistic models of neural functioning through the analysis of fMRI data (Cohen et al., 2017). The current study provides compelling evidence of the high accuracy of machine learning using rs-fMRI to diagnose depression. Due to the intricacies of psychiatric disorders, the influence of other factors should be considered more carefully in the implementation of subgroup analysis. Our study found that potential confounding factors, including sample size, validation strategy, and disease severity, can impact the construction of reliable and comprehensive models (Claeys et al., 2022).
Regression with sample size as a moderator showed a significant effect on both sensitivity (p < 0.001) and specificity (p < 0.001). Subgroup analysis showed a large sample size (>100) exhibited lower specificity (0.71 vs. 0.81) and sensitivity (0.72 vs. 0.79) than a small sample size (n < 100). This was in line with previous research, which found that small sample size (N = 20) accuracies were up to 95%, while the accuracy of medium sample sizes (N = 100) were up to 75% (Flint et al., 2021). When there are few data samples and many features, the biased accuracies are typically visible (Simon, 2003). The amount of data is one of the three challenges with applying functional neuroimaging in the era of big data (Rajalakshmi et al., 2018; Li et al., 2019). It has been demonstrated that the amount of data available has a considerably greater impact on model construction than algorithms performance (Hidalgo-Mazzei et al., 2016). The majority of the studies included in our research proposed the model validated on a single site; in contrast, the five articles in our study containing large and multicenter samples employed the model validated on multiple sites. The pipeline can give us a complete view of how to deal with the data through machine learning, such as external validation methods between different sites and the training methods used.
The support vector machine (SVM) algorithm was employed to categorize patients in the vast majority of studies in the present research since it is well recognized in machine learning to handle noisy, correlated characteristics and high-dimensional data sets. It was significant that the articles using large samples used other different classification algorithms, such as Xgboot and LDA, to obtain better diagnostic performance. When there are many more candidate features than cases, decomposition and grouping techniques are the best option for understanding the true neural basis (Khosla et al., 2019). Combining various classifiers, such as the SVM and the logistic regression or the SVM and the linear discriminant analysis, was more effective than using only one to identify MDD (Yan et al., 2020). The size of the dataset and the feature selection technique are two variables that affect the choice of a suitable classifier. Therefore, it is worthwhile to investigate the application further (Pereira et al., 2009). Validation is another crucial element. As the meta-regression showed, different cross-validation methods can lead to different conclusions (sensitivity: p = 0.00, specificity: p = 0.00). The leave-one-out cross-validation (loocv) is a common approach in which the prediction algorithm is built using all of the training data except for one observation (Tai et al., 2019). Varoquax demonstrated that (Varoquaux et al., 2017), although this technique is good and can strengthen the model structure, it may result in unreliable accuracy when is compared to five-fold or ten-fold cross-validation. If the sample size is limited, cross-validation could cause major statistical errors (Varoquaux, 2017) that cannot be changed by optimizing the model. This training–testing strategy based on complex data sets has been heavily depended upon to improve the accuracy of diagnosis models, and this research anticipated creating a meta-analytical framework for clinical decision-making in psychiatry diagnosis (Iwabuchi et al., 2013).
We also found that studies using Siemens MRI equipment were one of the sources of heterogeneity (sensitivity: p < 0.01, specificity: p < 0.001). This means different MRI equipment may affect the diagnostic performance. Therefore, prospective studies comparing the two pieces of MRI equipment are necessary to explore the diagnostic performance of rs-fMRI-based diagnosis. However, previous studies have solved the problem of data drift caused by data collection from different sites through algorithm optimization. Gradient matching federated domain adaptation (GM-FDA) is a domain adaptation algorithm which combines the ideas of federated learning and domain adversarial training. This method has been used to solve the problem of poor performance of machine learning models on different devices, especially mobile devices. Zeng et al. effectively applied this method to solve the issue of low generalization ability of previous machine learning models related to neuroimaging and validated it for the diagnosis of depression.
Our study found that the usual features selected in publications were the functional connectivity between different brain regions. They were typically selected using lasso-regularized logistic regression (lasso) or tested using permutation (Zhang R. et al., 2020) because of the large amount and result of overfitting. This meta-regression and sub-analysis showed that the powerful classifying capacity of the topology features derived from graph theory analysis was almost equal to the result of functional connectivity (sensitivity: 0.84 vs. 0.86; specificity: 0.76 vs. 0.78). It can be used to assess the centrality of the brain network (the betweenness centrality, eigenvector centrality, participation coefficient, and within module z-score) (Sotero, 2016), as well as integration (characteristic path length and efficiency) and segregation (clustering coefficient and transitivity). Kazeminejad and Sotero (2018) found graph theoretical analysis is more reliable than earlier analysis technique applied and can effectively cancel out the effects of multisite and multi-device MRI sequences. What is more, the data obtained are not too so much that they can also achieve a good training effect (Wang et al., 2017). According to Wang et al. (2017) found that deficiencies in the topological structure underlying emotion processing could help distinguish MDD from other mental disorders. Topological features can be used to display the entire pathological imbalance of brain connections induced by depression (Zhang R. et al., 2020), and there are some discrepancies between the functional and structural topological properties in MDD. Kambeitz et al. (2017) The overall diagnostic efficiency(88% sensitivity, 92% specificity) using DTI as the characteristic is higher than that using rs-fMRI. (85% sensitivity, 83% specificity). The same graph metrics may describe different physiological pathology in structural and functional networks (Xu et al., 2021). Until now, there have not been many resting-state graph theoretical analyses that are worthy of being carried out. Other research also described some novel rs-fMRI analysis methods such as effective connectivity and dynamic functional connection, which can provide more knowledge about the brain (Xiao et al., 2020; Ji et al., 2021). A multimodal MRI connectome study is still a prospective direction. Due to the sample size, we did not perform the sub-analysis of their diagnostic accuracy, which may be another future direction.
A prior work hypothesized that the severity of clinical symptomatology was correlated with the degree of functional and structural brain abnormalities seen in depression (Demenescu et al., 2011; Mwangi et al., 2012). Machine learning had been reported to be able to predict the severity of depression according to functional connectivity features. It is yet unknown how well it can diagnose different degrees of depression (Kessler et al., 2016); the current subgroup study preliminary addressed the limitation of the research by Kambeitz et al. by showing that the accuracy of diagnosing severely unwell subjects was higher than that of diagnosing the moderately and mildly ill (sensitivity: 0.89 vs. 0.86 vs. 0.52; specificity: 0.82 vs. 0.78 vs. 0.62, respectively). We also observed that similar illness states assessed by different depression scales might not correspond to similar brain circumstances. This is one of the drawbacks of using behavioral assessment for psychiatric disorders. In our study, the judgment of BDI-based ML diagnosis accuracy was worse than the HDRS-based ones (sensitivity: 0.86 vs. 0.87, specificity: 0.78 vs. 0.80). There are differences in the assessment of depressive states when using BDI/BDI-II on the same individual, and these differences tend to increase gradually with severity (Furukawa et al., 2019), which involves consistency of various scales (Rabinowitz et al., 2022). When there is not a perfect association, a comparison between them can potentially offer helpful clinical information (Petkova et al., 2000; Targum et al., 2013). The BDI scales could additionally experience the same issues as other self-report scales because scores can easily be exaggerated or minimized under specific circumstances (Pop-Jordanova, 2017). The evaluator’s incorrect interpretation of the rules (Monica et al., 2008) and the subjects’ careless responses may also result in the failure of assessment. This finding convinced us that pure behavioral assessments were easily affected and unreliable. Combining behavioral traits with objective changes in brain function is more persuasive for screening depression. It is feasible to utilize the multivariable property of machine learning to connect depressive scales with functional MRI and develop a practical model, consistent with previous research conclusions (Stoyanov et al., 2019), in the primary time, which is advantageous given the difficulty of translating neuroimaging to clinic application.
Limitations and future direction
As psychiatric disorders were inherently heterogeneous and the subjects included were complex, we used subgroup analysis to select some potential variables and the I2 was reduced at the same time. There were still some inconsiderable factors such as antidepressant medication, age, and sex (Liu et al., 2019). The gender and age ratios were consistent with the epidemiology of depression and other relevant data the articles provided were limited or ambiguous, so we were unable to analyze further. In addition, some articles used the same data to test the diagnostic efficacy of different combinations of models. We selected the best results for inclusion in the study, which were in line with the machine learning training guidelines for building models. Negative results were not presented in articles so a publication bias might have occurred.
In our subgroup analysis, we obtained high specificity of machine learning diagnostic performance for feature selection and sample size. This is a crucial point explored in this study. However, uncontrollable factors during this process may still affect machine learning in diagnosing depression, such as cross-site data collection and the selection of preprocessing step parameters. Standardization and streamlining of this part of the process will play a decisive role in providing neurobiological information for the diagnosis of depression using machine learning methods in the future. The limited sample size of severely depressed patients used in previous studies has restricted our exploration of the significance of machine learning selection methods. The lack of early sensitivity markers in the clinic can be addressed to a certain extent through the combination of neuroimaging and machine learning methods. However, this process still requires repeated testing and verification, and the use of large databases can save time and manpower. In the future, the establishment and open availability of large-scale databases can create even greater potential for efficient transformation of resting-state fMRI information using machine learning methods.
From the results of this meta-analysis, We concluded that the sample size had a significant impact on the model’s accuracy; therefore, it is crucial to carry out external validations in larger samples to encourage generalizability. Another direction for the future is the use of multi-modal imaging data to create better models, as it will be more advantageous to include proteomics or genomes while tracking depression in its early stages.
Conclusion
There is more and more research using machine learning based on rs-fMRI to identify psychiatry like depression. Our work revealed that machine learning may be a reliable technique for differentiating depression from healthy controls on the basis of neural mechanisms after displaying some possible characteristics. It is hoped that this will eventually turn into a controllable instrument.
Author contributions
YC and WZ were responsible for the original study design. YC was responsible for the original search, identification of relevant manuscript, and initial drafting of the report. YC and SY were responsible for data extraction, risk of bias assessments, and data analysis. WZ and JL critically revised the article. All authors contributed to the article and approved the submitted version.
Funding
The study was supported by grants from the Innovative Province Special Construction Foundation of Hunan Province (2020SK4001). The funding organizations played no further role in the study design, data collection, analysis and interpretation, and writing of this article.
Conflict of interest
The authors declare that the research was conducted in the absence of any commercial or financial relationships that could be construed as a potential conflict of interest.
Publisher’s note
All claims expressed in this article are solely those of the authors and do not necessarily represent those of their affiliated organizations, or those of the publisher, the editors and the reviewers. Any product that may be evaluated in this article, or claim that may be made by its manufacturer, is not guaranteed or endorsed by the publisher.
Supplementary material
The Supplementary material for this article can be found online at: https://www.frontiersin.org/articles/10.3389/fnins.2023.1174080/full#supplementary-material
References
Almeida, O. P. (2014). Prevention of depression in older age. Maturitas 79, 136–141. doi: 10.1016/j.maturitas.2014.03.005
Beck, A. T., Ward, C. H., Mendelson, M., Mock, J., and Erbaugh, J. (1961). An inventory for measuring depression. Arch. Gen. Psychiatry 4, 561–571. doi: 10.1001/archpsyc.1961.01710120031004
Bhaumik, R., Jenkins, L. M., Gowins, J. R., Jacobs, R. H., Barba, A., Bhaumik, D. K., et al. (2017). Multivariate pattern analysis strategies in detection of remitted major depressive disorder using resting state functional connectivity. Neuroimage Clin. 16, 390–398. doi: 10.1016/j.nicl.2016.02.018
Cao, L., Guo, S., Xue, Z., Hu, Y., Liu, H., Mwansisya, T. E., et al. (2014). Aberrant functional connectivity for diagnosis of major depressive disorder: a discriminant analysis. Psychiatry Clin. Neurosci. 68, 110–119. doi: 10.1111/pcn.12106
Casey, B. J., Craddock, N., Cuthbert, B. N., Hyman, S. E., Lee, F. S., and Ressler, K. J. (2013). DSM-5 and RDoC: progress in psychiatry research? Nat. Rev. Neurosci. 14, 810–814. doi: 10.1038/nrn3621
Chekroud, A. M., Zotti, R. J., Shehzad, Z., Gueorguieva, R., Johnson, M. K., Trivedi, M. H., et al. (2016). Cross-trial prediction of treatment outcome in depression: a machine learning approach. Lancet Psychiatry 3, 243–250. doi: 10.1016/S2215-0366(15)00471-X
Chen, Q., Bi, Y., Zhao, X., Lai, Y., Yan, W., Xie, L., et al. (2022). Regional amplitude abnormities in the major depressive disorder: a resting-state fMRI study and support vector machine analysis. J. Affect. Disord. 308, 1–9. doi: 10.1016/j.jad.2022.03.079
Chun, J. Y., Sendi, M. S. E., Sui, J., Zhi, D., and Calhoun, V. D. (2020). Visualizing functional network connectivity difference between healthy control and major depressive disorder using an explainable machine-learning method. Annu Int Conf IEEE Eng Med Biol Soc 2020, 1424–1427. doi: 10.1109/EMBC44109.2020.9175685
Claeys, E. H. I., Mantingh, T., Morrens, M., Yalin, N., and Stokes, P. R. A. (2022). Resting-state fMRI in depressive and (hypo) manic mood states in bipolar disorders: a systematic review. Prog. Neuro-Psychopharmacol. Biol. Psychiatry 113:110465. doi: 10.1016/j.pnpbp.2021.110465
Cohen, J. D., Daw, N., Engelhardt, B., Hasson, U., Li, K., Niv, Y., et al. (2017). Computational approaches to fMRI analysis. Nat. Neurosci. 20:304. doi: 10.1038/nn.4499
Craddock, R. C., Holtzheimer, P. E., Hu, X. P., and Mayberg, H. S. (2010). Disease state prediction from resting state functional connectivity. Magn. Reson. Med. 62, 1619–1628. doi: 10.1002/mrm.22159
De Martino, F., Valente, G., Staeren, N., Ashburner, J., Goebel, R., and Formisano, E. (2008). Combining multivariate voxel selection and support vector machines for mapping and classification of fMRI spatial patterns. NeuroImage 43, 44–58. doi: 10.1016/j.neuroimage.2008.06.037
Deeks, J. J., Macaskill, P., and Irwig, L. (2005). The performance of tests of publication bias and other sample size effects in systematic reviews of diagnostic test accuracy was assessed. J. Clin. Epidemiol. 58, 882–893. doi: 10.1016/j.jclinepi.2005.01.016
Demenescu, L. R., Renken, R., Kortekaas, R., Van Tol, M. J., Marsman, J. B., Van Buchem, M. A., et al. (2011). Neural correlates of perception of emotional facial expressions in out-patients with mild-to-moderate depression and anxiety. A multicenter fMRI study. Psychol. Med. 41, 2253–2264. doi: 10.1017/S0033291711000596
Drysdale, A. T., Grosenick, L., Downar, J., Dunlop, K., Mansouri, F., Meng, Y., et al. (2017). Resting-state connectivity biomarkers define neurophysiological subtypes of depression. Nat. Med. 23, 28–38. doi: 10.1038/nm.4246
Fernandes, B. S., Williams, L. M., Steiner, J., Leboyer, M., Carvalho, A. F., and Berk, M. (2017). The new field of 'precision psychiatry'. BMC Med. 15:80. doi: 10.1186/s12916-017-0849-x
Flint, C., Cearns, M., Opel, N., Redlich, R., Mehler, D. M. A., Emden, D., et al. (2021). Systematic misestimation of machine learning performance in neuroimaging studies of depression. Neuropsychopharmacology 46, 1510–1517. doi: 10.1038/s41386-021-01020-7
Furukawa, T. A., Reijnders, M., Kishimoto, S., Sakata, M., Derubeis, R. J., Dimidjian, S., et al. (2019). Translating the BDI and BDI-II into the HAMD and vice versa with equipercentile linking. Epidemiol. Psychiatr. Sci. 29:e24. doi: 10.1017/S2045796019000088
Geng, X., Xu, J., Liu, B., and Shi, Y. (2018). Multivariate classification of major depressive disorder using the effective connectivity and functional connectivity. Front. Neurosci. 12:38. doi: 10.3389/fnins.2018.00038
Guo, H., Li, Y., Mensah, G. K., Xu, Y., Chen, J., Xiang, J., et al. (2019). Resting-state functional network scale effects and statistical significance-based feature selection in machine learning classification. Comput. Math. Methods Med. 2019:9108108. doi: 10.1155/2019/9108108
Guo, H., Qin, M., Chen, J., Xu, Y., and Xiang, J. (2017). Machine-learning classifier for patients with major depressive disorder: multifeature approach based on a high-order minimum spanning tree functional brain network. Comput. Math. Methods Med. 2017:4820935. doi: 10.1155/2017/4820935
Hamilton, M. (1960). A rating scale for depression. J. Neurol. Neurosurg. Psychiatry 23, 56–62. doi: 10.1136/jnnp.23.1.56
Haynes, J. D. (2015). A primer on pattern-based approaches to fMRI: principles, pitfalls, and perspectives. Neuron 87, 257–270. doi: 10.1016/j.neuron.2015.05.025
Hidalgo-Mazzei, D., Mateu, A., Reinares, M., Murru, A., Del Mar, B. C., Varo, C., et al. (2016). Psychoeducation in bipolar disorder with a SIMPLe smartphone application: feasibility, acceptability and satisfaction. J. Affect. Disord. 200, 58–66. doi: 10.1016/j.jad.2016.04.042
Iwabuchi, S. J., Liddle, P. F., and Lena, P. (2013). Clinical utility of machine-learning approaches in schizophrenia: improving diagnostic confidence for translational neuroimaging. Front. Psych. 4:95. doi: 10.3389/fpsyt.2013.00095
Jacob, Y., Morris, L., Huang, K. H., Schneider, M., Rutter, S., Verma, G., et al. (2020). Classification between major depressive disorder and healthy controls using functional brain network topology. Biol. Psychiatry 87:S260. doi: 10.1016/j.biopsych.2020.02.673
Ji, J., Zou, A., Liu, J., Yang, C., Zhang, X., and Song, Y. (2021). A survey on brain effective connectivity network learning. IEEE Trans. Neural Netw. Learn. Syst. 34, 1879–1899. doi: 10.1109/TNNLS.2021.3106299
Jing, B., Long, Z., Liu, H., Yan, H., Dong, J., Mo, X., et al. (2017). Identifying current and remitted major depressive disorder with the Hurst exponent: a comparative study on two automated anatomical labeling atlases. Oncotarget 8, 90452–90464. doi: 10.18632/oncotarget.19860
Jun, E., Na, K. S., Kang, W., Lee, J., Suk, H. I., and Ham, B. J. (2020). Identifying resting-state effective connectivity abnormalities in drug-naïve major depressive disorder diagnosis via graph convolutional networks. Hum. Brain Mapp. 41, 4997–5014. doi: 10.1002/hbm.25175
Kambeitz, J., Cabral, C., Sacchet, M. D., Gotlib, I. H., Zahn, R., Serpa, M. H., et al. (2017). Detecting neuroimaging biomarkers for depression: a meta-analysis of multivariate pattern Recognition studies. Biol. Psychiatry 82, 330–338. doi: 10.1016/j.biopsych.2016.10.028
Kassraian-Fard, P., Matthis, C., Balsters, J. H., Maathuis, M. H., and Wenderoth, N. (2016). Promises, pitfalls, and basic guidelines for applying machine learning classifiers to psychiatric imaging data, with autism as an example. Front. Psych. 7:177. doi: 10.3389/fpsyt.2016.00177
Kazeminejad, A., and Sotero, R. C. (2018). Topological properties of resting-state fMRI functional networks improve machine learning-based autism classification. Front. Neurosci. 12:1018. doi: 10.3389/fnins.2018.01018
Kessler, R. C., Van Loo, H. M., Wardenaar, K. J., Bossarte, R. M., Brenner, L. A., Cai, T., et al. (2016). Testing a machine-learning algorithm to predict the persistence and severity of major depressive disorder from baseline self-reports. Mol. Psychiatry 21, 1366–1371. doi: 10.1038/mp.2015.198
Khanna, N., Altmeyer, W., Zhuo, J., and Steven, A. (2015). Functional neuroimaging: fundamental principles and clinical applications. Neuroradiol. J. 28, 87–96. doi: 10.1177/1971400915576311
Khosla, M., Jamison, K., Ngo, G. H., Kuceyeski, A., and Sabuncu, M. R. (2019). Machine learning in resting-state fMRI analysis. Magn. Reson. Imaging 64, 101–121. doi: 10.1016/j.mri.2019.05.031
Kroenke, K., Spitzer, R. L., and Williams, J. B. (2001). The PHQ-9: validity of a brief depression severity measure. J. Gen. Intern. Med. 16, 606–613. doi: 10.1046/j.1525-1497.2001.016009606.x
Kumar, Y., Koul, A., Singla, R., and Ijaz, M. F. (2022). Artificial intelligence in disease diagnosis: a systematic literature review, synthesizing framework and future research agenda. J. Ambient. Intell. Humaniz. Comput. 14, 8459–8486. doi: 10.1007/s12652-021-03612-z
Le Bihan, D., Jezzard, P., Haxby, J., Sadato, N., Rueckert, L., and Mattay, V. (1995). Functional magnetic resonance imaging of the brain. Ann. Intern. Med. 122, 296–303. doi: 10.7326/0003-4819-122-4-199502150-00010
Li, X., Guo, N., and Li, Q. (2019). Functional neuroimaging in the new era of big data. Genom. Proteom. Bioinformat. 17, 393–401. doi: 10.1016/j.gpb.2018.11.005
Li, M., Zhang, J. Y., Zhai, Q., Kang, J. M., Lu, S. F., and Yang, J. (2021). Automated recognition of depression from fewer-shot leaning in resting-state FMRI with REHO using deep convolutional neural network. J. Mech. Med. Biol. 21:686. doi: 10.1142/S0219519421400686
Liu, L. L., Li, J. M., Su, W. J., Wang, B., and Jiang, C. L. (2019). Sex differences in depressive-like behaviour may relate to imbalance of microglia activation in the hippocampus. Brain Behav. Immun. 81, 188–197. doi: 10.1016/j.bbi.2019.06.012
Lord, A., Horn, D., Breakspear, M., and Walter, M. (2012). Changes in community structure of resting state functional connectivity in unipolar depression. PLoS One 7:e41282. doi: 10.1371/journal.pone.0041282
Mccarron, R. M., Shapiro, B., Rawles, J., and Luo, J. (2021). Depression. Ann. Intern. Med. 174, ITC65–ITC80. doi: 10.7326/AITC202105180
Moher, D., Liberati, A., Tetzlaff, J., and Altman, D. G. (2009). Preferred reporting items for systematic reviews and meta-analyses: the PRISMA statement. BMJ 339:b2535. doi: 10.1136/bmj.b2535
Monica, C., Jane, M., Martin, G., Sewitch, M., Belzile, E., and Ciampi, A. (2008). Recognition of depression by non-psychiatric physicians—a systematic literature review and Meta-analysis. J. Gen. Intern. Med. doi: 10.1007/s11606-007-0428-5
Mousavian, M., Chen, J. H., Traylor, Z., and Greening, S. (2021). Depression detection from sMRI and rs-fMRI images using machine learning. J. Intell. Inf. Syst. 57, 395–418. doi: 10.1007/s10844-021-00653-w
Mwangi, B., Matthews, K., and Steele, J. D. (2012). Prediction of illness severity in patients with major depression using structural MR brain scans. J. Magn. Reson. Imaging 35, 64–71. doi: 10.1002/jmri.22806
Nakano, T., Takamura, M., Ichikawa, N., Okada, G., Okamoto, Y., Yamada, M., et al. (2020). Enhancing multi-center generalization of machine learning-based depression diagnosis from resting-state fMRI. Front. Psych. 11:400. doi: 10.3389/fpsyt.2020.00400
Osler, M., Bruunsgaard, H., and Lykke, M. E. (2015). Lifetime socio-economic position and depression: an analysis of the influence of cognitive function, behaviour and inflammatory markers. Eur. J. Pub. Health 25, 1065–1069. doi: 10.1093/eurpub/ckv134
Park, L. T., and Zarate, C. A. Jr. (2019). Depression in the primary care setting. N. Engl. J. Med. 380, 559–568. doi: 10.1056/NEJMcp1712493
Patel, M. J., Andreescu, C., Price, J. C., Edelman, K. L., Reynolds, C. F., and Aizenstein, H. J. (2015). Machine learning approaches for integrating clinical and imaging features in late-life depression classification and response prediction. Int. J. Geriatr. Psychiatry 30, 1056–1067. doi: 10.1002/gps.4262
Pearson, S. D., Katzelnick, D. J., Simon, G. E., Manning, W. G., Helstad, C. P., and Henk, H. J. (1999). Depression among high utilizers of medical care. J. Gen. Intern. Med. 14, 461–468. doi: 10.1046/j.1525-1497.1999.06278.x
Pereira, F., Mitchell, T., and Botvinick, M. (2009). Machine learning classifiers and fMRI: a tutorial overview. NeuroImage 45, S199–S209. doi: 10.1016/j.neuroimage.2008.11.007
Petkova, E., Quitkin, F. M., Mcgrath, P. J., Stewart, J. W., and Klein, D. F. (2000). A method to quantify rater bias in antidepressant trials. Neuropsychopharmacology 22, 559–565. doi: 10.1016/S0893-133X(99)00154-2
Pop-Jordanova, N. (2017). BDI in the assessment of depression in different medical conditions. Pril (Makedon Akad Nauk Umet Odd Med Nauki) 38, 103–111. doi: 10.1515/prilozi-2017-0014
Rabinowitz, J., Williams, J. B. W., Anderson, A., Fu, D. J., Hefting, N., Kadriu, B., et al. (2022). Consistency checks to improve measurement with the Hamilton rating scale for depression (HAM-D). J. Affect. Disord. 302, 273–279. doi: 10.1016/j.jad.2022.01.105
Rajalakshmi, R., Subashini, R., Anjana, R. M., and Mohan, V. (2018). Automated diabetic retinopathy detection in smartphone-based fundus photography using artificial intelligence. Eye (Lond.) 32, 1138–1144. doi: 10.1038/s41433-018-0064-9
Ramasubbu, R., Brown, M. R., Cortese, F., Gaxiola, I., Goodyear, B., Greenshaw, A. J., et al. (2016). Accuracy of automated classification of major depressive disorder as a function of symptom severity. Neuroimage Clin. 12, 320–331. doi: 10.1016/j.nicl.2016.07.012
Rutledge, R. B., Chekroud, A. M., and Huys, Q. J. (2019). Machine learning and big data in psychiatry: toward clinical applications. Curr. Opin. Neurobiol. 55, 152–159. doi: 10.1016/j.conb.2019.02.006
Sen, B., Cullen, K. R., and Parhi, K. K. (2021). Classification of adolescent major depressive disorder via static and dynamic connectivity. IEEE J. Biomed. Health Inform. 25, 2604–2614. doi: 10.1109/JBHI.2020.3043427
Sha, Z., Xia, M., Lin, Q., Cao, M., Tang, Y., Xu, K., et al. (2018). Meta-Connectomic analysis reveals commonly disrupted functional architectures in network modules and connectors across brain disorders. Cereb. Cortex 28, 4179–4194. doi: 10.1093/cercor/bhx273
Sharaev, M., Artemov, A., Kondrateva, E., Ivanov, S., Sushchinskaya, S., Bernstein, A., et al. Learning connectivity patterns via graph kernels for fMRI-based depression diagnostics [C]. 18th IEEE international conference on data mining workshops (ICDMW), Singapore. (2018). 308–314.
Shi, Y., Zhang, L., Wang, Z., Lu, X., Wang, T., Zhou, D., et al. (2021). Multivariate machine learning analyses in identification of major depressive disorder using resting-state functional connectivity: a multicentral study. ACS Chem. Neurosci. 12, 2878–2886. doi: 10.1021/acschemneuro.1c00256
Simon, R. (2003). Supervised analysis when the number of candidate features (p) greatly exceeds the number of cases (n). ACM Sigkdd Explorat. Newslett. 5, 31–36. doi: 10.1145/980972.980978
Sotero, R. C. (2016). Topology, cross-frequency, and same-frequency band interactions shape the generation of phase-amplitude coupling in a neural mass model of a cortical column. PLoS Comput. Biol. 12:e1005180. doi: 10.1371/journal.pcbi.1005180
Stoyanov, D., Kandilarova, S., Paunova, R., Barranco Garcia, J., Latypova, A., and Kherif, F. (2019). Cross-validation of functional MRI and paranoid-depressive scale: results from multivariate analysis. Front. Psych. 10:869. doi: 10.3389/fpsyt.2019.00869
Sundermann, B., Feder, S., Wersching, H., Teuber, A., Schwindt, W., Kugel, H., et al. (2017). Diagnostic classification of unipolar depression based on resting-state functional connectivity MRI: effects of generalization to a diverse sample. J. Neural Transm. (Vienna) 124, 589–605. doi: 10.1007/s00702-016-1673-8
Tai, A. M. Y., Albuquerque, A., Carmona, N. E., Subramanieapillai, M., Cha, D. S., Sheko, M., et al. (2019). Machine learning and big data: implications for disease modeling and therapeutic discovery in psychiatry. Artif. Intell. Med. 99:101704. doi: 10.1016/j.artmed.2019.101704
Targum, S. D., Wedel, P. C., Robinson, J., Daniel, D. G., Busner, J., Bleicher, L. S., et al. (2013). A comparative analysis between site-based and centralized ratings and patient self-ratings in a clinical trial of major depressive disorder. J. Psychiatr. Res. 47, 944–954. doi: 10.1016/j.jpsychires.2013.02.016
Uher, R., Farmer, A., Maier, W., Rietschel, M., Hauser, J., Marusic, A., et al. (2008). Measuring depression: comparison and integration of three scales in the GENDEP study. Psychol. Med. 38, 289–300. doi: 10.1017/S0033291707001730
Valenstein, M., Vijan, S., Zeber, J. E., Boehm, K., and Buttar, A. (2001). The cost-utility of screening for depression in primary care. Ann. Intern. Med. 134, 345–360. doi: 10.7326/0003-4819-134-5-200103060-00007
Varoquaux, G. (2017). Cross-validation failure: small sample sizes lead to large error bars. NeuroImage 180, 68–77. doi: 10.1016/j.neuroimage.2017.06.061
Varoquaux, G., Raamana, P. R., Engemann, D. A., Hoyos-Idrobo, A., Schwartz, Y., and Thirion, B. (2017). Assessing and tuning brain decoders: cross-validation, caveats, and guidelines. NeuroImage 145, 166–179. doi: 10.1016/j.neuroimage.2016.10.038
Wang, X., Ren, Y. S., Yang, Y. H., Zhang, W. S., and Xiong, N. N. A weighted Discriminative Dictionary Learning Method for Depression Disorder Classification using fMRI Data [C]. 2016 IEEE international conferences on BDCloud/SocialCom/SustainCom 2016, Atlanta, GA. (2016). 618–623.
Wang, Y., Wang, J., Jia, Y., Zhong, S., Zhong, M., Sun, Y., et al. (2017). Topologically convergent and divergent functional connectivity patterns in unmedicated unipolar depression and bipolar disorder. Transl. Psychiatry 7:e1165. doi: 10.1038/tp.2017.117
Wei, M., Qin, J., Yan, R., Li, H., Yao, Z., and Lu, Q. (2013). Identifying major depressive disorder using Hurst exponent of resting-state brain networks. Psychiatry Res. 214, 306–312. doi: 10.1016/j.pscychresns.2013.09.008
Whiting, P. F., Rutjes, A. W., Westwood, M. E., Mallett, S., Deeks, J. J., Reitsma, J. B., et al. (2011). QUADAS-2: a revised tool for the quality assessment of diagnostic accuracy studies. Ann. Intern. Med. 155, 529–536. doi: 10.7326/0003-4819-155-8-201110180-00009
Xiao, L., Wang, J., Kassani, P. H., Zhang, Y., Bai, Y., Stephen, J. M., et al. (2020). Multi-hypergraph learning-based brain functional connectivity analysis in fMRI data. IEEE Trans. Med. Imaging 39, 1746–1758. doi: 10.1109/TMI.2019.2957097
Xu, S. X., Deng, W. F., Qu, Y. Y., Lai, W. T., Huang, T. Y., Rong, H., et al. (2021). The integrated understanding of structural and functional connectomes in depression: a multimodal meta-analysis of graph metrics. J. Affect. Disord. 295, 759–770. doi: 10.1016/j.jad.2021.08.120
Yan, B., Xu, X., Liu, M., Zheng, K., Liu, J., Li, J., et al. (2020). Quantitative identification of major depression based on resting-state dynamic functional connectivity: a machine learning approach. Front. Neurosci. 14:191. doi: 10.3389/fnins.2020.00191
Yoshida, K., Shimizu, Y., Yoshimoto, J., Takamura, M., Okada, G., Okamoto, Y., et al. (2017). Prediction of clinical depression scores and detection of changes in whole-brain using resting-state functional MRI data with partial least squares regression. PLoS One 12:e0179638. doi: 10.1371/journal.pone.0179638
Yu, Y., Shen, H., Zeng, L. L., Ma, Q., and Hu, D. (2013). Convergent and divergent functional connectivity patterns in schizophrenia and depression. PLoS One 8:e68250. doi: 10.1371/journal.pone.0083943
Zeng, L. L., Shen, H., Liu, L., and Hu, D. (2014). Unsupervised classification of major depression using functional connectivity MRI. Hum. Brain Mapp. 35, 1630–1641. doi: 10.1002/hbm.22278
Zeng, L. L., Shen, H., Liu, L., Wang, L., Li, B., Fang, P., et al. (2012). Identifying major depression using whole-brain functional connectivity: a multivariate pattern analysis. Brain 135, 1498–1507. doi: 10.1093/brain/aws059
Zhang, X., Braun, U., Tost, H., and Bassett, D. S. (2020). Data-driven approaches to neuroimaging analysis to enhance psychiatric diagnosis and therapy. Biol. Psychiatry Cogn. Neurosci. Neuroimag. 5, 780–790. doi: 10.1016/j.bpsc.2019.12.015
Zhang, Z., Ding, J., Xu, J., Tang, J., and Guo, F. (2021). Multi-scale time-series kernel-based learning method for brain disease diagnosis. IEEE J. Biomed. Health Inform. 25, 209–217. doi: 10.1109/JBHI.2020.2983456
Zhang, R., Kranz, G. S., Zou, W., Deng, Y., Huang, X., Lin, K., et al. (2020). Rumination network dysfunction in major depression: a brain connectome study. Prog. Neuro-Psychopharmacol. Biol. Psychiatry 98:109819. doi: 10.1016/j.pnpbp.2019.109819
Zhao, J., Huang, J., Zhi, D., Yan, W., Ma, X., Yang, X., et al. (2020). Functional network connectivity (FNC)-based generative adversarial network (GAN) and its applications in classification of mental disorders. J. Neurosci. Methods 341:108756. doi: 10.1016/j.jneumeth.2020.108756
Keywords: depression, machine learning, functional connectivity, functional MRI, support vector machine
Citation: Chen Y, Zhao W, Yi S and Liu J (2023) The diagnostic performance of machine learning based on resting-state functional magnetic resonance imaging data for major depressive disorders: a systematic review and meta-analysis. Front. Neurosci. 17:1174080. doi: 10.3389/fnins.2023.1174080
Edited by:
Min Cheol Chang, Yeungnam University, Republic of KoreaReviewed by:
Ling-Li Zeng, National University of Defense Technology, ChinaStavros I. Dimitriadis, University of Barcelona, Spain
Copyright © 2023 Chen, Zhao, Yi and Liu. This is an open-access article distributed under the terms of the Creative Commons Attribution License (CC BY). The use, distribution or reproduction in other forums is permitted, provided the original author(s) and the copyright owner(s) are credited and that the original publication in this journal is cited, in accordance with accepted academic practice. No use, distribution or reproduction is permitted which does not comply with these terms.
*Correspondence: Jun Liu, anVubGl1MTIzQGNzdS5lZHUuY24=
†These authors have contributed equally to this work