 Sharanya Arcot Desai1*
 Muhammad Furqan Afzal1
 Wade Barry1
 Jonathan Kuo2Shawna Benard2
 Christopher Traner3
 Thomas Tcheng1
 Cairn Seale1
 Martha Morrell1,4
- 1NeuroPace, Inc., Mountain View, CA, United States
- 2Department of Neurology, University of Southern California, Los Angeles, CA, United States
- 3Department of Neurology, Yale University, New Haven, CT, United States
- 4Department of Neurology and Neurological Sciences, Stanford University, Stanford, CA, United States
Hundreds of 90-s iEEG records are typically captured from each NeuroPace RNS System patient between clinic visits. While these records provide invaluable information about the patient’s electrographic seizure and interictal activity patterns, manually classifying them into electrographic seizure/non-seizure activity, and manually identifying the seizure onset channels and times is an extremely time-consuming process. A convolutional neural network based Electrographic Seizure Classifier (ESC) model was developed in an earlier study. In this study, the classification model is tested against iEEG annotations provided by three expert reviewers board certified in epilepsy. The three experts individually annotated 3,874 iEEG channels from 36, 29, and 35 patients with leads in the mesiotemporal (MTL), neocortical (NEO), and MTL + NEO regions, respectively. The ESC model’s seizure/non-seizure classification scores agreed with the three reviewers at 88.7%, 89.6%, and 84.3% which was similar to how reviewers agreed with each other (92.9%–86.4%). On iEEG channels with all 3 experts in agreement (83.2%), the ESC model had an agreement score of 93.2%. Additionally, the ESC model’s certainty scores reflected combined reviewer certainty scores. When 0, 1, 2 and 3 (out of 3) reviewers annotated iEEG channels as electrographic seizures, the ESC model’s seizure certainty scores were in the range: [0.12–0.19], [0.32–0.42], [0.61–0.70], and [0.92–0.95] respectively. The ESC model was used as a starting-point model for training a second Seizure Onset Detection (SOD) model. For this task, seizure onset times were manually annotated on a relatively small number of iEEG channels (4,859 from 50 patients). Experiments showed that fine-tuning the ESC models with augmented data (30,768 iEEG channels) resulted in a better validation performance (on 20% of the manually annotated data) compared to training with only the original data (3.1s vs 4.4s median absolute error). Similarly, using the ESC model weights as the starting point for fine-tuning instead of other model weight initialization methods provided significant advantage in SOD model validation performance (3.1s vs 4.7s and 3.5s median absolute error). Finally, on iEEG channels where three expert annotations of seizure onset times were within 1.5 s, the SOD model’s seizure onset time prediction was within 1.7 s of expert annotation.
1. Introduction
Clinical management of epilepsy is fraught with challenges (Dalic and Cook, 2016). One of them is the difficulty with objectively assessing patient responses to treatments since patient self-reports of seizures are unreliable (Hoppe et al., 2007). Baseline ambulatory iEEG recordings captured using implanted devices such as the NeuroPace RNS System contain features that correlate with clinical outcomes (Skarpaas et al., 2018; Desai et al., 2019a) and can be used as an objective data source for supplementing patient self-reports of seizures. Although not necessarily indicative of a clinical seizure, another straightforward and objective measure is simply the numbers and types of electrographic seizures captured in the ambulatory iEEG recordings. Comparing numbers and types of electrographic seizures before and after treatment changes could potentially be a reliable indicator of the patient’s clinical response. Counts of electrographic seizures in ambulatory iEEG recordings can have diagnostic uses too. For example, if electrographic seizures are restricted to certain channels in the ambulatory multi-channel iEEG recordings, the patient may be identified as a candidate for resection surgery (King-Stephens et al., 2015). Thus, identifying electrographic seizures in iEEG recordings is valuable and of particular interest to physicians.
Hundreds of 90-s, 4-channel iEEG records are typically captured from each patient treated with the RNS System between clinic visits, which are generally 3–6 months apart. Manual review of these iEEG records prior to every visit adds significant time to the clinic workflow, and can lead to reviewer fatigue and increased errors in iEEG review. Additionally, manual iEEG review can be subjective in nature (Halford et al., 2015). Differences in EEG training and varying levels of experience may contribute to differences in manual iEEG interpretations. Automated methods for classifying iEEG recorded electrographic seizures and identifying channels with the earliest seizure onsets could (1) simplify iEEG review and speed up clinic workflows, (2) facilitate objective iEEG analysis, and (3) contribute to better clinical outcomes.
Electrographic seizure patterns can vary substantially from patient to patient (Haas et al., 2007). Manually determining rules to identify each type of electrographic seizure and seizure onset pattern is a daunting process, with machine learning models trained using hand-engineered features having limited practical applications. For example, machine learning models are frequently trained to classify iEEG data within a single patient or a small group of patients (Thodoroff et al., 2016; Acharya et al., 2018; Ansari et al., 2019; Roy et al., 2019). A generic model that can work out-of-the box for many patient and seizure types would have greater practical usability.
Deep learning models that can directly learn patterns from large amounts of data have made great strides in recent years (LeCun et al., 2015). For example, transformer-based models can take a text prompt and generate relevant synthetic videos automatically (Singer et al., 2022). Language models capable of understanding human conversations can reply to complex verbal queries (Brown et al., 2020). In the domain of computer vision, self-driving cars serve as a prime example of the progress made with deep convolutional neural networks (CNN) (Chen and Huang, 2017; Totakura et al., 2021). Even in the medical field, several studies have leveraged deep neural networks to identify abnormalities in MRIs, mammograms, and retinal images with a high degree of confidence (Ting et al., 2017; Lundervold and Lundervold, 2019; Yala et al., 2019). Several medical diagnostic tools with “AI in the loop” (AI, Artificial Intelligence) that aid physicians in making clinical decisions have also been recently approved by the FDA (Benjamens et al., 2020). Thus, the data science tools required for learning complex patterns directly from data are available and have demonstrated successful practical applications in several domains.
Big datasets are central to all these models. With the NeuroPace RNS System (Jarosiewicz and Morrell, 2021), over 10 million iEEG records have been captured from >4,500 patients. Out of this, ~1 million iEEG records have been captured from 256 patients enrolled in the RNS System feasibility, pivotal, and LTT clinical trials (Sun and Morrell, 2014; Nair et al., 2020). Large datasets offer the opportunity to train deep learning models directly on the dataset without the need for extracting hand-engineered features and creating hand-engineered rules. By manually labeling a fraction of the RNS System clinical trial dataset (~138,000 iEEG records from 113 patients), an electrographic seizure classifier model was trained with 95.7% class-balanced classification accuracy in test patients (iEEG records from 20% of 113 patients). The entire clinical trial dataset could not be manually labeled because of resource constraints. A flowchart showing RNS System iEEG data split into training and test datasets is available in a previous publication by our group (Barry et al., 2021). Since model training and testing was performed on the dataset annotated by the same individual, it is not known how the model would fair against reviewer physicians’ annotations in a practical setting. Further, it is not known how the model’s agreement with reviewers would compare with reviewer agreement with other reviewers. Finally, it is not known if the trained models would have similar performance in different patient populations, and on data captured from a newer version of the neurostimulator. To address these questions, a new test dataset of iEEG records was created with annotations from three independent expert reviewers. Reviewer agreement with each other as well as model agreement with the reviewers are reported.
In addition to identifying electrographic seizures in iEEG records, physicians often also manually identify seizure onset times. This information is valuable for studying seizure spread patterns and for configuring neurostimulator detection settings for responsive closed-loop stimulation. The task of manually identifying seizure onset times is particularly time-consuming since brain activity patterns at the onset of seizures can evolve slowly and often requires reviewing the activity at multiple time and frequency scales (Spencer et al., 1992; Lee et al., 2000; Perucca et al., 2014; Nune et al., 2019). Hence, an automated method for identifying seizure onset times is desirable. Training a reliable deep learning-based seizure onset time detection model from scratch would require a large number of manually annotated examples of seizure onset times from many patients. Alternatively, transfer-learning techniques could be applied to fine-tune a previously trained model with a relatively small, annotated training dataset (Weiss et al., 2016). Since the electrographic seizure classifier model was trained on a large multi-patient dataset, it could serve as an excellent starting point for solving the problem of identifying seizure onset times. In this paper, we explore this idea with data augmentation techniques applied to a relatively small, annotated dataset for seizure onset time estimation.
This paper significantly adds to existing literature on leveraging deep learning and machine learning techniques for facilitating data review in epilepsy. First, it quantifies expert seizure classification agreements in patients with seizure onsets in mesial temporal and in neocortical regions. Second, it compares the trained electrographic seizure classifier scores against each reviewer individually and against all three reviewers grouped together. Third, it demonstrates that the seizure classifier model can serve as an excellent starting-point model for solving other related problems with small, labeled datasets.
2. Methods
2.1. The RNS system and iEEG records
The NeuroPace RNS System (Figure 1) is FDA approved for the treatment of drug-resistant partial onset epilepsy in adults 18 years and older (Jarosiewicz and Morrell, 2021). Details about the RNS System have been published in numerous previous studies (Skarpaas et al., 2018; Desai et al., 2019a,b, 2022; Barry et al., 2021). Briefly, the device delivers responsive neurostimulation when patient-specific abnormal brain patterns are detected. Programming the responsive neurostimulator with patient-specific detection patterns is performed by the patient’s physician. Physicians also program the stimulation settings, which include the stimulation frequency, charge density, burst duration, pulse width, and stimulation pathways.
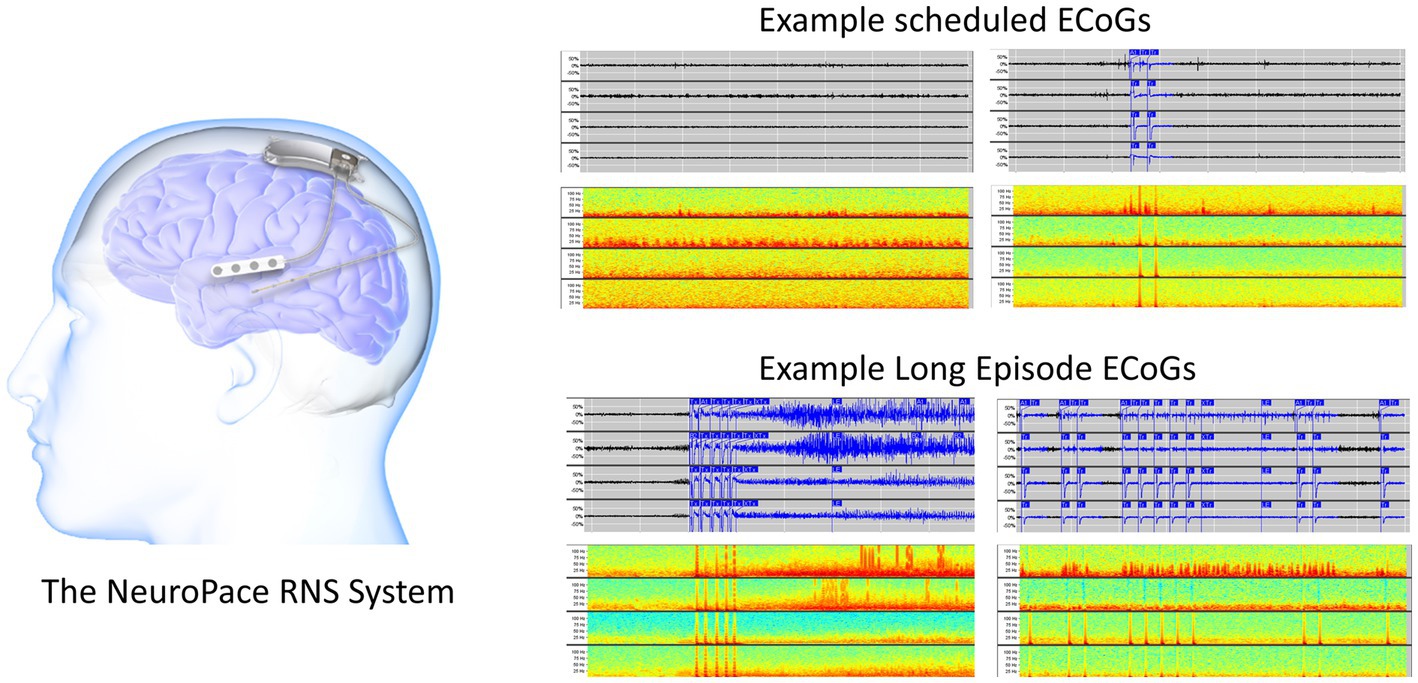
Figure 1. The RNS System (left). Two example 90-s scheduled iEEG records in time-series and spectrogram representation (right top). Two example 90-s long episode (LE) iEEG records in time-series and spectrogram representation (right bottom).
In addition to stimulating abnormal activity, the device also captures short iEEG recordings of brain activity. Each iEEG record contains 4-channels of iEEG data with each channel sampled at 250 Hz. The two major types of iEEG records captured by the device are long episode (LE) iEEG records and scheduled iEEG records (Figure 1). As the name suggests, storage of LE iEEG records is triggered when long durations of abnormal activity are detected by the device. Many, but not all, of the LE iEEG records contain electrographic seizures. Scheduled iEEG records, on the other hand, are captured at scheduled times every day, typically at 2 a.m. and 2 p.m., and usually contain baseline activity but rarely electrographic seizures.
2.2. The electrographic seizure classifier model
Each channel of activity in 138,000 iEEG records was manually annotated as electrographic seizure or non-seizure by a NeuroPace employee (Barry et al., 2021). An iEEG record clustering tool was used to speed up the process of labeling such a large dataset. Three other employees, including the Chief Medical Officer of NeuroPace, an MD who is board certified in epilepsy, were consulted when the activity could not be annotated with a high degree of confidence. iEEG channels from 80% of 113 patients were used for training a series of convolutional neural network (CNN) models to perform the binary classification task of classifying each iEEG channel as electrographic seizure or not. The best model, a ResNet50 architecture-based model, had a class-balanced classification accuracy of 95.7%, and F1 score of 94.3% on iEEG records from the test dataset (iEEG records from the remaining 20% of patients). Details about the unsupervised iEEG clustering process, time taken to manually label each channel in 138,000 iEEG records, and methods used for training the CNN models can be found in a previous publication (Barry et al., 2021).
2.3. Sample size computations to determine the number of iEEGs records needed in the clinical validation dataset
A statistician was consulted to compute the sample size required to clinically validate the trained electrographic seizure classifier. Sample size computations were performed assuming a true model classification rate of at least 85%, target performance goal of at least 70%, and within patient correlation of classification scores in the range of 0.4–0.7. Selection of these parameters was guided by ad hoc analyses performed on the RNS System dataset, and a previous study (Onorati et al., 2021), which aimed to clinically validate an electrographic seizure classifier model on continuous heart rate and electrodermal activity captured using a wrist worn device.
Anecdotally, it is known that between 30% and 40% of long episodes (LE) are electrographic seizures, while less than 5% of scheduled iEEG records contain electrographic seizures. Hence, to increase the chances of picking iEEG records with electrographic seizures when randomly selecting test iEEG records, selections were only made from the LE iEEG records from each patient. Additionally, since LE type iEEG records are the primary iEEG type that needs to be classified as an electrographic seizure or not in a practical setting, selecting only LE iEEG records for testing the performance of the trained models is appropriate. Subsequently, 10 LE iEEG records were randomly selected from each RNS System patient, and an assumption of including 2–6 electrographic seizures per patient was made for sample size calculations.
Given a target number of iEEG records required to perform the testing, selecting the iEEG records from a larger number of patients provided higher statistical power than selecting the same target number from fewer patients, which requires a larger number of iEEG records per patient (Table 1). Based on power calculations, a total of 1,000 iEEG records were randomly selected from 100 RNS System patients, with 10 randomly selected LE iEEG records from each patient.
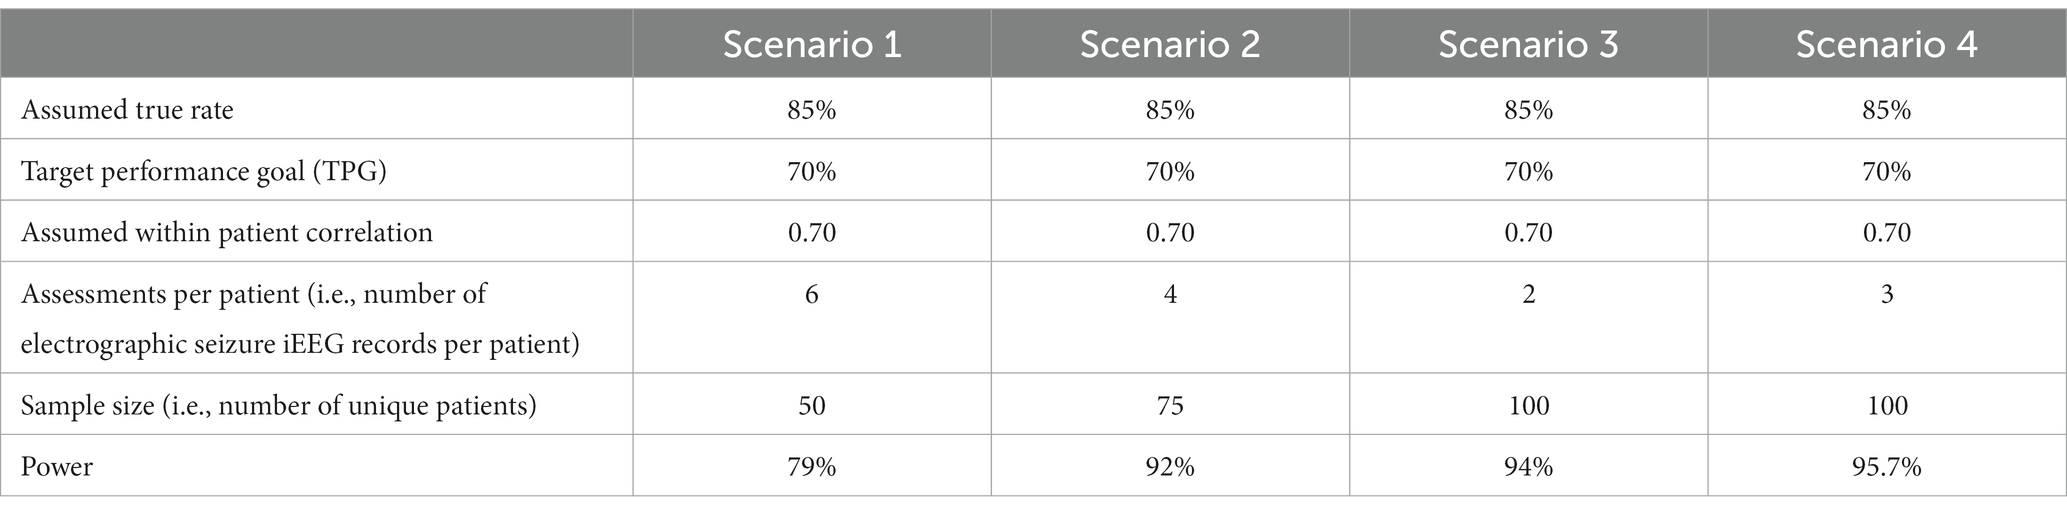
Table 1. Sample size computations for a few scenarios with different numbers of assessments per patient, and different numbers of patients.
2.4. Expert review of iEEG data
Three expert reviewers independently annotated each channel of brain activity in the 1,000 randomly chosen LE iEEG records from 100 RNS System patients. The 1,000 iEEG records were presented to the physicians in a randomized order via an iEEG record annotation web-based tool. A screenshot of the reviewer annotation tool is shown in supplementary material (Supplementary Figure S1). Time-series waveforms of the 4 channels of brain activity along with their spectrogram representation were presented. The iEEG annotation tool allowed physicians to zoom into the time-series waveforms or spectrograms at 5 different timescales—5 s, 10 s, 30 s, 60 s or full (i.e., to view the entire length of the iEEG record). Additionally, physicians could also vertically zoom in on the timeseries waveforms and spectrogram images.
The reviewers were asked to annotate each channel of each iEEG record as electrographic seizure, non-seizure, or unsure. On the electrographic seizure channels, the reviewers were additionally asked to annotate the seizure onset time at a resolution of 1/10th of a second or 1 decimal point.
Qualifications of the three reviewers recruited for labeling the test dataset are presented below.
Reviewer 1: Assistant Professor of Neurology, Epilepsy Division. Associate Fellowship Director, Clinical Neurophysiology/Epilepsy, Department of Neurology, Yale School of Medicine. Board certifications: Neurology, Clinical Neurophysiology, Epilepsy.
Reviewer 2: Assistant Professor of Neurology, Epilepsy Division, Department of Neurology, Keck School of Medicine. Board certifications: Neurology, Clinical Neurophysiology, Epilepsy.
Reviewer 3: Assistant Professor of Neurology, Epilepsy Division, Department of Neurology, Keck School of Medicine. Board certifications: Neurology, Epilepsy.
2.5. Test data set split
Out of the 100 patients included in the test dataset, 50 had the newer RNS-320 model of the RNS Neurostimulator implanted, while the remaining 50 patients had the older RNS-300 M model implanted. A deliberate decision was made to evenly split the test data between the two models of the RNS System to determine if the neurostimulator version influenced the trained model’s performance. Since the Electrographic Seizure Classifier (ESC) model (Barry et al., 2021) was trained entirely on data captured from the older RNS-300 M model, a lower performance on data captured from the RNS-320 might suggest data drift and the need for re-training the ESC model on data captured from the RNS-320.
Additionally, out of the 100 patients included in the test dataset, 36 had both RNS leads implanted in the mesiotemporal region, 29 had both leads implanted in the neocortical region, and the remaining 35 had leads implanted in both regions. The data split by lead location was not pre-determined. Instead, data were selected from 100 randomly picked patients to generally reflect the RNS System’s overall patient population.
2.6. Model vs. reviewer scores
2.6.1. ESC model vs. reviewer scores on iEEG channels
The electrographic seizure classifier (ESC) model was re-trained on the same training datasets as before (Barry et al., 2021), using the same model architecture (ResNet50), but using an updated version of TensorFlow (version:2.6.0). The same five cross-validation data splits were performed to produce five versions of the electrographic seizure classifier models. Each iEEG channel in the reviewer-annotated iEEG records was converted to a spectrogram image by using the function matplotlib.pyplot.specgram with window size 256 and step size 128. The resulting spectrogram images were tested on all five versions of the trained ESC models. The trained models returned prediction scores in the range of 0–1. An operating point of 0.5 was selected for determining the ESC model’s prediction class of each individual iEEG channel. Results are also shown for an operating point of 0.8 for comparison purposes.
The methodology described in Scheuer et al. (2017, 2021) was followed to calculate pairwise sensitivity and false positive rates for inter-reviewer and reviewer-model pairs. In the inter-reviewer comparisons, each reviewer was used as a reference against which the other two reviewers were tested. Similarly, in the model to reviewer comparisons, each of the three reviewers was used as a reference, and the models were tested against them.
To evaluate whether the models were noninferior to the human reviewers (discussed in Scheuer et al., 2017), an accelerated bootstrap analysis (BCa) of the pairwise sensitivity and false positive rates for all patients was conducted. This approach resembled the one outlined in Scheuer et al. (2017). The 95% confidence intervals for the mean sensitivity and false positive rates were computed for each comparison (inter-reviewer and model to reviewer).
2.6.2. ESC model vs. reviewer scores on iEEG records
In some applications, it may be sufficient to classify each iEEG record as seizure or not, without the need for knowing which iEEG channels contain the electrographic seizure. For comparing the model scores with reviewer scores at the iEEG record-level, the maximum seizure probability among the 1–4 (usually 4) iEEG channels was taken, and if it exceeded the model operating point, the iEEG record was classified as an electrographic seizure. Similarly, if the reviewers annotated any one of the channels in the iEEG record as an electrographic seizure, the iEEG record was considered to be an electrographic seizure record. Higher model operating points of 0.8 and 0.9 were selected for this task since the probability of false positives is high when all channels need to be classified as non-seizures for the multi-channel iEEG record to be classified as non-seizure, but only one channel needs to be classified as seizure for the iEEG record to be a classified as seizure.
2.6.3. Seizure onset detection model training and validation
Seizure onset times were annotated on 4,859 iEEG channels from 50 RNS System patients by a NeuroPace employee. The annotated dataset was augmented by shifting the time series data points to create time-shifted versions of the same iEEG channel. Time-shifting was done several times on each iEEG channel but only in the one direction, with the electrographic activity shifted to the right by deleting several seconds of activity towards the end of the file and duplicating an equal amount of activity in the beginning of the file. The amount of right shift was randomly determined in ranges incrementing by 5 s. An example original spectrogram and a few time-shifted versions of the same spectrogram are shown in Figure 2. The data augmentation step produced a total of 30,768 spectrogram images.

Figure 2. Example original and time-shifted (augmented) annotated iEEG channels used for training a seizure onset time detection model. The seizure onset time annotated in the original dataset was at 29.40 s. After time-shifting, the onset times in the augmented spectrograms were at 41.08, 54.47, and 64.36 s, respectively.
Seizure activity was not time-shifted in the opposite direction (to the left) because in that case the resulting augmented images could look unrealistic if the seizure activity in the original image ended before the end of the file, since duplicating activity towards the end of the file could make the resulting image appear to contain 2 back-to-back seizure events, which could confuse model training.
The SOD model was trained with and without the augmented data to assess whether the data augmentation process contributed to increased model performance. Additionally, the ESC model’s weights were used as the starting point for fine-tuning, but also random weight initialization was tested, along with ImageNet weights (Deng et al., 2009) to check if the ESC weights offered any training advantage.
All layers of the ESC model were fine-tuned to make the SOD model. The code for fine-tuning the ESC model is provided in the Supplementary section. To train the SOD model, the final sigmoid activation layer of the ESC model was replaced with a dense layer which is appropriate for regression tasks. Adam optimizer was used with learning rate of 0.0001. Model training and validation experiments were performed on a Linux Ubuntu 18.04 machine using Tensorflow version 2.6.0. Following preliminary exploration of the hyperparameter space, model training was performed for 400 epochs in each training fold. Five-fold cross-validation was performed with 80% of the data used for training and 20% used for testing. Models were saved after every epoch of training, and the saved model which had the lowest median absolute error on the held-out validation dataset was selected in each cross-validation fold. The selected SOD models were tested on iEEG channels with reviewer-annotated seizure onset times.
3. Results
3.1. Reviewer labeling of 1,000 iEEG records as electrographic seizure or non-seizure
Reviewers 1, 2, and 3 annotated 98.2%, 99.7%, and 98.9%, respectively, of the 1,000 randomly selected LE iEEG records as electrographic seizure or non-seizure. A small number of iEEG records were not annotated by the reviewers primarily because the reviewer was not able to decide what the activity represented. Overall, iEEG annotations from all three reviewers were available on 978 or 97.8% of the iEEG records. The numbers of iEEG records and channels annotated by the three reviewers is shown in Table 2.
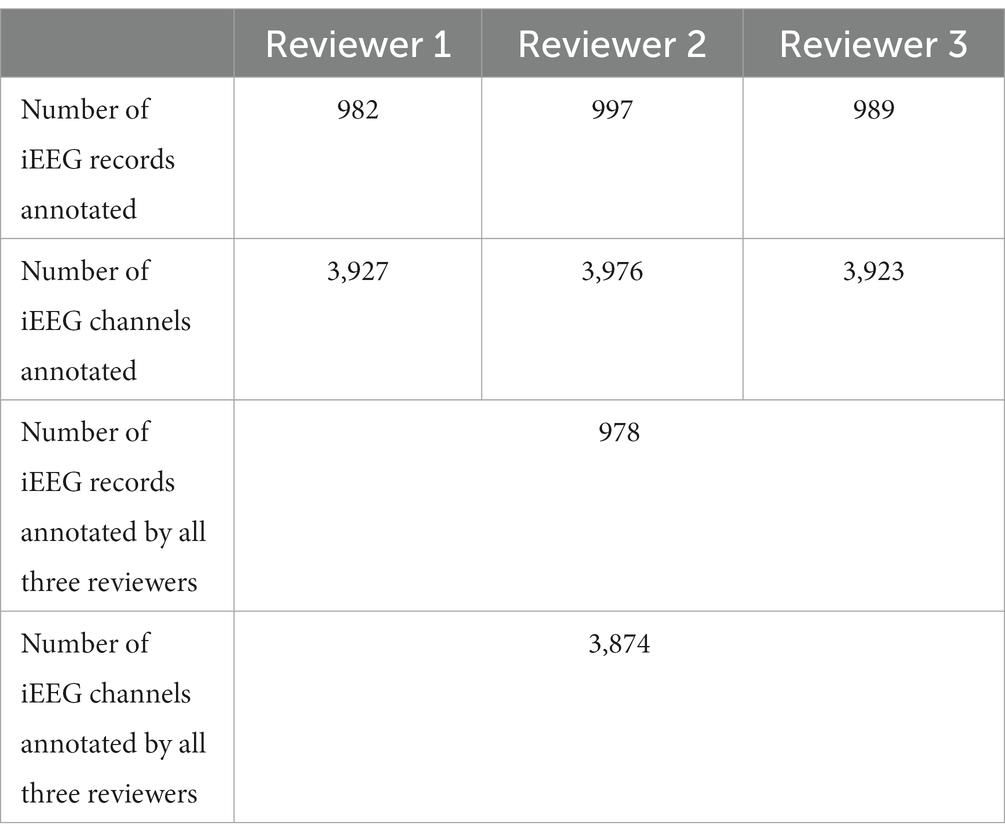
Table 2. Numbers of iEEG records and channels annotated as electrographic seizure or non-seizure by the three reviewers.
3.2. Reviewer agreement with each other, and reviewer agreement with the trained ESC model
3.2.1. iEEG channels where all three reviewers agreed
A subset of iEEG channels on which all three reviewers provided the same (electrographic seizure or non-seizure) annotation (3,225 or 83.24% of iEEG channels) was selected. These represent iEEG channels with clear seizure or non-seizure activity. The classification performance of the trained ESC model on this subset of iEEG channels was analyzed using precision-recall curves and class-balanced accuracy metrics. All 5 versions of the trained ESC models (i.e., models from the 5 cross-validation folds) were applied to the test dataset resulting in 5 precision-recall curves as shown in Figure 3. The mean AUPRC (Area Under the Precision Recall Curve) of the 5 precision-recall curves was 0.96. In comparison, the AUPRC of a model with chance level performance would be 0.50.
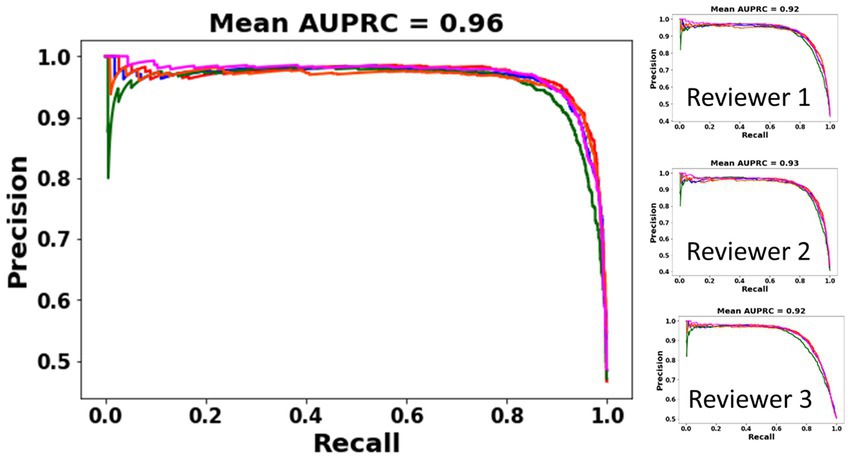
Figure 3. PR (Precision-Recall) curves of the 5 ESC models (each model trained on data from one cross-validation split) on a subset of iEEG channels in which all three reviewers’ annotations matched (left). PR curves and AUPRC of the ESC models against each individual reviewer (right).
On the subset of iEEG channels classified by all three experts as electrographic seizure or non-seizure (n = 3,225), the trained ESC models had an overall agreement of 92.5% at a model operating point of 0.5 (Table 3A), and an overall agreement of 93.19% at a model operating point of 0.8 (Table 3B). As expected, higher agreement on seizure channels only (95.2%) was observed with a lower operating point (0.5) since the model is more easily able to classify iEEG channels as electrographic seizures with a lower seizure threshold, and a higher agreement on non-seizure channels only was observed (95.4%) with a higher operating point (0.8). Model agreement with experts on iEEG channels split by lead location is also shown in Tables 3A,B at the two operating points of 0.5 and 0.8, respectively. At both operating points, the trained ESC models had significantly better classification performance (p < 0.05, independent t-test) on MTL leads compared to Neocortical and MTL + Neocortical leads. Agreement between the ESC model and experts in each training fold for each lead location is shown in the Supplementary section. The trained models had comparable performance on both models of RNS neurostimulations (model 300 M and 320) (Table 3C).
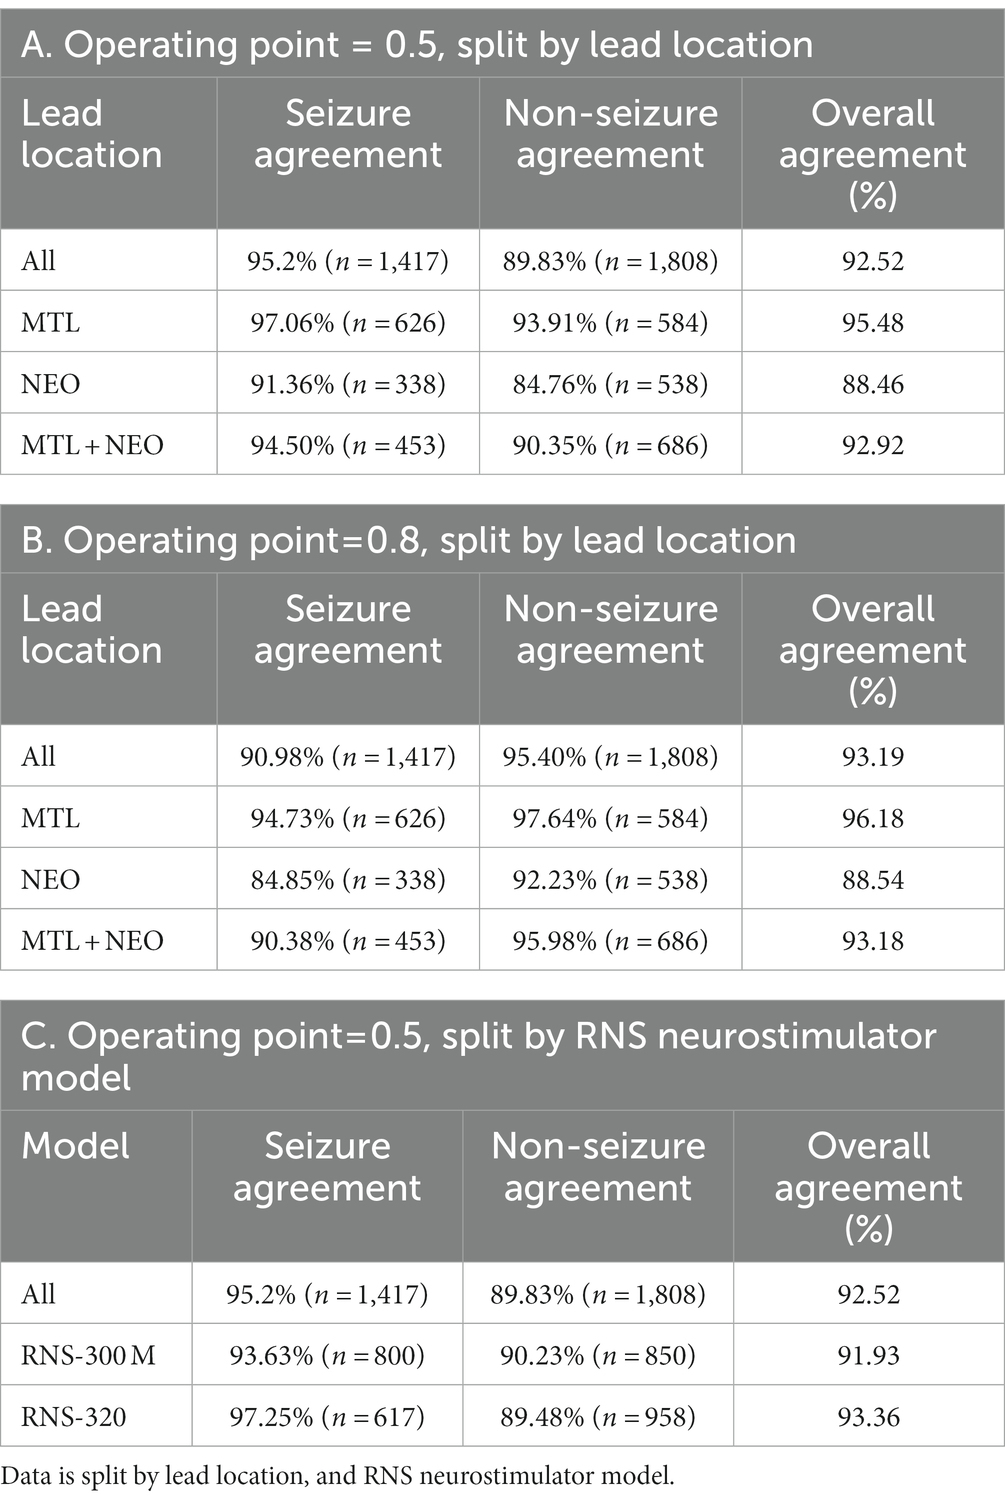
Table 3. Agreement between ESC model and reviewers on iEEG channels with full reviewer agreement.
3.2.2. Agreement on all iEEG channels
Model classification certainty was compared against combined reviewer classification certainty. Out of 3,874 iEEG channels annotated by all three reviewers, 1,808 or 46.67% of iEEG channels were annotated as non-seizure by all three reviewers. In other words, the combined reviewer-provided seizure probability on 46.67% of all annotated iEEG channels was 0. The trained ESC models gave these iEEG channels a mean seizure probability score in the range [0.12–0.19]. Figure 4 shows mean ± std. model probability scores vs. combined reviewer probability scores. Seizure probability scores from the 5 splits of ESC model are shown in the Supplementary section. In 382 or 9.8% of the iEEG channels, only 1 out of three reviewers classified the iEEG channels as showing an electrographic seizure. On these channels, the overall reviewer-provided seizure probability was 1/3 or 0.33, and ESC model’s means seizure probability score was in the same range [0.32–0.42]. Similarly, 215 or 5.5% IEEG channels were classified as electrographic seizures by 2 out of the three reviewers, giving these iEEG channels a combined reviewer-provided seizure probability value of 2/3 or 0.66. On these channels, the 5 versions of the ESC models produced mean seizure probability scores in the range [0.61–0.70]. Finally, the remaining 1,417 or 36.6% of IEEG channels were classified by all three reviewers as electrographic seizure, giving them a combined reviewer-provided seizure probability score of 1.0. The 5 versions of the ESC models gave these iEEG channels mean seizure probability in the range [0.92–0.95].
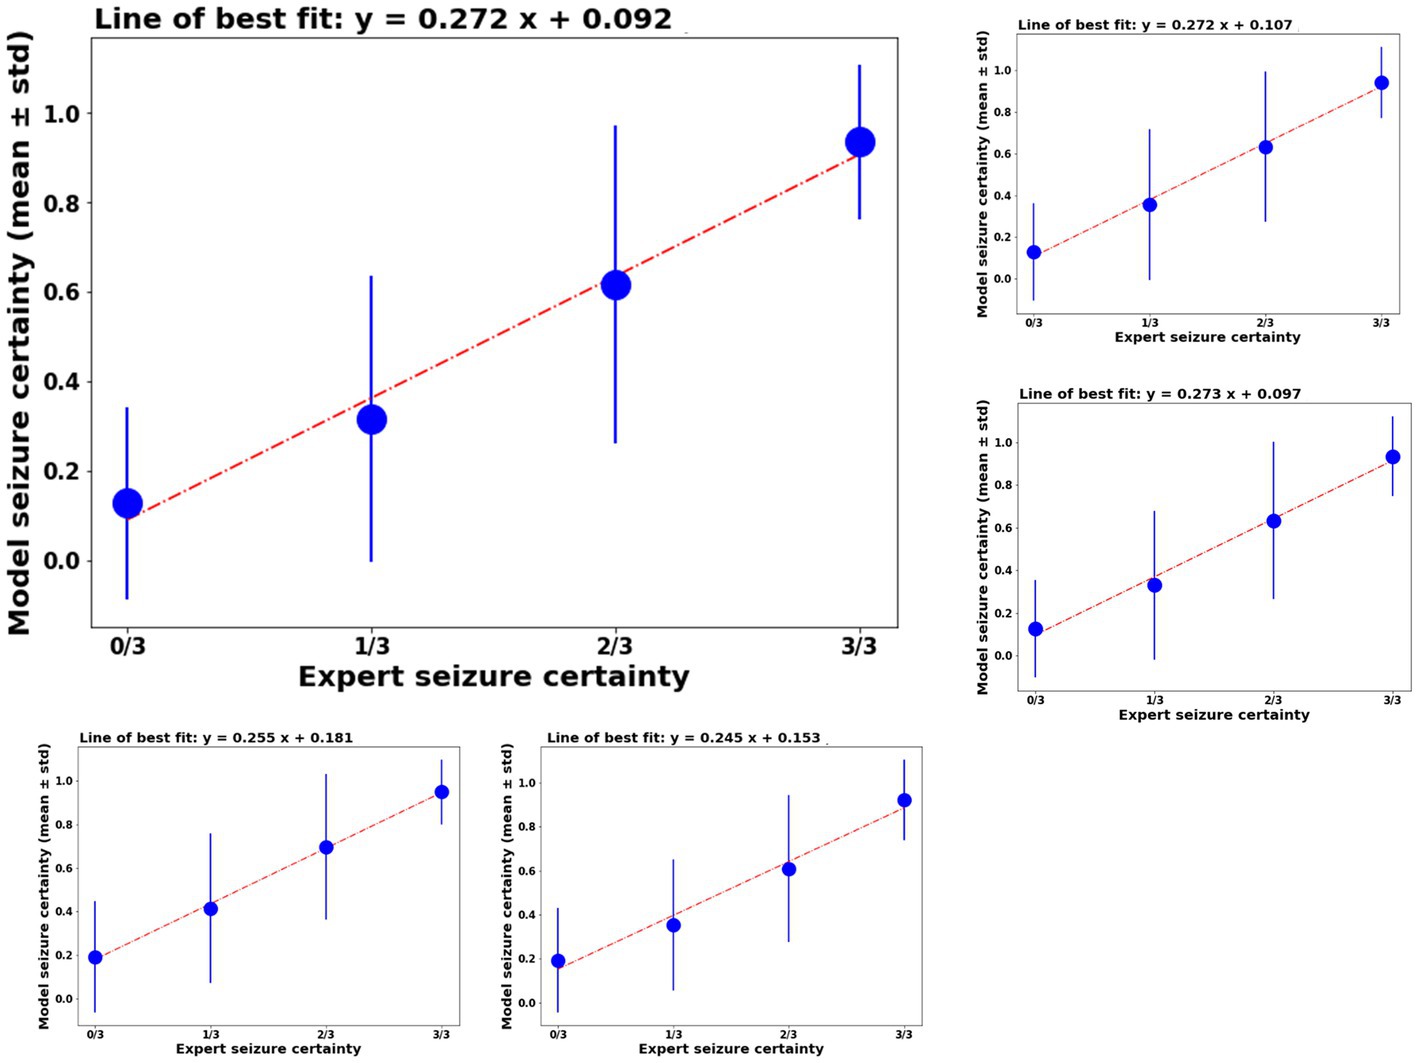
Figure 4. Left top panel: model certainty of the ESC model trained on fold 1 of the training data (y-axis) vs combined reviewer certainty (x-axis). Other panels: similar performance on the other 4 folds of the model training.
The ESC model’s seizure probability scores had a linear relationship with reviewer probability scores. A linear line of best fit was calculated for ESC model scores vs. reviewer model scores and are shown above each plot in Figure 4. In all cases, the r2 values (a measure of goodness of fit) was ≥0.98.
The ESC model’s iEEG channels classification agreement with each individual reviewer was at the same level as the reviewer’s agreement with other reviewers (Table 4). Reviewer 1 annotated a total of 3,927 iEEG channels. Out of these, 41.7% were annotated as electrographic seizures while the remaining 58.3% were annotated as non-electrographic seizures. Reviewer 1’s overall agreement with reviewers 2 and 3 was 92.9% and 86.9%, respectively. Against the ESC model, the average (of 5 ESC model versions) overall agreement was at 86.8% with the seizure and non-seizure annotation agreements at 90.4% and 84%, respectively. Reviewer 1’s agreements with the other 2 reviewers and the ESC models were higher on the MTL channels compared to neocortical channels.
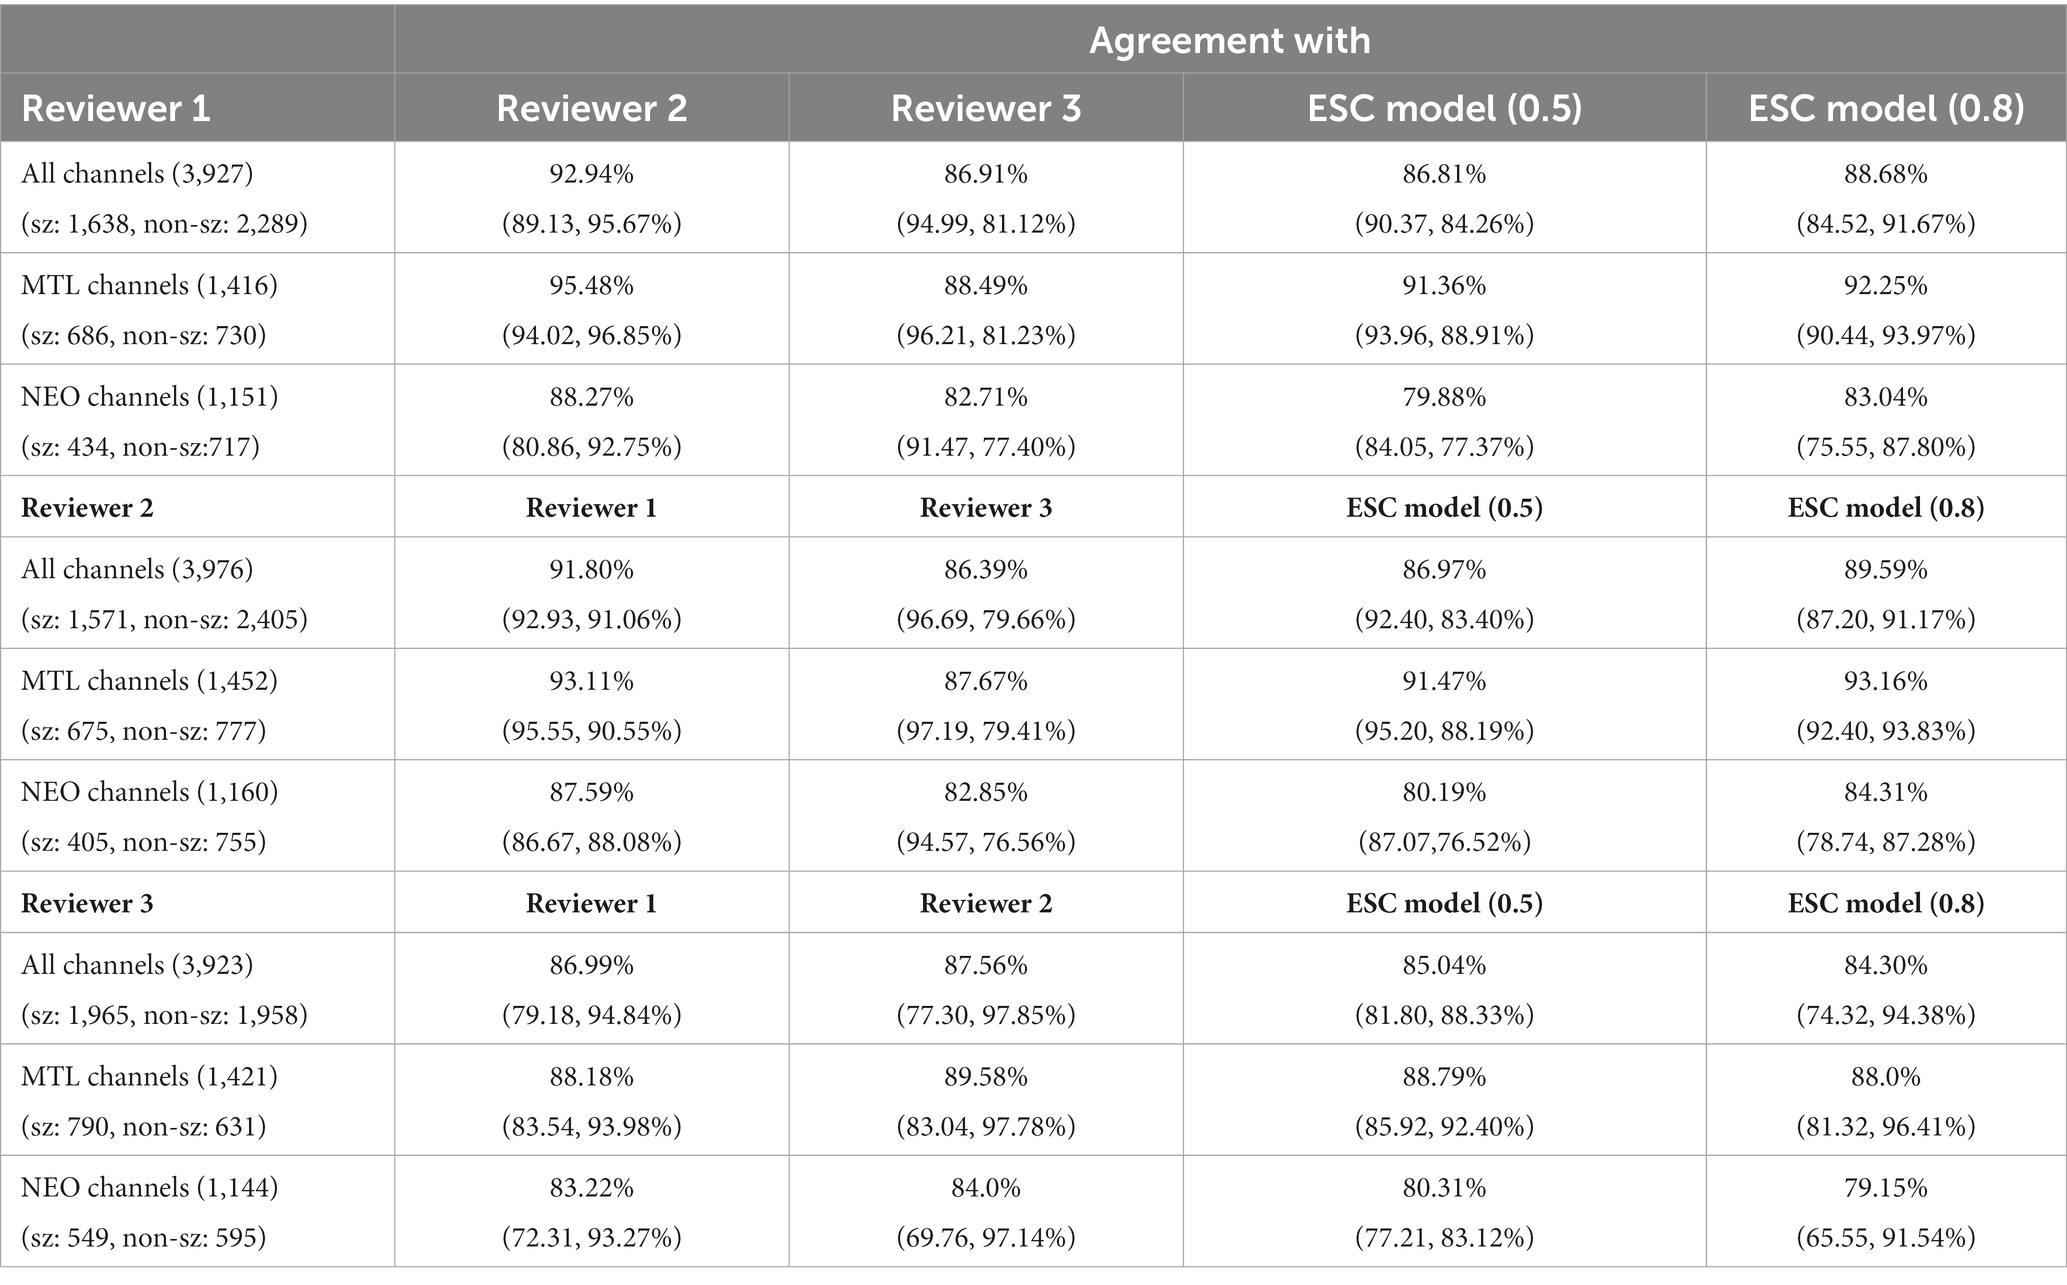
Table 4. iEEG channel classification agreement between reviewers and ESC model.
Reviewer 2 annotated a total of 3,976 iEEG channels, with 39.5% (1,571) of the iEEG channels annotated as seizures and the remaining 60.5% (2,405) annotated as non-seizures. Out of the three reviewers, reviewer 2 annotated the smallest percentage of iEEG channels as seizures. Reviewer 2’s overall agreements with reviewers 1 and 3 was at 91.8% and 86.4%, with relatively high seizure agreements of 92.9% and 96.7%, respectively. Reviewer 2’s overall agreement with the ESC model was 86.8%, with seizure and non-seizure class agreements at 90.4% and 84.3%, respectively. Reviewer 2’s agreement with other reviewers and the ESC model was higher on MTL channels compared to neocortical channels.
Reviewer 3 annotated a total of 3,923 iEEG channels. A relatively high percentage (50.1%) of the total annotated iEEG channels were given the seizure class label by reviewer 3, with the remaining 49.9% annotated as non-seizures. Reviewer 3’s seizure class agreement with the other 2 reviewers was relatively low at 79.1% and 77.3%, respectively. Against the ESC model, reviewer 3’s overall, seizure, and non-seizure class agreements were at 85%, 81.8%, and 88.3%, respectively. Like reviewers 1 and 2, reviewer 3’s agreements with the other 2 reviewers were higher on MTL channels compared to neocortical channels. Overall, MTL channels on average had 5.65% greater agreement compared to neocortical channels in all three reviewers’ annotations (p < 0.05, paired t-test).
The ESC model’s agreement with each of the reviewers at a higher operating point of 0.8 is also shown in the table for comparison. In this case, model prediction probabilities ≥0.8 were assigned seizure class, and probabilities <0.8 were given the non-seizure class. As expected, the higher model operating point produced higher non-seizure agreements and lower seizure class agreements with all three reviewers.
Performance of the ESC model against each of the three reviewers is also shown using individual reviewer precision-recall curves (Figure 3 right panel). The AUPRC for Reviewers 1, 2, 3 are 0.92, 0.93, and 0.92, respectively.
As described in Section 2, pairwise sensitivity and false positive rates were computed following methods described in Scheuer et al. (2017, 2021). Figure 5 illustrates that models demonstrated noninferiority compared to the human reviewers according to the criteria outlined in Scheuer et al. (2017).
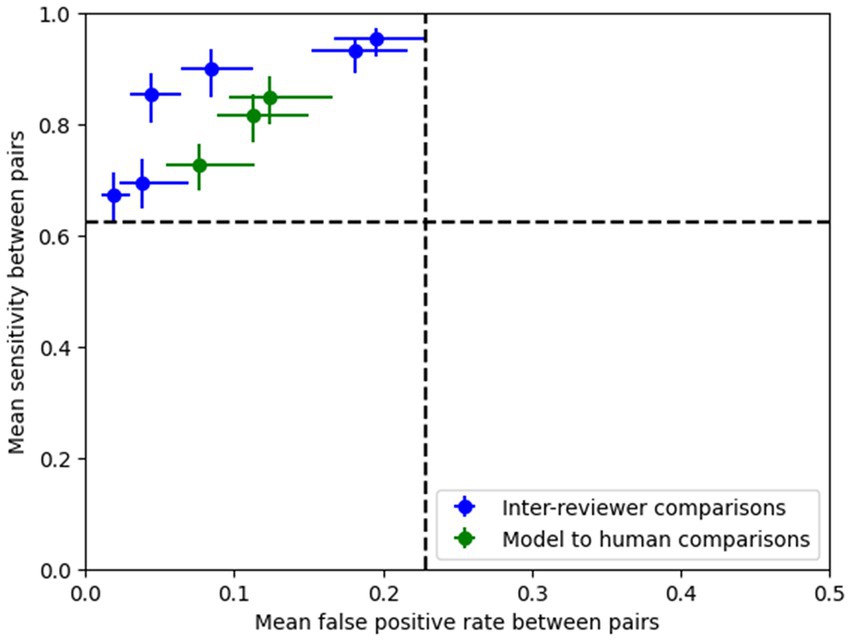
Figure 5. Pairwise sensitivity and false positive rate comparisons show that the model’s performance (operating point shown here is 0.8) lies within the 95% confidence intervals (dotted lines) of the expert pairs, thus demonstrating that the ESC model’s performance is non-inferior compared to the experts according to the methods outlined in Scheuer et al. (2017).
3.2.3. Classification agreement on iEEG records
Agreement between the ESC model and reviewers was studied at the iEEG record level (Table 5). As described in Section 2, if the reviewer annotated any of the channels in the iEEG record as seizure, the record was assigned the electrographic seizure annotation. Similarly, if the model predicted any of the channels as an electrographic seizure (at the selected operating points shown in Table 5), the model’s classification of the iEEG record would be to the electrographic seizure class. Otherwise, it would be to the non-seizure class. An operating point of 0.8 was selected for iEEG record-level classification, as computing the iEEG record level scores by combining individual channel scores would lead to high false positive rates since only one channel needs to be classified as a seizure for the entire multi-channel iEEG record to be classified as a seizure. The table also shows ESC record level classifications for an operating point of 0.9. Supplementary Figure S2 shows the effects of changing the operating point on the iEEG record-level classification agreements between each reviewer and the trained ESC model. As expected, at lower operating points, seizure class agreements are low and non-seizure class agreements are high. The overall agreements, however, are within a relatively narrow range (85%–90%).
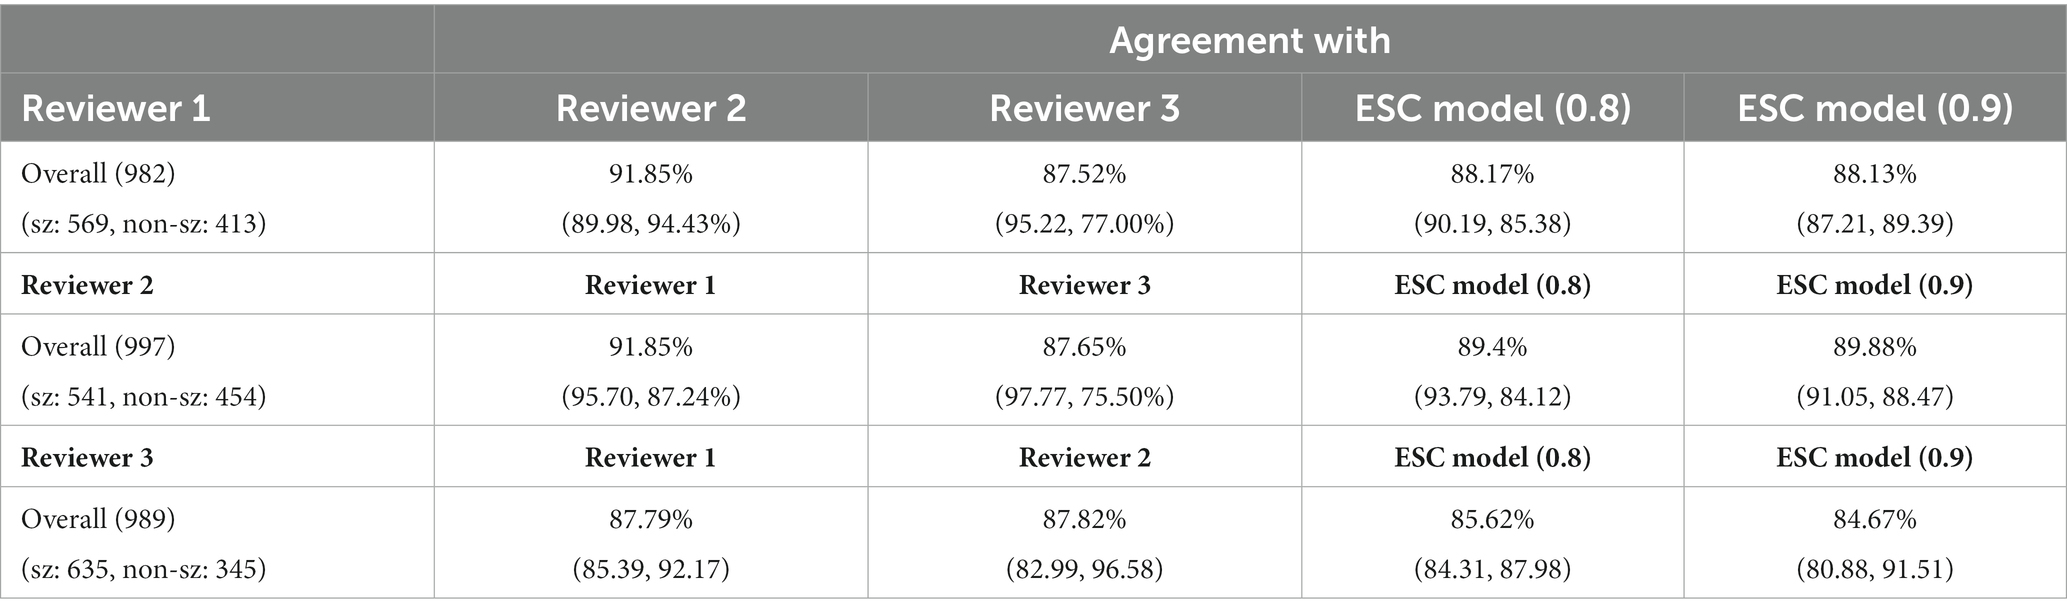
Table 5. iEEG record classification agreement between reviewers and ESC model at 2 operating points (0.8 and 0.9).
3.3. Seizure onset detection model training and validation
3.3.1. Comparing seizure onset prediction performance with augmented data vs. original dataset used for training
As described in Section 2, 4,859 iEEG channels annotated with seizure onset times were augmented by time-shifting the time-series waveforms and duplicating waveforms at the start of the iEEG channels. One of the 5 trained ESC models (the trained ESC model from 1st cross validation fold was randomly chosen) was fine-tuned using the augmented and original datasets and 5-fold cross-validation. The median absolute error on the validation dataset (i.e., iEEG channels from 20% of the patients not used for training in each of the 5 cross-validation folds) is shown in Figure 5 (top). The lowest median absolute error on the validation dataset for each of the 5 folds is shown in Table 6. Across the 5 training folds, the average median absolute error with the augmented data was significantly better (p < 0.05, paired t-test) when compared to training with only the original dataset. Overall, training with the augmented dataset led to an average median absolute error of 3.12 s compared to 4.4 s with the original dataset. Data augmentation improved the model’s prediction accuracy by 1.3 s.
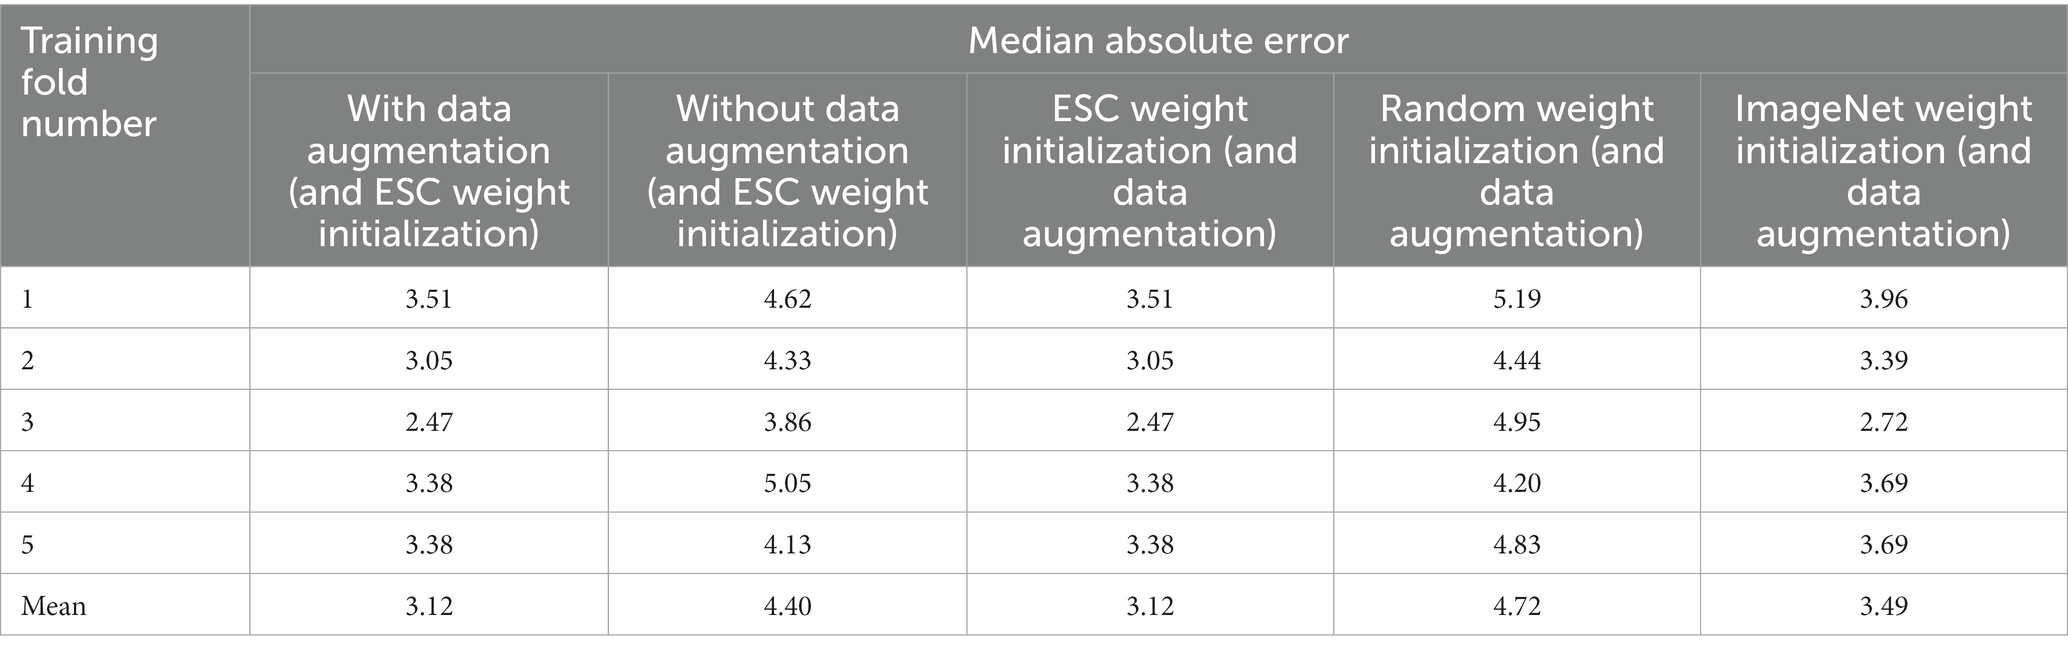
Table 6. Median absolute error of the trained seizure onset detection model in each of the five training folds with and without augmented data used for training, and by training using different types of model weights as starting point.
In addition to the median absolute error, mean absolute error and root mean squared error also improved when training was performed with the augmented dataset [Figure 6 (top), right panel].
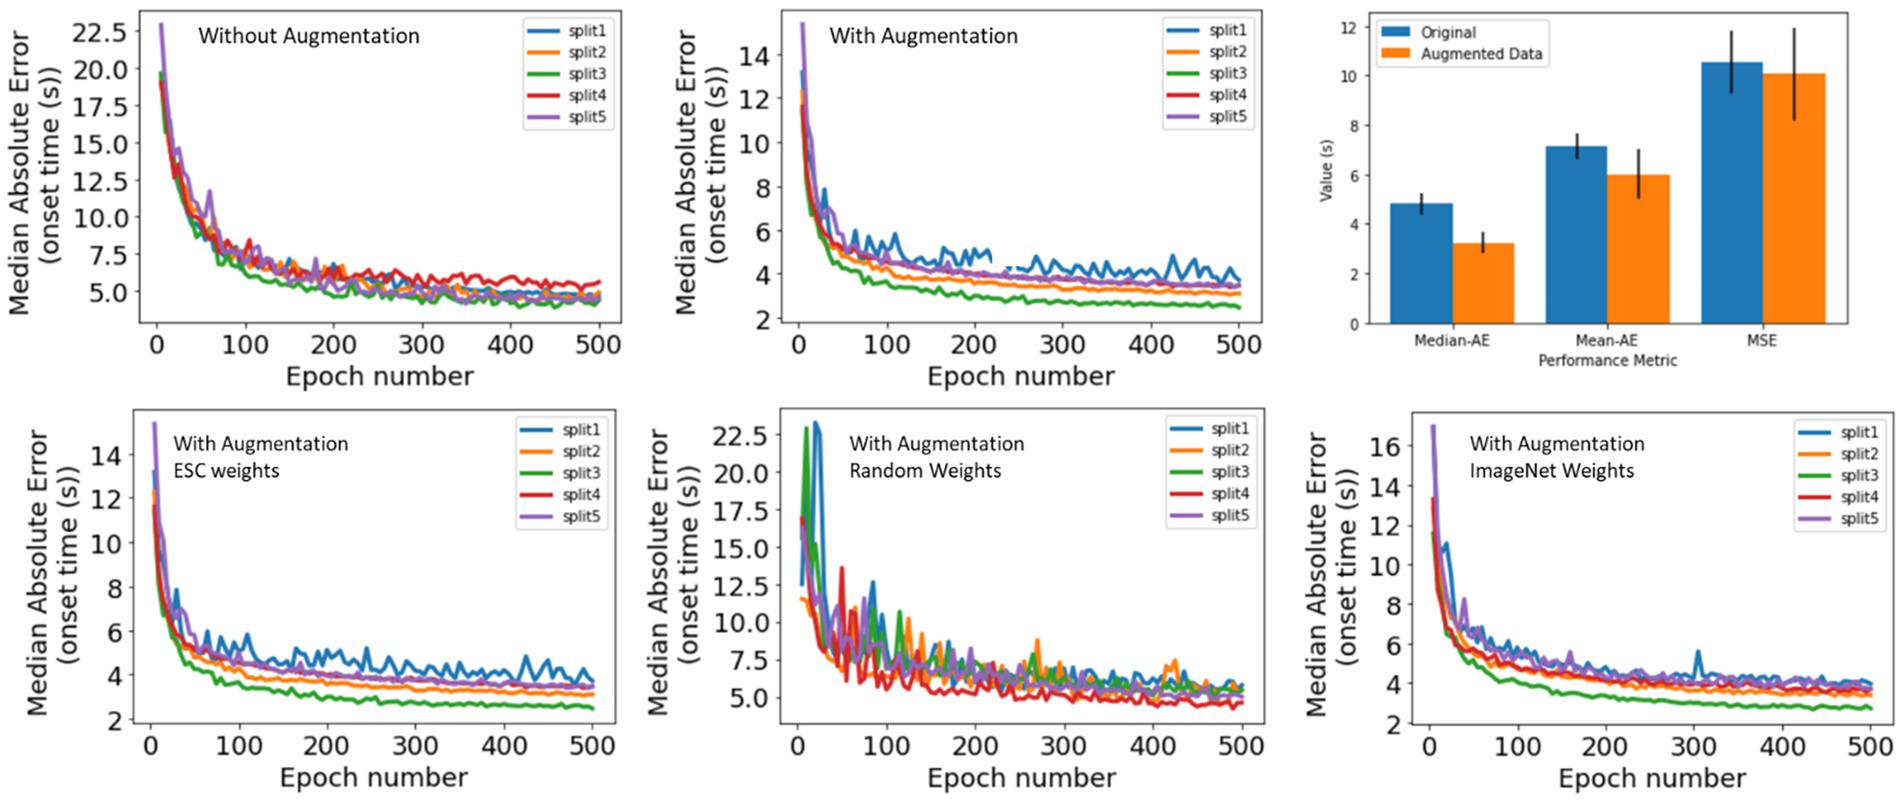
Figure 6. (Top) Seizure Onset Detection (SOD) model validation performance vs. training epochs on original (left) and augmented (center) datasets. Right panel shows median absolute error, mean absolute error, and root mean squared error. In all cases, better model performance was observed when model training was performed on the original + augmented datasets. (Bottom) Seizure Onset Detection model validation performance vs. training epochs observed by fine-tuning the electrographic seizure classifier (left), a ResNet50 model with random weight initialization (center), and a ResNet50 model with weight learned by training on the ImageNet dataset (right).
3.3.2. Comparing seizure onset detection performance with different initial model weights
The Seizure Onset Detection (SOD) model was developed by fine-tuning the weights of the ESC model as described in Section 2. For comparison, a ResNet50 model with weights learned from training on the ImageNet dataset (Deng et al., 2009), and random weight initialization were also trained on the augmented datasets to assess if the ESC model initialization contributed to improvements in model performance. Validation errors from the three types of model initialization are shown in Figure 6 (bottom) and Table 6. As hypothesized, transfer-learning using the ResNet-50 model with initial weights from training on a relevant training task (ESC model) was significantly better (p < 0.05, paired t-test) compared to training with random weight initialization and ImageNet weight initialization. Specifically, an overall improvement in median absolute error of 1.6 s, and 0.4 s, respectively, was observed with ESC model weights compared to random and ImageNet weights. Figure 7 (top) shows three example seizure onset detections by a SOD model trained using the augmented dataset using ESC model weights as the starting point for training.
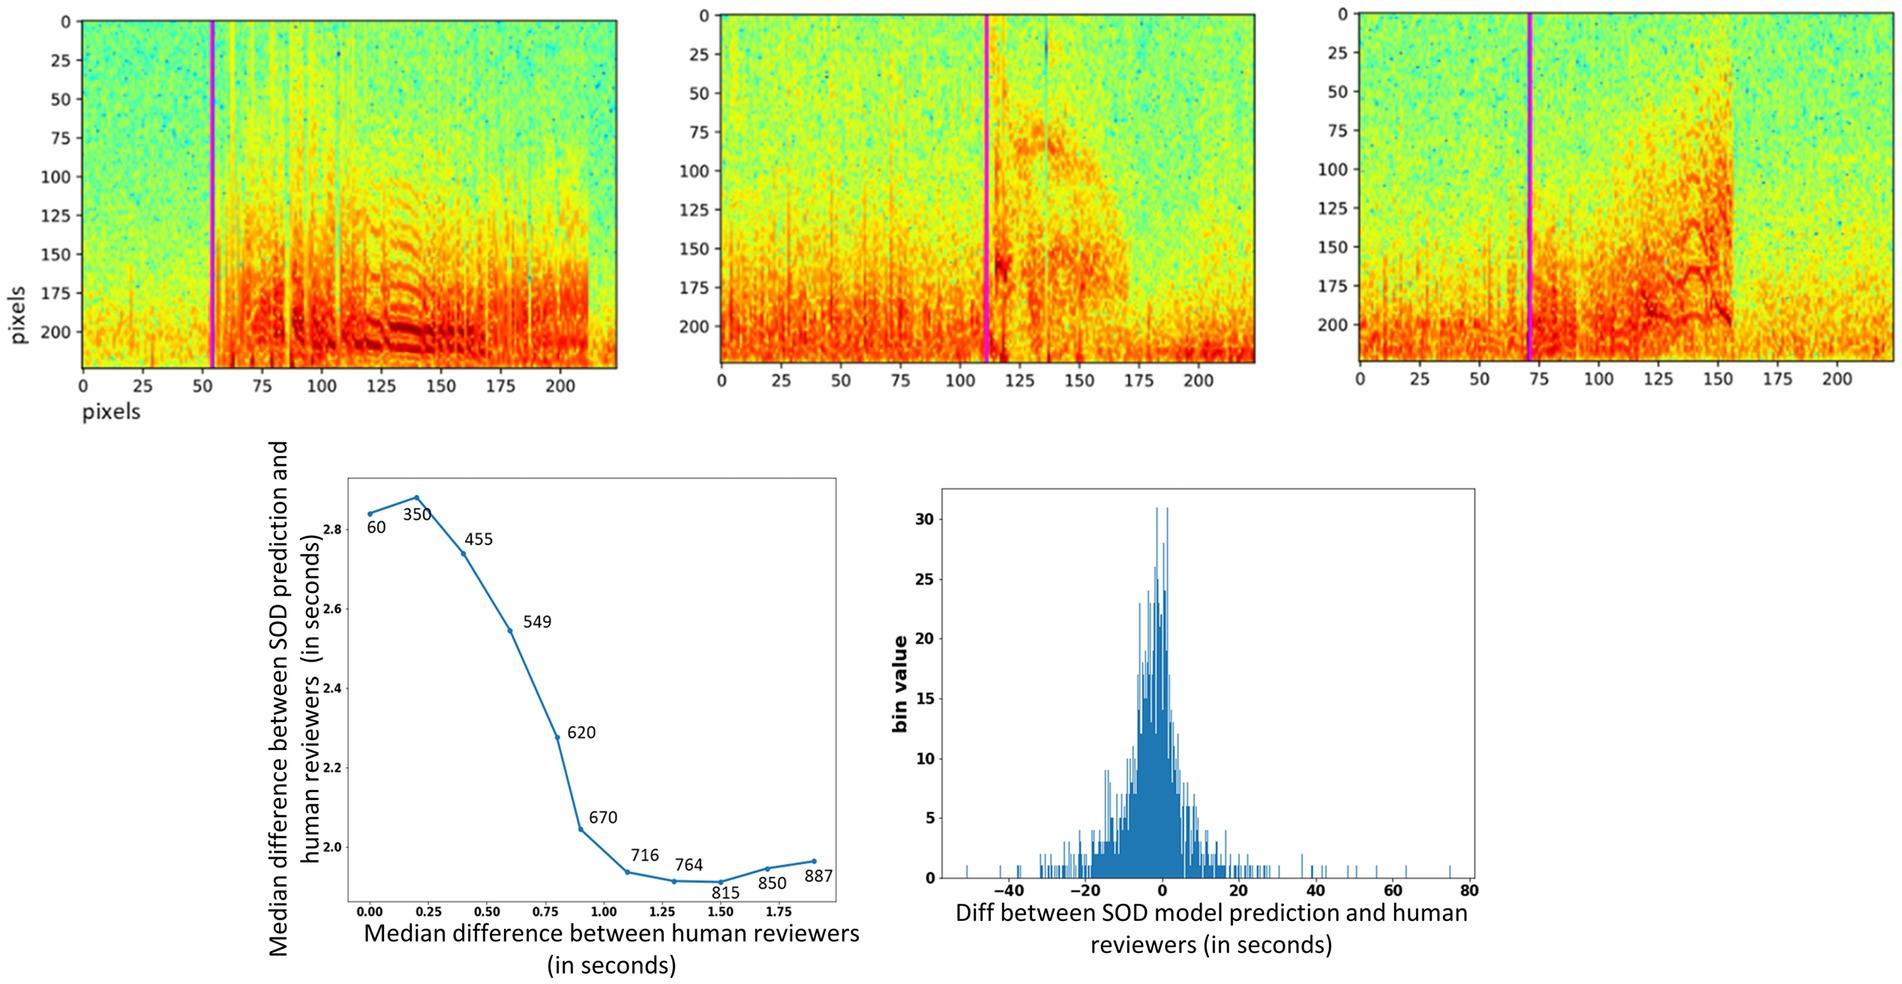
Figure 7. (Top) Seizure onset time prediction in 3 example iEEG channels. The pink vertical line shows the SOD model’s predicted onset time in each of the three spectrogram images. (Bottom) Left panel: median difference in onset times between SOD model and human reviewer (y-axis) vs. median difference in onset times between reviewers (x-axis). Numbers above data points show the number of iEEG channels used to compute the difference. Right panel: Histogram of difference between trained SOD model vs. human reviewer in seconds.
3.3.3. Performance of the trained SOD prediction model on reviewer-annotated dataset
As described in Section 2, reviewers were asked to annotate seizure onset times on electrographic seizure iEEG channels. Table 7 shows the number of seizure onset times annotated by each of the three reviewers. A small percentage (8.3%, 8.5%, and 11.4%) of the electrographic seizures were not annotated with a valid onset time because the reviewers concluded that the electrographic seizure began before the start of the captured iEEG file.
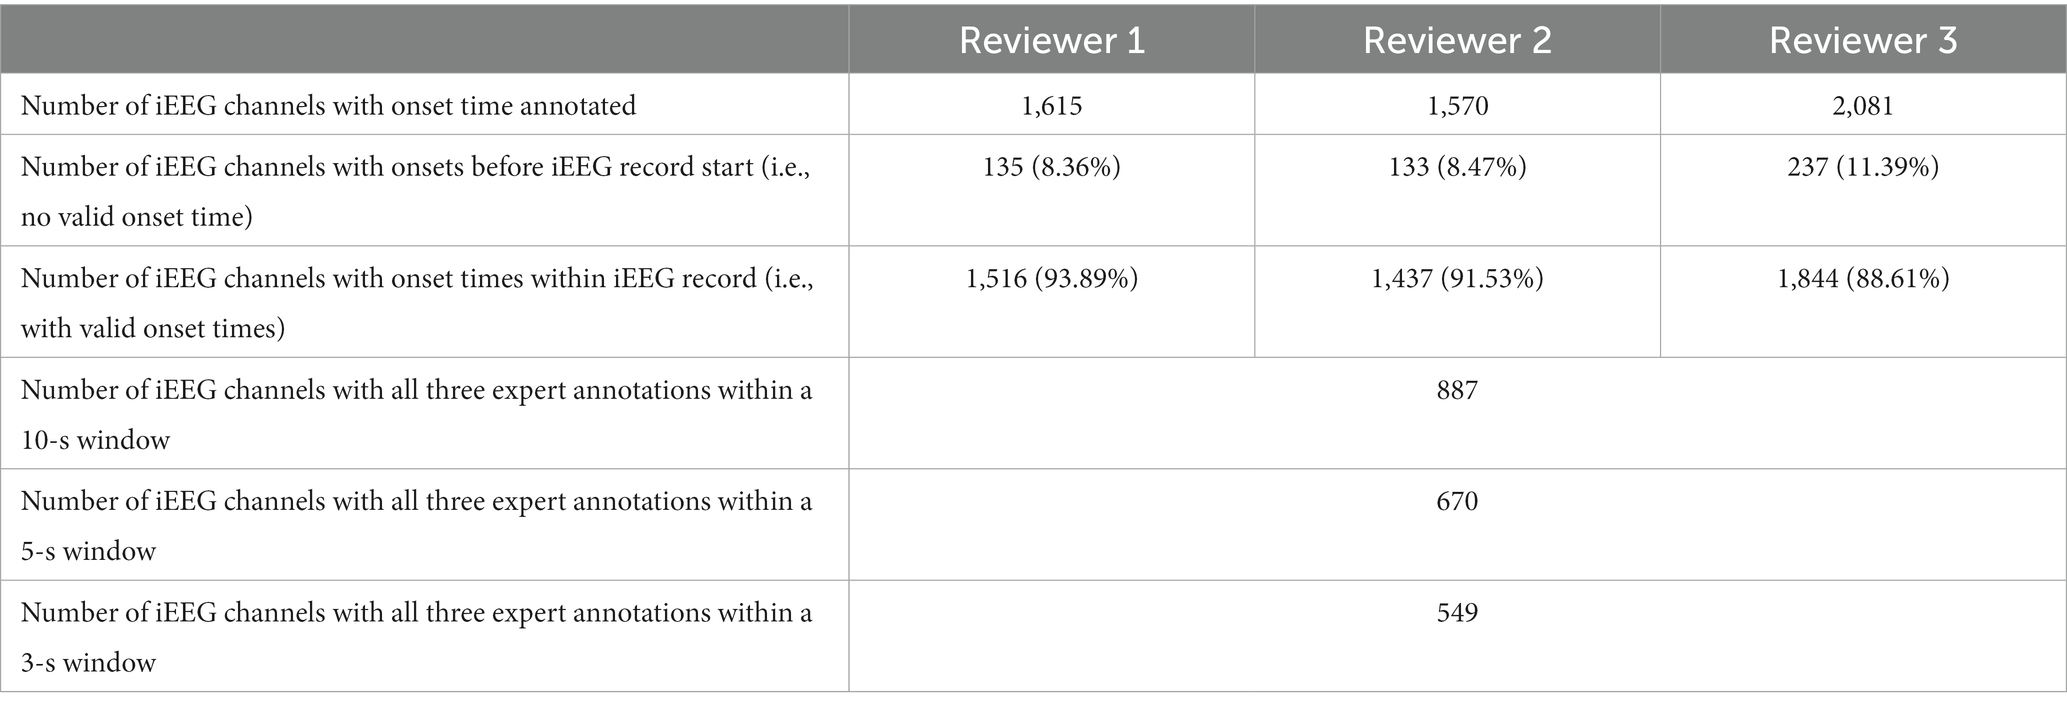
Table 7. Number of seizure onset times annotated by the three reviewers.
On iEEG channels where all three reviewers agreed that the onset time was within a 0.25 s window, the SOD model’s median absolute error was 2.9 s [Figure 7 (bottom)], and on iEEG channels when all three reviewers agreed that the onset time was within a 1.5 s window, the SOD model’s median absolute error was 1.7 s.
Across all iEEG records, the median absolute error between the SOD model and the reviewer annotations was 3.4 s. In comparison, a trivial model that uses the neurostimulator-detected episode start time as the seizure onset time, had a median absolute error of 8.3 s. Finally, a histogram of differences between SOD and reviewer scores [Figure 7 (bottom), right panel] shows that the model predictions were not biased in any one direction. That is, number of positive errors (or model prediction time > reviewer annotated onset time) and number of negative errors were comparable.
4. Discussion
This paper significantly adds to existing literature on leveraging deep learning and machine learning (AI) techniques for facilitating data review in epilepsy. First, it shows that AI models can be trained with the same level of iEEG seizure/non-seizure classification performance as board certified neurology and clinical neurophysiology and epilepsy experts. Second, it quantifies expert agreement levels with each other and shows that experts tend to agree more on iEEG records captured on leads implanted in the MTL regions compared to neocortical regions. Similarly, the trained electrographic seizure models also agreed more with reviewers on MTL channels compared to neocortical channels. Finally, it demonstrates how a second AI model can be trained on a related task of finding seizure onset times using a relatively small, labeled dataset by leveraging transfer learning (LeCun et al., 2015) of features learned by the first AI model, and through data augmentation techniques.
Overall, the Electrographic Seizure Classifier model’s agreement with the expert iEEG reviewers was on-par with experts’ agreement among themselves. This was particularly striking in the analysis of model prediction certainty vs. combined expert prediction certainty. On iEEG channels in which all three experts were in complete agreement, the model’s electrographic seizure and non-seizure prediction probabilities were also very high. For instance, on the 1,808 channels in which all three experts agreed on the non-seizure class, the ESC model agreed that the probability of a seizure on that channel was low, in the range of [0.12–0.19]. Similarly, on 1,417 channels in which all three experts agreed on the seizure class, the ESC model agreed that the probability of a seizure on that channel was high, in the range of [0.92–0.95]. When the experts were not in complete agreement, the ESC model’s probabilities reflected the disagreement among experts. For instance, for channels classified as a seizure by only one of three experts, the ESC model’s predicted seizure probability was in the range of [0.32–0.42], and when two of three experts classified channels as a seizure, the ESC model’s seizure probability was in the range of [0.61–0.70]. This shows that the trained model’s learned iEEG features and decision criteria for classifying iEEG records might be similar to those learned by human reviewers.
Just as human reviewers exhibit disagreement and uncertainty about seizure and non-seizure classifications, so does the ESC model, as reflected in its prediction probabilities. Hence, when building clinical applications using the Electrographic Seizure Classifier model (Barry et al., 2021), it may be useful to display model certainty scores, or seizure probability values, in addition to the predicted seizure or non-seizure class. This would allow a physician making use of the ESC model to manually review only those iEEG records where the model’s classification certainty is low and rely on the model’s classifications when the model’s confidence is high. Even though these results are very encouraging and demonstrate that the trained Electrographic Seizure Classifier’s performance matches that of trained experts, it should be noted that only three reviewers were recruited for labeling the ~1,000 test iEEG records. Resource and time constraints did not permit recruiting more experts or the review of a larger iEEG test dataset. Nevertheless, the clinical validation tests performed in this study demonstrate that the trained Electrographic Seizure Classifier model performs well enough to be practically useful in the clinical workflow. Continuous monitoring of the deployed model should be performed to ensure that the model performs well in different patient populations, and feedback received from users should be used to improve the model’s performance in the future.
The three reviewers’ had better agreement on seizure and non-seizure classifications on iEEG channels from MTL regions compared to neocortical regions. On average, expert iEEG classification agreement on MTL channels was 5.65% better than on neocortical channels. This difference may be partially due to homogeneity in MTL seizure patterns across patients, with seizure onsets frequently starting with either hypersynchronous spiking activity or low voltage fast activity. Neocortical seizures, on the other hand, tend to be more heterogeneous across patients (Spencer et al., 1992; Lee et al., 2000; Perucca et al., 2014). Similar to experts, the trained ESC models also had better classification performance on MTL vs. neocortical channels (95.48% vs. 88.46%). Overall, the ESC model’s classification performance was 7% better on MTL leads compared to neocortical leads. Training data for the ESC models consisted of 44% MTL patients, and 56% neocortical patients (Barry et al., 2021). Hence, there was no bias in ESC model training which could have possibly explained the performance differences in the two patient populations. One way to improve the model performance in neocortical patients could be to train a model specifically for the neocortical patient population, so that feature learning can be performed exclusively for this patient group.
Model operating point is an important parameter that needs to be selected based on the application of interest and can have a significant impact on the success of the clinical application (Jordan and Mitchell, 2015). In this paper, a few different values of model operating points were explored and, in general, a higher operating point of 0.8 led to a slightly better overall classification performance (93.19%) than the default value of 0.5 (92.52%). However, the two different operating points had a substantial impact on class-specific performances, with a higher operating point of 0.8 identifying 95.4% of non-seizure iEEG channels annotated by the experts, and a lower operating point of 0.5 identifying 95.2% of seizure iEEG channels. Hence, for problems requiring higher seizure class specificity (i.e., true positive rate), a higher operating point must be chosen, and a lower operating point chosen for problems requiring higher seizure class sensitivity (i.e., true negative rate).
No difference was seen between the ESC model’s classification performance on iEEG data captured with the two different models of the RNS Neurostimulator (RNS-300 M vs. RNS-320), which shows that the ESC model’s performance is robust across neurostimulator models. However, model performance monitoring tests should be performed periodically to ensure sustained performance levels on data captured with future new releases of the RNS System. If performance degrades in the future, it could suggest data drift and may require re-training the ESC models with iEEG data captured from the newer RNS System models.
Overall, iEEG record-level agreements between experts and the trained ESC models were similar to iEEG channel-level agreements (87.73% at a model operating point of 0.5, and 87.56% at a model operating point of 0.9). For an application to count the number of electrographic seizures, it may not be relevant to know which channel in the iEEG record contains seizures. Instead, it may be sufficient to classify the entire multi-channel iEEG record as seizure or non-seizure. For example, counts of electrographic seizure iEEG records captured after a change in epilepsy treatment (such as a change in an antiseizure medication) can be compared to counts before the change, to assess if the change had a favorable (or unfavorable) impact on the patient. Such a measure may be used in conjunction with other recently identified iEEG biomarkers (Skarpaas et al., 2018; Desai et al., 2019a; Khambhati et al., 2021; Sun et al., 2021) to efficiently supplement patient self-reports of clinical outcomes.
Manually annotating seizure onset times can be very time-consuming, even more so than annotating iEEG activity as seizure or non-seizure. This is because identifying the seizure onset times in iEEG channels requires zooming into the iEEG activity at multiple time and frequency scales, and thoughtful consideration of when seizure activity begins (Spencer et al., 1992; Lee et al., 2000; Perucca et al., 2014; Nune et al., 2019). In our previous study (Barry et al., 2021), an unsupervised clustering method was used for facilitating manual labeling of iEEG channels as seizure and non-seizure. With the clustering tool, 138,000 iEEGs records were annotated in roughly 320 h (Barry et al., 2021). A similar approach cannot be taken for labeling seizure onset times, since seizure onset times relative to the start of the iEEG record can vary substantially from one iEEG record to another, even within individual patients, and hence a clustering method would simply not work for seizure onset labeling. As an alternative, transfer learning and data augmentation techniques were explored for training a seizure onset detector with a relatively small, labeled dataset. Accordingly, seizure onset times were manually annotated in 4,859 seizure iEEG channels. Time-shifting of the signal within the iEEG channels resulted in a synthesized augmented dataset consisting of 30,768 iEEG channels. The RNS System is generally configured to store 90-s iEEG records with 60 s of pre-trigger activity and 30 s of post-trigger activity. Long episode iEEG records are usually triggered 30 s after a detection episode begins (i.e., long episode duration configured to 30 s). This contributes to a bias in the dataset for seizure onsets to occur around 30 s after the record start. To mitigate this bias and enlarge the dataset, time-shifting augmentation was performed. Consequently, Seizure Onset Detection (SOD) models trained on the original plus augmented dataset had significantly (p < 0.05 paired t-test) better performance (3.12s median absolute error or MAE) than models trained on only the original dataset (4.4 s MAE).
The utility of using a model pre-trained on a relevant task to improve SOD performance was explored (LeCun et al., 2015; Desai et al., 2019b). To test our hypothesis that using a model pre-trained on a relevant task could offer performance boosts, three types of model weight initializations for the same ResNet50 architecture were performed when training the SOD model. The first model was initialized using ESC model weights from the relevant task, the second used randomly initialized weights, and the third was initialized using weights learned by training on the ImageNet dataset (Deng et al., 2009), which consists of over 14 million training examples from 1,000 classes. Even though the ImageNet weights were derived by training the ResNet50 model on a much larger dataset, over 100 times larger than the ESC training set, model performance was significantly better (p < 0.05, paired t-test) when transfer-learning was performed with ESC weights as the starting point. This demonstrates the importance of using task-relevant weight initializations when fine-tuning models with small, annotated datasets. Future model development for iEEG datasets collected from the RNS System and other neuromodulation devices could use the ESC models as starting-points for transfer learning (available for download for academic use at: https://dabi.loni.usc.edu/dsi/000012) and avoid the resource-intensive task of annotating large iEEG datasets. As an example, the ESC model demonstrated a classification accuracy of 70% on scalp EEG data in the TUH EEG dataset, which is a large publicly available collection of scalp EEG recordings (Sun and Morrell, 2014). This accuracy level is higher than chance level (50%), indicating that the ESC model has learned features that can be applied to EEG datasets captured using different devices and recording techniques. By fine-tuning the ESC model with labeled EEG examples from these other devices, it is likely that the model’s performance on those datasets would significantly improve. Alternatively, the ESC model can also be used as a feature extractor without additional fine-tuning. For instance, it has been utilized as a feature extractor to identify patients with similar intracranial EEG (iEEG) seizures in the context of the RNS System (Nune et al., 2019).
The combined ESC and SOD models could be of great assistance in several clinical scenarios. The ESC model can identify the iEEG channels with electrographic seizures, and the SOD model can identify the seizure onset time. Since the goal of responsive stimulation is often to stimulate early in the electrographic seizure, information from the ESC and SOD models can potentially be combined to select the neurostimulator detection settings to best detect the iEEG patterns that indicate the seizure onset. Another potential scenario is to use these models to help physicians as they determine whether a patient might benefit from an epilepsy resection or ablation procedure (King-Stephens et al., 2015). The ESC model can be used to determine whether the seizures are unilateral or bilateral. If seizures are seen bilaterally, the SOD model can determine the hemisphere with the earliest seizure onset. If the patient consistently has seizures originating only from one hemisphere, or if the onset is consistently earlier in one hemisphere than the other, then the patient could be a candidate for an ablation or resection of that seizure onset zone (King-Stephens et al., 2015).
In summary, the work in this paper aims to clinically validate an Electrographic Seizure Classifier (ESC) model (Barry et al., 2021) and train a second Seizure Onset Detection (SOD) model using a relatively small, labeled dataset by leveraging features learned by the first model. There are abundant opportunities for improving the performance of both the ESC and SOD models described in this paper. For example, transformer-based models which have recently shown exceptional performance on tasks involving sequence data (Vaswani et al., 2017) may be a promising area to explore for iEEG data analysis. Nevertheless, clinical tools developed with the models presented in this paper could significantly improve epilepsy clinical workflows, particularly with the iEEG data review that is predominantly performed manually as of today. The ultimate goal is to provide physicians with information to assist them in their treatment of patients with challenging epilepsy.
Data availability statement
The data presented in the study are deposited in Data Archive Brain Initiative (DABI) at https://dabi.loni.usc.edu/dsi/000012.
Author contributions
SD led the study, performed analysis, and primarily wrote the paper. MA performed analysis presented in this study. WB annotated 4,859 iEEG channels used for training the seizure onset detection model. JK, SB, and CT annotated 1,000 iEEG records for clinical validation of the trained deep learning models. TT, CS, and MM helped with designing the experiments presented in this manuscript and provided feedback on the writing. MM was involved in selecting the validation data annotated by the three expert reviewers. All authors contributed to the article and approved the submitted version.
Conflict of interest
SD, WB, TT, CS, MM are employees of NeuroPace. MA was an intern at NeuroPace when performing analysis presented in this manuscript. JK, SB, and CT were consultants at NeuroPace when they independently annotated 1,000 iEEG records.
Publisher’s note
All claims expressed in this article are solely those of the authors and do not necessarily represent those of their affiliated organizations, or those of the publisher, the editors and the reviewers. Any product that may be evaluated in this article, or claim that may be made by its manufacturer, is not guaranteed or endorsed by the publisher.
Supplementary material
The Supplementary material for this article can be found online at: https://www.frontiersin.org/articles/10.3389/fnins.2023.1156838/full#supplementary-material
References
Acharya, U. R., Oh, S. L., Hagiwara, Y., Tan, J. H., and Adeli, H. (2018). Deep convolutional neural network for the automated detection and diagnosis of seizure using EEG signals. Comput. Biol. Med. 100, 270–278. doi: 10.1016/j.compbiomed.2017.09.017
Ansari, A. H., Cherian, P. J., Caicedo, A., Naulaers, G., de Vos, M., and van Huffel, S. (2019). Neonatal seizure detection using deep convolutional neural networks. Int. J. Neural Syst. 29:1850011. doi: 10.1142/S0129065718500119
Arcot Desai, S., Tcheng, T., and Morrell, M. (2022). Non-linear Embedding Methods for Identifying Similar Brain Activity in 1 Million iEEG Records Captured From 256 RNS System Patients. Front. Big Data 5:840508. doi: 10.3389/fdata.2022.840508
Barry, W., Arcot Desai, S., Tcheng, T. K., and Morrell, M. J. (2021). A high accuracy electrographic seizure classifier trained using semi-supervised labeling applied to a large spectrogram dataset. Front. Neurosci. 15:697. doi: 10.3389/fnins.2021.667373
Benjamens, S., Dhunnoo, P., and Meskó, B. (2020). The state of artificial intelligence-based FDA-approved medical devices and algorithms: an online database. NPJ Digit. Med. 3:118. doi: 10.1038/s41746-020-00324-0
Brown, T., Mann, B., Ryder, N., Subbiah, M., Kaplan, J. D., Dhariwal, P., et al. (2020). Language models are few-shot learners. Adv. Neural Inf. Proces. Syst. 33, 1877–1901.
Chen, Z., and Huang, X. (2017). End-to-end learning for lane keeping of self-driving cars. In 2017 IEEE Intelligent Vehicles symposium (IV), IEEE.
Dalic, L., and Cook, M. J. (2016). Managing drug-resistant epilepsy: challenges and solutions. Neuropsychiatr. Dis. Treat. 12, 2605–2616. doi: 10.2147/NDT.S84852
Deng, J., Dong, W., Socher, R., Li, L. J., Li, K., and Fei-Fei, L. (2009). Imagenet: a large-scale hierarchical image database. In 2009 IEEE Conference on Computer Vision and Pattern Recognition, IEEE.
Desai, S. A., Tcheng, T. K., and Morrell, M. J. (2019a). Quantitative electrocorticographic biomarkers of clinical outcomes in mesial temporal lobe epileptic patients treated with the RNS® system. Clin. Neurophysiol. 130, 1364–1374. doi: 10.1016/j.clinph.2019.05.017
Desai, S. A., Tcheng, T., and Morrell, M. (2019b). Transfer-learning for differentiating epileptic patients who respond to treatment based on chronic ambulatory ECoG data. In 2019 9th International IEEE/EMBS Conference on Neural Engineering (NER), IEEE.
Haas, S. M., Frei, M. G., and Osorio, I. (2007). Strategies for adapting automated seizure detection algorithms. Med. Eng. Phys. 29, 895–909. doi: 10.1016/j.medengphy.2006.10.003
Halford, J., Shiau, D., Desrochers, J. A., Kolls, B. J., Dean, B. C., Waters, C. G., et al. (2015). Inter-rater agreement on identification of electrographic seizures and periodic discharges in ICU EEG recordings. Clin. Neurophysiol. 126, 1661–1669. doi: 10.1016/j.clinph.2014.11.008
Hoppe, C., Poepel, A., and Elger, C. E. (2007). Epilepsy: accuracy of patient seizure counts. Arch. Neurol. 64, 1595–1599. doi: 10.1001/archneur.64.11.1595
Jarosiewicz, B., and Morrell, M. (2021). The RNS system: brain-responsive neurostimulation for the treatment of epilepsy. Expert Rev. Med. Devices 18, 129–138. doi: 10.1080/17434440.2019.1683445
Jordan, M. I., and Mitchell, T. M. (2015). Machine learning: trends, perspectives, and prospects. Science 349, 255–260. doi: 10.1126/science.aaa8415
Khambhati, A. N., Shafi, A., Rao, V. R., and Chang, E. F. (2021). Long-term brain network reorganization predicts responsive neurostimulation outcomes for focal epilepsy. Sci. Transl. Med. 13:eabf6588. doi: 10.1126/scitranslmed.abf6588
King-Stephens, D., Mirro, E., Weber, P. B., Laxer, K. D., van Ness, P. C., Salanova, V., et al. (2015). Lateralization of mesial temporal lobe epilepsy with chronic ambulatory electrocorticography. Epilepsia 56, 959–967. doi: 10.1111/epi.13010
Lee, S. A., Spencer, D. D., and Spencer, S. S. (2000). Intracranial EEG seizure-onset patterns in neocortical epilepsy. Epilepsia 41, 297–307. doi: 10.1111/j.1528-1157.2000.tb00159.x
Lundervold, A. S., and Lundervold, A. (2019). An overview of deep learning in medical imaging focusing on MRI. Z. Med. Phys. 29, 102–127. doi: 10.1016/j.zemedi.2018.11.002
Nair, D. R., Laxer, K. D., Weber, P. B., Murro, A. M., Park, Y. D., Barkley, G. L., et al. (2020). Nine-year prospective efficacy and safety of brain-responsive neurostimulation for focal epilepsy. Neurology 95, e1244–e1256. doi: 10.1212/WNL.0000000000010154
Nune, G., Arcot Desai, S., Razavi, B., Agostini, M. A., Bergey, G. K., Herekar, A. A., et al. (2019). Treatment of drug-resistant epilepsy in patients with periventricular nodular heterotopia using RNS® system: efficacy and description of chronic electrophysiological recordings. Clin. Neurophysiol. 130, 1196–1207. doi: 10.1016/j.clinph.2019.04.706
Onorati, F., Regalia, G., Caborni, C., LaFrance, W. C. Jr., Blum, A. S., Bidwell, J., et al. (2021). Prospective study of a multimodal convulsive seizure detection wearable system on pediatric and adult patients in the epilepsy monitoring unit. Front. Neurol. 12:1444. doi: 10.3389/fneur.2021.724904
Perucca, P., Dubeau, F., and Gotman, J. (2014). Intracranial electroencephalographic seizure-onset patterns: effect of underlying pathology. Brain 137, 183–196. doi: 10.1093/brain/awt299
Roy, Y., Banville, H., Albuquerque, I., Gramfort, A., Falk, T. H., and Faubert, J. (2019). Deep learning-based electroencephalography analysis: a systematic review. J. Neural Eng. 16:051001. doi: 10.1088/1741-2552/ab260c
Scheuer, M. L., Bagic, A., and Wilson, S. B. (2017). Spike detection: inter-reader agreement and a statistical turing test on a large data set. Clin. Neurophysiol. 128, 243–250. doi: 10.1016/j.clinph.2016.11.005
Scheuer, M. L., Wilson, S. B., Antony, A., Ghearing, G., Urban, A., and Bagić, A. I. (2021). Seizure detection: interreader agreement and detection algorithm assessments using a large dataset. J. Clin. Neurophysiol. 38, 439–447. doi: 10.1097/WNP.0000000000000709
Singer, U., Polyak, A., Hayes, T., Yin, X., An, J., Zhang, S., et al. (2022) Make-a-video: text-to-video generation without text-video data. arXiv [Preprint] arXiv:2209.14792.
Skarpaas, T. L., Tcheng, T. K., and Morrell, M. J. (2018). Clinical and electrocorticographic response to antiepileptic drugs in patients treated with responsive stimulation. Epilepsy Behav. 83, 192–200. doi: 10.1016/j.yebeh.2018.04.003
Spencer, S. S., Guimaraes, P., Katz, A., Kim, J., and Spencer, D. (1992). Morphological patterns of seizures recorded intracranially. Epilepsia 33, 537–545. doi: 10.1111/j.1528-1157.1992.tb01706.x
Sun, Y., Friedman, D., Dugan, P., Holmes, M., Wu, X., and Liu, A. (2021). Machine learning to classify relative seizure frequency from chronic electrocorticography. J. Clin. Neurophysiol. 40, 151–159. doi: 10.1097/WNP.0000000000000858
Sun, F. T., and Morrell, M. J. (2014). The RNS system: responsive cortical stimulation for the treatment of refractory partial epilepsy. Expert Rev. Med. Devices 11, 563–572. doi: 10.1586/17434440.2014.947274
Thodoroff, P., Pineau, J., and Lim, A. (2016). Learning robust features using deep learning for automatic seizure detection. In Machine Learning for Healthcare Conference, PMLR.
Ting, D. S. W., Cheung, C. Y. L., Lim, G., Tan, G. S. W., Quang, N. D., Gan, A., et al. (2017). Development and validation of a deep learning system for diabetic retinopathy and related eye diseases using retinal images from multiethnic populations with diabetes. JAMA 318, 2211–2223. doi: 10.1001/jama.2017.18152
Totakura, V., Vuribindi, B. R., and Reddy, E. M. (2021). Improved safety of self-driving car using voice recognition through CNN. In IOP Conference Series: Materials Science and Engineering, IOP Publishing.
Vaswani, A., Shazeer, N., Parmar, N., Uszkoreit, J., Jones, L., Gomez, A. N., et al. (2017). Attention is all you need. Advances in Neural Information Processing Systems 30 (NIPS 2017).
Weiss, K., Khoshgoftaar, T. M., and Wang, D. (2016). A survey of transfer learning. J. Big Data 3, 1–40. doi: 10.1186/s40537-016-0043-6
Keywords: seizure classification, big data, EEG, epilepsy, deep learning
Citation: Arcot Desai S, Afzal MF, Barry W, Kuo J, Benard S, Traner C, Tcheng T, Seale C and Morrell M (2023) Expert and deep learning model identification of iEEG seizures and seizure onset times. Front. Neurosci. 17:1156838. doi: 10.3389/fnins.2023.1156838
Edited by:
David B. Grayden, The University of Melbourne, AustraliaReviewed by:
Omid Kavehei, The University of Sydney, AustraliaJonas Duun-Henriksen, UNEEG Medical A/S, Denmark
Copyright © 2023 Arcot Desai, Afzal, Barry, Kuo, Benard, Traner, Tcheng, Seale and Morrell. This is an open-access article distributed under the terms of the Creative Commons Attribution License (CC BY). The use, distribution or reproduction in other forums is permitted, provided the original author(s) and the copyright owner(s) are credited and that the original publication in this journal is cited, in accordance with accepted academic practice. No use, distribution or reproduction is permitted which does not comply with these terms.
*Correspondence: Sharanya Arcot Desai, c2Rlc2FpQG5ldXJvcGFjZS5jb20=